Article

Super-Resolution Lensless Imaging of Cells Using Brownian Motion

1
School of Automation and Information Engineering, Xi’an University of Technology, Xi’an 710048, Shaanxi, China
2
School of Electrical and Electronic Engineering, Baoji University of Arts and Sciences, Baoji 721013, Shaanxi, China
*
Author to whom correspondence should be addressed.
Appl. Sci. 2019, 9(10), 2080; https://doi.org/10.3390/app9102080
Submission received: 23 April 2019 / Revised: 15 May 2019 / Accepted: 17 May 2019 / Published: 21 May 2019
(This article belongs to the Special Issue Advanced Ultrafast Imaging)

Abstract

:

Featured Application

This technique is mainly used in the field of lensless imaging of living cells.

Abstract

The lensless imaging technique, which integrates a microscope into a complementary metal oxide semiconductor (CMOS) digital image sensor, has become increasingly important for the miniaturization of biological microscope and cell detection equipment. However, limited by the pixel size of the CMOS image sensor (CIS), the resolution of a cell image without optical amplification is low. This is also a key defect with the lensless imaging technique, which has been studied by a many scholars. In this manuscript, we propose a method to improve the resolution of the cell images using the Brownian motion of living cells in liquid. A two-step algorithm of motion estimation for image registration is proposed. Then, the raw holographic images are reconstructed using normalized convolution super-resolution algorithm. The result shows that the effect of the collected cell image under the lensless imaging system is close to the effect of a 10× objective lens.

1. Introduction

Since the late 2000s, the lensless imaging technique based on CIS has enabled the creation of integrated microscopes on a chip scale [1,2]. Using this technique to collect cell micrographic images has become a novel technique in the cell analysis aspect of point-of-care testing (POCT), which plays an important role in biological research, disease diagnosis, and new drug development [3,4,5,6,7,8,9].
As lensless imaging is not focused and amplified by an optical lens, some problems are experienced, such as diffraction and low resolution, in the lensless imaging system. To solve the diffraction problem, two different methods have been researched. The Yang research group (California Institute of Technology) produced a near-diffraction-free cell imaging system by narrowing the distance between the cells and the photosensitive surface of CIS [10,11,12,13]. The Ozcan research group (University of California) irradiated cell samples using a near-coherent light source to obtain holographic images and reconstruct the focused images using an iterative algorithm [14,15,16,17,18,19,20,21,22].
The Yang research group made cells flow through a microchannel in the microfluidic chip and obtained sub-pixel displacement both horizontally and vertically, which can be used by multi-frame super-resolution reconstruction [23]. Due to the stable flow rate of the diluent in the microchannel, the motion of cells in the diluent is close to uniform motion in a straight line. The sub-pixel displacement of cells can be accurately estimated using the averaging method to accurately register multi-frame images of cells. However, Ozcan’s group used a multi-light source scheme to achieve sub-pixel displacement for multi-frame super-resolution reconstruction [24,25]. In this scheme, two frames of exposure have different positions of point light source, and the cell shadow image displays the corresponding displacement. The sub-pixel displacement achieving the multi-frame super-resolution can be obtained by adjusting the distance between the point light sources. These two methods can determine the inter-frame motion of the cell image using an external device, and then obtain multi-frame low resolution images with sub-pixel displacement information to synthetic a high resolution image. However, these additional devices inevitably increase the volume of the system. KyeoReh Lee propose a clever method to extend the numerical aperture by synthetic Fourier transform light scattering in in-line holographic microscope [26]. Combining the advantages of above methods, the key to improving the resolution is to capture the sub-pixel displacement information of cells images.
To improve the resolution of cell images, the multi-frame super-resolution algorithm is used. Because of the low signal-to-noise ratio (SNR) of the image captured by lensless imaging system, a robust algorithm is needed to suppress the noise. Among all kinds of multi-frame super-resolution algorithms, a non-linear interpolation algorithm, normalized convolution (normalize convolution) proposed by Kuntsson Group [27], performs strongly in anti-noise interference. However, the Kuntsson’s algorithm cannot be extended to the edge of the image. Subsequently, Pham [28] proposed a robust normalized convolution algorithm based on tensor, which uses the Gaussian kernel function to represent the size and direction of the neighborhood.
The literature shows that all tiny objects make Brownian motion in fluid, and the cells are no exception in liquid [29]. According to the characteristics of Brownian motion direction and random displacement, we present a super-resolution method for a lensless imaging system based on Brownian motion. Using the inherent Brownian motion, the super-resolution of cell images in a lensless system can be realized without additional devices, such as an injection pump and a matrix light source. To ensure that the idea could be realized, we used an optical microscope to observe the direction and velocity of cells undergoing Brownian motion. We found that the cells adhere to Brownian motion, and the small direction of motion displacement was random, which is particularly suitable for a multi-frame super-resolution algorithm. In this manuscript, we propose a two-step motion estimation algorithm for performance image registration and a convolution normalization algorithm to conduct super-resolution reconstruction. The specific method is described below.

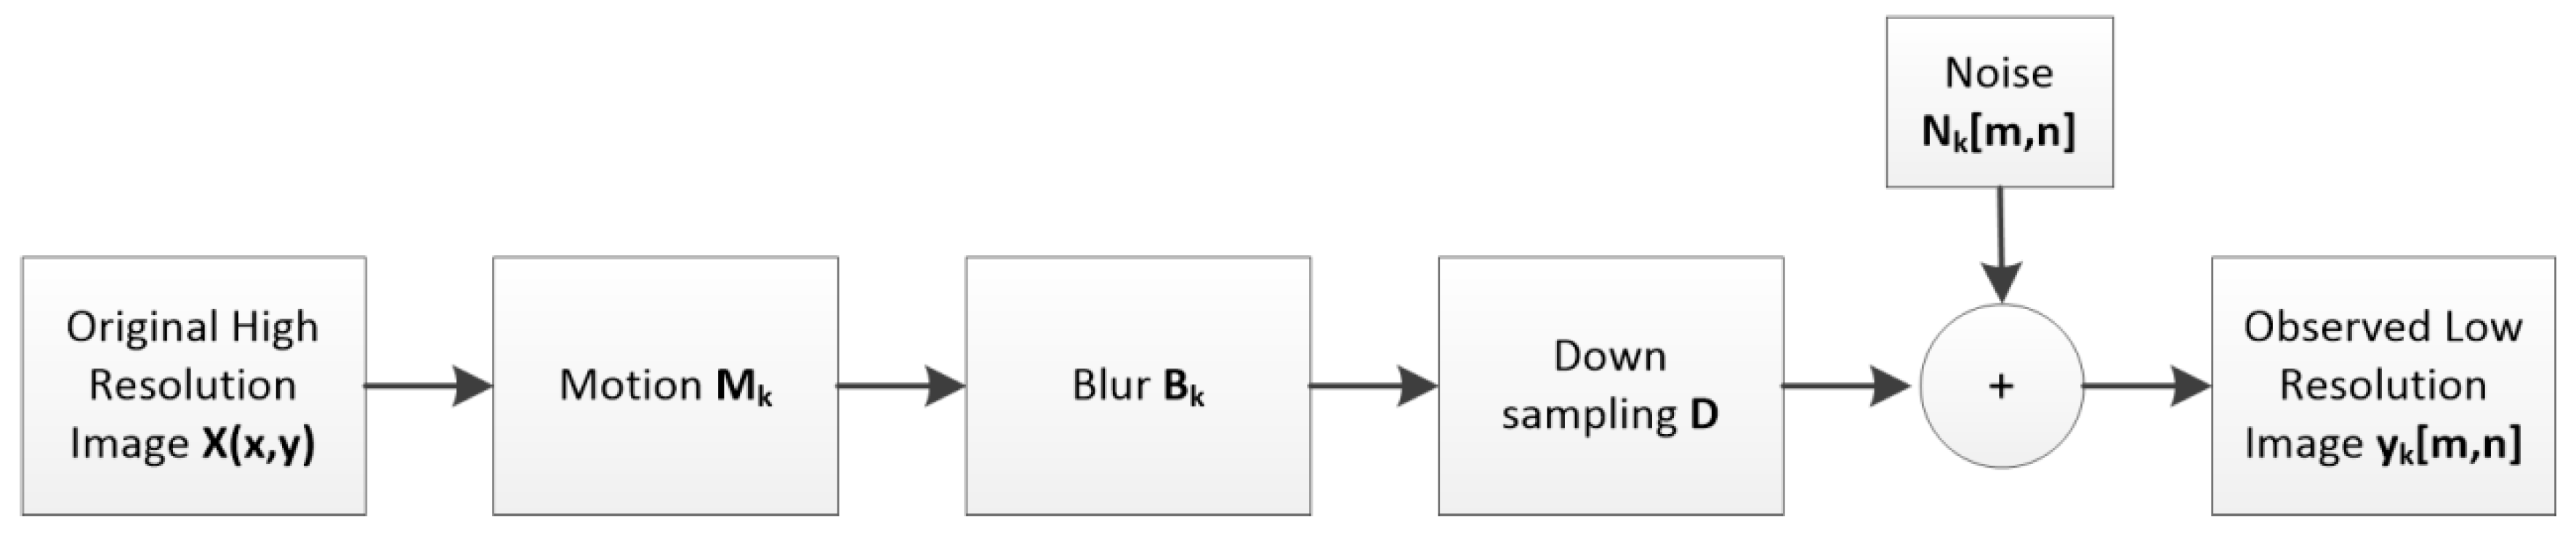
2. Materials and Methods

In this study, the observation window of the microfluidic chip located above the CIS was used to collect the multi-frame images of blood cells. The diluted blood was injected into the microfluidic chip with a syringe, and the diluent flow in the observation window was stopped for a period of time. Cell images can only be acquired by the Brownian motion of the cells suspended in the diluent. Due to the large volume of cells, cells basically moved in a balanced position, the displacement was small, and the speed was slow. In this case, the motion blur of the image was not serious during the exposure of 400 ms, which was beneficial for high-precision image registration.
The Brownian motion of cells was used to determine the sub-pixel displacement. The direction and speed of the motion were random. It was necessary to use multi-frame motion estimation to complete the image registration. In this study, the blind estimation method was used to estimate the cell displacement between two frames. First, the target detection algorithm was used to capture the cell position in the field of view (FOV) region. According to the system structure shown in Figure 1, due to the diffraction, the size of the cell diffraction image was four times larger than the focused cell image. There were several cells in a FOV, and every cell was independent, which is different from the super-resolution displacement based on the light source. In the whole image, only cells are displaced; the background is not. This issue can be solved by segmenting the cell and its background region. Here, the whole image was segmented according to each cell and its surrounding area, and the segmented area formed a sub-image with only one cell. High-resolution cell images could be obtained by separately attaining the super-resolution of these sub-images. This method is better for cell motion estimation. Without super-resolution of the whole image, the amount of data in image processing will be greatly reduced.
We describe the details of the algorithm that was used for the super-resolution in this manuscript. The most important problem we encountered in achieving multi-frame super-resolution was estimating the displacement of the cells. Here, we used the blind estimation method and Keren’s method to estimate the motion. We simultaneously needed to study the Brownian motion of the live cell and determine the mode of Brownian motion of the cell and the statistical distribution of the displacement.

2.1. Lensless Imaging System

To facilitate the acquisition of living cell images, we proposed a lensless imaging system that was constructed using a near coherent light source, CIS, and microfluidic chip. The overall structure of the system is shown in Figure 1.
The near coherent light source was composed of a blue light emitting diode (LED) and a pinhole. The common 3 W blue-emitting LED was monochromatic, and the 100-μm-diameter pinhole ensured that the light through the pinhole was closer to the ideal point light source. The diffractive shadow image of the cell sample irradiated by this light source can reconstruct the focus image of the cell plane using the in-line holography technique. The microfluidic chip can ensure that the diffracted shadow of the cell sample injected by the injection pump is not aliasing on the surface of the image sensor. Simultaneously, microfluidic chips keep all cells in the same plane, which is more accurate than the cell counting plate. In the polydimethylsiloxane (PDMS) microfluidic chip, the height of the observation window was 30 μm, which means that the cells were close to the surface of the CIS without affecting the movement of the cell in the plane direction. A grayscale CIS (Aptina MT9P031, Micron Technology, Boise, ID, USA) was used to obtain the holography images of cells. The pixel size of the CIS was 2.2 μm, the effective pixel size was 2592 H × 1944 V (5.7 mm × 4.2 mm), and the imaging area reached ~24.4 mm2.
In the lensless system, we continuously collected the shadow images of the cells in the observation window. In the multi-frame image, the motion direction of each cell was different due to the Brownian motion of the cells, and the super-resolution reconstruction could not be performed on the whole image. Therefore, only local multi-frame super-resolution could be applied to each cell image. To find a suitable super-resolution algorithm, we first needed to study the Brownian motion of cells. We observed the Brownian motion of cells under light microscopy, and obtained the statistical parameters of Brownian motion, which laid the foundation for selecting the motion estimation algorithm.

2.2. Shifting Parameters of Brownian Motion of Cells

To determine the displacement parameters of cell Brownian motion, a 10× objective lens was used to obtain multi-frame images of the cells. When the cells were suspended in the diluent blood, the motion estimation algorithm was used to estimate the displacement of cells undergoing Brownian motion. If the shape of a living cell is close to a circle, the rotation angle is small in two frames. To accurately observe the Brownian motion of cell movement, we used an inverted biologic microscope (MI 52, Mshot, Guangzhou, China) to capture the movement of living cells in the microfluidic chip. The whole blood was diluted by phosphate-buffered saline (PBS) to 1:10,000 and then injected into the microchannel of the microfluidic chip. After the fluid was stabilized in the microchannel, it was observed under a microscope with a 10× objective, and the video was captured using a microscope camera (MS60, Mshot, Guangzhou, China) for post-processing. We used MATLAB (Version: 2016a, Natick, MA, USA) to identify the centroid of each cell, which used a threshold segmentation algorithm for the first frame of the captured video, and to segment the image within 200 pixels centered on the location of the centroid of each cell. All subsequent frames were segmented using this centroid position. Under a 10× objective lens, the cell size was about 40 × 40 pixels and the Brownian motion did not exceed 70 pixels, so the selection of 200 pixels ensured that the cell would not move out of this range in a short period of time. The video capture frame rate was 14 frames per second (fps), and we used a 10 s video to estimate the distance of movement for each cell. The motion was estimated using the frequency-domain motion estimation algorithm in a 140-frame image of the same cell in the video sequence, and the cell motion vector was obtained. This frequency domain motion estimation algorithm is not accurate and is generally used for rough estimation, which can accurately estimate the whole pixel displacement.
According to the above method, when the cells were subjected to Brownian movement, the circular blood cells did not rotate substantially but the translation was large. With an average translation distance of 30 pixels, the maximum value was 70. In a lensless system, the average displacement was three pixels, and the maximum value was seven pixels. Therefore, we proposed a two-step method for motion estimation. Specifically, we used the above-mentioned frequency domain transmission to estimate the integer pixel, and then we used the Keren method to estimate the sub-pixel motion.

2.3. Super-Resolution Reconstruction Algorithm for Cell Image in a Lensless System

2.3.1. Motion Estimation Algorithm

Due to the random direction of Brownian motion, we used multi-frame super-resolution technology to reconstruct the super-resolution image, and extracted the multi-frame image of Brownian motion for super-resolution image reconstruction. To examine super-resolution in a lensless system, we set up an observation model of a low resolution image, and then reconstructed a high resolution image using a multi-frame low resolution image using this model. In this study, the super-resolution algorithm of the image can be analyzed using the observation model shown in Figure 2.
This system symbolizes the cell transmitted to the surface of the sensor shadow image, and is similar to the image captured by a high-rate optical microscope. The acquisition of low-resolution image sequences can be represented as follows:
y k = M k B k D X + N k .
In this system, the blur matrix Bk and the down-sampling matrix D are known. The blur matrix is mainly caused by diffraction, and the down-sampling matrix is determined by the pixel size and pixel spacing of the CMOS image sensor. The Mk of each cell in this system is unknown, but the motion vector can be estimated by the motion estimation algorithm. Therefore, the key problems of the cell image super-resolution algorithm are motion estimation and high-resolution image reconstruction.
Motion vectors must be known before high-resolution image reconstruction. Therefore, we first introduced the motion estimation algorithm in this system. Based on the research on Brownian motion displacement, we decided to use the two-step method to estimate the motion.
In the first step, the Fourier–Mellin method was used to coarsely estimate the integer pixel displacement [30,31]. Assuming the reference image is I1 and the image to be registered is I2, and I1(x, y) and I2(x, y) are the pixel grayscale of the two images at coordinates (x, y). If the Fourier transform of I1 and I2 are F1(u, v) and F2(u, v), then F2 is
F 2 ( u , v ) = F 1 ( u , v ) e j ( u x 0 + v y 0 ) .
Its mutual power spectrum is
C o r r ( u , v ) = F 2 ( u , v ) F 2 * ( u , v ) | F 1 ( u , v ) F 1 * ( u , v ) | = φ 1 ( u , v ) φ ( u , v ) = e j ( u x 0 + v y 0 ) ,
where corr(u,v) becomes a phase correlation function, in which the image I1(x,y) is translated (x0,y0) and rotated by θ0 to obtain the image I2(x,y), which is shown as follows:
I 2 = I 1 ( x cos θ y sin θ + x 0 , y cos θ + x sin θ + y 0 ) .
This was Fourier transformed:
F 2 ( u , v ) = e j ( u x 0 + v y 0 ) F 1 [ ( u cos θ 0 v sin θ 0 ) , ( v sin θ 0 + u cos θ 0 ) ] ,
If the amplitude spectra of F1(u,v) and F2(u,v) are M1(u,v) and M2(u,v), then
M 2 ( u , v ) = M 1 ( u , v ) [ ( u cos θ 0 v sin θ 0 ) , ( v sin θ 0 + u cos θ 0 ) ] ,
Equation (6) shows that the amplitude of the spectrum is related to its rotation angle θ0 and is independent of the translation amount (x0,y0) of the image. Therefore, θ0 and (x0,y0) can be calculated separately. First, the rotation angle θ0 is calculated in the frequency domain, and then (u,v) in the image amplitude spectrum is transformed into polar coordinates (ρ,θ). The relationship between them is
u = ρ cos θ ,
v = ρ sin θ ,
Obtained from Equations (7) and (8) is
M 2 ( ρ , θ ) = M 1 ( ρ , θ θ 0 ) ,
Following this process, the rotation angle θ0 is calculated, followed by the translation amount (x0,y0); thus, the estimation of the integer pixel displacement coarseness is completed.
In the second step, the motion estimation algorithm proposed by Keren et al. [32] was used to estimate the sub-pixel displacement.
As above, assume that the reference image is I1 and the image to be registered is I2, and I1(x,y) and I2(x,y) are the pixel grayscale of the two images at coordinates (x,y), respectively. Image registration can be described as the mapping between the spatial coordinates and gray distribution of the two images.
I 2 ( x , y ) = G ( I 1 ( H ( x , y ) ) ) ,
where H is the two-dimensional coordinate transformation, and G is the one-dimensional gray-scale transformation. The purpose of image registration is to obtain the optimal coordinate transformation H and gray transform G. Image geometric transformation can be divided into rigid body transformation, affine transformation, projection transformation, and nonlinear transformation. Since the deformation of the cells in multiple frames is negligible during cell microscopy, the rigid body motion of cells can be approximated. The Keren algorithm is a registration method based on rigid body transformation. Its transformation model is also expressed in Equation (4). If θ is small, cosθ and sinθ are expanded by the Taylor series, and Equation (4) can be expressed as
I 2 ( x , y ) I 1 ( x + x 0 y θ 0 x θ 0 2 2 , y + y 0 + x θ 0 y θ 0 2 2 ) .
Then, Equation (11) can be expanded with a two-dimensional Taylor series, which is
I 2 ( x , y ) I 1 ( x , y ) + ( x 0 y θ 0 x θ 0 2 2 ) I 1 x + ( y 0 + x θ 0 y θ 0 2 2 ) I 1 y .
Therefore, the error between the reference image and the image to be registered is approximately, as follows:
E ( x 0 , y 0 , θ 0 ) = x , y [ I 1 ( x , y ) + ( x 0 y θ 0 x θ 0 2 2 ) I 1 x + ( y 0 + x θ 0 y θ 0 2 2 ) I 1 y I 2 ( x , y ) ] 2 .
The registration parameters, such as x0, y0, and θ0, which minimize E(x0, y0, θ0) in the equation above, are the estimated registration parameters. Equation (14), with respect to the partial derivatives of x0, y0, and θ0, and such that the partial derivatives are equal to zero, can be obtained as follows:
X = C 1 V ,
where the vector X, C, V can be expressed as follows:
X = [ x 0 y 0 θ 0 ] T ,
C = [ ( I 1 x ) 2 I 1 x I 1 y I 1 x I 1 x I 1 y ( I 1 y ) 2 R I 1 y I 1 y R I 1 y R 2 ] ,
V = [ I 1 x ( I 1 I 2 ) I 1 y ( I 1 I 2 ) R ( I 1 I 2 ) ] , R = x I 1 y y I 1 x .
The solution in Equation (17) is the translation and rotation parameters estimated by Keren [32]. The Keren method is suitable for small amplitude translation and rotation with high accuracy. Therefore, it is suitable for precise estimation as a two-step estimation method. The accuracy of image registration can be improved using the first step of integer pixel image registration and then Keren estimation, which provides a good foundation for the super-resolution reconstruction of subsequent cell images.

2.3.2. Normalized Convolution Super-Resolution Algorithm

The displacement parameters of the cells are obtained using motion estimation. In this study, a normalized convolution-based (NC) method based on Pham et al. [28] was used to reconstruct low-resolution cell images. In this algorithm, we used the Taylor series expansion to obtain the intensity at the point s0,
f ^ ( s , s 0 ) = p ( x , y ) = p 0 ( s 0 ) + p 1 ( s 0 ) x + p 2 ( s 0 ) y + p 3 ( s 0 ) x 2 + p 4 ( s 0 ) x y + p 5 ( s 0 ) y 2 + ,
where pi is the projection coefficient, which is the partial derivative of pi(s0) for the basis function at point s0.
ε ( s 0 ) = ( f ( s ) f ^ ( s , s 0 ) ) 2 c ( s ) a ( s s 0 ) d s ,
where c is the deterministic function of the signal, whose range is 0 to 1. The 0 represents unreliable and the 1 represents reliable. a(ss0) is a window function, which is the fitness function. According to the Equation (19), the p can be written in the form of a matrix,
p = ( B T W B ) 1 B T W f ,
where f is an N × 1 matrix of input intensity f (s), B is an N × m matrix of basis functions, and W = diag(c) … diag(a) is an N × N diagonal matrix.
The least-squares solution in Equation (20) can be written in the form of convolution operation:
f ^ 0 = a ( c · f ) a c ,
where f ^ 0 is the interpolated image, is the convolution operation, and c · f is the pixel-wise multiplication of the certainty.

2.3.3. Reconstruction of the Focus Plane Image Algorithm

In a non-lens system, visible light causes a diffraction phenomenon in the process of reaching the photosensitive surface of the pixel of the CMOS image sensor through the cell sample due to the absence of focus light in the lens system. As mentioned earlier, the original diffraction image is reconstructed using coaxial holography after super-resolution reconstruction. The transfer function of the diffraction model is
H d ( ε , η ) = { exp [ j d 2 π λ 1 ( λ ε ) 2 ( λ η ) 2 ] 0 , o t h e r w i s e , ε 2 + η 2 < 1 λ 2 ,
where d is the distance from the cell sample to the surface of the sensor and λ is the wavelength of visible light. Based on this transfer function, the relationship between the image surface (the photosensitive surface of the graphic sensor) and the image of the object surface (the cell sample plane) can be obtained as follows:
Y ( ε , η ) = F ( ε , η ) · H d ( ε , η ) ,
where Hd(ε,η) is the transfer function and Y(ε,η) is the scalar diffraction model described in Equation (1), which represents the frequency domain image of the two-dimensional intensity and phase distribution of y(x,y) on the image surface, and F(ε,η) represents the frequency domain image of the two-dimensional light intensity and phase distribution f(x,y) on the object surface. The lensless system obtains the image surface image y(x,y), based on Equation (23) to obtain the object surface image;
f ( x , y ) = F 1 [ Y ( ε , η ) · H d 1 ( ε , η ) ] ,
Due to the missing phase, the in-line holography technique has inherent zero-level image interference. IT can be iteratively eliminated using the zero-level image method we studied earlier [33]. Through the above algorithm, a clear high-resolution image of the cells can be reconstructed.

2.4. System Experimental Method

To verify the final effect of the algorithm, the system used the most commonly observed microscopic blood cells to conduct the experiment. First, the whole blood cells were diluted 1:10,000 with buffer solution, then the diluted blood samples were injected into the microchannel of the microfluidic chip. The dilution concentration mainly ensures that the cells can be evenly distributed in the observation window and that there is a certain distance between them to ensure that the diffraction patterns do not overlap. Then, the image sensor can be used to capture multi-frame images. Finally, the microfluidic chip was loaded into the lensless imaging system and the distance between the microchannel and the image sensor was fixed; then, the collected image was sent to MATLAB software for processing, and the image was registered using the local image registration. After the normalized convolution super-resolution algorithm and the de-blur and diffraction algorithm, the high-resolution image of each cell was obtained, and the final result is provided in Section 3.

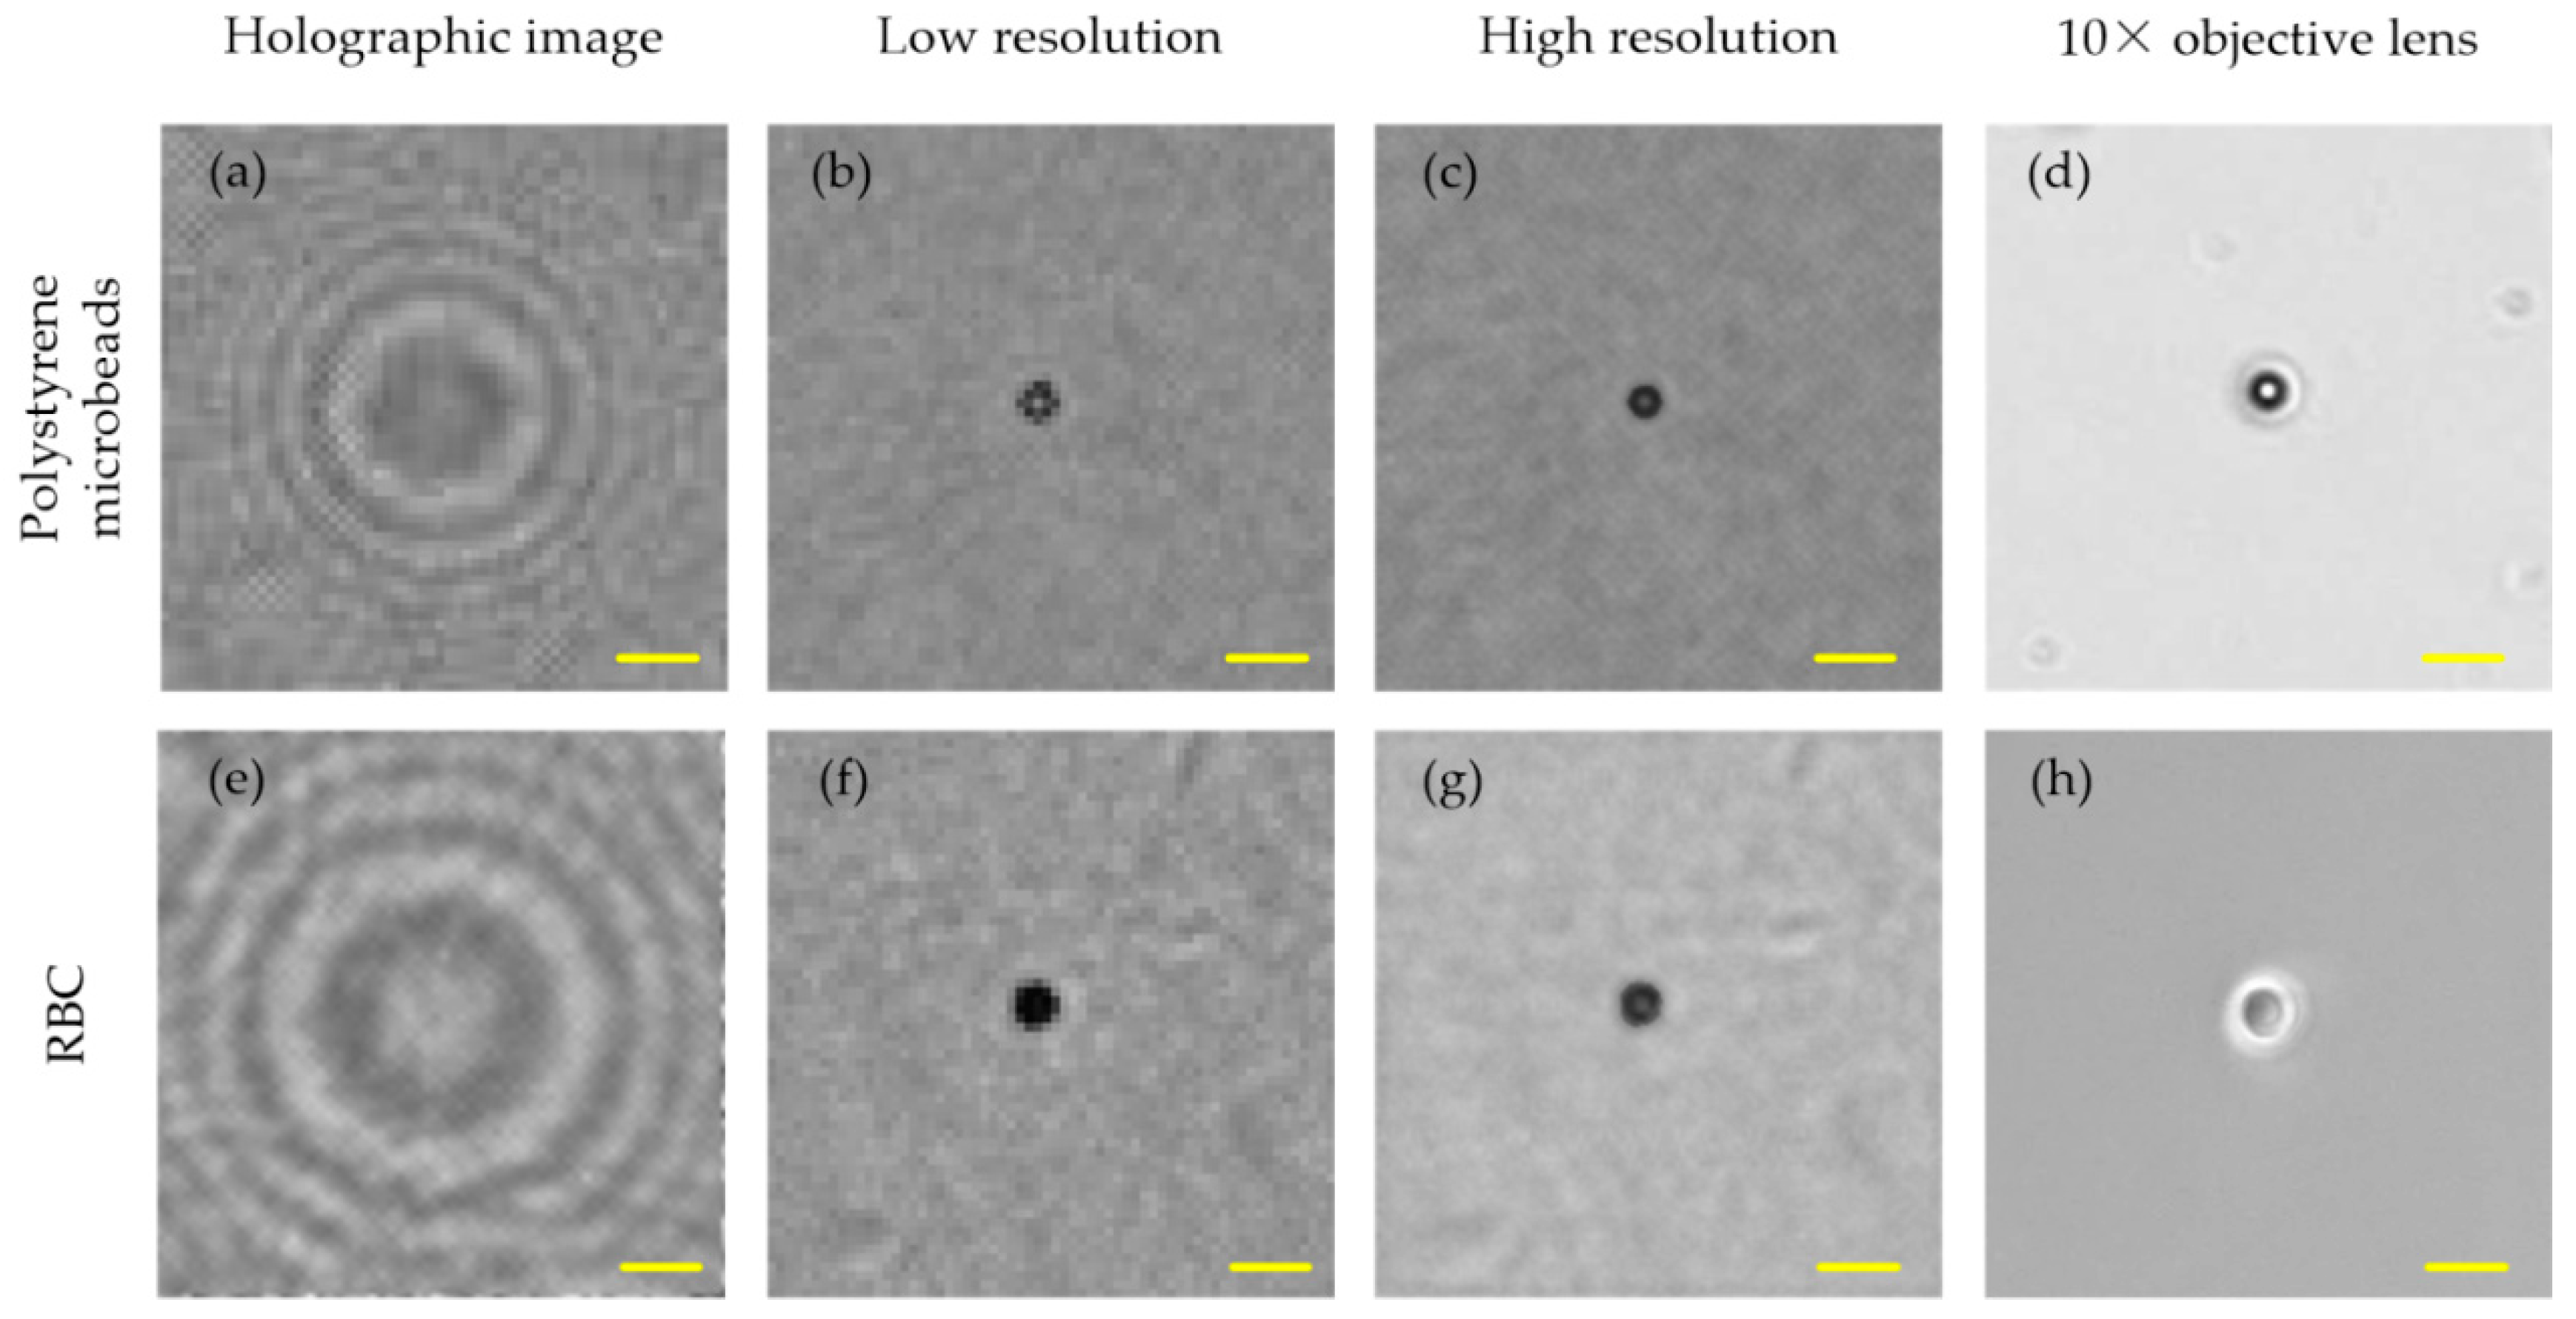
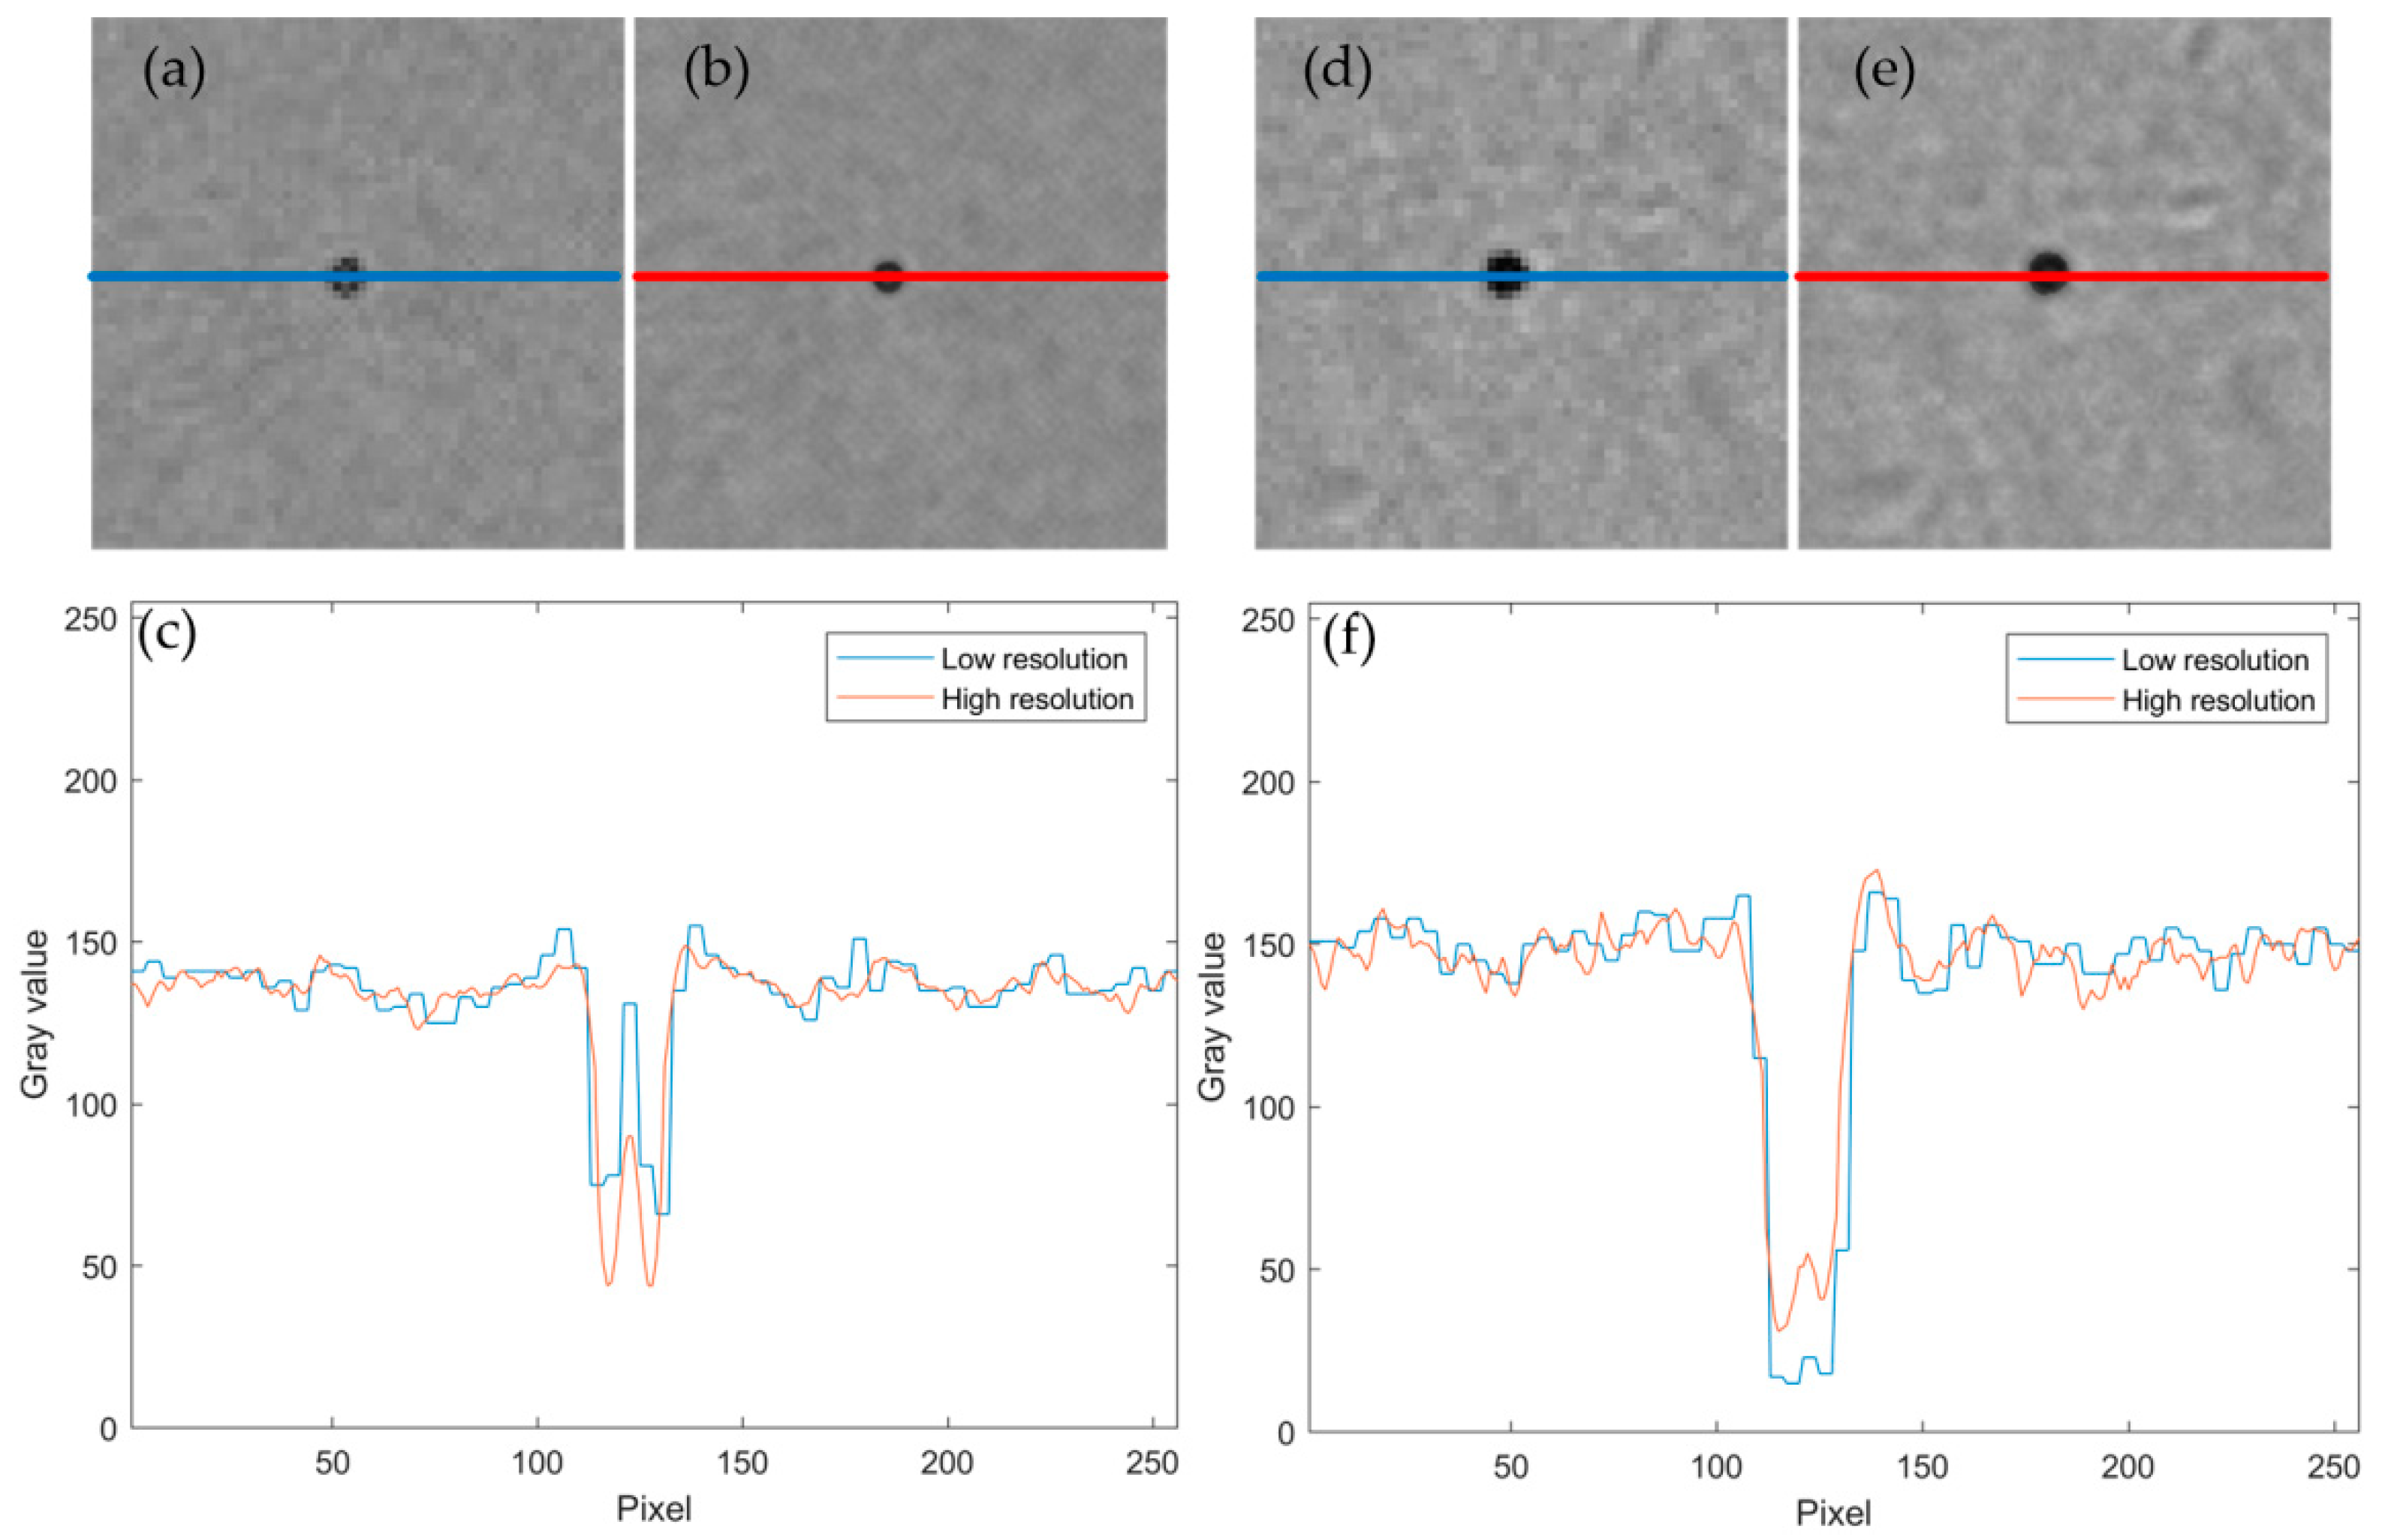
3. Results and Discussion

The cell images obtained by the lensless imaging system were registered using two-step motion estimation. Then, through the above-mentioned method, the final red blood cell images, which had an 8× super-resolution reconstruction, were obtained as shown in Figure 3.
Figure 3 shows that the resolution of the direct reconstruction of the focus plane from the raw hologram was very low, and the resolution greatly improved after super-resolution reconstruction. The high resolution reconstruction of the focused cell images was comparable to the 10× objective lens imaging results. The numerical aperture (NA) of the objective lens was 0.45, so the spatial resolution of the objective lens was 0.61 μm. The pixel size of CIS in the proposed system was 2.2 μm. According to the Nyquist criterion, the spatial resolution of the original image obtained by the lensless imaging system was 4.4 μm. The proposed algorithm improved the resolution of the image by eight times, and the spatial resolution could reach 0.55 μm. Therefore, the 10× objective lens (NA = 0.45) is used for the reference system in this paper.
To establish a clearer representation of the increasing resolution, Figure 4 presents the grayscale change of the different resolution result in Figure 3. As the multi-frame super-resolution does not require cell flow, this super-resolution method can image the same cell over a long period of time. In some special cases, the single-cell super-resolution algorithm based on Brownian motion can solve the Brownian motion problem of cells in suspension, and lays the foundation for the application of a lensless system.

4. Conclusions

In this manuscript, we proposed a multi-frame super-resolution method that uses cell Brownian motion for lensless microscopic imaging. This method uses the inherent Brownian motion of tiny objects as a method to extract the sub-pixel displacement information of cells, greatly reducing the volume of the device by making the cell or cells project motion without a device that makes the cell shadow move. In this method, the cell image resolution achieved is similar to that of a 10× objective lens (NA = 0.45) using the multi-frame super-resolution method. The method proposed in this manuscript can be used for long-term observation of living cells under a non-lens imaging system, and further promote the practical application of the non-lens system. The method simultaneously provides a novel super-resolution method capable of managing the irregular movement of living cells or microorganisms in liquids under lensless imaging systems.

Author Contributions

Y.F. conceived and designed the experiments; Y.F. and Y.J. performed the experiments; Y.F. and N.Y. analyzed the data; N.Y. contributed reagents, materials, and analysis tools; and Y.F. wrote the paper.

Funding

This work was supported by the National Natural Science Foundation of China (No. 61771388), the National Natural Science Foundation of China (No. 61471296), and the key research project of Baoji University of Arts and Sciences (No. 209010439).

Conflicts of Interest

The authors declare no conflict of interest.

References

  1. Mudanyali, O.; Tseng, D.; Oh, C.; Isikman, S.O.; Sencan, I.; Bishara, W.; Oztoprak, C.; Seo, S.; Khademhosseini, B.; Ozcan, A. Compact, light-weight and cost-effective microscope based on lensless incoherent holography for telemedicine applications. Lab Chip 2010, 10, 1417–1428. [Google Scholar] [CrossRef]
  2. Mudanyali, O.; Oztoprak, C.; Tseng, D.; Erlinger, A.; Ozcan, A. Detection of waterborne parasites using field-portable and cost-effective lensfree microscopy. Lab Chip 2010, 10, 2419–2423. [Google Scholar] [CrossRef]
  3. Penwill, L.A.; Batten, G.E.; Castagnetti, S.; Shaw, A.M. Growth phenotype screening of Schizosaccharomyces pombe using a Lensless microscope. Biosens. Bioelectron. 2014, 54, 345–350. [Google Scholar] [CrossRef] [Green Version]
  4. Huang, X.; Jiang, Y.; Liu, X.; Xu, H.; Han, Z.; Rong, H.; Yang, H.; Yan, M.; Yu, H. Machine Learning Based Single-Frame Super-Resolution Processing for Lensless Blood Cell Counting. Sensors 2016, 16, 1836. [Google Scholar] [CrossRef]
  5. Lee, J.; Kwak, Y.H.; Paek, S.-H.; Han, S.; Seo, S. CMOS image sensor-based ELISA detector using lens-free shadow imaging platform. Sens. Actuators B Chem. 2014, 196, 511–517. [Google Scholar] [CrossRef]
  6. Jin, G.; Yoo, I.H.; Pack, S.P.; Yang, J.W.; Ha, U.H.; Paek, S.H.; Seo, S. Lens-free shadow image based high-throughput continuous cell monitoring technique. Biosens. Bioelectron. 2012, 38, 126–131. [Google Scholar] [CrossRef] [PubMed]
  7. Roy, M.; Jin, G.; Pan, J.-H.; Seo, D.; Hwang, Y.; Oh, S.; Lee, M.; Kim, Y.J.; Seo, S. Staining-free cell viability measurement technique using lens-free shadow imaging platform. Sens. Actuators B Chem. 2016, 224, 577–583. [Google Scholar] [CrossRef]
  8. Roy, M.; Jin, G.; Seo, D.; Nam, M.-H.; Seo, S. A simple and low-cost device performing blood cell counting based on lens-free shadow imaging technique. Sens. Actuators B Chem. 2014, 201, 321–328. [Google Scholar] [CrossRef]
  9. Scholz, G.; Xu, Q.; Schulze, T.; Boht, H.; Mattern, K.; Hartmann, J.; Dietzel, A.; Scherneck, S.; Rustenbeck, I.; Prades, J.; et al. LED-Based Tomographic Imaging for Live-Cell Monitoring of Pancreatic Islets in Microfluidic Channels. Proceedings 2017, 1, 552. [Google Scholar] [CrossRef]
  10. Heng, X.; Erickson, D.; Baugh, L.R.; Yaqoob, Z.; Sternberg, P.W.; Psaltis, D.; Yang, C. Optofluidic microscopy—A method for implementing a high resolution optical microscope on a chip. Lab Chip 2006, 6, 1274–1276. [Google Scholar] [CrossRef]
  11. Lee, S.A.; Leitao, R.; Zheng, G.; Yang, S.; Rodriguez, A.; Yang, C. Color capable sub-pixel resolving optofluidic microscope and its application to blood cell imaging for malaria diagnosis. PLoS ONE 2011, 6, e26127. [Google Scholar] [CrossRef]
  12. Lee, S.A.; Yang, C. A smartphone-based chip-scale microscope using ambient illumination. Lab Chip 2014, 14, 3056–3063. [Google Scholar] [CrossRef] [Green Version]
  13. Zheng, G.; Lee, S.A.; Antebi, Y.; Elowitz, M.B.; Yang, C. The ePetri dish, an on-chip cell imaging platform based on subpixel perspective sweeping microscopy (SPSM). Proc. Natl. Acad. Sci. USA 2011, 108, 16889–16894. [Google Scholar] [CrossRef] [Green Version]
  14. Coskun, A.F.; Sencan, I.; Su, T.W.; Ozcan, A. Wide-field lensless fluorescent microscopy using a tapered fiber-optic faceplate on a chip. Analyst 2011, 136, 3512–3518. [Google Scholar] [CrossRef]
  15. Coskun, A.F.; Sencan, I.; Su, T.W.; Ozcan, A. Lensfree fluorescent on-chip imaging of transgenic Caenorhabditis elegans over an ultra-wide field-of-view. PLoS ONE 2011, 6, e15955. [Google Scholar] [CrossRef]
  16. Greenbaum, A.; Luo, W.; Khademhosseinieh, B.; Su, T.-W.; Coskun, A.F.; Ozcan, A. Increased space-bandwidth product in pixel super-resolved lensfree on-chip microscopy. Sci. Rep. 2013, 3, 1717. [Google Scholar] [CrossRef]
  17. Isikman, S.O.; Bishara, W.; Mavandadi, S.; Yu, F.W.; Feng, S.; Lau, R.; Ozcan, A. Lens-free optical tomographic microscope with a large imaging volume on a chip. Proc. Natl. Acad. Sci. USA 2011, 108, 7296–7301. [Google Scholar] [CrossRef] [Green Version]
  18. Isikman, S.O.; Bishara, W.; Mudanyali, O.; Sencan, I.; Su, T.W.; Tseng, D.; Yaglidere, O.; Sikora, U.; Ozcan, A. Lensfree On-Chip Microscopy and Tomography for Bio-Medical Applications. IEEE J. Sel. Top. Quantum Electron. 2011, 18, 1059–1072. [Google Scholar] [CrossRef]
  19. Seo, S.; Isikman, S.O.; Sencan, I.; Mudanyali, O.; Su, T.W.; Bishara, W.; Erlinger, A.; Ozcan, A. High-throughput lens-free blood analysis on a chip. Anal. Chem. 2010, 82, 4621–4627. [Google Scholar] [CrossRef]
  20. Su, T.W.; Erlinger, A.; Tseng, D.; Ozcan, A. Compact and light-weight automated semen analysis platform using lensfree on-chip microscopy. Anal. Chem. 2010, 82, 8307–8312. [Google Scholar] [CrossRef]
  21. Tseng, D.; Mudanyali, O.; Oztoprak, C.; Isikman, S.O.; Sencan, I.; Yaglidere, O.; Ozcan, A. Lensfree microscopy on a cellphone. Lab Chip 2010, 10, 1787–1792. [Google Scholar] [CrossRef] [Green Version]
  22. Zhu, H.; Yaglidere, O.; Su, T.W.; Tseng, D.; Ozcan, A. Cost-effective and compact wide-field fluorescent imaging on a cell-phone. Lab Chip 2011, 11, 315–322. [Google Scholar] [CrossRef]
  23. Zheng, G.; Lee, S.A.; Yang, S.; Yang, C. Sub-pixel resolving optofluidic microscope for on-chip cell imaging. Lab Chip 2010, 10, 3125–3129. [Google Scholar] [CrossRef] [Green Version]
  24. Isikman, S.O.; Bishara, W.; Sikora, U.; Yaglidere, O.; Yeah, J.; Ozcan, A. Field-portable lensfree tomographic microscope. Lab Chip 2011, 11, 2222–2230. [Google Scholar] [CrossRef]
  25. Bishara, W.; Sikora, U.; Mudanyali, O.; Su, T.W.; Yaglidere, O.; Luckhart, S.; Ozcan, A. Holographic pixel super-resolution in portable lensless on-chip microscopy using a fiber-optic array. Lab Chip 2011, 11, 1276–1279. [Google Scholar] [CrossRef] [Green Version]
  26. Lee, K.; Kim, H.D.; Kim, K.; Kim, Y.; Hillman, T.R.; Min, B.; Park, Y. Synthetic Fourier transform light scattering. Opt Express 2013, 21, 22453–22463. [Google Scholar] [CrossRef]
  27. Knutsson, H.; Westin, C.-F. Normalized and differential convolution. In Proceedings of the IEEE Computer Society Conference on ComputerVision and Pattern Recognition, New York, NY, USA, 15–17 June 1993; pp. 515–523. [Google Scholar]
  28. Pham, T.Q.; van Vliet, L.J.; Schutte, K. Robust Fusion of Irregularly Sampled Data Using Adaptive Normalized Convolution. EURASIP J. Adv. Signal Process. 2006, 2006, 083268. [Google Scholar] [CrossRef]
  29. Eckstein, E.C. Fractional Brownian Motion and Particle Motions in Blood Flow. In Proceedings of the International Conference of the IEEE Engineering in Medicine & Biology Society, Orlando, FL, USA, 31 October–3 November 1991. [Google Scholar]
  30. Lucchese, L.; Cortelazzo, G.M. A Noise-Robust Frequency Domain Technique for Estimating Planar Roto-Translations. IEEE Trans. Signal Process. 2000, 48, 1769–1786. [Google Scholar] [CrossRef]
  31. Bigot, J.; Gamboa, F.; Vimond, M. Estimation of Translation, Rotation, and Scaling between Noisy Images Using the Fourier–Mellin Transform. SIAM J. Imaging Sci. 2009, 2, 614–645. [Google Scholar] [CrossRef] [Green Version]
  32. Keren, D.; Peleg, S.; Brada, R. Image sequence enhancement using sub-pixel displacement. In Proceedings of the Conference on Computer Vision & Pattern Recognition, Ann Arbor, MI, USA, 5–9 June 1988. [Google Scholar]
  33. Fang, Y.; Yu, N.; Jiang, Y.; Dang, C. High-Precision Lens-Less Flow Cytometer on a Chip. Micromachines 2018, 9, 227. [Google Scholar] [CrossRef]
Figure 1. The structure of a lensless imaging system: (a) the general structure of the system and (b) the observation window of the microfluidic chip.
Applsci 09 02080 g001
Figure 2. Multi-frame super-resolution observation model, where X (x, y) is the original image and this image is a high-resolution image. Mk represents the translation and rotation caused by the inherent Brownian motion of the cell; Bk represents the blurring of optics, motion, and sensors; D represents the down sampling, where the pixel units of the sensor are arranged tightly, and the down-sampling matrix is determined by the pixel size; and noise Nk is mainly introduced by the sensor thermal noise.
Applsci 09 02080 g002
Figure 3. The super-resolution results. (a,e) A raw holographic image of polystyrene microbead (5 μm in diameter) and red blood cell (RBC). (b,f) A low resolution image on the focus plane. (c,g) The high-resolution image on the focus plane. (d,h) A micrographic image using a 10× objective lens. The scale bar is 10 μm.
Applsci 09 02080 g003
Figure 4. The super-resolution of sample images comparison. (a) A low-resolution image of bead. (b) A high-resolution image of polystyrene microbead. (c) The grayscale change curve of the lines in (a,b). (d) A low-resolution image of RBC. (e) A high-resolution images of RBC. (f) The grayscale change curve of the lines in (d,e).
Applsci 09 02080 g004

