Abstract
Maintaining product quality is essential for smart factories, hence detecting abnormal events in assembly line is important for timely decision-making. This study proposes an affordable fast early warning system based on edge computing to detect abnormal events during assembly line. The proposed model obtains environmental data from various sensors including gyroscopes, accelerometers, temperature, humidity, ambient light, and air quality. The fault model is installed close to the facilities, so abnormal events can be timely detected. Several performance evaluations are conducted to obtain the optimal scenario for utilizing edge devices to improve data processing and analysis speed, and the final proposed model provides the highest accuracy in terms of detecting abnormal events compared to other classification models. The proposed model was tested over four months of operation in a Korean automobile parts factory, and provided significant benefits from monitoring assembly line, as well as classifying abnormal events. The model helped improve decision-making by reducing or preventing unexpected losses due to abnormal events.
1. Introduction
The concept of Industry 4.0 [1] was recently proposed as the new state of the art between information and communication technology (ICT) and manufacturing technologies, offering opportunities to significantly enhance manufacturing systems and help improve product quality, production efficacy, and allow real-time condition monitoring and decision-making [2]. A transition from traditional to advanced manufacturing can be enabled by adopting ICT [3]. Early warning systems within ICT applications can provide important inputs to manufacturing processes and management, and integrating ICT with IoT and sensors enables early warning systems to monitor manufacturing processes.
With recent cloud computing developments, sufficient computing and storage resources can be acquired without requiring physical data centers or servers [4,5]. However, cloud computing has a number of drawbacks, including low response time due to centralized computation, where the data must first be transmitted to the cloud for computation and the result returned later. On the other hand, short response time and real-time decision support are essential for some IoT applications, such smart healthcare [6], emergency response [7], and early warning systems [8]. Edge computing can be utilized to overcome these cloud issues by providing computation and storage resources near the data source, minimizing latency, and providing real-time decision-making.
Manufacturing data, e.g., sensor data, process logs, etc., must be analyzed to facilitate meaningful decision-making. Machine learning has great potential to analyze data and has been successfully applied for quality [9,10,11] and fault detection [12,13,14]. For example, random forest (RF) can provide high accuracy for detecting abnormal events in a process, whereas traditional machine learning models encounter challenging issues, such as outlier data and imbalanced datasets, with consequentially low model accuracy. Several studies have demonstrated that eliminating outlier data using density based spatial clustering of applications with noise (DBSCAN) methods [15] and balancing the dataset using synthetic minority over sampling techniques (SMOTE) [16] can significantly improve model accuracy [17,18,19].
The present study proposed an affordable fast early warning system (AFEWS) utilizing edge devices and a hybrid fault model. The edge device was a computation unit close to the data source (sensors), and we used a hybrid fault model to predict whether the process was functioning normally or abnormally. The model comprised of DBSCAN based outlier detection, SMOTE, and the RF algorithm. DBSCAN was employed to eliminate outlier data, SMOTE to balance the dataset, and RF to predict faults. We developed a web dashboard to visualize sensor data and fault status in fast response. The proposed system was implemented in a Korean automobile parts factory. Contributions from the present study can be summarized as follows:
- Affordable edge computing system. The proposed system employed an edge device based on an open source single-board computer (SBC), providing low cost, good support, and sufficient computation resources. Sensor devices were combined with the SBC to gather, process, analyze, and present the sensor data and consequential results in a web dashboard without requiring network communication to the cloud server, thus minimizing network latency and improving analysis speed.
- Fault detection based on hybrid fault model. We utilized a hybrid fault model combining DBSCAN outlier detection, SMOTE, and RF to improve prediction accuracy. The hybrid fault model learned and generated the model that was subsequently used in the edge device to predict faults in fast response.
- Implementation and performance analysis. The proposed system was tested in the door trim assembly line for a Korean automobile parts factory. The selected edge device provided sufficient performance, successfully gathering, analyzing, and displaying sensor data in fast response. The proposed hybrid fault model provided the highest accuracy compared with traditional classification models.
The remainder of this paper is organized as follows: Section 2 overviews related studies. Section 3 explains the overall design and implementation of the proposed system. Section 4 presents results from implementing the proposed system and discusses various managerial implications. Section 5 summarizes and concludes the paper and discusses future study avenues.
2. Related Studies
2.1. Edge Computing for Warning Systems
Shi et al. defined edge computing as computation and network resources placed close to the data source [20], which could provide an effective and efficient solution for data-driven low latency IoT applications. Edge systems can respond in real-time to urgent events triggered by machines or sensors. Since computation can be completed close to the data sources, real-time decisions and time sensitive applications can be solved in a timely manner. Benefits from edge computing include reduced response, improved latency, and reduced energy consumption. Sood and Mahajan proposed a warning system to detect and prevent outbreaks of mosquito borne diseases (MBDs) [8], utilizing fog-cloud based computing to process data and machine learning algorithm(s) to detect infected persons, generating early warning alerts when abnormalities were detected, i.e., high possibility of dense mosquito regions and/or breeding sites. Uninfected persons could then take immediate precautions and MBD outbreaks could be prevented. Their results confirmed that the proposed model could effectively monitor, detect, and prevent MBD outbreaks. In addition, Ferrández-Pastor et al. proposed an architecture based on edge and fog computing to solve the integration and interoperability issues in heterogenous smart building services [21]. Their experimental results showed the feasibility of the integration and interoperability between existing services and new services not only in smart building, but also in other areas.
Edge computing has been adopted in manufacturing areas to monitoring machine health, improving assembly line productivity and increasing quantity and quality. Wu et al. proposed a framework based on fog-computing for cyber manufacturing to monitor machine health and generate predictive analytics [22]. Their results demonstrated positive impacts from adopting the proposed approach for a real factory. Petrali et al. developed a flexible production line edge computing system for a white-appliances industry, using edge computing to process the order and communicate with other devices [23]. Their results showed that the developed model improved system productivity and decreased reconfiguration costs. Hu et al. proposed an intelligent robot (iRobot) factory based on cognitive manufacturing and edge computing in the production line [24]. Edge computing provided optimal computing resources for the iRobot and reduced network transmission time. The proposed model provided significantly increased production compared with a traditional factory approach. Tao et al. showed that cloud-based data storage and analytics were inappropriate for low latency and/or real time applications [25]. They recommended fog and edge computing be adopted to store and process data, significantly reducing bandwidth requirements and latency.
Therefore, the present study utilized edge computing to monitor manufacturing processes and integrated edge computing and machine learning to provide early fault detection and warning, helping to prevent further losses due to manufacturing faults.
2.2. Machine Learning for Fault Detection
Technology developments in manufacturing generate new approaches to enhance product quality and prevent unexpected losses due to faults. Machine learning can analyze manufacturing data, providing managerial support as well as improving productivity. Soualhi et al. proposed a method to detect ball bearing machine health status. Healthy vibration data was extracted using the Hilbert-Huang transform to track critical bearing component degradation. Then, the support vector machine (SVM) approach was used to detect faults [9]. Their results showed that the proposed method could effectively detect ball bearing faults. Chen et al. proposed welding quality detection using SVM in a high-power disk layer [10]. Their proposed model successfully detected welding quality and could be implemented for real-time monitoring. Several machine learning models were utilized and evaluated to successfully detect metal casting quality [11].
Fault detection and analysis are important engineering problems to identify abnormal events during process. Early process fault detection and warning can help reduce or avoid productivity losses. Previous studies have identified that the RF machine learning model has good efficacy to detect manufacturing faults, e.g., failure detection of rotor bars [13], where RF achieved higher detection accuracy compared to other models and was suitable for in-process real-time fault detection. RF has also been used to detect bearing failure [14], outperforming neural network approaches in terms of performance and accuracy. Finally, RF was used to diagnose induction motor faults [12], achieving higher accuracy and faster execution compared to other models.
Data preprocessing is a critical step to identify inconsistencies and/or outliers and generate better classification models. Previous studies have showed that eliminating outlier data can significantly improve classification accuracy [26,27]. Clustering methods can be used for outlier detection based on the assumption that normal data correspond to dense clusters, whereas outlier data correspond to small groups, which are not included in any cluster [28]. The DBSCAN method distinguishes outlier data by finding dense regions based on the number of data close to a given point [15]. Points that do not belong to any cluster are regarded as outliers. DBSCAN is shown to provide excellent performance for distinguishing outlier from normal data, with consequentially improved classification accuracy. Alfian et al. utilized DBSCAN to detect outlier sensor data for a supply chain, successfully distinguishing outlier and normal data [29]. Thang and Kim proposed multiple parameter DBSCAN (DBSCAN-MP) to detect network intrusion, achieving a significantly higher detection rate compared to other methods [30]. Chen and Li subsequently showed that the enhanced DBSCAN method could achieve higher intrusion detection accuracy compared to other methods [31].
Accuracy can also be improved by applying DBSCAN for outlier removal. ElBarawy et al. developed community detection utilizing DBSCAN to eliminate outliers and showed that the proposed method could precisely cluster community data for social network analysis [32]. Ijaz et al. utilized DBSCAN for outlier removal to enhance diabetes and hypertension prediction accuracy [19].
Unbalanced class distribution is a common problem for supervised learning. Oversampling can be employed to address this problem, creating artificial data to balance the class distribution. The SMOTE oversampling method is widely used for machine learning, and several previous studies highlighted that this method subsequently improved model accuracy. Yousefian-Jazi et al. proposed a decision support system to automatically detect thin film transistor liquid crystal display (TFT-LCD) glass substrate defects using SVM [17], employing SMOTE techniques to balance their dataset. The results found that the accuracy of the model was increased. The proposed SVM model outperformed classification and regression tree and multilayer perceptron (MLP) models during testing. Kim et al. employed SMOTE to solve data imbalance for a semiconductor dataset [18], providing improved model accuracy. The RF model achieved the highest accuracy compared to the decision tree, logistics regression, and artificial neural network.
Previous studies have shown that employing DBSCAN outlier detection and SMOTE to balance the dataset distribution provides improved model accuracy. Therefore, we propose a hybrid fault model consisting of DBSCAN outlier detection, SMOTE, and RF to improve classification accuracy and identify faults at an early stage. Thus, managers can take appropriate actions earlier to preventing further losses due to faults during manufacturing.
3. Proposed Affordable Fast Early Warning System
3.1. System Design
This section describes the overall design for the proposed affordable fast early warning system (AFEWS) system. Figure 1 shows that the proposed AFEWS system consists of an edge device and visualization tools. The edge device consists of single board computer (SBC), sensors, hybrid fault model, and data storage, and gathers and processes environmental conditions from the workstation. The hybrid fault model embedded in the edge device triggers alert/warning messages in fast response when a fault is detected during process. The generated sensor data and prediction results are stored, as well as pushed, to the data visualization layer. Management can monitor the status of every workstation through the web dashboard and receive warning messages via email and/or instant messaging (IM) when a fault is detected.
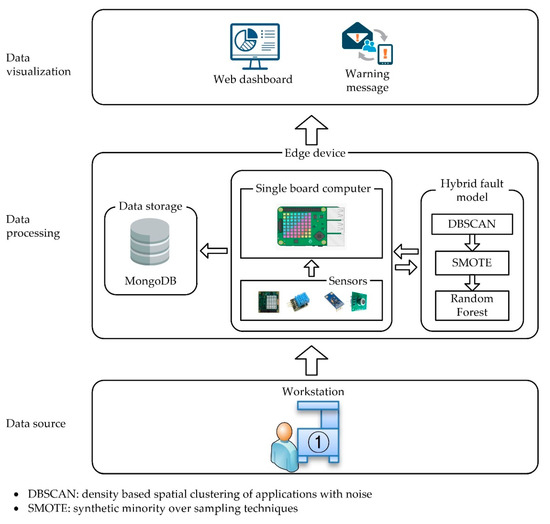
Figure 1.
Proposed affordable fast early warning system (AFEWS) architecture.
Edge devices were installed at every workstation to allow conditions to be monitored for each workstation during process. Figure 2 shows an example assembly line process for the automobile parts factory, with edge devices in four workstations with different assembly processes. The edge devices act independently to collect, store, process, and predict fault states in fast response without requiring data communication to the cloud.
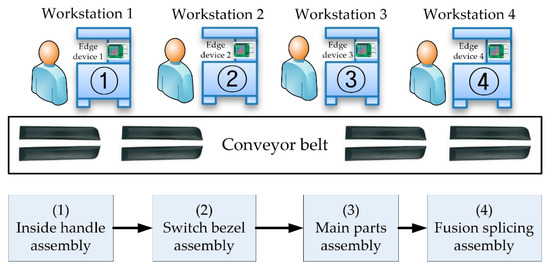
Figure 2.
Example assembly line excerpt with edge devices attached to workstation panels.
3.2. Edge Devices
Edge devices were attached to relevant workstations, so that sensors could collect various environmental condition data, such as gyroscope, accelerometer, temperature, humidity, ambient light, and air quality, during process. The SBC provided general-purpose input and output (GPIO) ports, low cost, and low power consumption [33]. There were several suitable SBC options, including Raspberry Pi [34] and BeagleBoard [35]. We selected Raspberry Pi for the present study due to its lower cost, support availability, and reasonable performance [36]. A local database was installed in each edge device to store collected sensor data and analysis results.
The Raspberry Pi was approximately 8 × 5 × 1 cm (width/length/thickness) and provided micro USB power, micro SD card, display serial interface (DSI), USB, camera serial interface (CSI), LAN, HDMI, audio, and video ports, along with 40 pin GPIO connectors for sensor interfaces. The Raspberry Pi used in this study was as follows:
- Model name: Raspberry Pi 3 Model B
- CPU: quad core 1.2 GHz Broadcom BCM2837, 64 bit
- RAM: 1 GB
- Storage: micro SD, 16 GB
- Network: BCM43438 wireless, LAN, and Bluetooth Low Energy
We employed several sensor devices, including accelerometer and gyroscope: Sense Hat [37], humidity and temperature: DHT11 [38], ambient light: BH1750FVI [39], and air quality: ZP01-MP503 [40], as detailed in Table 1.

Table 1.
Proposed affordable fast early warning system (AFEWS) sensor devices.
We used MongoDB as the local edge device database for this study. MongoDB is a Non-SQL type database, which offers flexible data-schema compared to relational databases. Previous studies have shown it can be efficiently used to store continuous generated sensor data [29,41]. Several client libraries, including C, C++, Python, Java, Node.js, etc., were also available to simplify direct communication with MongoDB [42], ensuring the development community can rapidly develop MongoDB based applications [43].
We installed the official supported operating system (OS) for the Raspberry Pi (Raspbian Stretch with Desktop OS) [44], with MongoDB V3.2, Python V3.6.5 and PyMongo V3.7.2 [45] to collect sensor data and store them to MongoDB. Incoming sensor data were analyzed using the proposed hybrid fault model to predict workstation conditions and this result was also stored to MongoDB.
3.3. Proposed AFEWS Implementation
This section describes the proposed AFEWS implementation. AFEWS was implemented for an automobile parts assembly line producing car door trim parts. Four steps were monitored: Inside handle, switch bezel, main parts, and fusion splitting assembly, as shown in Figure 2. The assembly line required approximately 5 min to perform each process step. We identified fault cause for the door trim process. If the worker screwed and/or hammered too hard, the product would break, causing a process fault.
Figure 3a shows the assembly line layout in the factory, highlighting an example workstation shown in detail in Figure 3b, with typical edge device installation in Figure 3c.
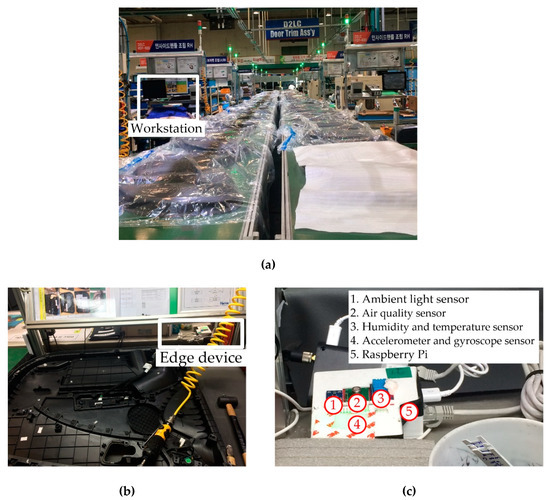
Figure 3.
Proposed AFEWS implementation: (a) door trim assembly line, (b) workstation, (c) edge device.
3.4. Hybrid Fault Model
We used the hybrid fault model, combining DBSCAN [15], SMOTE [16], and RF [46], to predict normal and abnormal events during process, as shown in Figure 4.
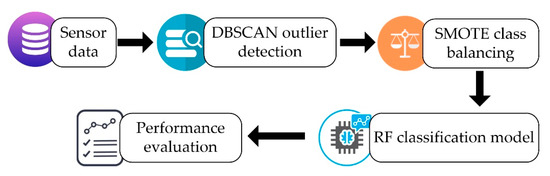
Figure 4.
Hybrid fault model using density based spatial clustering of applications with noise (DBSCAN) outlier detection, synthetic minority oversampling technique (SMOTE) class balancing and random forest (RF) classification model.
We collected an experimental dataset during initial implementation to evaluate performance of the proposed model. The collected dataset included 614 instances (378 normal and 236 abnormal), each with 10 attributes as follows:
- Gyroscope X, Y, and Z directions (gyroX, gyroY, and gyroZ, respectively).
- Accelerometer X, Y, and Z directions (accX, accY, and accZ, respectively).
- Temperature (temp).
- Relative humidity (hum).
- Ambient light (lux).
- Air quality (air).
Random forest classification was employed to learn and generate a robust model from the collected dataset, which was then installed into each edge device to ensure prediction from sensor data could be generated and presented in fast response.
We used preprocessing to remove inappropriate data and correct for missing values, with attribute and class parameters shown in Table 2. The air quality sensor provided categorical values (clean (CL), light pollution (LP), moderate pollution (MP), and severe pollution (SP)), hence the statistical distribution could not be derived for this attribute. Figure 5 shows the information gain [28] significance for each attribute. Gyroscope Z and Y directions (gyroZ and gyroY, respectively) had the maximum affect for abnormal events.
Table 2.
Experimental dataset distributions.
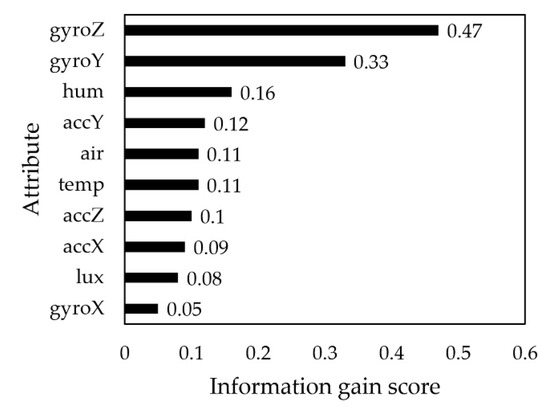
Figure 5.
Attribute significance (attribute labels are defined in the main text above).
Due to imperfect sensing devices and network connection problems, some sensor data may be significantly noisy or outliers. Therefore, we filtered the sensor data using DBSCAN [15] implemented in R V3.5.1 [47] to remove outliers, having previously determined optimal values for epsilon (eps = 4) and minimum points (MinPts = 5), neighborhood radius around a data point and minimum value of neighboring data points, respectively. We defined eps by calculating the average distance of every point to its k-nearest neighbors, using R V3.5.1 [47]. Figure 6a,b show the sorted k-nearest neighbor (NN) distribution and DBSCAN outlier detection, respectively. DBSCAN grouped the sensor data into four clusters, labelled 1–4, with cluster 0 representing un-clustered data, regarded as outliers. A total of 39 outlier instances were identified (of 614), and the remaining 575 were used for further analysis.
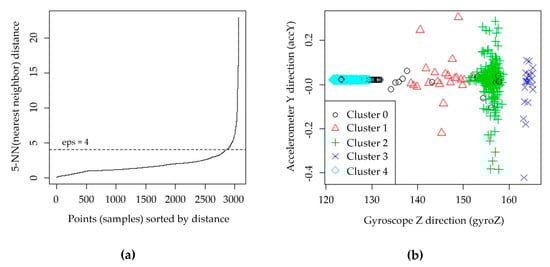
Figure 6.
(a) Optimal value for eps using 5-NN (nearest neighbor) and (b) DBSCAN outlier detection.
Data distributions in this study were unbalanced between normal and abnormal subsets after DBSCAN, as shown in Table 3. Therefore, we employed SMOTE to balance the dataset, using Weka V3.6.15 [48]. The original dataset distribution was maintained by adding synthetic data close to minority data, with 50% increased abnormal class data balancing the dataset well (see Table 3), allowing machine learning to generate high classification accuracy.
Table 3.
SMOTE effect.
The RF algorithm is a supervised classification model formed by combining several decision tree models. Each tree within the RF is independently constructed by choosing a random subset of attributes and bootstrap samples from the dataset. Each generated tree model is accumulated using a majority voting method to brain the best final outcome [49]. RF overcomes various decision tree problems, such as low variance generation and overfitting. We applied DBSCAN to remove outliers, SMOTE to balance the resulting dataset, and RF to learn and generate the final model from the balanced dataset. The generated model was then installed on each edge device for fault prediction.
Prediction output may have four possible outcomes [50]. True positive (TP) and true negative (TN) outcomes are the number of correctly classified data. False positive (FP) and false negative (FN) outcomes are the number of data incorrectly classified as normal when they are actually abnormal, and abnormal class when they actually are normal, respectively. We employed 10-fold cross-validation for all classification models, with final performance metric being the average. Table 4 shows classification performance metrics based on precision (p), recall (r), F-1 score (f), and accuracy (a).
Table 4.
Classification model performance metrics.
3.5. Data Visualization
The web dashboard and warning messages were implemented in the data visualization layer. These modules enable managers to visually monitor assembly line conditions and immediately receive alert or warning messages when a fault is detected during process. Information regarding process conditions from the edge device were provided visually in a web dashboard. The web dashboard visualized conditions in chart form to provide historical conditions prior to fault occurrence, to assist in analyzing the root cause. Alert or warnings were also provided by the web dashboard and sent to registered contacts via email and/or IM apps, e.g., Telegram [51]. Thus, managers can instantly notice fault conditions, which will improve decision-making.
The web dashboard was developed using several open source software (OSS), including Node.js V10.13.0, Express JS V4.16.0, Bootstrap V4.1.3, Chart.js V2.7.3, and Socket.IO V2.1.1. We employed Node.js as a webserver, whereas Express Js, Bootstrap, and Chart.js were used for visualization. Socket.IO was used to handle and present sensor data and prediction results in fast response. When the web dashboard initiates, the local IP address and port are visible and can be accessed through a web browser on computer, smartphone, or tablet connected to the local network. Figure 7 shows how the web dashboard presents sensor, i.e., gyroscope, accelerometer, temperature, humidity, ambient light, and air quality. The sensor number represents the process identification for the workstation for that specific process. The hybrid fault model was applied within each edge device to predict the fault state, which was presented to the web dashboard in fast response. Once a fault was detected, the warning message was immediately generated, sent to the web dashboard and subsequently to registered contacts by email and/or IM, as shown in Figure 8. Thus, managers can immediately notice the fault and take action to prevent further losses during process.
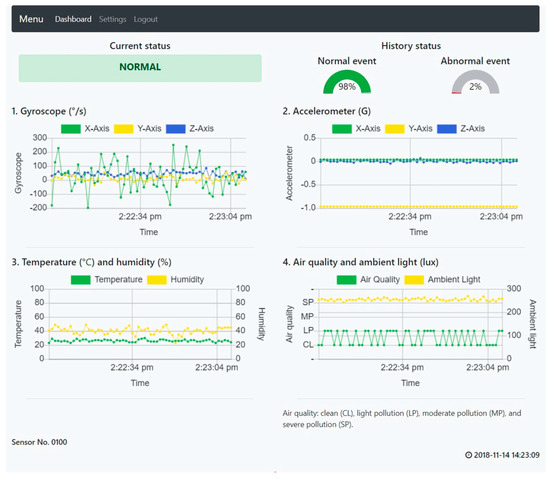
Figure 7.
AFEWS web dashboard.
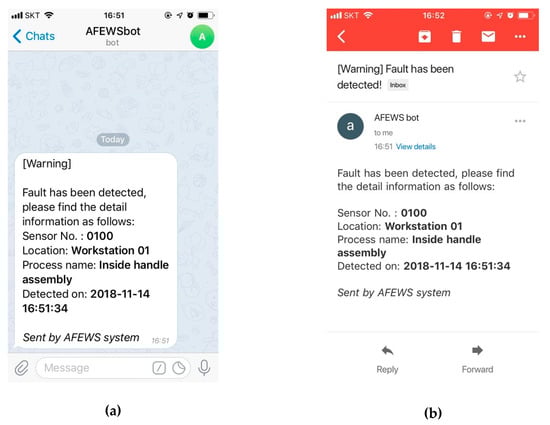
Figure 8.
Warning message from AFEWS to registered contact via (a) Telegram messenger and (b) email.
4. Results and Discussions
4.1. Edge Device Performance
This section discusses the proposed edge device performance. The edge devices combine several sensors and a client program to retrieve, store, and analyze sensor data. Previous studies utilized response time and CPU usage as performance metrics to evaluate IoT device performance [52,53]. We defined response time as the average time between sending sensor data from the source (client program) and successful delivery to the destination, i.e., the local database, and CPU usage as average CPU usage under different storing scenarios.
We used Python for the client program on edge devices that collected gyroscope, accelerometer, temperature, humidity, ambient light, and air quality data. Edge devices incorporated the Linux Raspbian OS Stretch and 1 GB RAM for the experiment. We set the client program to retrieve sensor data every 5 s with different storage periodicity into the local database: Scenarios I–V stored one data set every 5 s, two every 10 s, three every 15 s, four every 20 s, and five every 25 s, respectively. Hence, incoming sensor data was held in the client program before storage in the local database for scenarios 2–5. CPU usage was monitored over 2 min for each scenario.
Figure 9 shows the mean response time and CPU usage under the different scenarios. Response time significantly increased with increasing sensor data stored to the database, whereas CPU usage decreased. Thus, storing sensor data less frequently, e.g., scenario V, generated the least CPU usage. However, response time and CPU usage were less than 0.05 s and 0.5% for all scenarios, and scenario III provided optimal tradeoff between response time and CPU usage for this study, although this would requires case by case investigation for other implementations. Thus, the proposed edge device has sufficient capability to gather and store sensor data with relatively low CPU usage and response time.
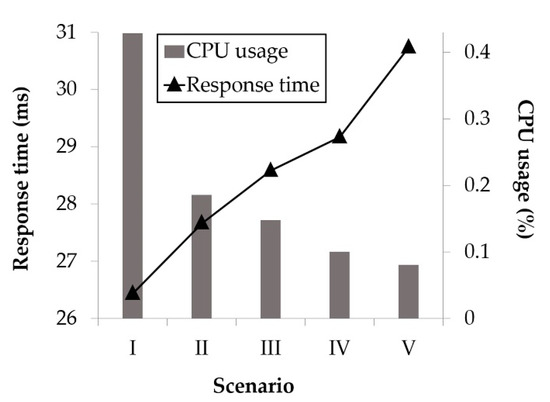
Figure 9.
Edge device performance in terms of response time and CPU usage for different storing periodicity. Scenario details are provided in the main text above.
4.2. Fault Model Performance
The proposed hybrid fault model was compared with several current classification models, as shown in Table 5. The proposed model outperformed all other considered models significantly for all of r, f, p, and a, providing 98.64% prediction accuracy.
Table 5.
Performance comparison of several classification models.
The proposed hybrid fault model combining DBSCAN, SMOTE, and RF provided improved classification accuracy. We investigated DBSCAN and SMOTE impacts for classification models, as shown in Figure 10. Applying DBSCAN and SMOTE improved classification accuracy for all models except logistic regression (LR), with 1.07% average improvement.
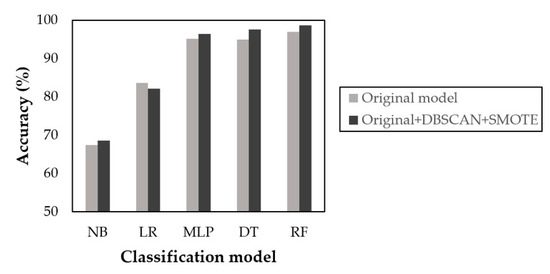
Figure 10.
DBSCAN and SMOTE impacts for classification accuracy. NB = Naïve Bayes, LR = logistic regression, MLP = multilayer perceptron, DT = decision tree, RF = random forest.
The generated hybrid fault model was installed onto the edge devices to provide fault prediction. Input gyroscope, accelerometer, temperature, humidity, ambient light, and air quality sensor data were then handled, processed, and analyzed in the edge device without requiring network communication with the cloud server, minimizing network costs, while simultaneously improving data processing and analysis speeds. The proposed AFEWS will help improve decision-making, as well as reduce or prevent unexpected losses caused by early stage faults.
4.3. Managerial Implications
There are three main management implications for the proposed AFEWS: Low-cost system development, assembly line monitoring, and improved decision-making due to timely fault warnings. The study utilized edge computing technology based on a Raspberry Pi SBC that offered small size, low cost, and sufficient processing power [54,55]. The edge device also included Sense Hat, DHT11, BH1750FVI, and ZP01-MP503 sensors, and provided a 16 GB micro SD memory card for local database storage of sensor and fault prediction data. The total cost for each edge device was approximately $91 [56,57,58,59,60,61], although prices may vary from different suppliers for each component. Therefore, the edge devices were considered to be cost effective.
Previous studies identified significant advantages to utilizing Raspberry Pi for similar scenarios, including secure and robust healthcare services [62], intelligent video surveillance platforms [63], building management systems [64], and beehive monitoring [65]. Edge computing benefits have been clarified by several studies to include reduced response time [66] and energy consumption [67]. Adopting OSS can also generate economic gains, including software development productivity, low investment cost (i.e., licenses), and external support availability [68,69,70].
Machine learning has been applied to manufacturing to differentiate carbon fiber fabric type [71], diagnose locomotion gait faults for reconfigurable robots [72], machine tool health status [73], early stage electrical fault detection in induction motors [74], sealing surface defect for chili oil production line [75], metallic surfaces for a flat metal component production line [76], aerospace deburring prediction [77], remaining turbofan engine useful life [78], etc. The present study adopted a machine learning model in the edge devices to detect fault events during assembly line process. Once a fault was detected, the proposed AFEWS sends a warning message to registered users via email and/or IM. Thus, managers can notice faults immediately and take action to prevent further losses. Results from the present study provide practical guidelines for industrial practitioners to develop edge devices and machine learning models for early warning systems into their manufacturing process.
5. Conclusions
We proposed AFEWS based on edge devices and hybrid fault model to identify faults during process in fast response. The present study adopted edge computing, enabling data collection and prediction within each edge device in fast response without requiring communication with a cloud server. The edge device incorporated several sensor devices and collected and processed sensor data to be subsequently analyzed on the edge device using a hybrid fault model. Input sensor data and prediction results are then presented to the web dashboard. When a fault is detected, warning messages can be immediately sent to identified managers for immediate action via the web dashboard, registered email addresses and IM (Telegram).
The proposed AFEWS system was based on a low-cost edge device capable of processing the sensor data in an acceptable time. Edge device performance was assessed using various metrics, including network delay and CPU usage. The proposed edge device provided an efficient solution for all experimental scenarios, successfully collecting, processing, and analyzing the sensor data within an acceptable time and low computation cost.
We implemented a hybrid fault model combining DBSCAN outlier detection, SMOTE, and RF classifier, which achieved highest accuracy compared to several common current classification models.
The proposed AFEWS was tested for four months operation at an actual production assembly line at a Korean automobile parts factory, and exhibited significant benefits by allowing managers to monitor the process status and identify process faults, preventing or significantly reducing unexpected losses.
Future studies will consider more comprehensive performance evaluations, and different scenarios, operations, and setup locations. Various abnormal events can be further identified, collected, and analyzed to extend the proposed model to learn from new complex datasets.
Author Contributions
Conceptualization, M.S. and J.R.; Methodology, M.S. and G.A.; Software, M.S.; Formal Analysis, N.L.F.; Data Curation, N.L.F.; Writing-Original Draft Preparation, M.S.; Writing-Review & Editing, M.S. and G.A.; Visualization, N.L.F.; Supervision, J.R.
Funding
This work was supported by International Collaborative Research and Development Program funded by the Ministry of Trade, Industry and Energy (MOTIE, Korea) (N0002259).
Acknowledgments
This paper is a tribute made out of deep respect of a wonderful person, friend, advisor, and supervisor, Yong-Han Lee (1965–2017).
Conflicts of Interest
The authors declare no conflict of interest.
References
- German Standardization Roadmap Industrie 4.0 Version 3. Available online: https://www.din.de/blob/65354/57218767bd6da1927b181b9f2a0d5b39/roadmap-i4-0-e-data.pdf (accessed on 29 November 2018).
- Lee, J.; Bagheri, B.; Kao, H.A. A cyber-physical systems architecture for industry 4.0-based manufacturing systems. Manuf. Lett. 2015, 3, 18–23. [Google Scholar] [CrossRef]
- Zhong, R.Y.; Xu, X.; Klotz, E.; Newman, S.T. Intelligent manufacturing in the context of industry 4.0: A review. Engineering 2017, 3, 616–630. [Google Scholar] [CrossRef]
- Armbrust, M.; Fox, A.; Griffith, R.; Joseph, A.D.; Katz, R.; Konwinski, A.; Lee, G.; Patterson, D.; Rabkin, A.; Stoica, I.; et al. A view of cloud computing. Commun. ACM 2010, 53, 50–58. [Google Scholar] [CrossRef]
- Fernando, N.; Loke, S.W.; Rahayu, W. Mobile cloud computing: A survey. Future Gener. Comput. Syst. 2013, 29, 84–106. [Google Scholar] [CrossRef]
- Stantchev, V.; Barnawi, A.; Ghulam, S.; Schubert, J.; Tamm, G. Smart items, fog and cloud computing as enablers of servitization in healthcare. Sens. Transducers 2015, 185, 121–128. [Google Scholar]
- Qiu, T.; Qiao, R.; Wu, D.O. EABS: An event-aware backpressure scheduling scheme for emergency Internet of Things. IEEE Trans. Mob. Comput. 2018. [Google Scholar] [CrossRef]
- Sood, S.K.; Mahajan, I. Fog-cloud based cyber-physical system for distinguishing, detecting and preventing mosquito borne diseases. Future Gener. Comput. Syst. 2018, 88, 764–775. [Google Scholar] [CrossRef]
- Soualhi, A.; Medjaher, K.; Zerhouni, N. Bearing health monitoring based on Hilbert–Huang transform, support vector machine, and regression. IEEE Trans. Instrum. Meas. 2015, 64, 52–62. [Google Scholar] [CrossRef]
- Chen, J.; Wang, T.; Gao, X.; Wei, L. Real-time monitoring of high-power disk laser welding based on support vector machine. Comput. Ind. 2018, 94, 75–81. [Google Scholar] [CrossRef]
- Lee, J.; Noh, S.D.; Kim, H.-J.; Kang, Y.-S. Implementation of Cyber-Physical Production Systems for Quality Prediction and Operation Control in Metal Casting. Sensors 2018, 18, 1428. [Google Scholar] [CrossRef]
- Yang, B.; Di, X.; Han, T. Random forests classifier for machine fault diagnosis. J. Mech. Sci. Technol. 2008, 22, 1716–1725. [Google Scholar] [CrossRef]
- Quiroz, J.C.; Mariun, N.; Mehrjou, M.R.; Izadi, M.; Misron, N.; Radzi, M.A.M. Fault detection of broken rotor bar in LS-PMSM using random forests. Measurement 2018, 116, 273–280. [Google Scholar] [CrossRef]
- Patel, R.K.; Giri, V.K. Feature selection and classification of mechanical fault of an induction motor using random forest classifier. Perspect. Sci. 2016, 8, 334–337. [Google Scholar] [CrossRef]
- Ester, M.; Kriegel, H.; Sander, J.; Xu, X. A density-based algorithm for discovering clusters in large spatial databases with noise. In Proceedings of the KDD’96 Second International Conference on Knowledge Discovery and Data Mining, Portland, OR, USA, 2–4 August 1996. [Google Scholar]
- Chawla, N.V.; Bowyer, K.W.; Hall, L.O.; Kegelmeyer, W.P. SMOTE: Synthetic Minority Over-Sampling Technique. J. Artif. Intell. Res. 2002, 16, 321–357. [Google Scholar] [CrossRef]
- Yousefian-Jazi, A.; Ryu, J.H.; Yoon, S.; Liu, J.J. Decision support in machine vision system for monitoring of TFT-LCD glass substrates manufacturing. J. Process Control 2014, 24, 1015–1023. [Google Scholar] [CrossRef]
- Kim, J.; Han, Y.; Lee, J. Data Imbalance Problem solving for SMOTE Based Oversampling: Study on Fault Detection Prediction Model in Semiconductor Manufacturing Process. Adv. Sci. Technol. Lett. 2016, 133, 79–84. [Google Scholar]
- Ijaz, M.F.; Alfian, G.; Syafrudin, M.; Rhee, J. Hybrid Prediction Model for Type 2 Diabetes and Hypertension Using DBSCAN-Based Outlier Detection, Synthetic Minority Over Sampling Technique (SMOTE), and Random Forest. Appl. Sci. 2018, 8, 1325. [Google Scholar] [CrossRef]
- Shi, W.; Cao, J.; Zhang, Q.; Li, Y.; Xu, L. Edge computing: Vision and challenges. IEEE Internet Things J. 2016, 3, 637–646. [Google Scholar] [CrossRef]
- Ferrández-Pastor, F.-J.; Mora, H.; Jimeno-Morenilla, A.; Volckaert, B. Deployment of IoT Edge and Fog Computing Technologies to Develop Smart Building Services. Sustainability 2018, 10, 3832. [Google Scholar] [CrossRef]
- Wu, D.; Liu, S.; Zhang, L.; Terpenny, J.; Gao, R.X.; Kurfess, T.; Guzzo, J.A. A fog computing-based framework for process monitoring and prognosis in cyber-manufacturing. J. Manuf. Syst. 2017, 43, 25–34. [Google Scholar] [CrossRef]
- Petrali, P.; Isaja, M.; Soldatos, J.K. Edge Computing and Distributed Ledger Technologies for Flexible Production Lines: A White-Appliances Industry Case. IFAC Pap. 2018, 51, 388–392. [Google Scholar] [CrossRef]
- Hu, L.; Miao, Y.; Wu, G.; Hassan, M.M.; Humar, I. iRobot-Factory: An intelligent robot factory based on cognitive manufacturing and edge computing. Future Gener. Comput. Syst. 2019, 90, 569–577. [Google Scholar] [CrossRef]
- Tao, F.; Qi, Q.; Liu, A.; Kusiak, A. Data-driven smart manufacturing. J. Manuf. Syst. 2018, 48 Pt C, 157–169. [Google Scholar] [CrossRef]
- Shin, K.; Abraham, A.; Han, S.Y. Improving kNN text categorization by removing outliers from training set. In Proceedings of the International Conference on Intelligent Text Processing and Computational Linguistics, Mexico City, Mexico, 19–25 February 2006; pp. 563–566. [Google Scholar]
- Tallón-Ballesteros, A.J.; Riquelme, J.C. Deleting or keeping outliers for classifier training? In Proceedings of the 2014 Sixth World Congress on Nature and Biologically Inspired Computing (NaBIC 2014), Porto, Portugal, 30 July–1 August 2014; pp. 281–286. [Google Scholar]
- Han, J.; Kamber, M.; Pei, J. Data Mining: Concepts and Techniques, 3rd ed.; Morgan Kaufmann Publishers: Burlington, MA, USA, 2011. [Google Scholar]
- Alfian, G.; Syafrudin, M.; Rhee, J. Real-Time Monitoring System Using Smartphone-Based Sensors and NoSQL Database for Perishable Supply Chain. Sustainability 2017, 9, 2073. [Google Scholar] [CrossRef]
- Thang, T.M.; Kim, J. The Anomaly Detection by Using DBSCAN Clustering with Multiple Parameters. In Proceedings of the 2011 International Conference on Information Science and Applications, Jeju Island, Korea, 23 May 2011; pp. 1–5. [Google Scholar]
- Chen, Z.; Li, Y.F. Anomaly Detection Based on Enhanced DBScan Algorithm. Procedia Eng. 2011, 15, 178–182. [Google Scholar] [CrossRef]
- ElBarawy, Y.M.; Mohamed, R.F.; Ghali, N.I. Improving social network community detection using DBSCAN algorithm. In Proceedings of the 2014 World Symposium on Computer Applications & Research (WSCAR), Sousse, Tunisia, 18–20 January 2014; pp. 1–6. [Google Scholar]
- Johnston, S.J.; Basford, P.J.; Perkins, C.S.; Herry, H.; Tso, F.P.; Pezaros, D.; Mullins, R.D.; Yoneki, E.; Cox, S.J.; Singer, J. Commodity single board computer clusters and their applications. Future Gener. Comput. Syst. 2018, 89, 201–212. [Google Scholar] [CrossRef]
- Raspberry Pi 3 Model B. Available online: https://www.raspberrypi.org/products/raspberry-pi-3-model-b/ (accessed on 12 November 2018).
- BeagleBoard. Available online: https://beagleboard.org/beagleboard (accessed on 12 November 2018).
- Upton, E.; Halfacree, G. Raspberry Pi User Guide, 4th ed.; Wiley: Sebastopol, CA, USA, 2016. [Google Scholar]
- Sense Hat. Available online: https://www.raspberrypi.org/products/sense-hat/ (accessed on 12 November 2018).
- DHT11 Humidity & Temperature Sensor. Available online: https://www.mouser.com/ds/2/758/DHT11-Technical-Data-Sheet-Translated-Version-1143054.pdf (accessed on 12 November 2018).
- Ambient Light Sensor. Available online: https://www.mouser.com/ds/2/348/bh1750fvi-e-186247.pdf (accessed on 12 November 2018).
- Air-Quality Detection Module. Available online: https://www.openhacks.com/uploadsproductos/zp01-mp503_air_quality_module_v1.4.pdf (accessed on 12 November 2018).
- Syafrudin, M.; Alfian, G.; Fitriyani, N.L.; Rhee, J. Performance Analysis of IoT-Based Sensor, Big Data Processing, and Machine Learning Model for Real-Time Monitoring System in Automotive Manufacturing. Sensors 2018, 18, 2946. [Google Scholar] [CrossRef]
- MongoDB Drivers and Client Libraries. Available online: https://docs.mongodb.com/manual/applications/drivers/ (accessed on 13 November 2018).
- Chodorow, K. MongoDB: The Definitive Guide, 2nd ed.; O’Reilly Media, Inc.: Sebastopol, CA, USA, 2013. [Google Scholar]
- Raspbian OS. Available online: https://www.raspberrypi.org/downloads/raspbian/ (accessed on 13 November 2018).
- PyMongo 3.7.2 Documentation. Available online: http://api.mongodb.com/python/current/index.html (accessed on 13 November 2018).
- Breiman, L. Random Forests. Mach. Learn. 2001, 45, 5–32. [Google Scholar] [CrossRef]
- The R Project for Statistical Computing. Available online: https://www.r-project.org/ (accessed on 19 November 2018).
- Weka 3: Data Mining Software in Java. Available online: https://www.cs.waikato.ac.nz/ml/weka/ (accessed on 19 November 2018).
- Germain, P.; Lacasse, A.; Laviolette, F.; Marchand, M.; Roy, J.-F. Risk bounds for the majority vote: From a PAC-Bayesian analysis to a learning algorithm. J. Mach. Learn. Res. 2015, 16, 787–860. [Google Scholar]
- Liu, B. Web Data Mining: Exploring Hyperlinks, Contents, and Usage Data; Springer: Berlin/Heidelberg, Germany, 2011. [Google Scholar]
- Telegram Messenger. Available online: https://telegram.org/ (accessed on 12 November 2018).
- Gomes, M.M.; Righi, R.D.R.; da Costa, C.A. Future directions for providing better IoT infrastructure. In Proceedings of the 2014 ACM International Joint Conference on Pervasive and Ubiquitous Computing: Adjunct Publication, Seattle, WA, USA, 13–17 September 2014; pp. 51–54. [Google Scholar]
- Wang, X.; Zhang, J.; Schooler, E.M.; Ion, M. Performance evaluation of attribute-based encryption: Toward data privacy in the IoT. In Proceedings of the 2014 IEEE International Conference on Communications (ICC), Sydney, NSW, Australia, 10–14 June 2014; pp. 725–730. [Google Scholar]
- Cloutier, M.F.; Paradis, C.; Weaver, V.M. A Raspberry Pi Cluster Instrumented for Fine-Grained Power Measurement. Electronics 2016, 5, 61. [Google Scholar] [CrossRef]
- Lewis, A.J.; Campbell, M.; Stavroulakis, P. Performance evaluation of a cheap, open source, digital environmental monitor based on the Raspberry Pi. Measurement 2016, 87, 228–235. [Google Scholar] [CrossRef]
- Raspberry Pi 3 Model B. Available online: https://www.aliexpress.com/item/Raspberry-Pi-3-Model-B-Board-1GB-LPDDR2-BCM2837-Quad-Core-Ras-PI3-B-PI-3B/32840219179.html (accessed on 3 December 2018).
- Raspberry Pi 3 Sense HAT. Available online: https://www.aliexpress.com/item/2017-Official-Raspberry-Pi-3-Sense-HAT-with-Orientation-Pressure-Humidity-and-Temperature-Sensors-Humidity-Sensors/32815314943.html (accessed on 3 December 2018).
- DHT-11 Digital Temperature and Humidity Temperature Sensor. Available online: https://www.aliexpress.com/item/Free-Shipping-1x-DHT11-DHT-11-Digital-Temperature-and-Humidity-Temperature-sensor-for-Arduino-Hot/32243034419.html (accessed on 3 December 2018).
- BH1750FVI Light Intensity Illumination Module 3 V–5 V. Available online: https://www.aliexpress.com/item/GY-302-BH1750-BH1750FVI-light-intensity-illumination-module-for-arduino-3V-5V/32341898423.html (accessed on 3 December 2018).
- Air Quality Sensor Module ZP01 MP503. Available online: https://www.aliexpress.com/item/Free-shipping-air-quality-sensor-module-ZP01-MP503-air-pollution-module/32811974382.html (accessed on 3 December 2018).
- Micro SD Memory Card 16 G. Available online: https://www.aliexpress.com/item/SAMSUNG-TF-Micro-SD-Memory-Card-32G-64G-MicroSD-Cards-SDHC-SDXC-Max-95M-s-EVO/32950926892.html (accessed on 3 December 2018).
- Yeh, K.-H. BSNCare+: A Robust IoT-Oriented Healthcare System with Non-Repudiation Transactions. Appl. Sci. 2016, 6, 418. [Google Scholar] [CrossRef]
- Abbas, N.; Yu, F.; Fan, Y. Intelligent Video Surveillance Platform for Wireless Multimedia Sensor Networks. Appl. Sci. 2018, 8, 348. [Google Scholar] [CrossRef]
- Chang, K.-M.; Dzeng, R.-J.; Wu, Y.-J. An Automated IoT Visualization BIM Platform for Decision Support in Facilities Management. Appl. Sci. 2018, 8, 1086. [Google Scholar] [CrossRef]
- Kulyukin, V.; Mukherjee, S.; Amlathe, P. Toward Audio Beehive Monitoring: Deep Learning vs. Standard Machine Learning in Classifying Beehive Audio Samples. Appl. Sci. 2018, 8, 1573. [Google Scholar] [CrossRef]
- Yi, S.; Hao, Z.; Qin, Z.; Li, Q. Fog computing: Platform and applications. In Proceedings of the 2015 Third IEEE Workshop on Hot Topics in Web Systems and Technologies (HotWeb), Washington, DC, USA, 12–13 November 2015; pp. 73–78. [Google Scholar]
- Ha, K.; Chen, Z.; Hu, W.; Richter, W.; Pillai, P.; Satyanarayanan, M. Towards wearable cognitive assistance. In Proceedings of the 12th Annual International Conference on Mobile Systems, Applications, and Services, Bretton Woods, NH, USA, 16–19 June 2014; pp. 68–81. [Google Scholar]
- Ajila, S.A.; Wu, D. Empirical study of the effects of open source adoption on software development economics. J. Syst. Softw. 2007, 80, 1517–1529. [Google Scholar] [CrossRef]
- Ven, K.; Verelst, J. The Organizational Adoption of Open Source Server Software by Belgian Organizations. In Proceedings of the IFIP International Conference on Open Source Systems, Como, Italy, 8–10 June 2006; Springer: Boston, MA, USA, 2006; pp. 111–122. [Google Scholar]
- Syafrudin, M.; Fitriyani, N.L.; Li, D.; Alfian, G.; Rhee, J.; Kang, Y.S. An Open Source-Based Real-Time Data Processing Architecture Framework for Manufacturing Sustainability. Sustainability 2017, 9, 2139. [Google Scholar] [CrossRef]
- Zhao, M.; Li, Z.; He, W. Classifying Four Carbon Fiber Fabrics via Machine Learning: A Comparative Study Using ANNs and SVM. Appl. Sci. 2016, 6, 209. [Google Scholar] [CrossRef]
- Elangovan, K.; Krishnasamy Tamilselvam, Y.; Mohan, R.E.; Iwase, M.; Takuma, N.; Wood, K.L. Fault Diagnosis of a Reconfigurable Crawling–Rolling Robot Based on Support Vector Machines. Appl. Sci. 2017, 7, 1025. [Google Scholar] [CrossRef]
- Huang, Y.-C.; Kao, C.-H.; Chen, S.-J. Diagnosis of the Hollow Ball Screw Preload Classification Using Machine Learning. Appl. Sci. 2018, 8, 1072. [Google Scholar] [CrossRef]
- Xu, Z.; Hu, C.; Yang, F.; Kuo, S.H.; Goh, C.K.; Gupta, A.; Nadarajan, S. Data-driven inter-turn short circuit fault detection in induction machines. IEEE Access 2017, 5, 25055–25068. [Google Scholar] [CrossRef]
- Li, Y.; Huang, H.; Xie, Q.; Yao, L.; Chen, Q. Research on a Surface Defect Detection Algorithm Based on MobileNet-SSD. Appl. Sci. 2018, 8, 1678. [Google Scholar] [CrossRef]
- Tao, X.; Zhang, D.; Ma, W.; Liu, X.; Xu, D. Automatic Metallic Surface Defect Detection and Recognition with Convolutional Neural Networks. Appl. Sci. 2018, 8, 1575. [Google Scholar] [CrossRef]
- Caesarendra, W.; Pappachan, B.K.; Wijaya, T.; Lee, D.; Tjahjowidodo, T.; Then, D.; Manyar, O.M. An AWS Machine Learning-Based Indirect Monitoring Method for Deburring in Aerospace Industries Towards Industry 4.0. Appl. Sci. 2018, 8, 2165. [Google Scholar] [CrossRef]
- Zhang, A.; Wang, H.; Li, S.; Cui, Y.; Liu, Z.; Yang, G.; Hu, J. Transfer Learning with Deep Recurrent Neural Networks for Remaining Useful Life Estimation. Appl. Sci. 2018, 8, 2416. [Google Scholar] [CrossRef]
© 2018 by the authors. Licensee MDPI, Basel, Switzerland. This article is an open access article distributed under the terms and conditions of the Creative Commons Attribution (CC BY) license (http://creativecommons.org/licenses/by/4.0/).