Article

Effects of Water Reducing Admixture on Rheological Properties, Fiber Distribution, and Mechanical Behavior of UHPFRC

1
Department of Civil Engineering, Daegu University, 201 Daegudae-ro, Jillyang, Gyeongsan, Gyeongbuk 38453, Korea
2
Department of Civil and Environmental Engineering, Korea Advanced Institute of Science and Technology (KAIST), 291 Daehak-ro, Yuseong-gu, Daejeon 34141, Korea
3
School of Architecture, Chonnam National University, 77 Yongbong-ro, Buk-gu, Gwangju 61186, Korea
*
Author to whom correspondence should be addressed.
Appl. Sci. 2019, 9(1), 29; https://doi.org/10.3390/app9010029
Submission received: 5 December 2018 / Revised: 18 December 2018 / Accepted: 20 December 2018 / Published: 22 December 2018
(This article belongs to the Section Materials Science and Engineering)

Abstract

:
The rheological properties of ultra-high-performance fiber-reinforced concrete (UHPFRC) according to the amount of water reducing admixture (WRA) and their effects on the fiber distribution and the tensile performance of UHPFRC were investigated. Four types of mixtures with a high compressive strength over 150 MPa were designed according to the amount of WRA and the flowability, rheological properties, compressive strength, flexural performance, and fiber distribution were measured. Test results showed that the amount of WRA influences both the freshly mixed and hardened properties. It was also revealed that the flexural strength has a strong correlation with rheological properties, compressive strength, and fiber distribution.

1. Introduction

Concrete and other cement-based materials are widely used as construction materials due to their remarkable economic efficiency and durability [1,2,3,4]. However, they are prone to cracking due to their low tensile strength and low strain capacity at fracture, and the inherently brittle nature may cause unexpected failure at the ultimate state. These drawbacks are traditionally overcome by introducing the concept of reinforced concrete with embedded reinforcing steel bars, which are continuous and designed to be specifically located in the structure to optimize its performance.
Fiber reinforced concrete (FRC) with discontinuous short fibers was also developed as an alternative for the same purpose. FRC is a competitive and useful construction material because fibers in the FRC resist crack propagation with the help of stress transfer from the matrix to the fiber and furthermore its fabrication process is flexible and simple. Since the first major investigation of steel fiber reinforced concrete (SFRC) was conducted in the early 1960s in order to improve its brittleness [5], numerous studies on the SFRC and its applications have been carried out [6,7,8,9]. Among various kinds of SFRCs developed to date, ultra-high-performance fiber-reinforced concrete (UHPFRC) exhibits excellent mechanical performance [10,11,12,13]. It has extremely high compressive strength over 150 MPa with a very low water-to-binder ratio as well as excellent toughness and energy absorption capacity by adding less than 2 vol% of steel fibers [14,15,16,17,18].
The mechanical properties of general SFRC are dependent on the fiber properties (geometry, volume fraction, tensile strength, orientation, etc.) [19,20,21,22,23], the concrete properties (strength, elastic modulus, aggregate size, etc.) [23,24,25,26], and the properties of the interface between the fiber and the matrix [27,28,29]. When the concrete properties are constant, the tensile performance of SFRC is primarily dependent on the geometry, volume fraction, and distribution of fiber. The general tensile strength of steel fibers used for SFRC is sufficiently high to avoid rupture, and thus the effect of tensile strength is usually negligible. Consequently, the analytical models for the tensile strength or principal characteristics of the tensile behavior of SFRC are generally expressed as a function of the fiber volume, the aspect ratio (defined as the ratio of the fiber length to the diameter), and the fiber orientation [23,30,31,32]. The first two parameters are determined in the step of mix design, whereas the other is related to the form geometry and the placing method.
With regard to ultra-high-performance fiber-reinforced concrete (UHPFRC), there have been extensive studies on the effect of fiber orientation on the tensile performance [20,21,33,34,35,36,37]. The effect of fiber orientation is much more significant in UHPFRC than in normal SFRC. This is mainly due to its high homogeneity with a composition of fine solid particles with a maximum particle size of 0.5 mm and sufficient flowability enough for self-consolidating. To produce highly flowable UHPFRC with a very low water to binder ratio, water reducing admixture is inevitably required in the mix.
The rheological properties of UHPFRC are controlled by to the amount and type of the water reducing admixture (WRA) [38,39], and they have a significant influence on the fiber distribution determined during the process of placing and flowing of UHPFRC [40,41,42]. This sequential influence is eventually connected to the mechanical performance of the composites [35,36,37]. Meanwhile, fresh UHPFRC shows considerably higher viscosity than normal SFRC or plain concrete, which may have a positive effect of improving the fiber distribution as well as a negative effect of worsening workability such as handling, delivering, and placing. This means that it is necessary to control the rheological properties of UHPFRC for balancing a better fiber dispersion with an acceptable workability. Furthermore, a high amount of WRA may influence the strength of UHPFRC, and the fiber distribution is influenced by the placing method of UHPFRC. In this light, it is needed to investigate the effect of the amount of WRA on the fresh property, mechanical properties, and fiber distribution more systematically. Therefore, this study was performed to investigate systematically the relationship between the rheological properties, fiber distribution, compressive strength, and flexural strength of UHPFRC under controlled fabrication of the material.

2. Materials and Methods

2.1. Materials and Mixture Proportions

To investigate the effect of the rheological properties of fresh UHPFRC on the fiber distribution and the mechanical properties of hardened UHPFRC, four types of UHPFRC mix proportions were considered, where the proportions were designed to obtain different rheological properties by adding different dosages of WRA. The mix proportions of UHPFRC are listed in Table 1. The water-to-binder ratio of the UHPFRC mix design was set as 0.2. Type I Portland cement and undensified silica fume were used as the cementitious material. Quartz sand was used as a fine aggregate. It has a grain size distribution with a maximum diameter of 0.5 mm and a density of 2.62 g/cm3. The filler used for improving the strength and workability had a mean grain size of approximately 4 μm, density of 2.62 g/cm3, and crystalline SiO2 over 98%. Two types of straight steel fibers with lengths of 16.3 mm and 19.5 mm were incorporated. The tensile strength, density, and diameter of the steel fibers were 2,500 MPa, 7.5 g/cm3, and 0.2 mm, respectively. The amount of fiber with a length of 16.3 mm was 1 vol% and the amount of fiber with a length of 19.5 mm was also 1 vol%. A polycarboxylate-based superplasticizer was used for the WRA. Its density was 1.01 g/cm3 and the solid content was 30%. Four different amounts of WRA were applied for the mix design. The weight percentage of solid content of WRA to cement was designed to be 1.2%, 1.8%, 2.4%, and 3.0% for Mix 1 to Mix 4. Unit water content was decreased as the amount of WRA was increased in the mix design.

2.2. Rheological Tests

The flowability and the rheological properties of four types of UHPFRC mixtures were evaluated. The flowability, the mini-slump flow, was measured using a mini-slump cone specified in ASTM C 1437 [43], and the rheological properties were obtained by using a rotational rheometer with a vane-type spindle, which was adopted to prevent segregation of the fibers from the cementitious matrix during measurement. Figure 1 shows the rheometer and the protocol of the rheology test. After a 20 second pause, the rotational speed was increased from 0 to 19 rpm (rotation per minute) with an increment of 1.9 rpm every 20 seconds. After reaching the highest rotational speed, it was decreased to zero with the same step and interval. From the rheology test, flow curves, which are expressed as a relation between shear stress ( τ ) and shear rate ( γ ˙ ), were obtained. The viscosity ( μ ) and yield stress ( τ 0 ) were then calculated by a linear regression analysis using the Bingham model ( τ = τ 0 + μ γ ˙ ), which is chosen because it is generally appropriate to characterize the flow behavior of cement-based material [44].
To estimate the effect of the amount of water reducing admixture on the mechanical performance of UHPFRC, compressive strength and flexural tests were performed. The compressive strength was measured with cylindrical specimens with a diameter of 100 mm and a height of 200 mm according to ASTM C 39 [45]. The flexural test was carried out with 100 × 100 × 500 mm3 beam specimens. When the beam specimens were fabricated, fresh UHPFRC was placed at one end of the form and flowed itself toward the other end, inducing shear flow of the matrix as shown in Figure 2. This consistency in placing is important to avoid variation of the flexural performance according to differences in the placing method, and consequently to precisely investigate the effect of rheological properties on the flexural performance. All the prepared specimens were cured in air at room temperature for 48 h and demolded. They were then cured in hot water with a temperature of (90 ± 3) °C for 72 h. The specimens were subsequently stored in water with a temperature of (20 ± 3) °C until testing.
To evaluate the flexural performance, a three-point bending test was conducted with a notch at the midspan of the specimen. The span length for the test was 300 mm. The depth of the notch was 10 mm and the width was 3 mm. A loading rate of 0.3 mm/min was applied for the test. During the test, the crack mouth opening displacement (CMOD) at the notch was measured by a clip gauge and the central deflection was measured using a linear variable differential transducer. Figure 3 shows the three-point bending test set-up with the notched beam.

2.4. Fiber Distribution Evaluation

A quantitative evaluation of the fiber distribution including the fiber dispersion and fiber orientation was also carried out to investigate the effect of the rheological properties on the fiber distribution. If there is a flow velocity gradient, as shown in Figure 4, rigid fibers submerged in the fluid rotate due to the velocity gradient. The velocity profile of a fluid is obviously dependent on the rheological properties of the fluid, and then the rotational movement is naturally influenced by the rheological properties of the fluid [46,47]. The fiber dispersion indicates whether the change in the rheology according to the amount of WRA causes any sediment or agglomeration of fibers.
The fiber dispersion and orientation were evaluated using an image analysis technique [35]. After finishing the flexural test, the tested beam specimens were seen at locations near the flow starting point and near the midspan. The former is 35 mm away from the end of specimen where fresh UHPFRC was placed and the latter is 220 mm away from the end. To obtain a sound section without cracks, which are supposed to be formed along the notch in the flexural test, the images at the midspan section were not used for the analysis.
The fiber dispersion was quantified with the coefficient ( α f ) defined as follows [40]:
α f = exp { ( x i 1 ) 2 n f   } ,
where n f denotes the total number of fibers detected on the image and x i describes the number of fibers detected in the i-th sector when the whole image area was divided into several sectors of an equivalent square area. α f close to 1 indicates a homogeneous dispersion of fibers, and 0 for α f means a deeply biased dispersion of fibers.
For the evaluation of the fiber orientation distribution, the fiber orientation coefficient ( η θ ) was introduced. The fiber orientation distribution was first measured by calculating the inclination of each fiber on the image. The coefficient was then calculated by the following equation [48]:
η θ = 0 π / 2 p ( θ ) cos 2 θ   d θ ,
where p ( θ ) is the measured fiber orientation distribution. If all the fibers are perfectly aligned in a direction, the fiber orientation coefficient ( η θ ) to the direction is equal to 1.

3. Results and Discussion

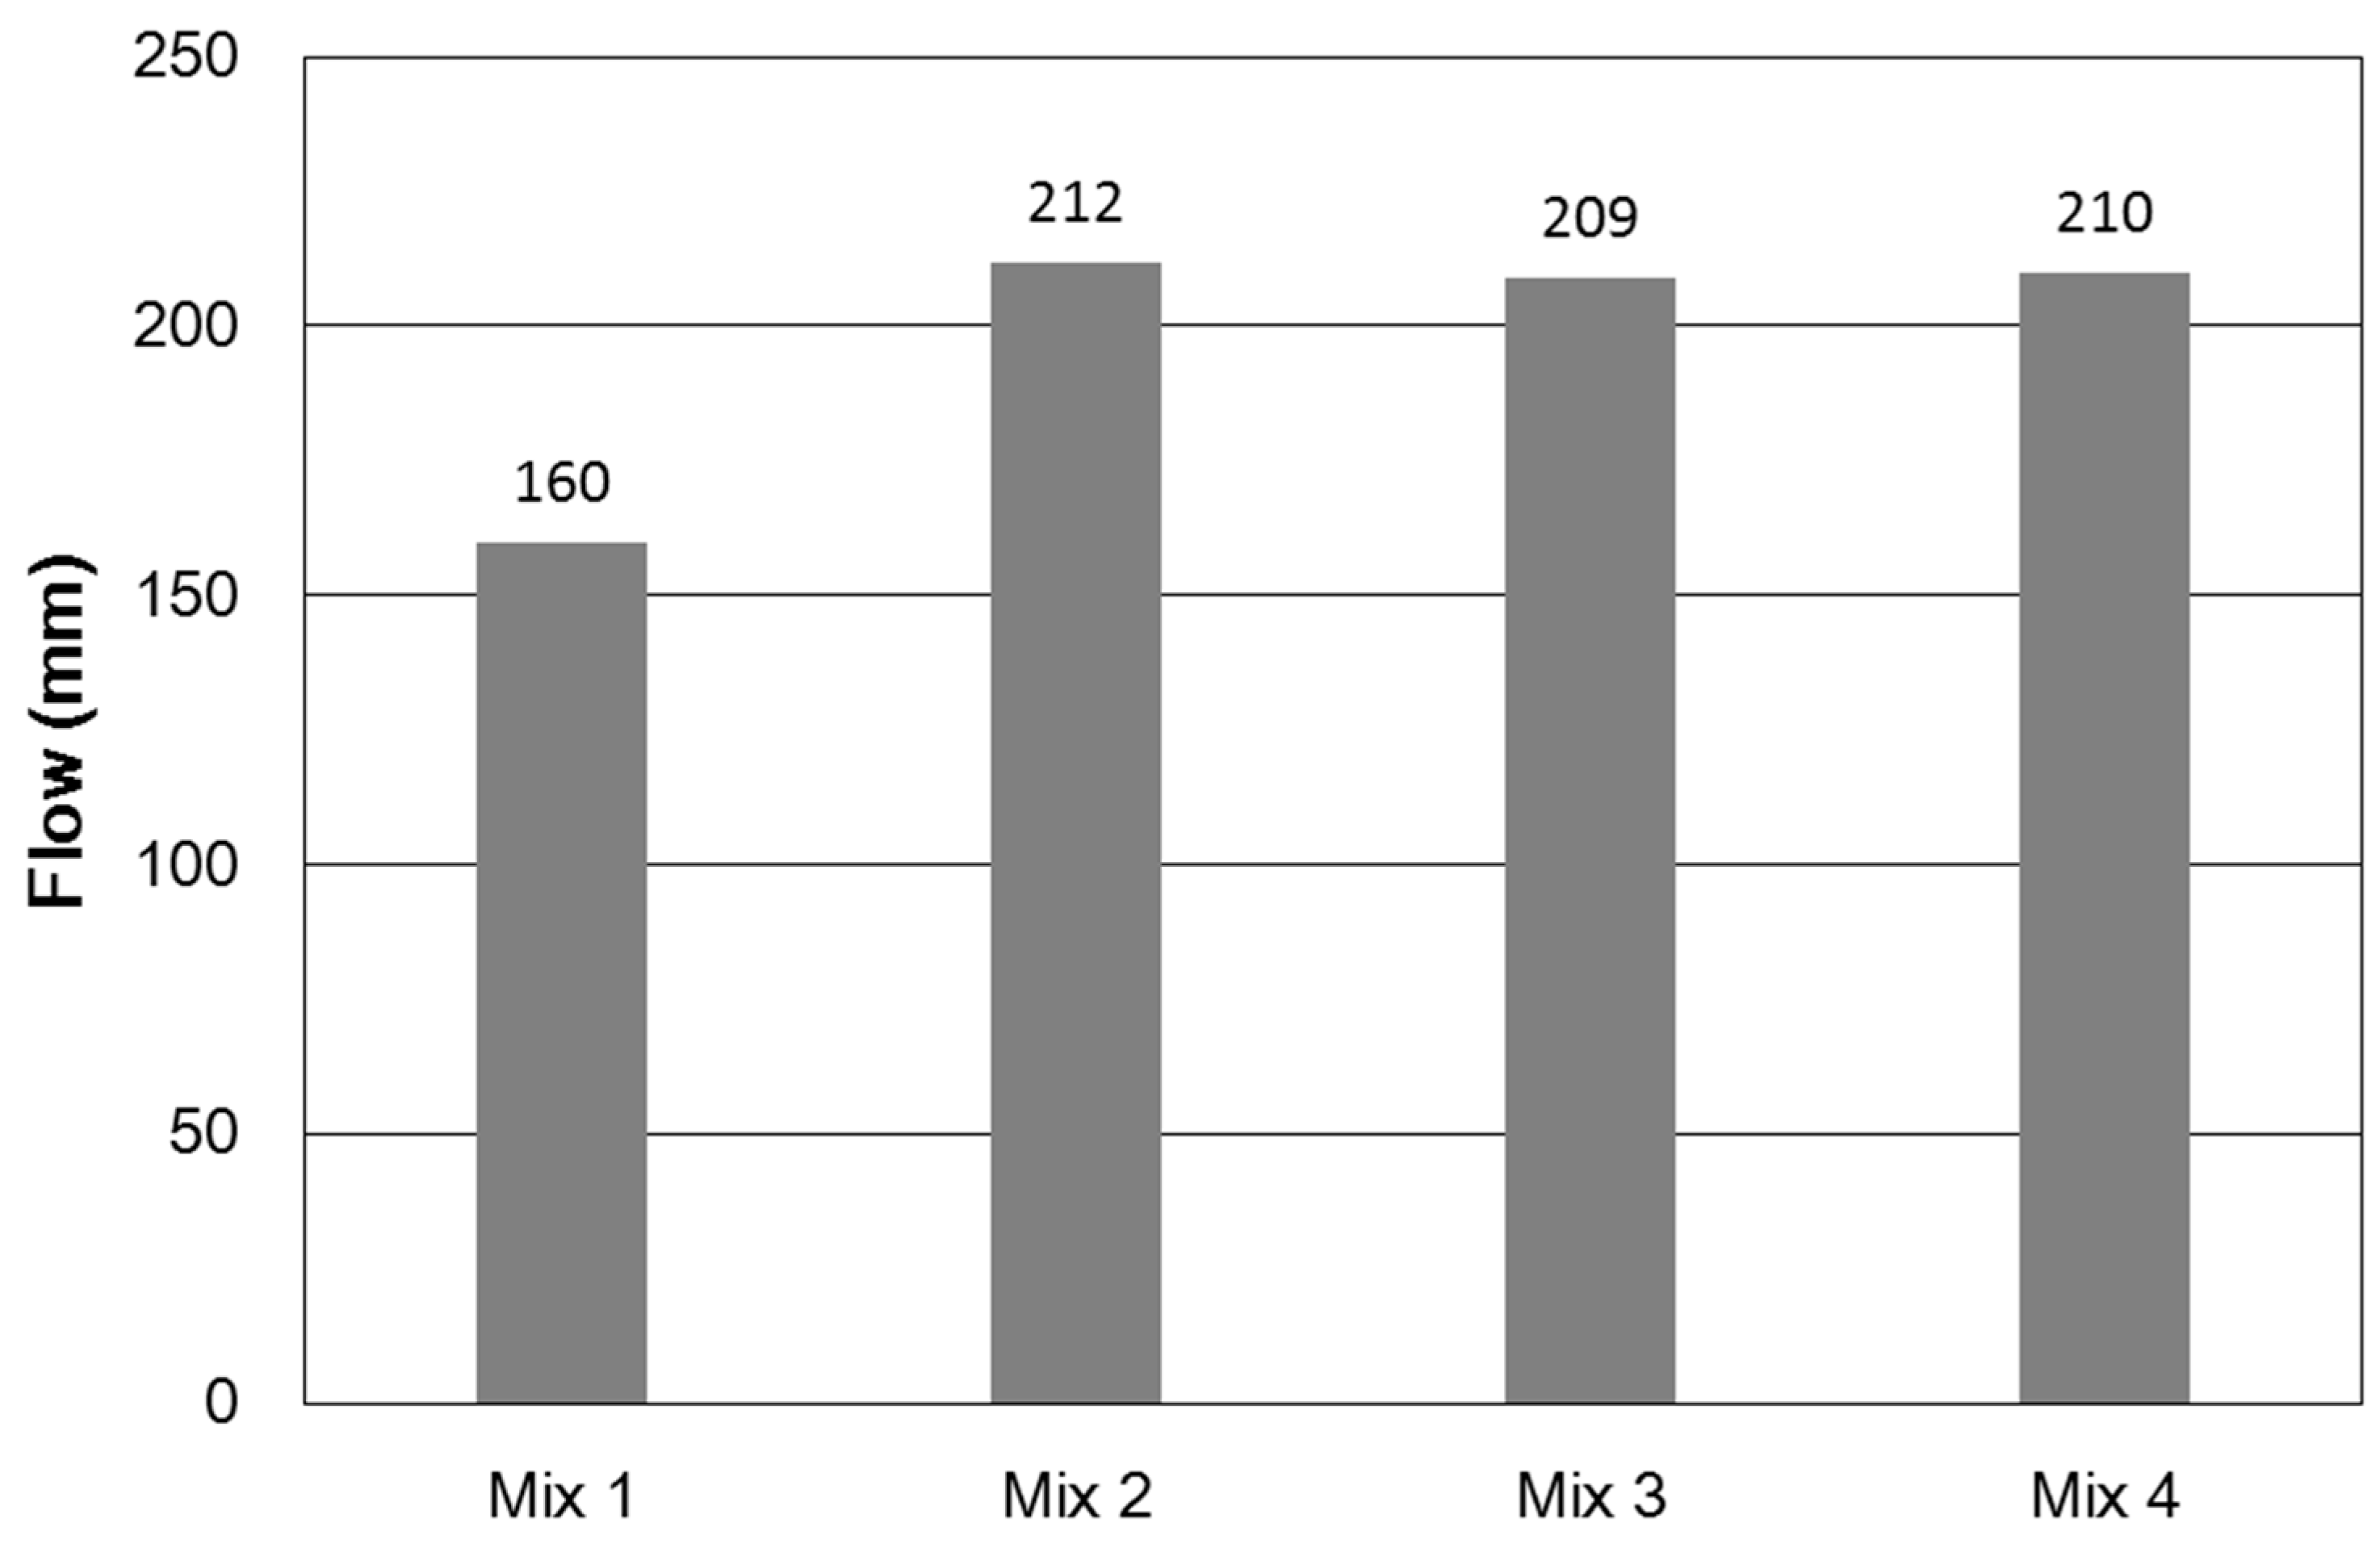
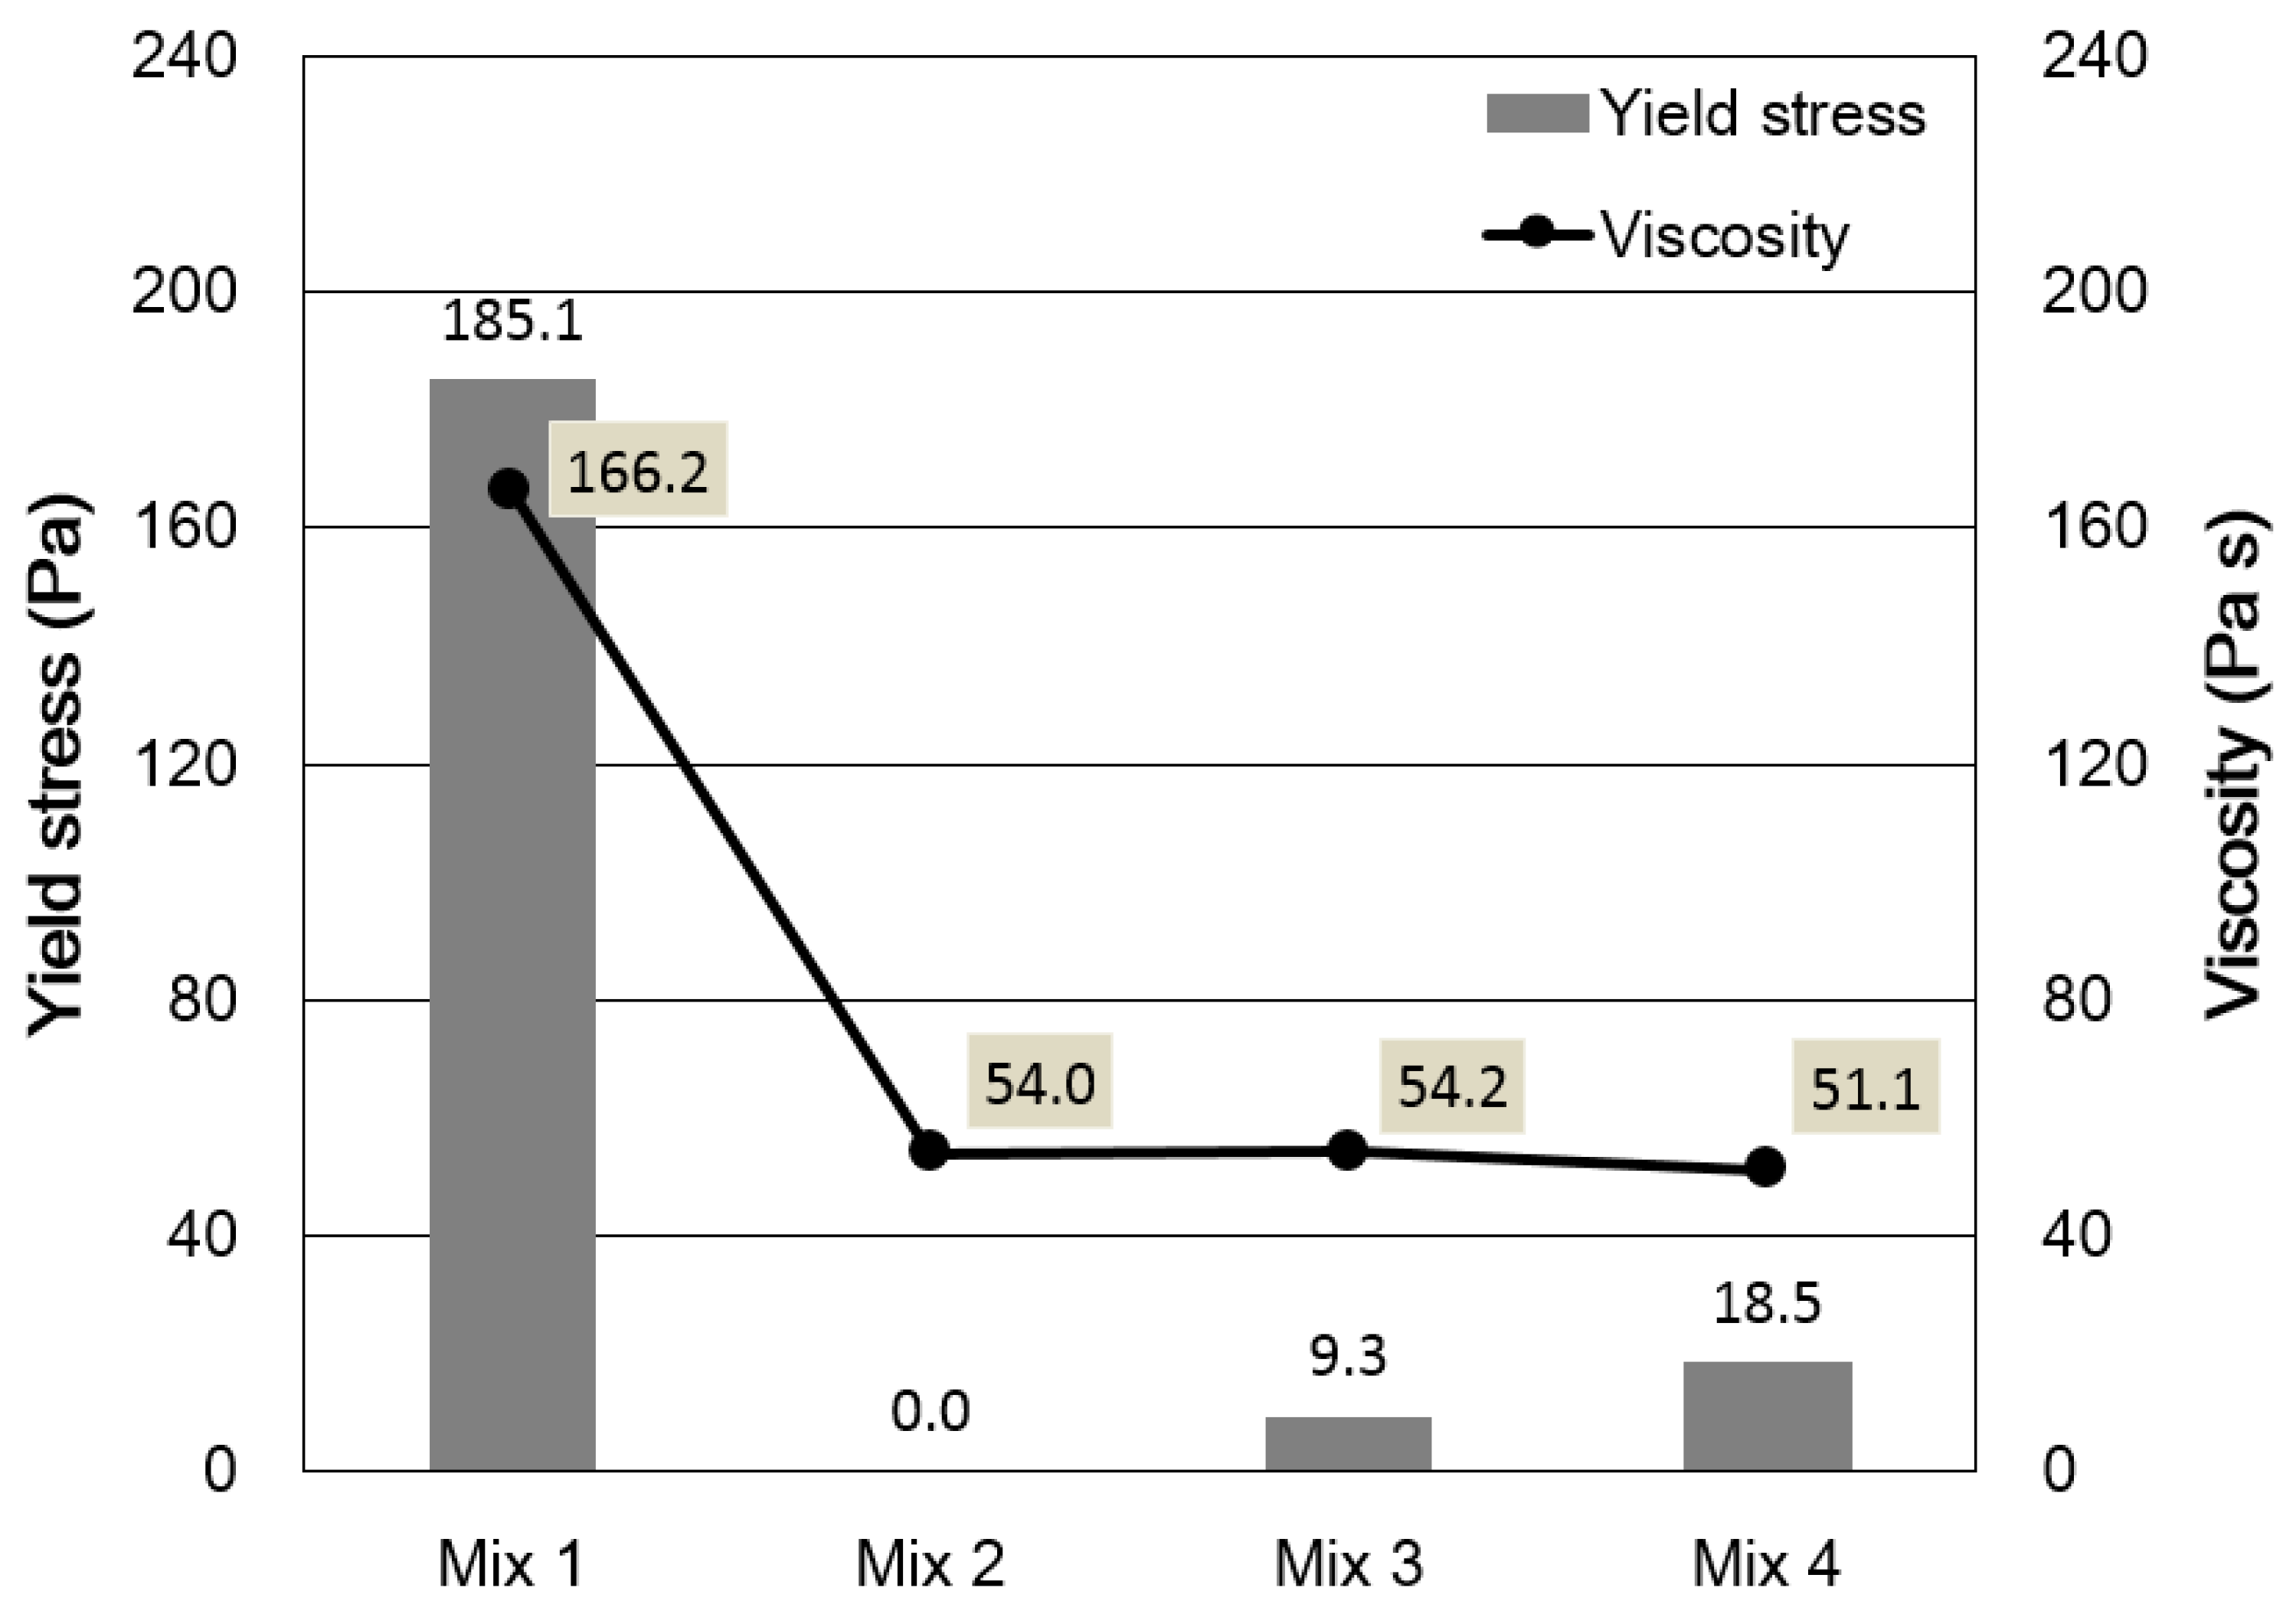
3.1. Rheological Properties

Figure 5 shows the mini-slump flow test results of each mixture. As expected, Mix 1, which has the smallest amount of WRA, showed the minimum flow value. On the other hand, other mixtures showed flowabilty higher than 200 mm and the amount of WRA had little influence on the flowability. For all the mixtures, segregation was not observed. The tendency in the flow test results was found to be very similar in the rheological properties measured from the rheology test. Figure 6 shows the measured yield stress and plastic viscosity of each mixture. The yield stress of Mix 1 was 185 Pa and its plastic viscosity was 166 Pa s, whereas the yield stress values of Mixes 2–4 were in a range of 0–18.5 Pa and their plastic viscosity values were between 51 Pa s and 55 Pa s. Comparing the measured rheological properties of all the mixes, it can be clearly found that both the yield stress and plastic viscosity of Mix 1 were much higher than those of the other mixes, and Mixes 2–4 showed no noticeable difference in the rheological properties. These results indicate that the positive effect of increasing the amount of WRA on the flowability. In addition, a higher dosage of WRA reduces the rheological properties of fresh UHPFRC and the effect is limited at a certain dosage of WRA. A higher amount of WRA exceeding the certain dosage, threshold, will contribute little to improving the flowability and the rheological properties.

3.2. Compressive Strength

Three specimens for each mixture were prepared for the compressive strength test. The test results are presented in Figure 7. Comparing Mix 1 and Mix 2, which were corresponded to the cases with 1.2 wt.% and 1.8 wt.% WRA solid content to the cement, the difference in the compressive strength was negligible. However, in the comparison of Mix 2 to 4, which corresponded to the cases with 1.8, 2.4, and 3.0 wt.% WRA solid content to cement, it can be seen that the compressive strength decreased as the amount of WRA increased. These results means that adding WRA up to a certain amount does not adversely affect the compressive strength while providing a beneficial effect on the workability. However, an excessive amount of WRA has a negative influence on the compressive strength of UHPFRC.

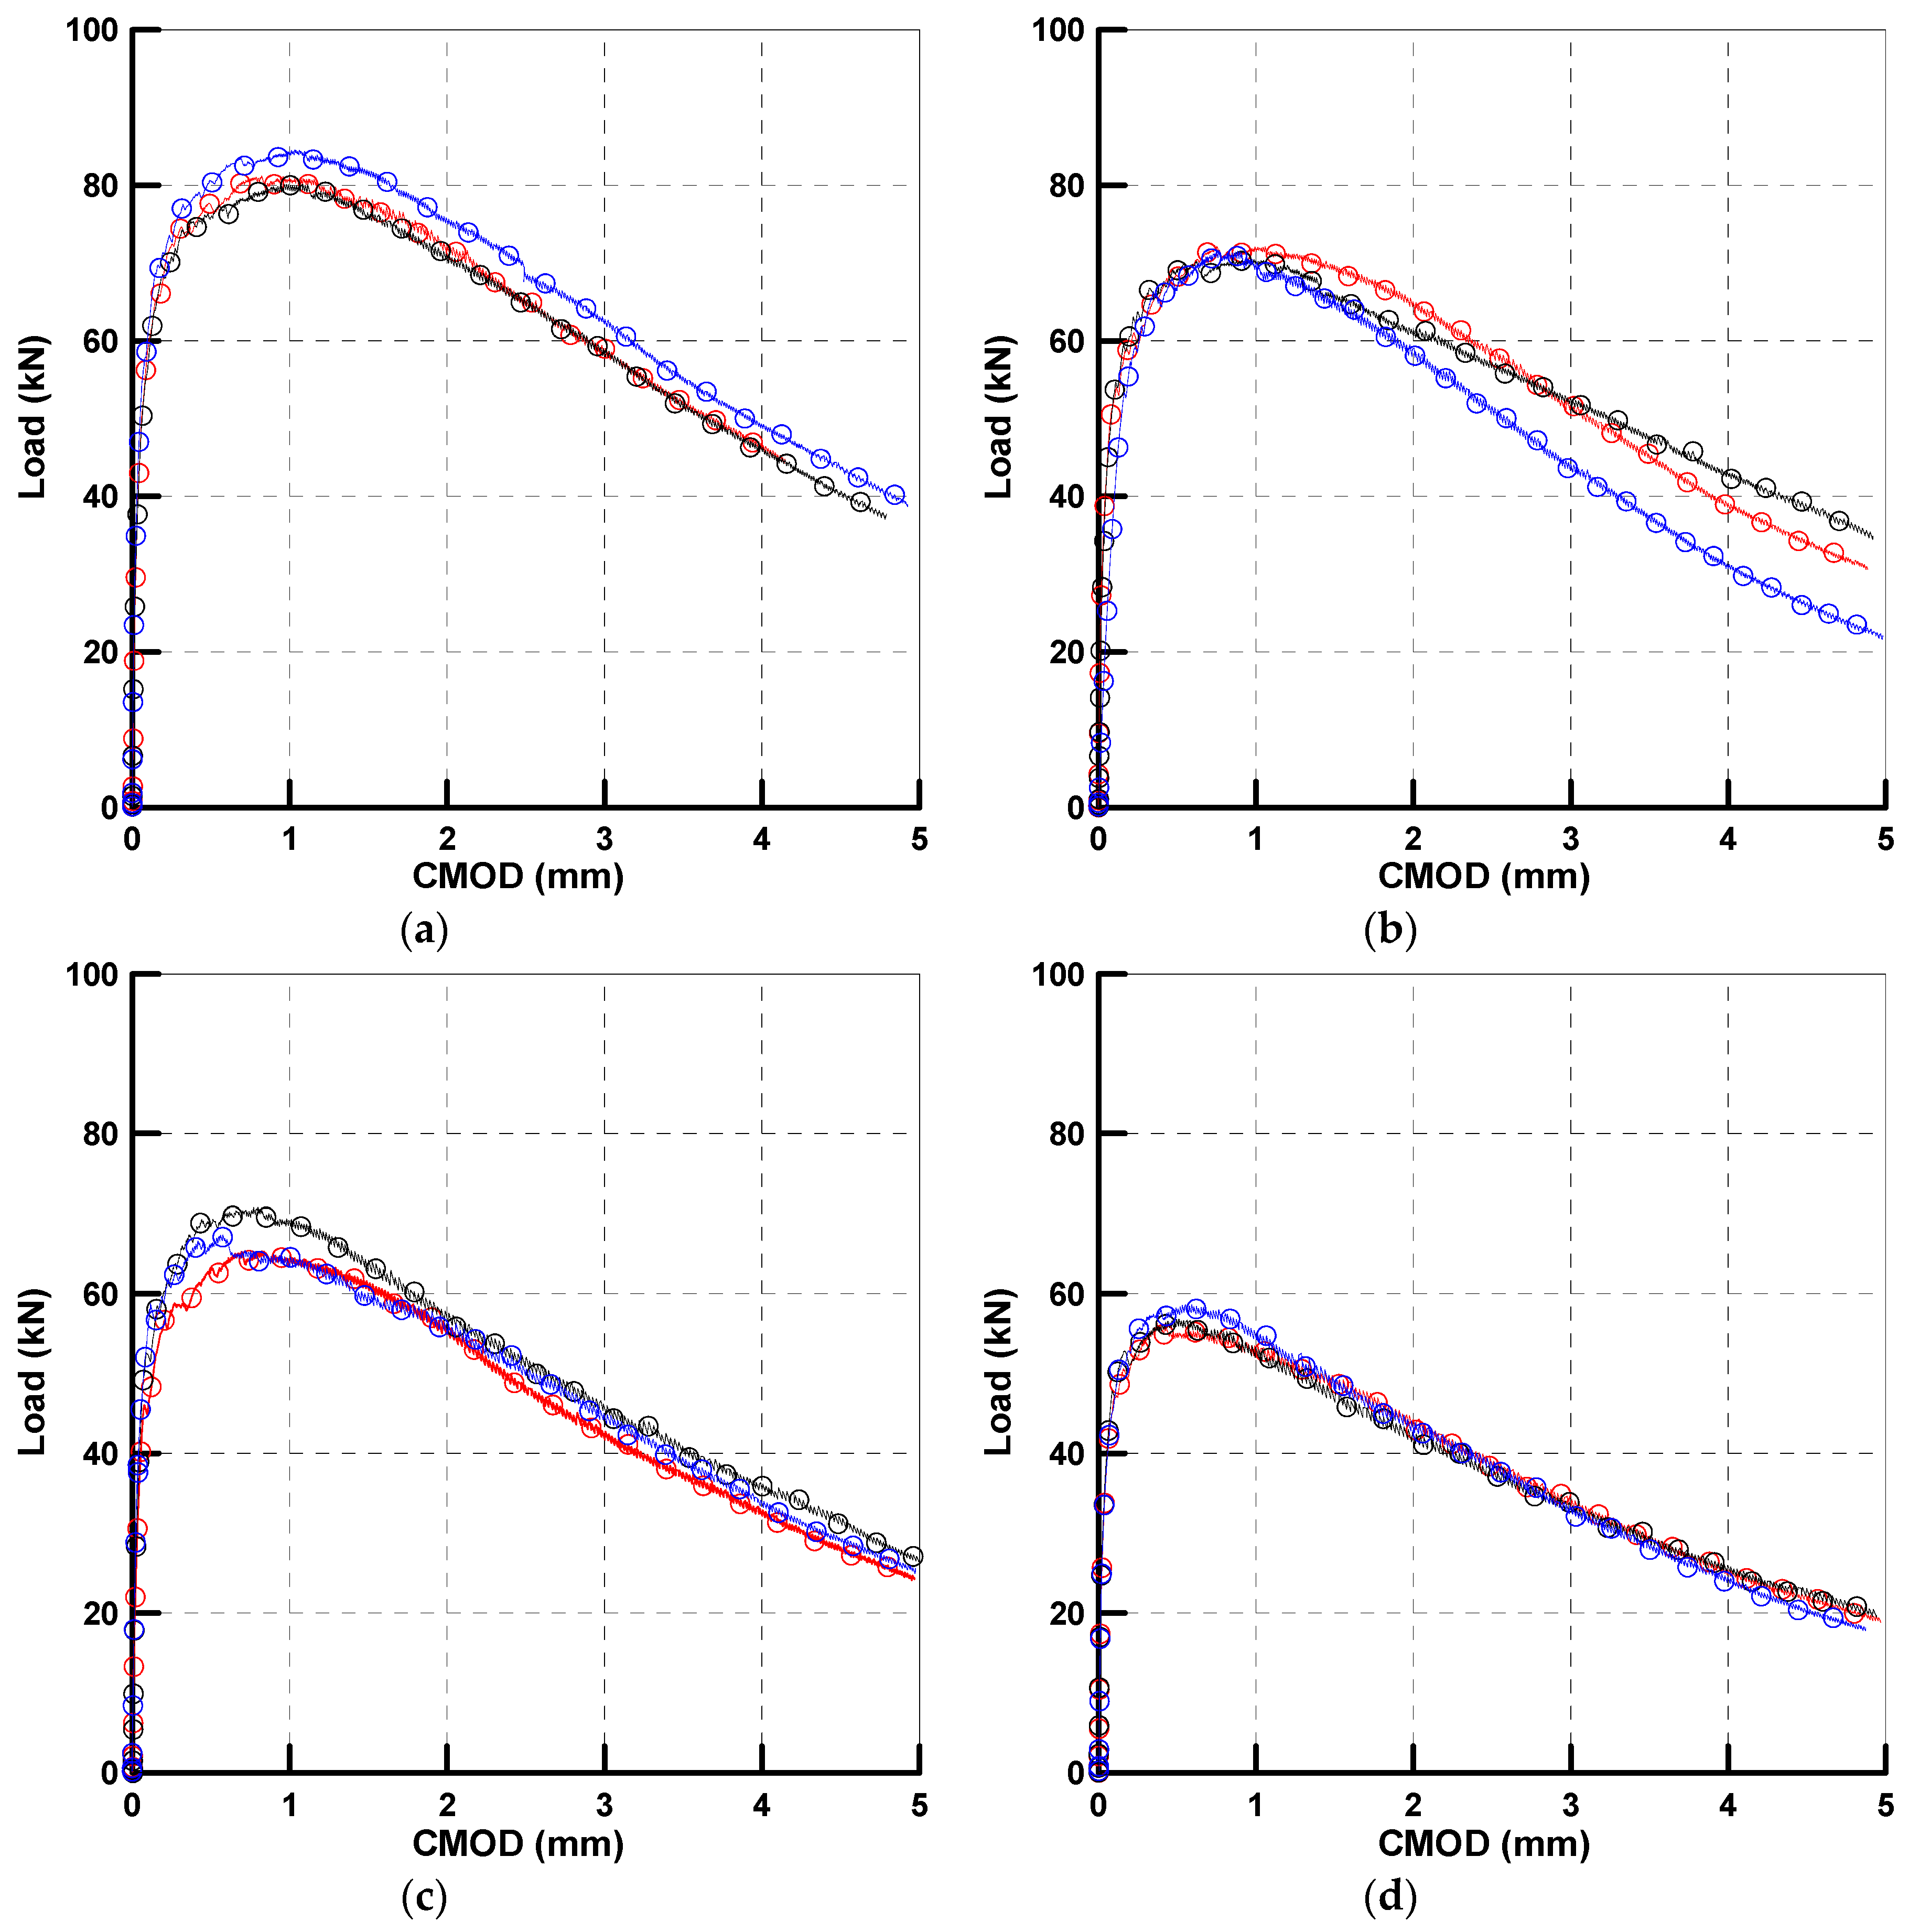
3.3. Flexural Behavior

The measured flexural behaviors for each mixture were presented by load-deflection curves, as shown in Figure 8. All mixtures clearly showed deflection hardening behavior until the peak load, which could be obtained only when a proper amount of fibers was added with good dispersion. Each mixture also showed a clear difference in the peak load and corresponding CMOD, and the deviations between specimens with identical mixture proportions were not significant compared to those between mixtures with different mixture proportions. This proves that the placing method adopted in this study provided a consistent fiber distribution and thus eliminates the influence of the placing method on the fiber distribution and the consequent mechanical performance. Therefore, it is possible to compare the pure effect of the rheological properties related to the amount of WRA.
The flexural test results are summarized in Table 2. The test results were obtained from three specimens for each mixture. The flexural tensile strength was calculated from the following equation.
f r = 3 P m a x L 2 b h e 2 ,
where P m a x is the peak load measured in the test, L and b are the span length and the width of the beam specimen respectively, and h e corresponds to the total height minus the notch depth.
Comparing the flexural strengths and behaviors of Mix 1 to 4, it can be found that the flexural strength and the CMOD at peak load decreased as the amount of WRA increased. When both the flexural strengths and the compressive strengths with different mixtures are compared, Mixes 2–4 present a close relationship between the flexural strength and compressive strength; however, the comparison between Mix 1 and Mix 2 shows discordance in the strength according to the amount of WRA. The flexural strength of Mix 1 was approximately 10% higher than that of Mix 2, whereas the compressive strengths obtained from Mixes 1 and 2 presented little difference with each other. Previous studies reported that the compressive strength of UHPFRC is noticeably not influenced by the fiber distribution characteristics [38,49,50,51]. Its compressive strength is mainly governed by the strength of the matrix. It can be thought that the flexural strength due to the amount of WRA might influence on the fiber distribution, resulting in the difference in the flexural strength, even though there was little difference in the compressive strength.

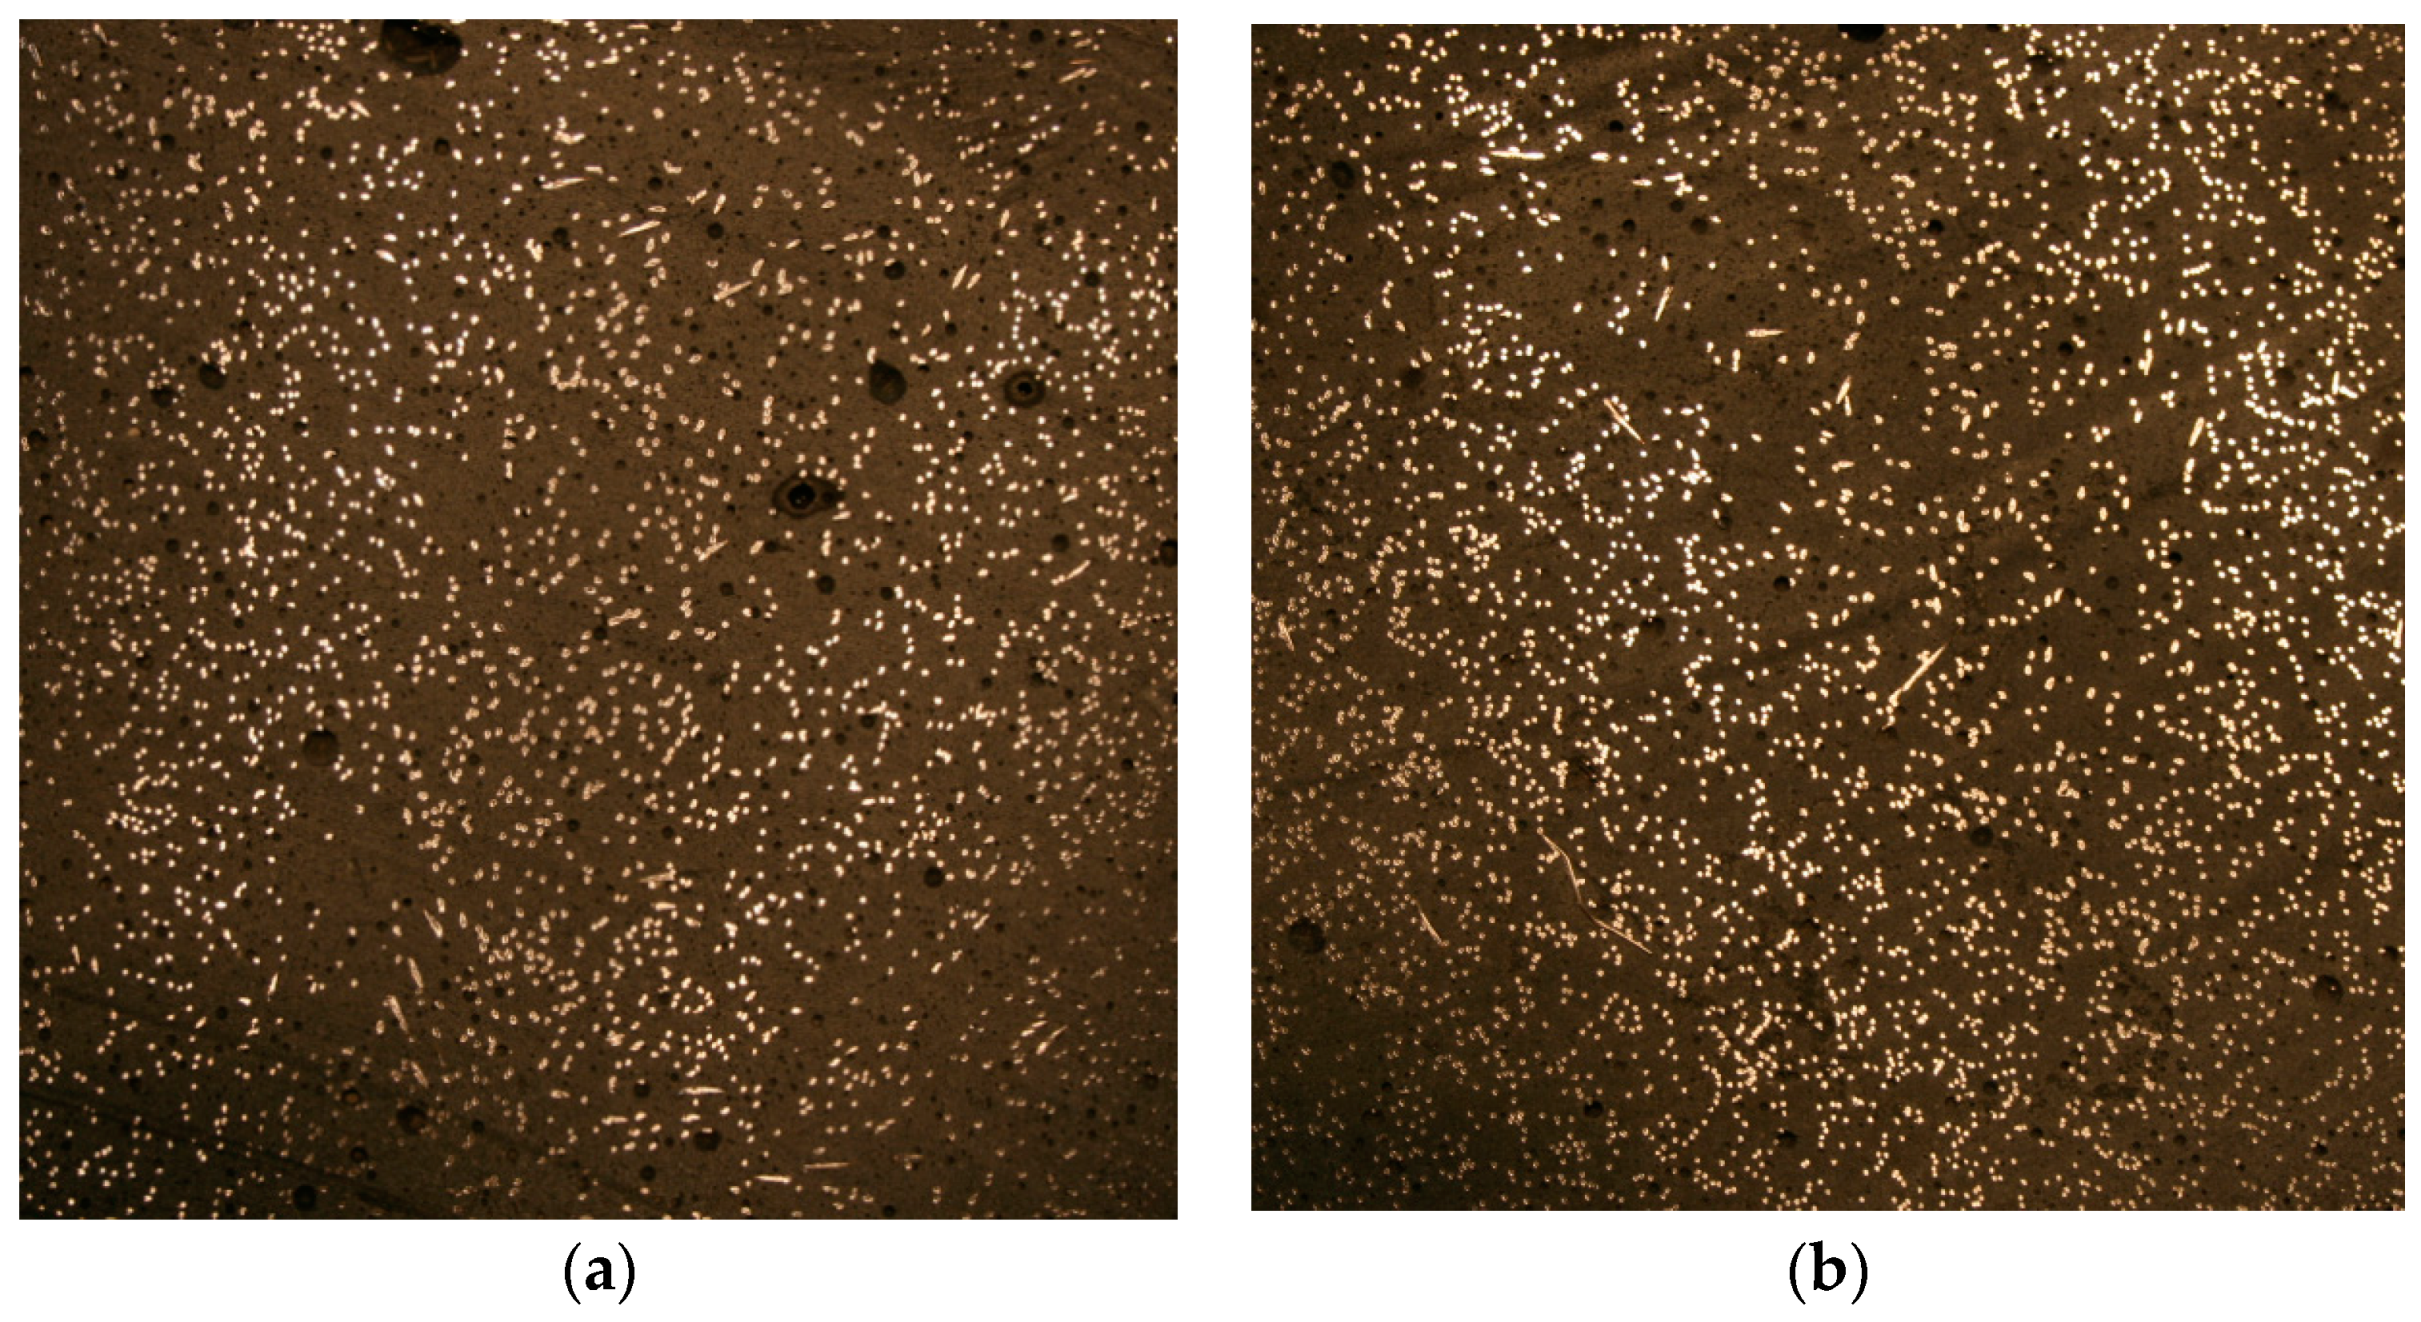
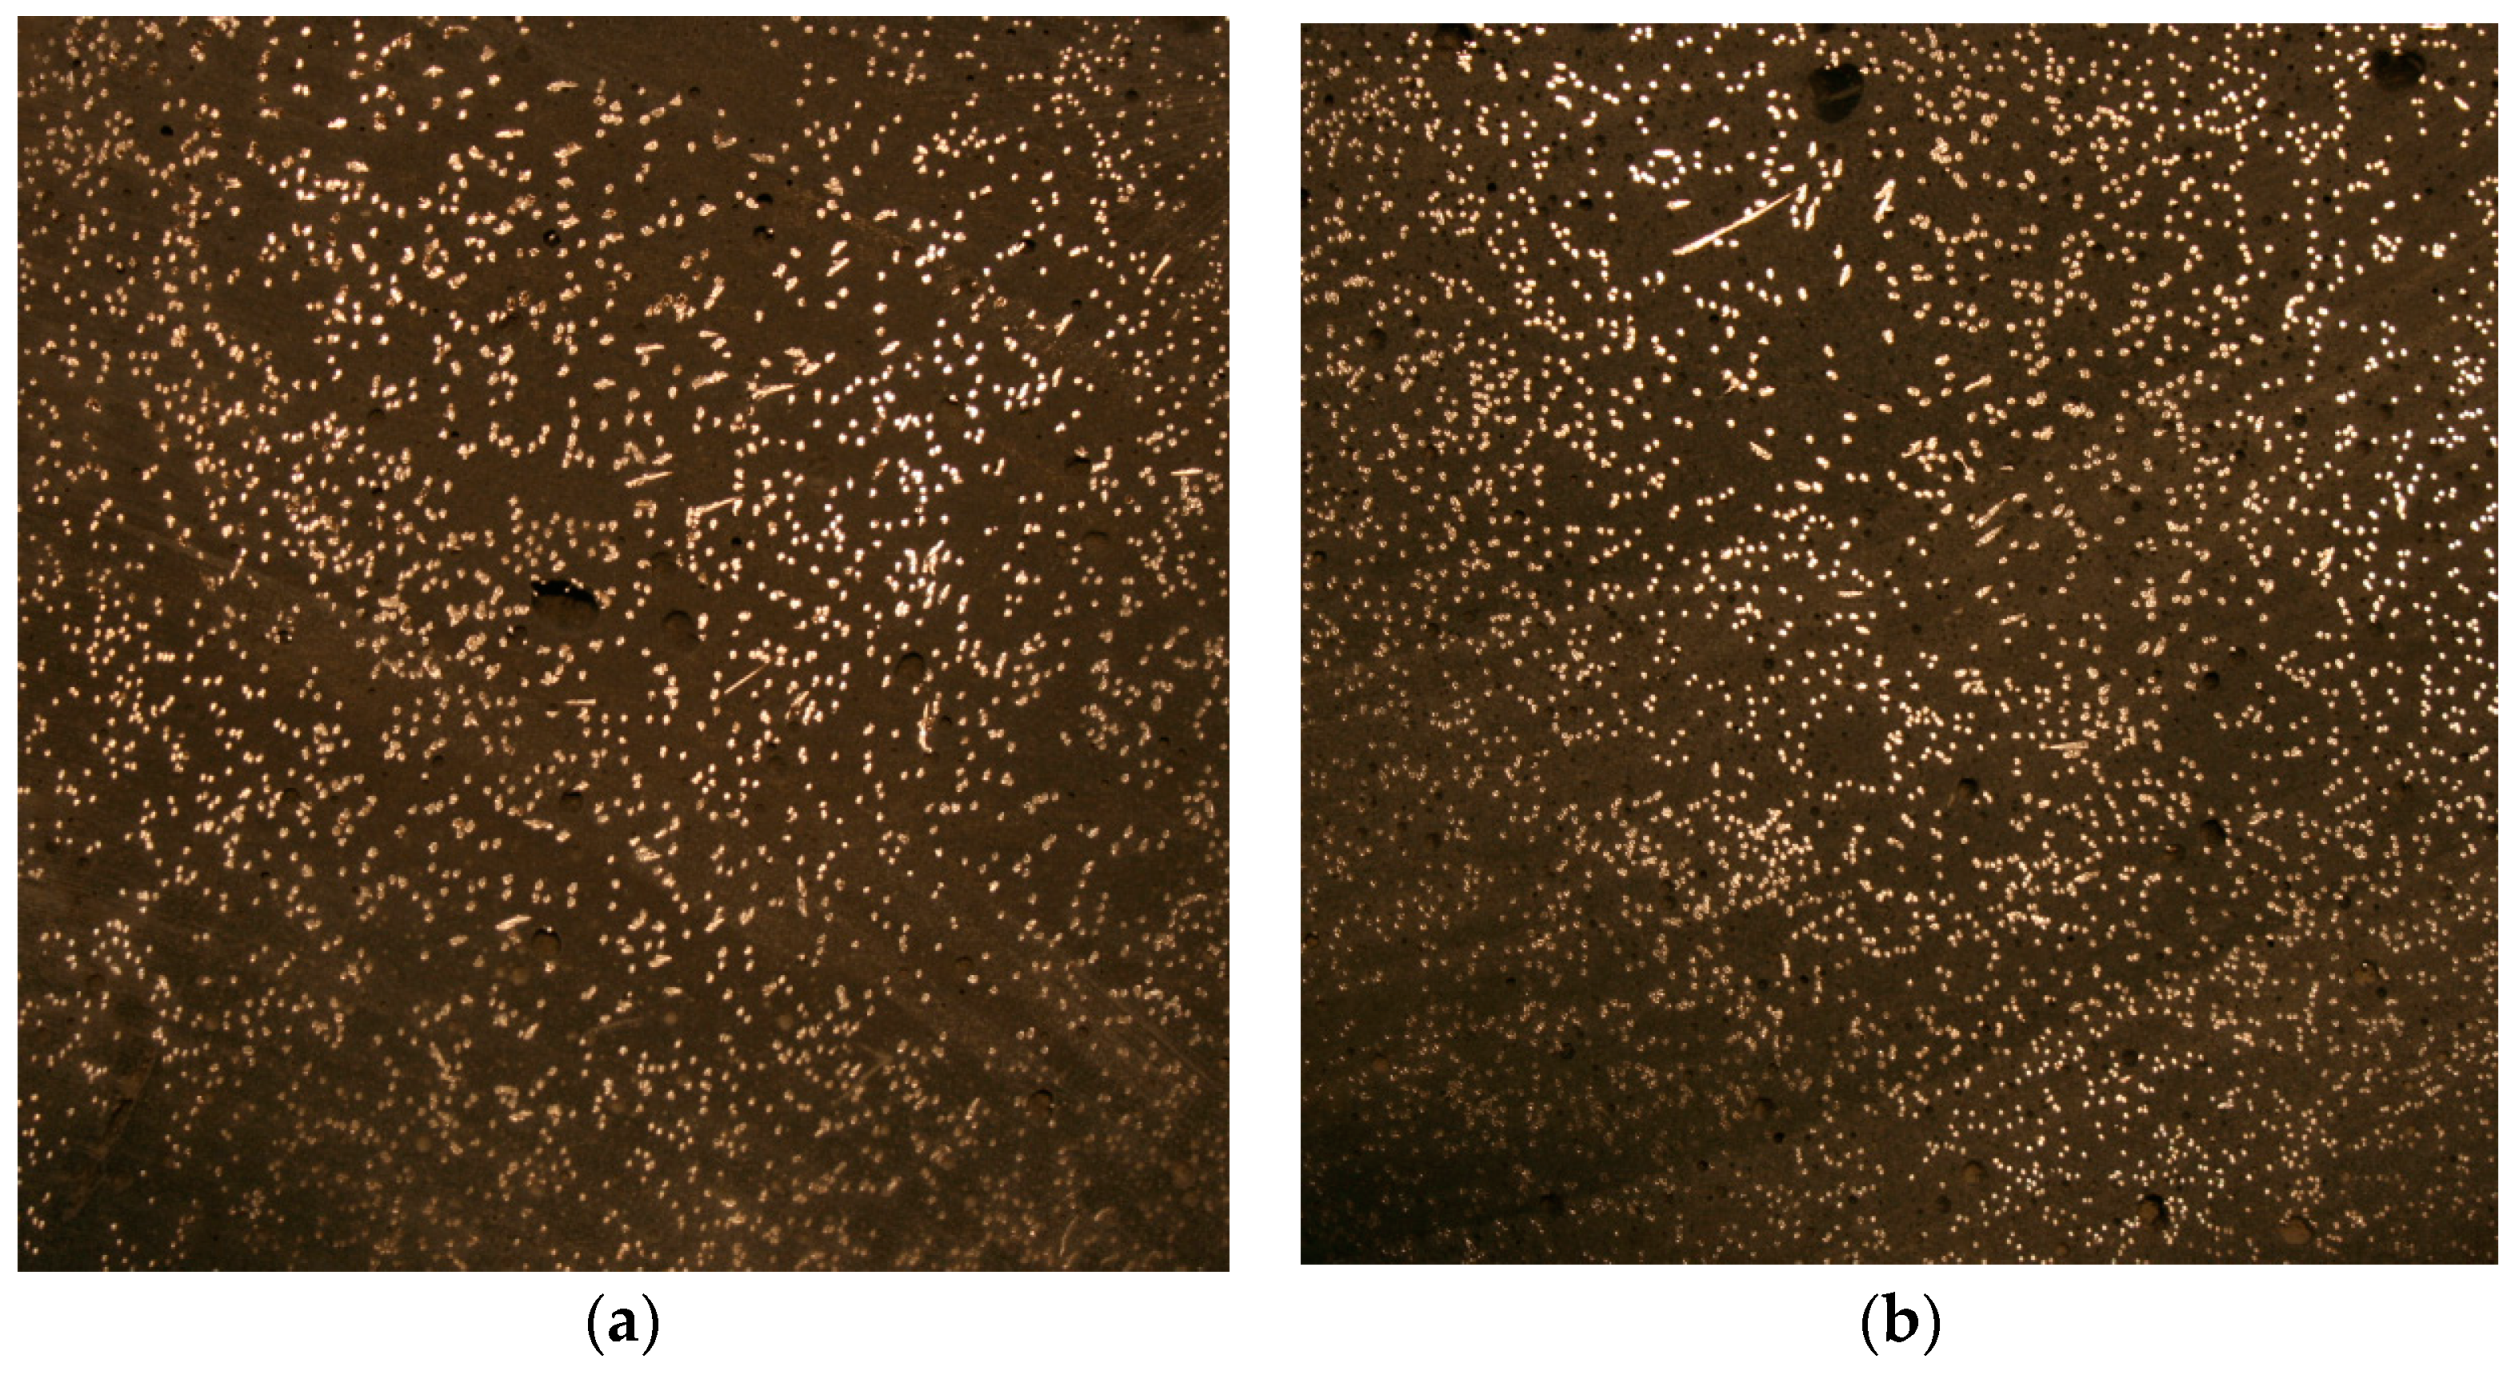
3.4. Fiber Distribution

Figure 9 and Figure 10 show representative sectional images of Mix 1 and Mix 2. Figure 10 corresponds to the section images obtained at the distances of 35 mm and 220 mm from the end near where the placement was taken for Mix 1, and Figure 10 presents the images obtained for Mix 2. The coefficients of fiber dispersion and orientation distribution for each mixture are presented in Figure 11.
At the section 35 mm away from the end, which is very close to the placing point, the fiber orientation coefficients were not influenced by the amount of WRA and the consequent rheological properties. On the other hand, at the section 220 mm away after considerable flowing, it can be found that the fiber orientation coefficients are much higher than those 35 mm away for each mixture and that Mix 1 presents a higher coefficient compared to Mixes 2–4. Relatively higher orientation coefficients 220 mm away than at 35 mm can be explained by the rotational movement of a fiber immersed in a fluid based on hydrodynamics, as already mentioned. The placing process adopted in fabricating the beam specimens in this study induced a shear flow, as can be seen in Figure 2, forming a parabolic flow velocity profile. This induced gradual rotation of the fibers and the fibers to be aligned to the flow direction. The fiber orientation coefficients obtained 220 mm away were in a range of 0.52–0.57. If the fibers were all aligned to the flow direction after a long flow distance, the coefficient would be equal to 1. However, the interference among fibers that commonly occurs when the volume fraction of fibers ( V f ) is concentrated, that is V f r f 2 , does not allow such an ideal orientation distribution [52]. Here r f means the aspect ratio of fiber expressed as a ratio of the fiber length to the fiber diameter. Considering the experimental results of viscosity and yield stress according to the amount of WRA, it could be seen that higher viscosity and yield stress provided a higher fiber orientation coefficient. This means that the rheological properties of the mortar may affect the velocity profile and the interaction among fibers.
With regard to the fiber dispersion, Mix 1 presented a slightly higher coefficient than the other mixes. When this result is compared with the rheological test results, it is seen that the fiber dispersion is better in a mix with a higher viscosity and yield stress. However, recalling that it is generally accepted that lower viscosity decreases the fiber segregation resistance, it is more reasonable to state that the mixtures considered in this study did not show any meaningful variation in the fiber dispersion in UHPFRC. The absence of noticeable deterioration in the fiber dispersion even with a large amount of WRA is related to UHPFRC retaining high viscosity for all mixtures. The lowest viscosity measured in this study with the largest amount of WRA was 51.1 Pa s, which is dozens of times higher than the viscosity of normal FRC and several times higher than high viscosity self-compacting concrete (SCC) with steel fibers [40,42]. A much higher amount of cement and a much lower water to cement ratio of UHPFRC induced relatively much higher viscosity even with a large amount of WRA. In addition, unlike the fiber orientation coefficient, there was no difference in the dispersion coefficient between the results 35 mm and 220 mm away. This means that the fiber dispersion did not change according to the flow distance and none of the mixtures caused any sediment or segregation of fibers along the flow.
The correlations of properties of UHPFRCs investigated in this study are listed in Table 3. Although the data in this study are limited, the strong correlations were observed between fresh properties, i.e., flow, yield stress, and plastic viscosity, and the flexural strength has a strong correlation (Pearson’s linear correlation coefficient over 0.76) with all other properties under controlled fabrication of the material.
From this analysis of fiber dispersion and orientation distribution, it can be said that the flexural behaviors of four different mixtures depended in part on the compressive strengths of the matrices and in part on the fiber orientation distributions due to the rheological properties.

4. Conclusions

This paper presents an experimental and analytical study on the effects of the amount of WRA on the rheological properties of UHPFRC and the relationship between the rheological properties, fiber distribution, and mechanical behavior of UHPFRC. A series of experiments including a mini-slump flow test, rheology test, compressive strength test, flexural test, and image analysis were performed. From the test results, the following conclusions were drawn:
  • The flowability and rheological properties were measured for the fresh UHPFRC, and the results revealed that the positive effect of increasing the amount of WRA on the flowability as well as the rheological properties of fresh UHPFRC could be achieved only with an amount less than a threshold, and a higher amount of WRA exceeding the threshold contributed little to improving the flowability and the rheological properties.
  • The compressive strength test results revealed that adding WRA up to a certain amount did not adversely affect the compressive strength while providing a beneficial effect on the workability, whereas an excessive amount of WRA had a negative influence on the compressive strength of UHPFRC.
  • The flexural performance showed that the flexural strength and the CMOD at peak load decreased as the amount of WRA increased. Through the comparison between the tendency of the compressive strength and flexural strength, it could be surmised that the flexural strength due to the amount of WRA might be influenced by the fiber distribution.
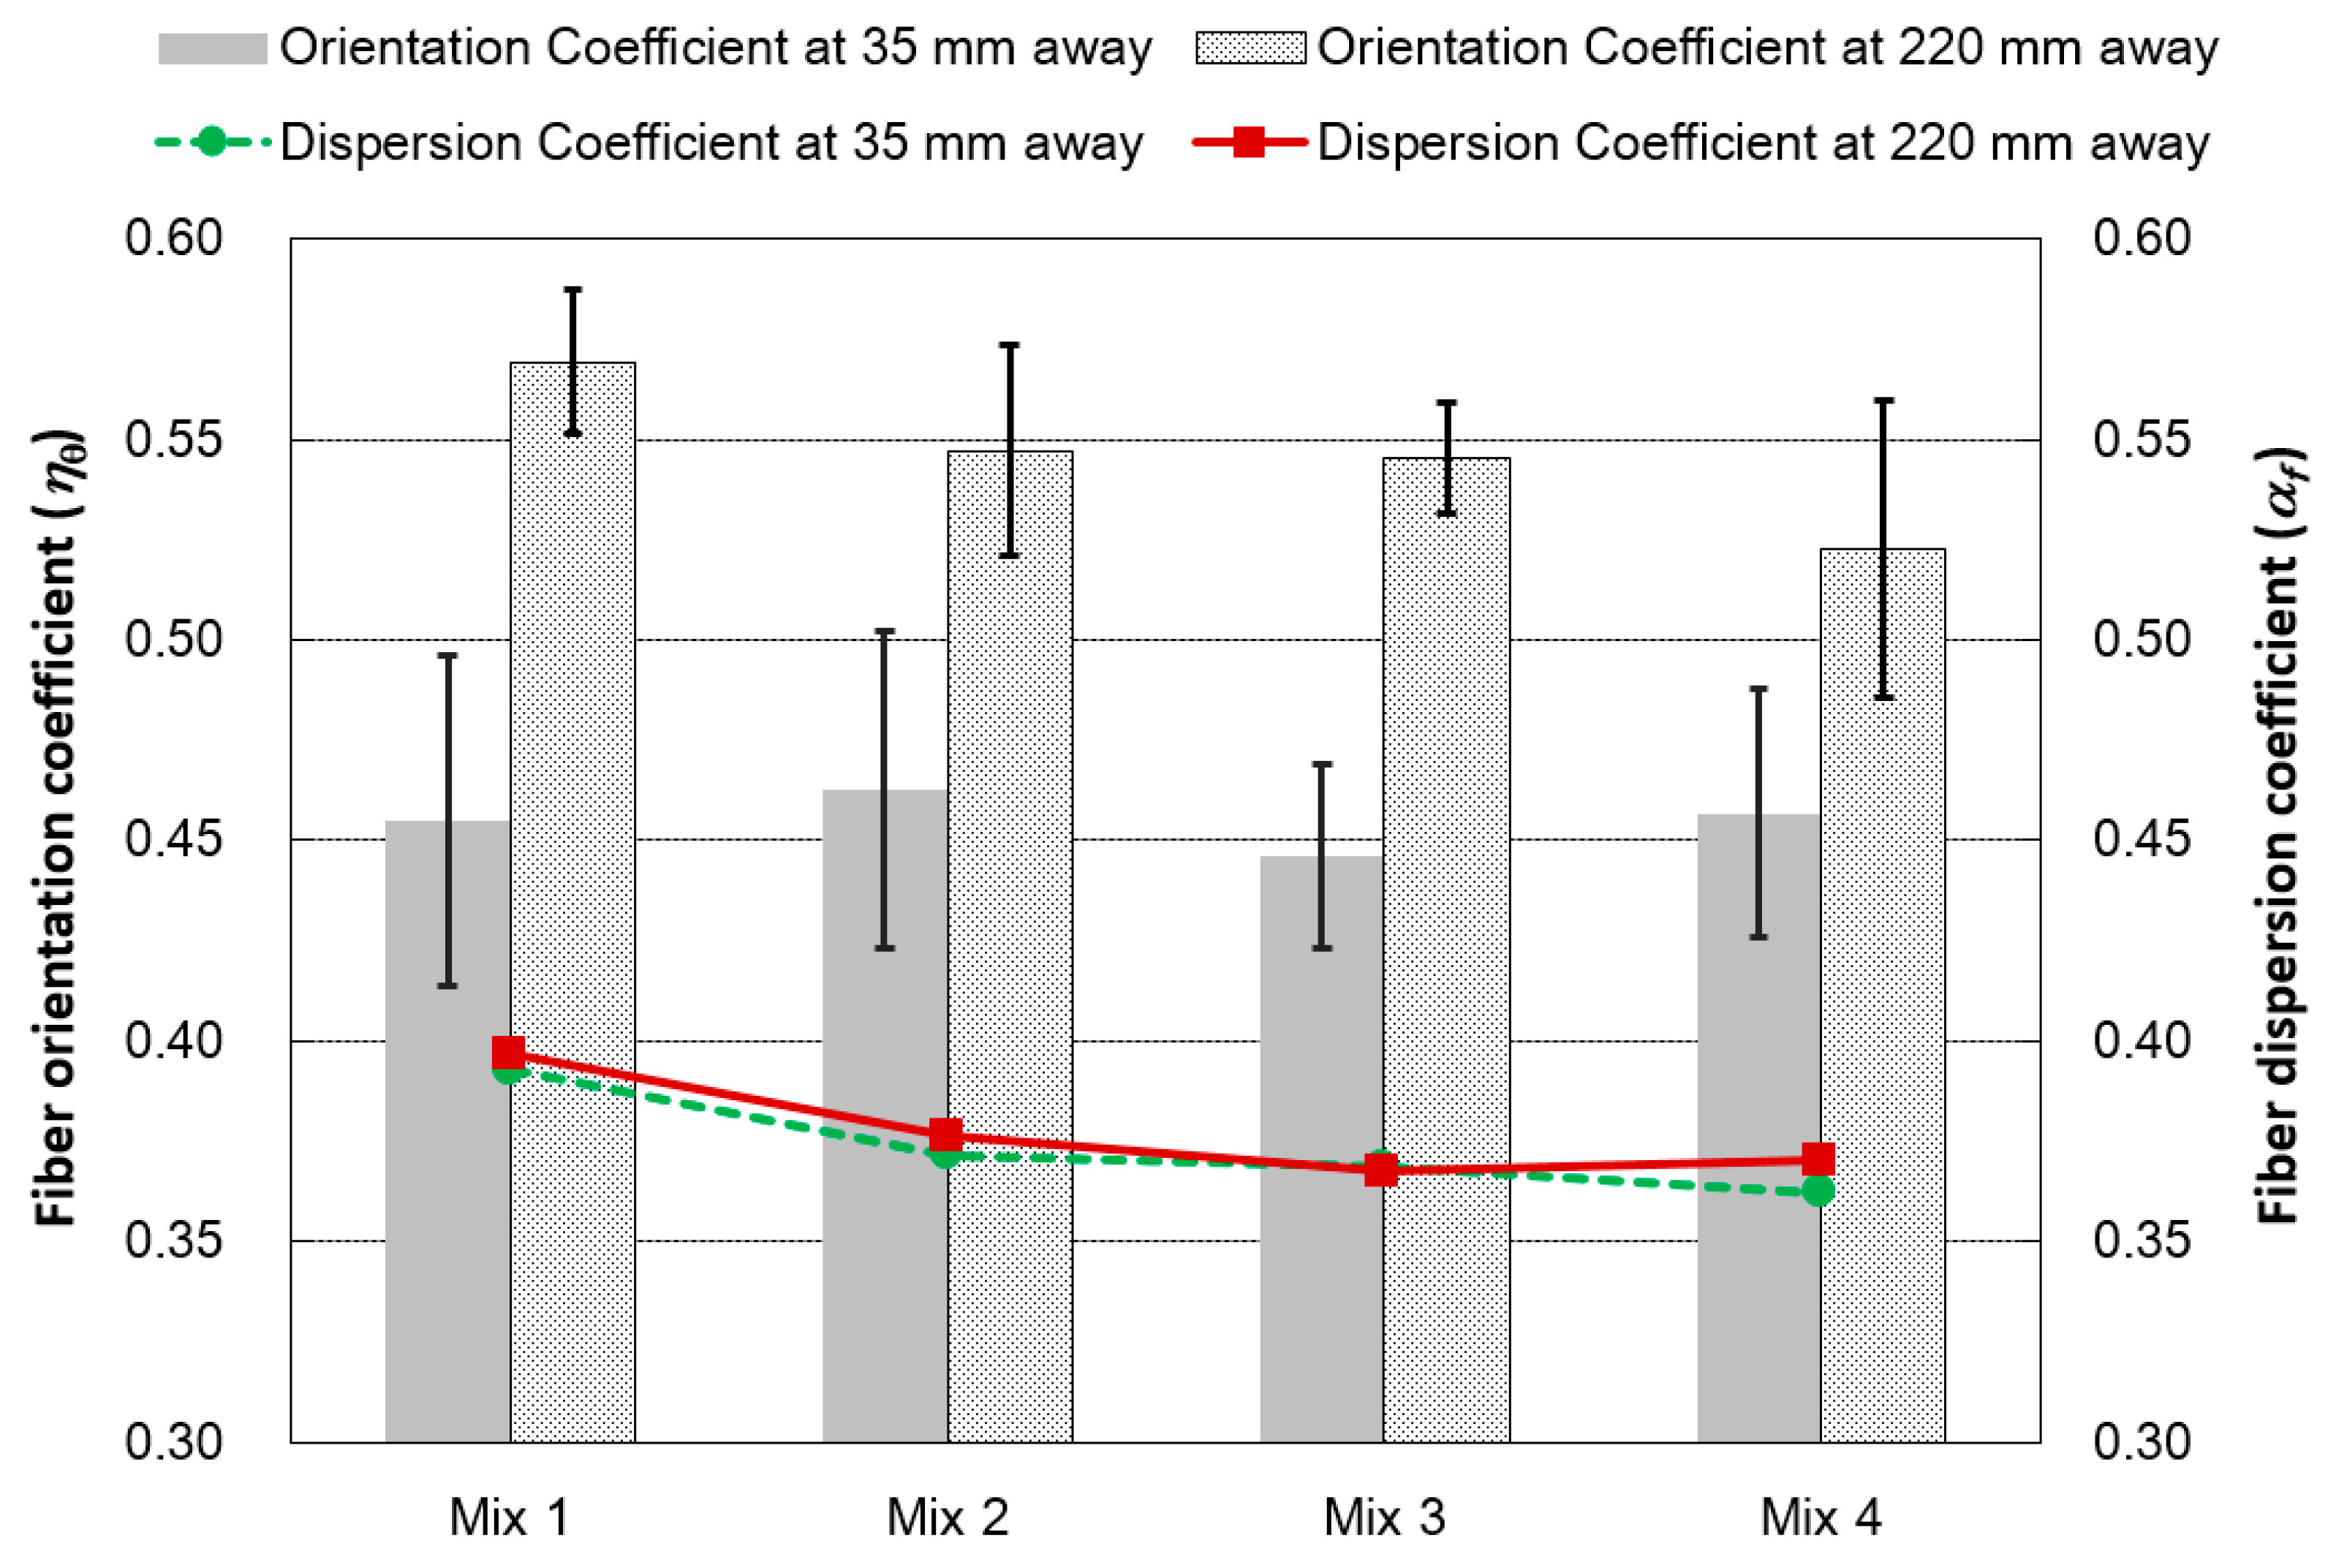
  • A quantitative investigation using the image analysis of the fiber distribution proved that the flexural behaviors with four different mixtures depended in part on the compressive strengths of the matrices and in part on the fiber orientation distributions due to the rheological properties. Furthermore, it was observed that the effect of the rheological property on the fiber orientation is more significant than that on the fiber dispersion.

Author Contributions

S.-T.K. and B.Y.L. conceived and designed the experiments; S.-T.K. performed the experiments; S.-T.K. and J.-H.K. analyzed the data; S.-T.K. and B.Y.L. wrote the paper.

Funding

This research received no external funding.

Conflicts of Interest

The authors declare no conflict of interest.

References

  1. Joshaghani, A.; Balapour, M.; Ramezanianpour, A.A. Effect of controlled environmental conditions on mechanical, microstructural and durability properties of cement mortar. Constr. Build. Mater. 2018, 164, 134–149. [Google Scholar] [CrossRef]
  2. Ramezanianpour, A.; Malhotra, V. Effect of curing on the compressive strength, resistance to chloride-ion penetration and porosity of concretes incorporating slag, fly ash or silica fume. Cem. Concr. Compos. 1995, 17, 125–133. [Google Scholar] [CrossRef]
  3. Sánchez, I.; Antón, C.; De Vera, G.; Ortega, J.M.; Climent, M. Moisture distribution in partially saturated concrete studied by impedance spectroscopy. J. Nondestruct. Eval. 2013, 32, 362–371. [Google Scholar] [CrossRef]
  4. Williams, M.; Ortega, J.M.; Sánchez, I.; Cabeza, M.; Climent, M.Á. Non-destructive study of the microstructural effects of sodium and magnesium sulphate attack on mortars containing silica fume using impedance spectroscopy. Appl. Sci. 2017, 7, 648. [Google Scholar] [CrossRef]
  5. Romualdi, J.P.; Batson, G.B. Mechanics of crack arrest in concrete. J. Eng. Mech. Div. 1963, 89, 147–168. [Google Scholar]
  6. Zollo, R.F. Fiber-reinforced concrete: An overview after 30 years of development. Cem. Concr. Compos. 1997, 19, 107–122. [Google Scholar] [CrossRef]
  7. Song, P.; Hwang, S. Mechanical properties of high-strength steel fiber-reinforced concrete. Constr. Build. Mater. 2004, 18, 669–673. [Google Scholar] [CrossRef]
  8. De la Rosa, Á.; Poveda, E.; Ruiz, G.; Cifuentes, H. Proportioning of self-compacting steel-fiber reinforced concrete mixes based on target plastic viscosity and compressive strength: Mix-design procedure & experimental validation. Constr. Build. Mater. 2018, 189, 409–419. [Google Scholar]
  9. Banthia, N.; Sappakittipakorn, M. Toughness enhancement in steel fiber reinforced concrete through fiber hybridization. Cem. Concr. Res. 2007, 37, 1366–1372. [Google Scholar] [CrossRef]
  10. Richard, P.; Cheyrezy, M. Composition of reactive powder concretes. Cem. Concr. Res. 1995, 25, 1501–1511. [Google Scholar] [CrossRef]
  11. Richard, P.; Cheyrezy, M.H. Reactive powder concretes with high ductility and 200–800 mpa compressive strength. Spec. Publ. 1994, 144, 507–518. [Google Scholar]
  12. Rossi, P. Ultra high performance concretes. Concr. Int. 2008, 30, 31–34. [Google Scholar]
  13. Yoo, D.-Y.; Yoon, Y.-S. A review on structural behavior, design, and application of ultra-high-performance fiber-reinforced concrete. Int. J. Concr. Struct. Mater. 2016, 10, 125–142. [Google Scholar] [CrossRef]
  14. Bonneau, O.; Lachemi, M.; Dallaire, E.; Dugat, J.; Aitcin, P.-C. Mechanical properties and durability of two industrial reactive powder concretes. Mater. J. 1997, 94, 286–290. [Google Scholar]
  15. Graybeal, B.; Davis, M. Cylinder or cube: Strength testing of 80 to 200 MPa (11.6 to 29 ksi) ultra-high-performance fiber-reinforced concrete. Mater. J. 2008, 105, 603–609. [Google Scholar]
  16. Jungwirth, J.; Muttoni, A. Structural behavior of tension members in ultra high performance concrete. In Proceedings of the International Symposium on Ultra High Performance Concrete, Kassel, Germany, 13–15 September 2004. [Google Scholar]
  17. Kang, S.-T.; Choi, J.-I.; Koh, K.-T.; Lee, K.S.; Lee, B.Y. Hybrid effects of steel fiber and microfiber on the tensile behavior of ultra-high performance concrete. Compos. Struct. 2016, 145, 37–42. [Google Scholar] [CrossRef]
  18. Kang, S.-T.; Lee, K.-S.; Choi, J.-I.; Lee, Y.; Felekoğlu, B.; Lee, B.Y. Control of tensile behavior of ultra-high performance concrete through artificial flaws and fiber hybridization. Int. J. Concr. Struct. Mater. 2016, 10, 33–41. [Google Scholar] [CrossRef]
  19. Bencardino, F.; Rizzuti, L.; Spadea, G.; Swamy, R. Experimental evaluation of fiber reinforced concrete fracture properties. Compos. Part B Eng. 2010, 41, 17–24. [Google Scholar] [CrossRef]
  20. Ferrara, L.; Di Prisco, M.; Lamperti, M. Identification of the stress-crack opening behavior of HPFRCC: The role of flow-induced fiber orientation. In Proceedings of the FraMCoS; Korea Concrete Institute: Seoul, Korea, 2010; pp. 1541–1550. [Google Scholar]
  21. Markovi, I. High-Performance Hybrid-Fibre Concrete-Development and Utilization. Ph.D. Thesis, Universiteit van Belgrado, Belgrade, Serbia, 2006; pp. 90–92. [Google Scholar]
  22. Rizzuti, L.; Bencardino, F. Effects of fibre volume fraction on the compressive and flexural experimental behaviour of sfrc. Contemp. Eng. Sci. 2014, 7, 379–390. [Google Scholar] [CrossRef]
  23. Swamy, R.; Mangat, P.; Rao, C.K. The mechanics of fiber reinforcement of cement matrices. Speci. Publ. 1974, 44, 1–28. [Google Scholar]
  24. Ezeldin, A.S.; Balaguru, P.N. Normal-and high-strength fiber-reinforced concrete under compression. J. Mater. Civ. Eng. 1992, 4, 415–429. [Google Scholar] [CrossRef]
  25. Huang, C.; Zhao, G. Properties of steel fibre reinforced concrete containing larger coarse aggregate. Cem. Concr. Compos. 1995, 17, 199–206. [Google Scholar] [CrossRef]
  26. Jang, S.-J.; Yun, H.-D. Combined effects of steel fiber and coarse aggregate size on the compressive and flexural toughness of high-strength concrete. Compos. Struct. 2018, 185, 203–211. [Google Scholar] [CrossRef]
  27. Armelin, H.S.; Banthia, N. Predicting the flexural postcracking performance of steel fiber reinforced concrete from the pullout of single fibers. Mater. J. 1997, 94, 18–31. [Google Scholar]
  28. Mandel, J.A.; Wei, S.; Said, S. Studies of the properties of the fiber-matrix interface in steel fiber reinforced mortar. Mater. J. 1987, 84, 101–109. [Google Scholar]
  29. Stang, H.; Shah, S. Failure of fibre-reinforced composites by pull-out fracture. J. Mater. Sci. 1986, 21, 953–957. [Google Scholar] [CrossRef]
  30. Mai, Y. Strength and fracture properties of asbestos-cement mortar composites. J. Mater. Sci. 1979, 14, 2091–2102. [Google Scholar] [CrossRef]
  31. Naaman, A.E. A Statistical Theory of Strength for Fiber Reinforced Concrete; Massachusetts Institute of Technology: Cambridge, MA, USA, 1972. [Google Scholar]
  32. Naaman, A.E. High performance fiber reinforced cement composites. In High-Performance Construction Materials: Science and Applications; World Scientific: Singapore, 2008; pp. 91–153. [Google Scholar]
  33. Barnett, S.J.; Lataste, J.-F.; Parry, T.; Millard, S.G.; Soutsos, M.N. Assessment of fibre orientation in ultra high performance fibre reinforced concrete and its effect on flexural strength. Mater. Struct. 2010, 43, 1009–1023. [Google Scholar] [CrossRef]
  34. Ferrara, L.; Ozyurt, N.; Di Prisco, M. High mechanical performance of fibre reinforced cementitious composites: The role of “casting-flow induced” fibre orientation. Mater. Struct. 2011, 44, 109–128. [Google Scholar] [CrossRef]
  35. Kang, S.T.; Lee, B.Y.; Kim, J.-K.; Kim, Y.Y. The effect of fibre distribution characteristics on the flexural strength of steel fibre-reinforced ultra high strength concrete. Constr. Build. Mater. 2011, 25, 2450–2457. [Google Scholar] [CrossRef]
  36. Kang, S.-T.; Kim, J.-K. The relation between fiber orientation and tensile behavior in an ultra high performance fiber reinforced cementitious composites (uhpfrcc). Cem. Concr. Res. 2011, 41, 1001–1014. [Google Scholar] [CrossRef]
  37. Şanal, İ.; Zihnioğlu, N.Ö. To what extent does the fiber orientation affect mechanical performance? Constr. Build. Mater. 2013, 44, 671–681. [Google Scholar] [CrossRef]
  38. Abbas, S.; Nehdi, M.; Saleem, M. Ultra-high performance concrete: Mechanical performance, durability, sustainability and implementation challenges. Int. J. Concr. Struct. Mater. 2016, 10, 271–295. [Google Scholar] [CrossRef]
  39. Li, P.; Yu, Q.; Brouwers, H. Effect of pce-type superplasticizer on early-age behaviour of ultra-high performance concrete (uhpc). Constr. Build. Mater. 2017, 153, 740–750. [Google Scholar] [CrossRef]
  40. Ozyurt, N.; Mason, T.O.; Shah, S.P. Correlation of fiber dispersion, rheology and mechanical performance of frcs. Cem. Concr. Compos. 2007, 29, 70–79. [Google Scholar] [CrossRef]
  41. Stähli, P.; Custer, R.; van Mier, J.G. On flow properties, fibre distribution, fibre orientation and flexural behaviour of frc. Mater. Struct. 2008, 41, 189–196. [Google Scholar] [CrossRef]
  42. Wang, R.; Gao, X.; Huang, H.; Han, G. Influence of rheological properties of cement mortar on steel fiber distribution in uhpc. Constr. Build. Mater. 2017, 144, 65–73. [Google Scholar] [CrossRef]
  43. Standard Test Method for Flow of Hydraulic Cement Mortar. 2007. Available online: https://www.astm.org/DATABASE.CART/HISTORICAL/C1437-07.htm (accessed on 15 January 2016).
  44. De Larrard, F.; Sedran, T. Mixture-proportioning of high-performance concrete. Cem. Concr. Res. 2002, 32, 1699–1704. [Google Scholar] [CrossRef]
  45. ASTM International. Standard Test Method for Compressive Strength of Cylindrical Concrete Specimens; ASTM International: West Conshohocken, PA, USA, 2015. [Google Scholar]
  46. Papthanasiou, T.; Guell, D.C. Flow-Induced Alignment in Composite Materials; Elsevier: Amsterdam, The Netherlands, 1997. [Google Scholar]
  47. Takano, M. Viscosity Effect on Flow Orientation of Short Fibers; Monsanto Research Corp.: St Louis, MO, USA, 1973. [Google Scholar]
  48. Piggott, M.R. Short fibre polymer composites: A fracture-based theory of fibre reinforcement. J. Compos. Mater. 1994, 28, 588–606. [Google Scholar] [CrossRef]
  49. Park, J.J.; Kang, S.T.; Koh, K.T.; Kim, S.W. Influence of the ingredients on the compressive strength of uhpc as a fundamental study to optimize the mixing proportion. In Proceedings of the Second International Symposium on Ultra High Performance Concrete, Kassel, Germany, 5–7 March 2008; pp. 105–112. [Google Scholar]
  50. Reda, M.; Shrive, N.; Gillott, J. Microstructural investigation of innovative uhpc. Cem. Concr. Res. 1999, 29, 323–329. [Google Scholar] [CrossRef]
  51. Schmidt, M.; Fehling, E. Ultra-high-performance concrete: Research, development and application in europe. ACI Spec. Publ. 2005, 228, 51–78. [Google Scholar]
  52. Folgar, F.; Tucker, C.L., III. Orientation behavior of fibers in concentrated suspensions. J. Reinf. Plast. Compos. 1984, 3, 98–119. [Google Scholar] [CrossRef]
Figure 1. (a) Rheometer (Brookfield DV-III ULTRA) and (b) rotational speed protocol applied for rheometer test.
Applsci 09 00029 g001
Figure 2. Placing method adopted for fabricating beam specimen. (A) Device; (B) Material flow.
Applsci 09 00029 g002
Figure 3. Set-up of three-point bending test with notched beam. (a) Test setup; (b) Dimensions.
Applsci 09 00029 g003
Figure 4. Schematic diagram of fiber rotational movement in a simple shear flow.
Applsci 09 00029 g004
Figure 5. Flow test results.
Applsci 09 00029 g005
Figure 6. Yield stress and plastic viscosity estimated from rheometer test.
Applsci 09 00029 g006
Figure 7. Comparison of compressive strengths with different mixes.
Applsci 09 00029 g007
Figure 8. Load-CMOD curves with different mixes: (a) Mix 1, (b) Mix 2, (c) Mix 3, and (d) Mix 4.
Applsci 09 00029 g008
Figure 9. Images of fiber distribution for Mix 1 (a) at 35 mm away and (b) at 220 mm away.
Applsci 09 00029 g009
Figure 10. Images of fiber distribution for Mix 2 (a) at 35 mm away and (b) at 220 mm away.
Applsci 09 00029 g010
Figure 11. Fiber orientation coefficients and fiber dispersion coefficients of UHPFRC.
Applsci 09 00029 g011
Table 1. Mix proportion of ultra-high-performance fiber-reinforced concrete (UHPFRC).
MixtureUnit Weight (kg/m3)
CementSilica FumeFillerSandWaterAdmixturesAnti-FoamerSteel Fiber
WRA *EA **SRA ***
Mix 177119323184816530.857.87.701.40156
Mix 216046.3
Mix 315661.7
Mix 415177.1
* WRA: Water reducing admixture; ** EA: Expanding admixture; *** SRA: Shrinkage reducing admixture
Table 2. Flexural test results.
MixturePeak Load (kN)Flexural Strength (MPa)Deflection at Peak Load (mm)CMOD at Peak Load (mm)
Mix 181.97 ± 2.3145.54 ± 1.290.81 ± 0.050.94 ± 0.11
Mix 271.42 ± 0.8639.68 ± 0.480.87 ± 0.260.85 ± 0.12
Mix 367.83 ± 2.7737.68 ± 1.540.84 ± 0.340.73 ± 0.14
Mix 457.28 ± 1.1731.82 ± 0.650.66 ± 0.090.48 ± 0.09
Table 3. Correlation of properties of UHPFRCs.
PropertiesWRAFlowPlastic ViscosityYield StressCompressive StrengthFlexural Strength α f η θ
WRA1-------
Flow0.751------
Plastic viscosity−0.79−1.001-----
Yield stress−0.72−1.000.991----
Compressive strength−0.88−0.390.430.341---
Flexural strength−0.98−0.790.820.760.871--
α f −0.87−0.950.970.950.520.861-
η θ −0.96−0.800.820.760.860.990.831

