Article

Using Artificial Neural Networks for Identifying Patients with Mild Cognitive Impairment Associated with Depression Using Neuropsychological Test Features

by
Virginia Mato-Abad
1,*,
Isabel Jiménez
2,3,
Rafael García-Vázquez
1,
José M. Aldrey
3,
Daniel Rivero
4,
Purificación Cacabelos
3,
Javier Andrade-Garda
1,
Juan M. Pías-Peleteiro
3 and
Santiago Rodríguez-Yáñez
1
1
Grupo ISLA, Department of Computación, Faculty of Informática, Universidade da Coruña, Elviña, 15071 A Coruña, Spain
2
Clinical Health Research Institute of Santiago de Compostela (IDIS), Universidade de Santiago de Compostela, 15706 Santiago de Compostela, Spain
3
Department of Neurology, Hospital Clínico Universitario de Santiago de Compostela, 15706 Santiago de Compostela, Spain
4
Grupo RNASA-IMEDIR, Department of Computación, Faculty of Informática, Universidade da Coruña, Elviña, 15071 A Coruña, Spain
*
Author to whom correspondence should be addressed.
Appl. Sci. 2018, 8(9), 1629; https://doi.org/10.3390/app8091629
Submission received: 10 August 2018 / Revised: 7 September 2018 / Accepted: 9 September 2018 / Published: 12 September 2018

Abstract

:
Depression and cognitive impairment are intimately associated, especially in elderly people. However, the association between late-life depression (LLD) and mild cognitive impairment (MCI) is complex and currently unclear. In general, it can be said that LLD and cognitive impairment can be due to a common cause, such as a vascular disease, or simply co-exist in time but have different causes. To contribute to the understanding of the evolution and prognosis of these two diseases, this study’s primary intent was to explore the ability of artificial neural networks (ANNs) to identify an MCI subtype associated with depression as an entity by using the scores of an extensive neurological examination. The sample consisted of 96 patients classified into two groups: 42 MCI with depression and 54 MCI without depression. According to our results, ANNs can identify an MCI that is highly associated with depression distinguishable from the non-depressed MCI patients (accuracy = 86%, sensitivity = 82%, specificity = 89%). These results provide data in favor of a cognitive frontal profile of patients with LLD, distinct and distinguishable from other cognitive impairments. Therefore, it should be taken into account in the classification of MCI subtypes for future research, including depression as an essential variable in the classification of a patient with cognitive impairment.

1. Introduction

Depression and cognitive impairment are intimately associated, especially in elderly people. The type of cognitive impairment that has been associated with patients with depression as a group is mainly dysexecutive and with alteration in speed of information processing and memory function [1,2]. However, there is variability between the cognitive profiles that arise in elderly patients and depression, suggesting that this syndrome represents a heterogeneous group of disorders that require careful treatment planning and close neuropsychiatric monitoring [3].
The relationship between late-life depression (LLD) and mild cognitive impairment (MCI) remains controversial. Some authors have found depression associated with a subtype of frontal cognitive impairment in contrast with other amnestic subtypes or an alteration in several domains [4] that mostly do not progress to dementia [5,6]. Other authors associate depression in MCI as a factor connected with the possible progression to dementia [7]. According to Panza et al. [8], patients with MCI and a lifetime history of depression have more than twice the risk of dementia than those without depression. On the other hand, other authors find that patients with depressive pseudo-dementias are more likely to develop later a primary degenerative dementia such as Alzheimer’s disease [9].
Broadly, we can say that late-life depression and cognitive impairment can be due to a common cause, such as a vascular disease, or simply co-exist in time but have different causes, like the depression that appears in the first stages of Alzheimer’s disease (AD) [3]. Table 1 shows the main clinical features and the diagnostic criteria for LLD and MCI. It is noteworthy that the profiles are very similar between both entities.
Data analysis of MCI or LLD as independent entities has been performed using both classical statistical and machine learning (ML) methods. A multitude of classification studies exists about the prediction of an early diagnosis of AD, the differential diagnosis of MCI, and the prediction of its conversion into AD, as evidenced by the review performed by Sarica et al. [10]. Depression has also been studied via machine learning methods using clinical and imaging features. For instance, in the study undertaken by Patel et al. [11], the authors tried to estimate accurate prediction models for LLD depression diagnosis and treatment response using multiple ML methods with inputs of multi-modal imaging, clinical, and network-based features. They found that nonlinear combinations of multi-modal imaging and/or non-imaging measures could successfully estimate prediction models for diagnosis (87.27% accuracy) and treatment response (89.47% accuracy) of LLD. A recent study proposed an ML approach to identifying placebo responders in LLD trials [12].
However, the relationship between MCI and LLD has mainly been established using only classical statistics. In their study, Duffy et al. [13] compared patients with MCI with and without a history of depression and healthy controls using neuropsychological assessments and ANOVA analysis as well as the white matter microstructure obtained with diffusion tensor imaging which was analyzed using tract-based spatial statistics. In addition, to evaluate the association of LLD with MCI and dementia, Richard et al. [14] used regression methods in their study with the neuropsychological information obtained. The study of Liao et al. [15] aimed to examine the characteristics of cognitive dysfunction in LLD and amnestic MCI with a battery of neuropsychological tests measuring the domains of memory, executive function, processing speed, attention and visuospatial skill, and neuroimaging biomarkers using a series of statistical processes including profile analysis and multiple regression analysis. Only Lebedeva et al. [16], in their study, focused on the prediction of MCI or dementia after a one-year follow-up in LLD patients using neuropsychological scores and neuroimaging biomarkers, and employing ML techniques. In that study, MCI and dementia diagnoses were predicted in LLD patients with an accuracy of 81%.
The analysis of neuropsychological and neuroimaging data with ML techniques has strongly influenced the neuroscience community. Among the ML techniques, the artificial neural networks (ANNs) are flexible, non-linear, and multidimensional mathematical systems, easily implemented and handled, and capable of solving complex functions in very diverse fields [17]. ANNs are computing paradigms, inspired by neurosciences, where the organization and storage of information are connected by computational units or nodes to allow signals to travel through the network. ANNs have been widely used in science, engineering, and medicine for solving different problems. Their ability to accurately classify and recognize patterns has encouraged researchers to employ them in solving numerous clinical problems, obtaining remarkable results. In medicine, they have been proposed as a viable computational tool in order to provide support in clinical decision-making, classification, and prediction of cognitive functioning [18]. Their clinical applications include diagnosis and outcome prediction in a wide range of diseases, such as cancer [19], diabetes [20], or acute stroke mortality [21]. Regarding other neurological disorders, ANNs have been recently applied for classifying different multiple sclerosis courses [22] and for white matter lesion segmentation [23] by using neuroimaging data. Additionally, they have been used for Parkinson’s disease diagnosis [24] or for epileptic seizure detection using EEG signals [25,26]. ANNs have also been successfully used in neurodegenerative diseases for AD prediction [27] or MCI and AD diagnosis using neuropsychological variables [18] or magnetic resonance neuroimaging biomarkers [28,29].
As we stated before, the mechanisms underpinning the association between depression and MCI are complex and currently unclear. Therefore, it would be interesting to characterize the common patterns of cognitive impairment and depression and thus contribute to the understanding of the potential mechanism involved in the evolution and prognosis of these two diseases. Even though ML techniques and ANNs have proven very useful in discriminating MCI and AD patients from healthy controls or LLD patients, there are, to our knowledge, no studies regarding the identification of MCI associated with depression as an entity. In this study, our primary intent was to explore the effectiveness of ANNs to identify this MCI associated with depression.

2. Materials and Methods

2.1. Participants

In a retrospective study, an extensive neurological examination was performed in the Neurology Department of the University Hospital Complex of Santiago de Compostela (http://xxisantiago.sergas.gal) from January 2016 to December 2017 of patients with suspected MCI. These evaluations were performed in a standard manner by the same neuropsychologist with expertise in MCI. A patient was diagnosed with MCI when the individual presented more than one standard deviation below the age and education norms in well-standardized neuropsychological tests, in several cognitive areas, or in several indexes within the same area. The exclusion criteria were: (1) patients who in the cognitive testing did not show evidence of cognitive impairment, (2) patients with a diagnosis of initial Alzheimer’s disease or other dementias, and (3) patients under 50 years of age.
The MCI patients were classified into two groups: MCI with depression and MCI without depression. Patients with depression were defined as: those taking antidepressant medication, under treatment in the Mental Health Department, or having a score above the cut-off point of depression established in the Geriatric Depression Scale (GDS). The scale was first created in 1982 by J.A. Yesavage et al. [30] specifically for identifying depression in the elderly. It has been extensively used since then and widely tested for reliability and validity. The GDS established a cut-off score of 11 in the elderly, but some authors use a more stringent cut-off score of 14. We used the latter cut-off because it has proven to be better in elderly people and patients physically ill or with dementia.

2.2. Neuropsychological Evaluation

In this section, the cognitive areas that were evaluated and the tests used for each one are described:
  • Attention. Digit Span Forward and Backward. These tests evaluate the number of digits that a person can immediately hold in the same direction (attentional span) or in the opposite direction (working memory). These include the Trail Making Test Part A (TMT A) [31].
  • Executive Function. The Frontal Assessment Battery (FAB) [32], a bedside cognitive and behavioral battery to assess frontal lobe function and identify a dysexecutive syndrome. The Verbal fluency p and Verbal fluency animals test involves the generation of items from two specific categories in a minute: words that begin with p and animals. The Spanish multicenter normative studies (NEURONORMA project) [33] were used.
  • Memory. The Spanish adaptation of the California Verbal Learning Test was used, called the Test of Verbal Learning España-Complutense (TAVEC) [34], where the patient must learn 16 words in five trials. Then, the patient must learn a new list of interferences. After that, the patient must remember the first list in short-term free recall, memory with short-term cued recall, long-term free recall, memory with long-term cued recall, and recognition. The Rey–Osterrieth Complex Figure Test (Memory) [35] was used to evaluate visual memory; patients had to reproduce the complex figure they have previously drawn.
  • Praxis. The abbreviated Barcelona Test (a-BT) [36], a subtest of gestural and bimanual praxis, where the patient must make and copy different gestures such as saying hello, asking for silence, etc., and the visuo-constructional praxis and the Rey–Osterrieth Complex Figure Test (Copy) [35], where the patient must draw a complex figure.
  • Language. The Abbreviated Boston Naming Test (BNT Abbreviated) [37], where the patient must name 15 drawings, and the abbreviated Barcelona Test (a-BT) command, where the patient must perform a series of simple commands.
The neuropsychological assessment was standardized according to age and education norms for the Spanish population, and z-scores were calculated for the 17 tests.

2.3. Statistical Analysis

The Statistical Package for Social Sciences (SPSS v.22) was used to investigate group differences in neuropsychological z-scores. The analysis of variance (ANOVA) with post hoc analysis (Bonferroni) was used to compare neuropsychological data amongst groups (significance level was set at 0.001). The homogeneity of variance assumption was met for all variables (Levene test).

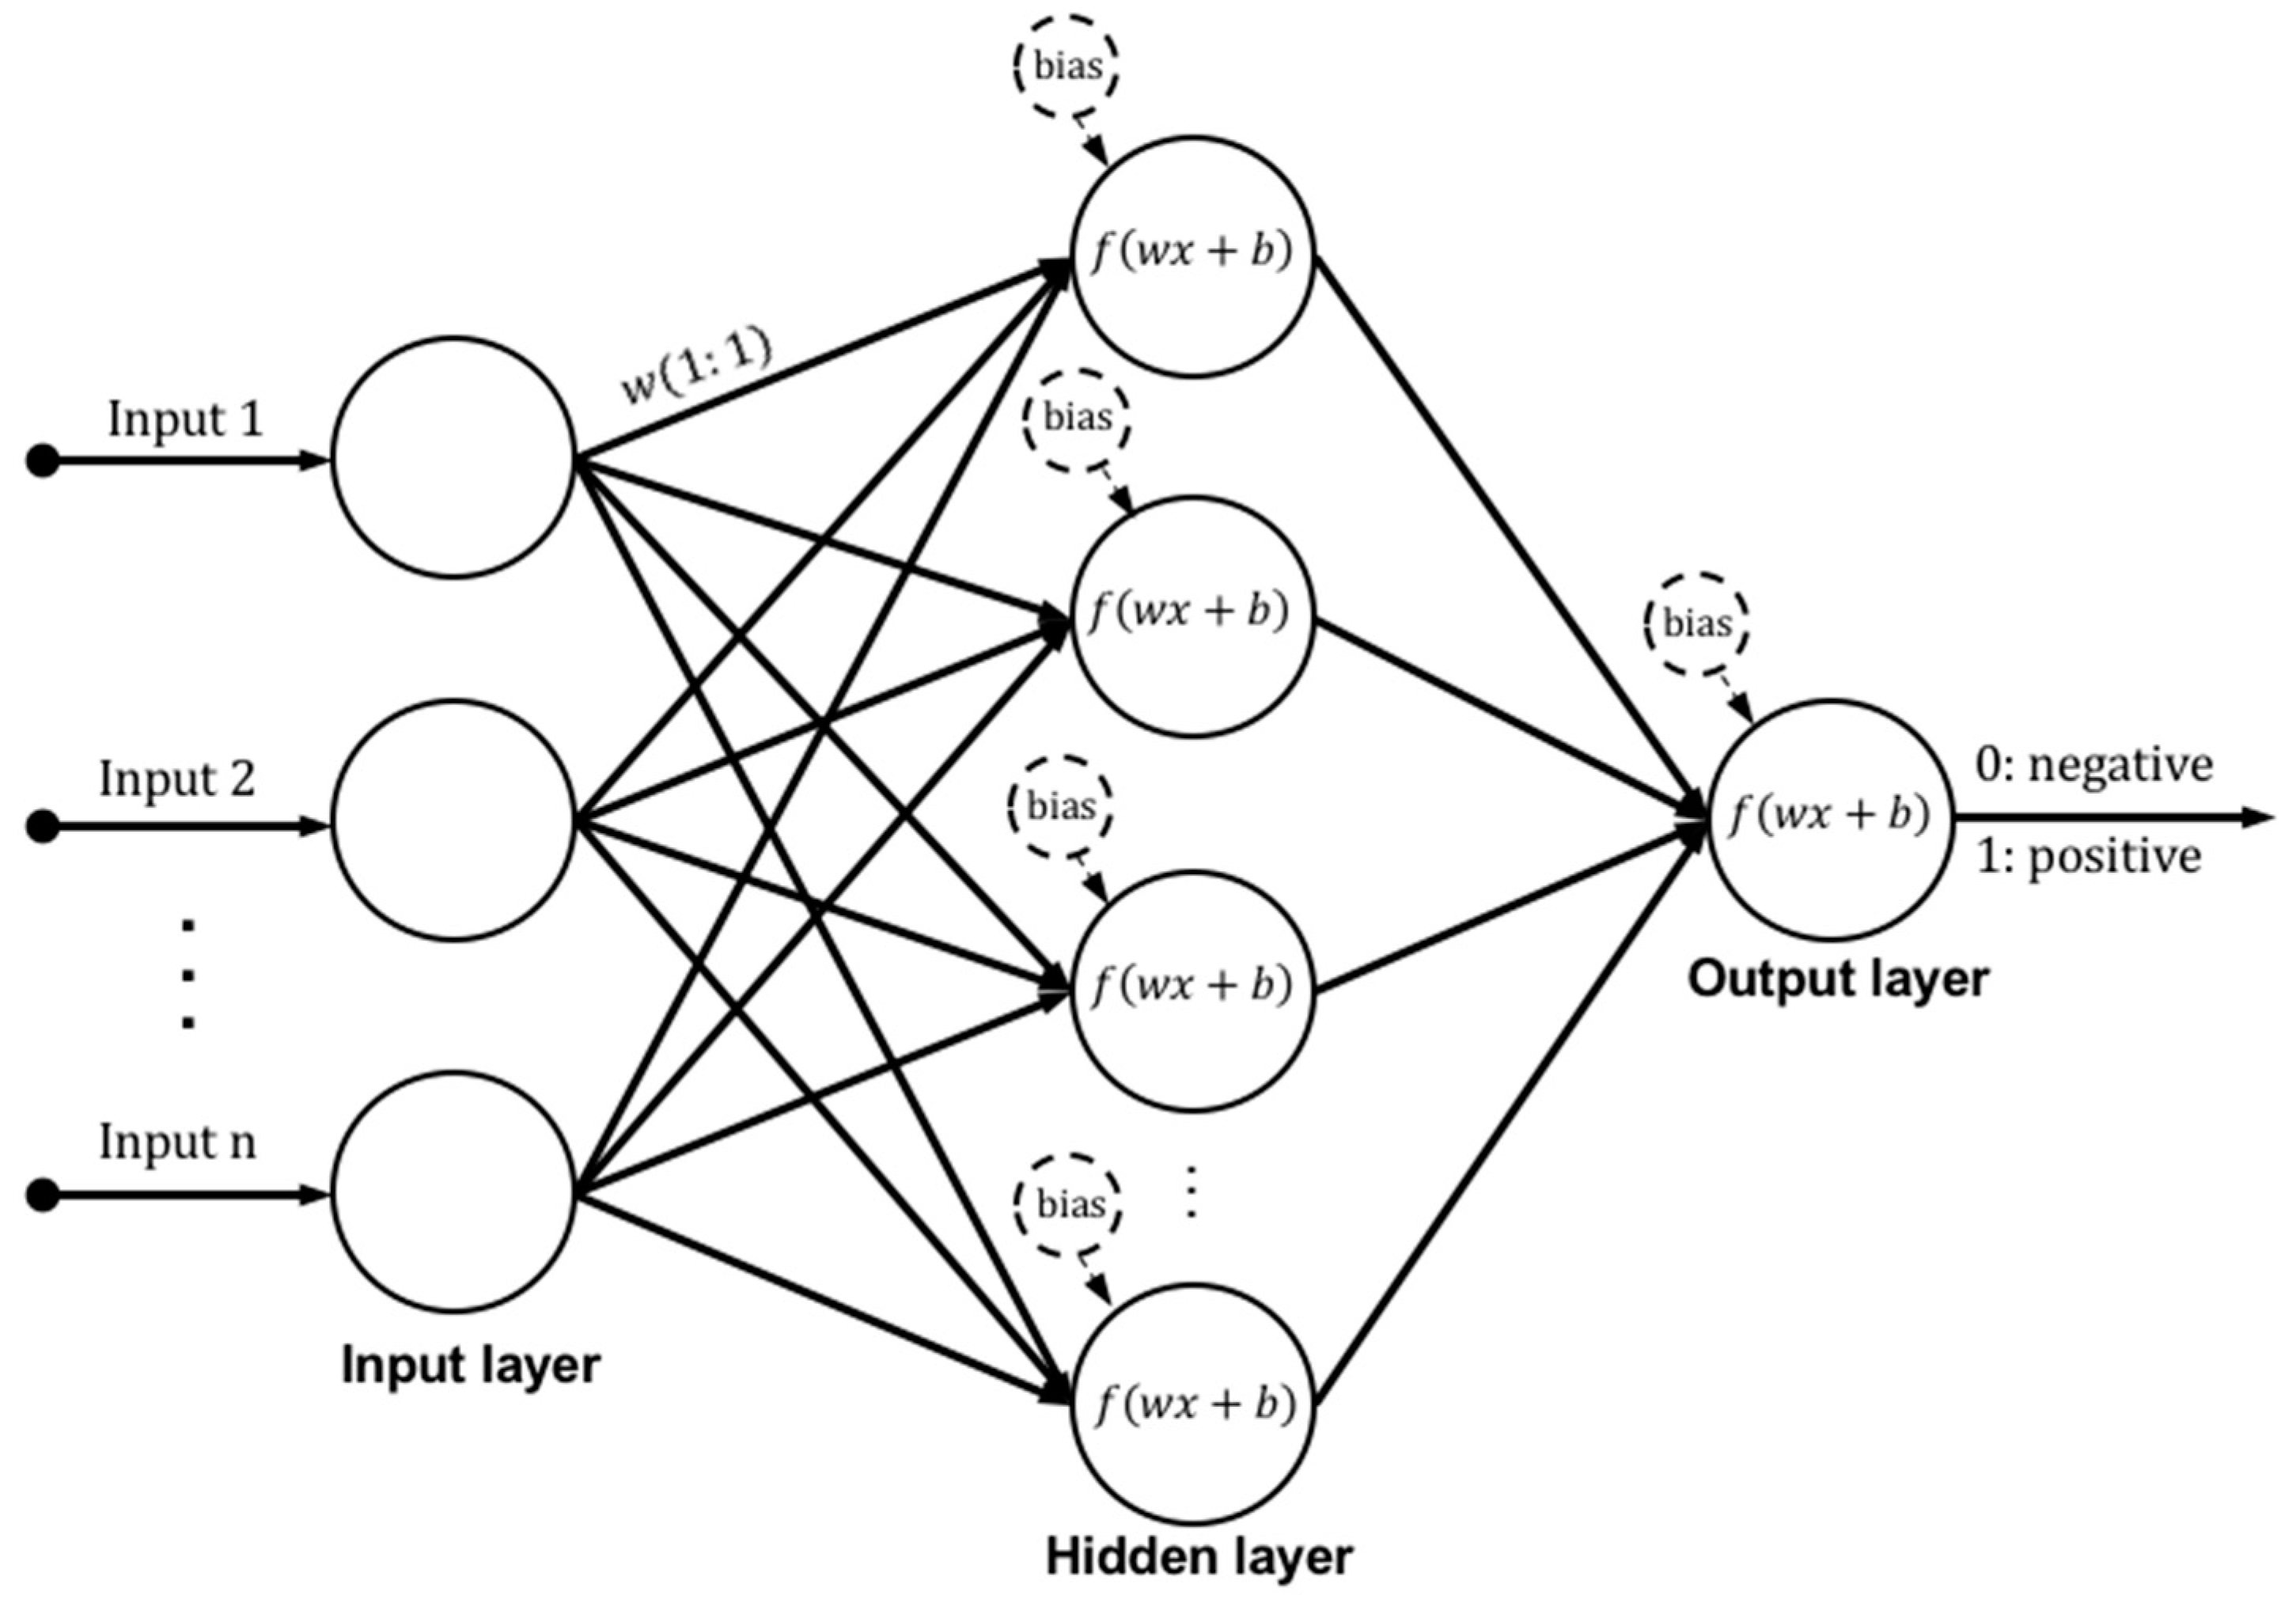
2.4. Classification Using Artificial Neural Networks

A multi-layer perceptron neural network (MLPNN) was used for the analysis. The MLPNN is a neural network for performing varied detection and classification tasks. MLPNN has features such as the ability to learn and generalize, a smaller training data requirement, fast operation, and easy implementation. For these reasons, it is one of the neural network models most widely used [25]. It organizes the processing units, neurons, in layers with feedforward connections only between consecutive layers. Therefore, the general scheme includes an input layer, zero or more hidden layers, and an output layer (see Figure 1). The MLPNN training process was performed using a back-propagation technique in a supervised learning scheme. For the neural transfer functions, a hyperbolic tangent sigmoid function for the hidden layers and a normalized exponential function for the output layer were used. The following approach was applied for the optimization of the MLPNN performance:
  • Data partition. Data partitioning can be used to determine the accuracy of a model’s estimates of new data. For this work, we chose a 10-fold repeated cross-validation method. This subtype of cross-validation method randomly breaks the dataset into 10 subsets, which are sequentially used as test sets, while the other nine are used for training. This cross-validation method was repeated 50 times to obtain the information necessary to perform a statistically significant evaluation.
  • Architecture selection. The number of neurons, layers, and their connections determine the architecture of an ANN. There is no general rule in choosing the best architecture, and optimization is based on testing several architectures until finding one that might offer satisfactory results [25]. Several architectures of the ANN with one and two hidden layers were tested to choose the best one. We evaluated architectures of 3, 8, 12, and 15 neurons for one-layer examples and architectures of {5 3}, {8 5}, {10 8}, and {12 10} neurons for two-layer examples. The optimization algorithm used to train these ANNs is a variation of the gradient descent known as scaled conjugate gradient backpropagation [38]. The results were compared using an analysis of variance (ANOVA) and Tukey’s honest significance test [39], and a p-value of <0.01 was used to determine whether there were statistically significant differences between the proposed architectures.
  • Cut-off value selection. For a given cut-off value or decision threshold, each patient was classified in one of the diagnostic groups by comparing the measurement to this cut-off value. Choosing an appropriate decision threshold is of paramount importance in using a test effectively. There are various methods to determine the optimal test cut-off value, mostly based on a receiver operating characteristic (ROC) analysis. The ROC curve offers a graphical illustration of the true positive rate (sensitivity) against the false positive rate (1–specificity) for all possible cut-off values. Thus, each point on an ROC curve corresponds to a cut-off value and is associated with a test sensitivity and specificity. Sensitivity is the number of correctly detected positive patterns/total number of actual positive patterns. A positive pattern in this context indicates an MCI patient with depression. On the other hand, specificity is the number of correctly detected negative patterns/total number of actual negative patterns. A negative pattern in this context indicates an MCI patient without depression. Locating the best cut-off point requires a compromise between both measures. One of the most common criteria, and the one chosen in this work, is the point on an ROC curve with the best trade-off between specificity and sensitivity, trying to maximize both indices.
  • Performance analysis. The following statistical parameters were computed to evaluate the MLPNN classification performance:
    Accuracy: Number of correctly classified patterns/total number of patterns.
    Sensitivity: The MLPNN’s ability to correctly detect MCI patients with depression.
    Specificity: The MLPNN’s ability to correctly detect MCI patients without depression.
    AUC: Area under an ROC curve, one of the most important evaluation metrics for any classification model’s performance.
This procedure was applied to two ANN substudies: (1) using the whole sample of 17 neuropsychological tests as input patterns and (2) instead of using all features, using the results of the ANOVA analysis to identify the most relevant features. Thus, this substudy contained a subset of the 17 neuropsychological features, that is, those features showing significant differences and, therefore, better able to distinguish between both groups. The objective of the second substudy was to evaluate whether those features could distinguish groups more effectively and whether they could improve the prediction performance with respect to the entire sample.

3. Results

From the initial sample of 162 subjects, 27 were excluded because the cognitive testing did not show evidence of cognitive impairment. Furthermore, 30 patients were excluded because of a diagnosis of initial Alzheimer’s disease or other dementias and 9 patients, for being under 50 years of age. The remaining 96 patients were classified into two MCI groups: MCI with depression (N = 42, mean age 65.7 years, range 52–76) and MCI without depression (N = 54, mean age 69.6 years, range 56–79).
Table 2 summarizes the results from the neuropsychological evaluation of the two groups, MCI with depression and MCI without depression. These results showed a mainly frontal deterioration profile, with mean scores of two standard deviations below the average in the frontal test (FAB), and a low result, that approached one standard deviation below the average, in memory tests. Significant group differences in the ANOVA analysis were found between groups for the Verbal Learning Test (TAVEC) and the Rey complex figure test. Compared to patients without depression, patients with depression had a better performance in all tasks related with verbal memory, but particularly, they had an improvement in memory tasks with cued recall compared with those of free recall. This pattern was not found in patients without depression. In addition, patients with depression showed a worse performance in the copy of the Rey complex figure.
For this work, two substudies of ANNs were carried out in order to identify MCI associated with depression. Table 3 shows the results obtained in both substudies for all the evaluated architectures. Substudy 1 used the z-scores as inputs for the 17 neuropsychological tests. For substudy 2, a subset of features was chosen, namely those tests with more significant differences from Table 2. These were as follows: the Digit Span Backward, the copy of the Rey complex figure and the six subsets of the TAVEC test (8 inputs in total).
Hypothesis tests should be performed to check the significance of differences between ANN configurations [40]. Table 3 shows that statistically significant differences were observed between different architectures. To decide between architectures having statistically equal performances, it is preferred to choose the less complex architecture with the higher accuracy, because simpler models tend to be less prone to overfitting. Therefore, among the evaluated architectures, the one with the best performance with the test dataset was a single hidden layer architecture consisting of 15 neurons for substudy 1 with an accuracy of 86% (sensitivity = 82%, specificity = 89%, AUC = 0.95), which indicated an excellent classification performance. The specificity reached 89%, which meant that the 89% of MCI patients without depression were correctly classified. The sensitivity parameter showed that the 82% of MCI patients with depression were correctly identified by the MLPNN.
From the results shown in Table 3, the following can be observed. In general, the architectures with a single hidden layer perform better than the two-layer architectures. In general, the specificity results are higher than the sensitivity results for all the evaluated architectures in both substudies. Substudy 2 also obtains a good performance (accuracies over 69%) for all the architectures, but only the architecture with two hidden layers of 5 and 3 neurons respectively improves the results of substudy 1 (accuracy = 80%, sensitivity = 73%, specificity = 84%, AUC = 0.93).
The main objective of substudy 2 was to reduce the number of original features by selecting a subset of them and evaluating whether they still retained sufficient information for classification. According to the ANOVA theory, for smaller values of significance, the discriminative capability is better. However, our results showed that, although the subset of eight neuropsychological tests was the one with greater differences between groups, they did not improve the prediction performance with respect to the entire sample. The 17 features were necessary to attain maximum performance.

4. Discussion

The purpose of this study was to explore the effectiveness of ANNs to identify an MCI diagnosis associated with depression. According to our results, the ANN allowed distinguishing between MCI patients with and without depression with an accuracy of 86% (sensitivity = 82%, specificity = 89%, AUC = 0.95). Those results were based on the application, for the first time, of ANNs to identify an MCI subtype associated with depression. Therefore, it is difficult to compare our results with previous studies. A similar study [16], although it used an inverse approach, tried to discriminate between LLD patients who were diagnosed with MCI or dementia using a random forest classifier and neuroimaging biomarkers. The authors predicted MCI and dementia diagnoses in LLD patients with an accuracy of 81% (sensitivity = 75% and specificity = 86%). We reached a superior classification performance in our study.
Sensitivity and specificity results demonstrated that ANNs performed better in identifying MCI patients non-associated with depression than in MCI patients associated with depression. The reason that might explain these results was the heterogeneity in the depression group, where there could be patients with LLD and, theoretically, the depression would be one more symptom of vascular damage and there could be patients who had cognitive impairment and depression but due to a different profile or cause. The group with depression had a higher variability due to the symptom spectrum of cognitive impairments. This study highlights the value of neuropsychological data, a relatively inexpensive and non-invasive technique required for diagnosis purposes whose predictive power has not been fully exploited, as it has been addressed mostly by classical statistical methods.
From a cognitive point of view, the results showed a below-average performance in memory tasks in both groups, worse in those patients without depression. Performance improved slightly with the use of cues in depressed patients. Other studies [41,42] found a similar memory profile in patients with depression, characterized by difficulties in the recovery processes that were more influenced by executive functions such as free recall, as opposed to other recovery processes using cues and recognition. The fact that patients with depression score better in memory tests supports the idea that, in the group of patients complaining of memory problems and who are not depressed, there are more patients in a prodromal phase of Alzheimer’s disease and that, in the group of patients with cognitive impairment and depression, there are more patients with a small vessel disease as the origin (that disease affects the executive functions more than memory, because it affects connection areas and frontal lobes more than structures such as the hippocampus, which are affected early in Alzheimer’s disease).
In addition, a worse performance was found in the Rey complex figure for patients with depression. This test evaluates visuo-constructional praxis, but also executive functions. A recent study [43] shows that patients with vascular MCI scored worse than patients with MCI associated with a degenerative cause.
Although this study did not consider a qualitative evaluation, the quantitative assessment showed a deficit that could be the cause of this executive dysfunction, since patients with depression did show a very similar or even better performance in the copy of the figure than in memory (the patients with depression did show a worse performance in the copy of the figure). On the contrary, the group without depression performed worse in memory tasks than in the copy. This would be in favor of an equally dysexecutive profile of these patients as it appears in the literature. In the specifically frontal test, the FAB, patients with depression obtained an average affectation of two standard deviations below their normative group.
This dysexecutive profile supports the hypothesis of many authors regarding the existence of a “vascular depression” characterized by its appearance in advanced ages, the presence of vascular lesions in neuroimaging tests, vascular risk factors, and a poor response to antidepressants [44]. It has been argued that patients with this profile have abnormalities in the frontal lobes and their connections with the limbic and striatal system [44]. Studies with functional magnetic resonance using the default mode network and functional connectivity techniques have observed an altered connection between areas of the dorsolateral, dorsal, and rostral prefrontal cortex with regions of the anterior part of the cingulum, and areas of association [45,46]. The Framingham Heart Study [47] found that the white matter integrity (WMI) was positively associated with change in depression symptoms and that those with an extensive WMI at baseline had a high risk of developing severe depression, in the absence of cardiovascular diseases.
This type of analysis helps us to see the importance of depression in the classification of patients with mild cognitive impairment. As Petersen et al. indicate [48], the concept of MCI is evolving, and the classical classification systems in amnestic MCI and non-amnestic MCI are being improved by the incorporation of new data as the biomarkers. This improvement allows a better classification of those patients with MCI who are in a prodromal phase of Alzheimer’s disease [49]. However, the depression in the new classification systems continues to be shown to be independent of the MCI, either as a cause in major depression or as an independent added symptom when it is milder [50]. However, in our study, we were able to distinguish between depressive and non-depressed patients only with cognitive data. Thus, we showed how depression could be a further alteration of the process underlying the MCI, forming with it a possible subtype of MCI. It would therefore be interesting to include depression as part of that MCI, and not as something external to it.
However, this study should be interpreted within the context of several limitations. First, the sample size was relatively small. Because this was a retrospective study, we had to deal with missing variables that were not collected at the time and, due to that, many patients could not be included in the ANN analysis. For example, data concerning the antidepressant treatments or their effect were not collected. Although one of the characteristics of LLD patients as a group is the poor response to treatment, it is true that at the individual level it can have an effect, especially in those patients who present MCI and associated reactive depression. Therefore, future studies should consider this variable to evaluate its impact on the results. In addition, this study only included neuropsychological scores. Future work should focus on incorporating other variables of interest, such as the presence of vascular risk factors and neuroimaging data, and on performing extensive studies for comparing the efficiency of this model with other non-linear methods, such as non-linear discriminant analysis or support vector machines. Despite the limitations, this study shows that ANNs are a useful tool for studying this pathology. They provide data in favor of a cognitive frontal profile of patients with LLD, distinct and distinguishable from other cognitive impairments, regardless of the assessment made about their mood.

5. Conclusions

Until now, the classification of MCI subtypes has been based on the presence of memory impairment or deficits in multiple cognitive domains due to the influence of the profile classically associated with Alzheimer’s disease. Our study shows that ANNs can identify a cognitive impairment that affects free recall memory and the executive functions, but mostly, one that is highly associated with depression. This MCI associated with depression as an entity is distinguishable from the rest of MCI. Therefore, it should be taken into account in the classification of MCI subtypes for future research, including depression as an essential variable in the classification of a patient with cognitive impairment. However, new studies are needed in this regard and the analysis of ANNs has proven to be an adequate tool for that research.

Author Contributions

Conceptualization, V.M.-A., I.J., R.G.-V. and S.R.-Y.; Methodology, I.J., J.M.A., D.R., P.C. and J.M.P.-P.; Software, V.M.-A., R.G.-V., D.R., J.A.-G. and S.R.-Y.; Validation, J.M.A., P.C., J.A.-G. and J.M.P.-P.; Investigation, V.M.-A., I.J., R.G.-V. and S.R.-Y.; Data Curation, V.M.-A. and S.R.-Y.; Writing–Original Draft Preparation, V.M.-A., I.J. and S.R.-Y.; Writing–Review and Editing, R.G.-V., J.M.A., D.R., P.C., J.A.-G. and J.M.P.-P.

Funding

This research received no external funding.

Conflicts of Interest

The authors declare no conflict of interest.

References

  1. Alexopoulos, G.S.; Kiosses, D.N.; Klimstra, S.; Kalayam, B.; Bruce, M.L. Clinical presentation of the “depression-executive dysfunction syndrome” of late life. Am. J. Geriatr. Psychiatry 2002, 10, 98–106. [Google Scholar] [PubMed]
  2. Butters, M.A.; Whyte, E.M.; Nebes, R.D.; Begley, A.E.; Dew, M.A.; Mulsant, B.H.; Zmuda, M.D.; Bhalla, R.; Meltzer, C.C.; Pollock, B.G.; et al. The nature and determinants of neuropsychological functioning in late-life depression. Arch. Gen. Psychiatry 2004, 61, 587–595. [Google Scholar] [CrossRef] [PubMed]
  3. Morimoto, S.S.; Kanellopoulos, D.; Manning, K.J.; Alexopoulos, G.S. Diagnosis and treatment of depression and cognitive impairment in late life. Ann. N. Y. Acad. Sci. 2015, 1345, 36–46. [Google Scholar] [CrossRef] [PubMed] [Green Version]
  4. De Assis Faria, C.; Alves, H.V.D.; Barbosa, E.N.B.E.; Charchat-Fichman, H. Cogbnitive deficits in older adults with mild cognitive impairment in a two-year follow-up study. Dement. Neuropsychol. 2018, 12, 19–27. [Google Scholar] [CrossRef] [PubMed]
  5. Gao, Y.; Huang, C.; Zhao, K.; Ma, L.; Qiu, X.; Zhang, L.; Xiu, Y.; Chen, L.; Lu, W.; Huang, C.; et al. Depression as a risk factor for dementia and mild cognitive impairment: A meta-analysis of longitudinal studies. Int. J. Geriatr. Psychiatry 2013, 28, 441–449. [Google Scholar] [CrossRef] [PubMed]
  6. Diniz, B.S.; Butters, M.A.; Albert, S.M.; Dew, M.A.; Reynolds, C.F., 3rd. Late-life depression and risk of vascular dementia and Alzheimer’s disease: Systematic review and meta-analysis of community-based cohort studies. Br. J. Psychiatry 2013, 202, 329–335. [Google Scholar] [CrossRef] [PubMed]
  7. Makizako, H.; Shimada, H.; Doi, T.; Tsutsumimoto, K.; Hotta, R.; Nakakubo, S.; Makino, K.; Suzuki, T. Comorbid Mild Cognitive Impairment and Depressive Symptoms Predict Future Dementia in Community Older Adults: A 24-Month Follow-Up Longitudinal Study. J. Alzheimers Dis. 2016, 54, 1473–1482. [Google Scholar] [CrossRef] [PubMed]
  8. Panza, F.; Frisardi, V.; Capurso, C.; D’Introno, A.; Colacicco, A.M.; Imbimbo, B.P.; Santamato, A.; Vendemiale, G.; Seripa, D.; Pilotto, A.; et al. Late-life depression, mild cognitive impairment, and dementia: Possible continuum? Am. J. Geriatr. Psychiatry 2010, 18, 98–116. [Google Scholar] [CrossRef] [PubMed]
  9. Alexopoulos, G.S.; Meyers, B.S.; Young, R.C.; Mattis, S.; Kakuma, T. The course of geriatric depression with “reversible dementia”: A controlled study. Am. J. Psychiatry 1993, 150, 1693–1699. [Google Scholar] [PubMed]
  10. Sarica, A.; Cerasa, A.; Quattrone, A.; Calhoun, V. Editorial on special issue: Machine learning on MCI. J. Neurosci. Methods 2018, 302, 1–2. [Google Scholar] [CrossRef] [PubMed]
  11. Patel, M.J.; Andreescu, C.; Price, J.C.; Edelman, K.L.; Reynolds, C.F., 3rd; Aizenstein, H.J. Machine learning approaches for integrating clinical and imaging features in late-life depression classification and response prediction. Int. J. Geriatr. Psychiatry 2015, 30, 1056–1067. [Google Scholar] [CrossRef] [PubMed] [Green Version]
  12. Zilcha-Mano, S.; Roose, S.P.; Brown, P.J.; Rutherford, B.R. A Machine Learning Approach to Identifying Placebo Responders in Late-Life Depression Trials. Am. J. Geriatr. Psychiatry 2018, 26, 669–677. [Google Scholar] [CrossRef] [PubMed]
  13. Duffy, S.L.; Paradise, M.; Hickie, I.B.; Lewis, S.J.G.; Naismith, S.L.; Lagopoulos, J. Cognitive impairment with and without depression history: An analysis of white matter microstructure. J. Psychiatry Neurosci. 2014, 39, 135–143. [Google Scholar] [PubMed]
  14. Richard, E.; Reitz, C.; Honig, L.H.; Schupf, N.; Tang, M.X.; Manly, J.J.; Mayeux, R.; Devanand, D.; Luchsinger, J.A. Late-life depression, mild cognitive impairment, and dementia. JAMA Neurol. 2013, 70, 374–382. [Google Scholar] [CrossRef] [PubMed]
  15. Liao, W.; Zhang, X.; Shu, H.; Wang, Z.; Liu, D.; Zhang, Z. The characteristic of cognitive dysfunction in remitted late life depression and amnestic mild cognitive impairment. Psychiatry Res. 2017, 251, 168–175. [Google Scholar] [CrossRef] [PubMed]
  16. Lebedeva, A.K.; Westman, E.; Borza, T.; Beyer, M.K.; Engedal, K.; Aarsland, D.; Selbaek, G.; Haberg, A.K. MRI-Based Classification Models in Prediction of Mild Cognitive Impairment and Dementia in Late-Life Depression. Front. Aging Neurosci. 2017, 9, 13. [Google Scholar] [CrossRef] [PubMed]
  17. Bishop, C.M. Neural Networks for Pattern Recognition; Clarendon Press: Gloucestershire, UK, 1995; ISBN 9780198538646. [Google Scholar]
  18. Quintana, M.; Guàrdia, J.; Sánchez-Benavides, G.; Aguilar, M.; Molinuevo, J.L.; Robles, A.; Barquero, M.S.; Antúnez, C.; Martínez-Parra, C.; Frank-García, A.; et al. Using artificial neural networks in clinical neuropsychology: High performance in mild cognitive impairment and Alzheimer’s disease. J. Clin. Exp. Neuropsychol. 2012, 34, 195–208. [Google Scholar] [CrossRef] [PubMed]
  19. Lisboa, P.J.; Taktak, A.F.G. The use of artificial neural networks in decision support in cancer: A systematic review. Neural Netw. 2006, 19, 408–415. [Google Scholar] [CrossRef] [PubMed]
  20. Erkaymaz, O.; Ozer, M.; Perc, M. Performance of small-world feedforward neural networks for the diagnosis of diabetes. Appl. Math. Comput. 2017, 311, 22–28. [Google Scholar] [CrossRef]
  21. Çelik, G.; Baykan, Ö.K.; Kara, Y.; Tireli, H. Predicting 10-day mortality in patients with strokes using neural networks and multivariate statistical methods. J. Stroke Cerebrovasc. Dis. 2014, 23, 1506–1512. [Google Scholar] [CrossRef] [PubMed]
  22. Ion-Mărgineanu, A.; Kocevar, G.; Stamile, C.; Sima, D.M.; Durand-Dubief, F.; Van Huffel, S.; Sappey-Marinier, D. A Comparison of Machine Learning Approaches for Classifying Multiple Sclerosis Courses Using MRSI and Brain Segmentations. In Artificial Neural Networks and Machine Learning—ICANN 2017; Springer: Cham, Switzerland, 2017; pp. 643–651. [Google Scholar]
  23. Valverde, S.; Cabezas, M.; Roura, E.; González-Villà, S.; Pareto, D.; Vilanova, J.C.; Ramió-Torrentà, L.; Rovira, À.; Oliver, A.; Lladó, X. Improving automated multiple sclerosis lesion segmentation with a cascaded 3D convolutional neural network approach. Neuroimage 2017, 155, 159–168. [Google Scholar] [CrossRef] [PubMed] [Green Version]
  24. Peker, M.; Sen, B.; Delen, D. Computer-Aided Diagnosis of Parkinson’s Disease Using Complex-Valued Neural Networks and mRMR Feature Selection Algorithm. J. Healthc. Eng. 2015, 6, 281–302. [Google Scholar] [CrossRef] [PubMed]
  25. Guo, L.; Rivero, D.; Pazos, A. Epileptic seizure detection using multiwavelet transform based approximate entropy and artificial neural networks. J. Neurosci. Methods 2010, 193, 156–163. [Google Scholar] [CrossRef] [PubMed]
  26. Kocadagli, O.; Langari, R. Classification of EEG signals for epileptic seizures using hybrid artificial neural networks based wavelet transforms and fuzzy relations. Expert Syst. Appl. 2017, 88, 419–434. [Google Scholar] [CrossRef]
  27. Payan, A.; Montana, G. Predicting Alzheimer’s disease: A neuroimaging study with 3D convolutional neural networks. arXiv 2015, arXiv:1502.02506. [Google Scholar]
  28. Munteanu, C.R.; Fernandez-Lozano, C.; Mato Abad, V.; Pita Fernández, S.; Álvarez-Linera, J.; Hernández-Tamames, J.A.; Pazos, A. Classification of mild cognitive impairment and Alzheimer’s Disease with machine-learning techniques using 1H Magnetic Resonance Spectroscopy data. Expert Syst. Appl. 2015, 42, 6205–6214. [Google Scholar] [CrossRef] [Green Version]
  29. Basaia, S.; Agosta, F.; Wagner, L.; Magnani, G.; Filippi, M. Automatic classification of patients with Alzheimer’s disease (AD) and mild cognitive impairment (MCI) who will convert to AD using deep neural networks (P3.179). Neurology 2018, 90, P3.179. [Google Scholar]
  30. Yesavage, J.A.; Brink, T.L.; Rose, T.L.; Lum, O.; Huang, V.; Adey, M.; Leirer, V.O. Development and validation of a geriatric depression screening scale: A preliminary report. J. Psychiatr. Res. 1982, 17, 37–49. [Google Scholar] [CrossRef]
  31. Peña-Casanova, J.; Quiñones-Ubeda, S.; Quintana-Aparicio, M.; Aguilar, M.; Badenes, D.; Molinuevo, J.L.; Torner, L.; Robles, A.; Barquero, M.S.; Villanueva, C.; et al. Spanish Multicenter Normative Studies (NEURONORMA Project): Norms for verbal span, visuospatial span, letter and number sequencing, trail making test, and symbol digit modalities test. Arch. Clin. Neuropsychol. 2009, 24, 321–341. [Google Scholar] [CrossRef] [PubMed]
  32. Appollonio, I.; Leone, M.; Isella, V.; Piamarta, F.; Consoli, T.; Villa, M.L.; Forapani, E.; Russo, A.; Nichelli, P. The Frontal Assessment Battery (FAB): Normative values in an Italian population sample. Neurol. Sci. 2005, 26, 108–116. [Google Scholar] [CrossRef] [PubMed]
  33. Peña-Casanova, J.; Quiñones-Ubeda, S.; Gramunt-Fombuena, N.; Quintana-Aparicio, M.; Aguilar, M.; Badenes, D.; Cerulla, N.; Molinuevo, J.L.; Ruiz, E.; Robles, A.; et al. Spanish Multicenter Normative Studies (NEURONORMA Project): Norms for verbal fluency tests. Arch. Clin. Neuropsychol. 2009, 24, 395–411. [Google Scholar] [CrossRef] [PubMed]
  34. Benedet, M.J. TAVEC: Test de Aprendizaje Verbal España-Complutense; TEA: Madrid, Spain, 1998; ISBN 9788471745293. [Google Scholar]
  35. Peña-Casanova, J.; Gramunt-Fombuena, N.; Quiñones-Úbeda, S.; Sánchez-Benavides, G.; Aguilar, M.; Badenes, D.; Molinuevo, J.L.; Robles, A.; Barquero, M.S.; Payno, M.; et al. Spanish Multicenter Normative Studies (NEURONORMA Project): Norms for the Rey-Osterrieth Complex Figure (Copy and Memory), and Free and Cued Selective Reminding Test. Arch. Clin. Neuropsychol. 2009, 24, 371–393. [Google Scholar] [CrossRef] [PubMed] [Green Version]
  36. Peña-Casanova, J.; Guardia, J.; Bertran-Serra, I.; Manero, R.M.; Jarne, A. Versión abreviada del test Barcelona (I): Subtests y perfiles normales. Neurología 1997, 12, 99–111. [Google Scholar] [PubMed]
  37. Calero, M.D.; Arnedo, M.L.; Navarro, E.; Ruiz-Pedrosa, M.; Carnero, C. Usefulness of a 15-item version of the Boston Naming Test in neuropsychological assessment of low-educational elders with dementia. J. Gerontol. B Psychol. Sci. Soc. Sci. 2002, 57, P187–P191. [Google Scholar] [CrossRef] [PubMed]
  38. Møller, M.F. A scaled conjugate gradient algorithm for fast supervised learning. Neural Netw. 1993, 6, 525–533. [Google Scholar] [CrossRef]
  39. Abdi, H.; Willians, L.J. Tukey’s Honestly Significant Difference (HSD) Test. In Encyclopedia of Research Design; Sage: Thousand Oaks, CA, USA, 2010; pp. 1–5. [Google Scholar]
  40. Ramírez-Morales, I.; Fernández-Blanco, E.; Rivero, D.; Pazos, A. Automated early detection of drops in commercial egg production using neural networks. Br. Poult. Sci. 2017, 58, 739–747. [Google Scholar] [CrossRef] [PubMed] [Green Version]
  41. Elderkin-Thompson, V.; Mintz, J.; Haroon, E.; Lavretsky, H.; Kumar, A. Executive dysfunction and memory in older patients with major and minor depression. Arch. Clin. Neuropsychol. 2007, 22, 261–270. [Google Scholar] [CrossRef] [PubMed]
  42. Lamar, M.; Charlton, R.; Zhang, A.; Kumar, A. Differential associations between types of verbal memory and prefrontal brain structure in healthy aging and late life depression. Neuropsychologia 2012, 50, 1823–1829. [Google Scholar] [CrossRef] [PubMed] [Green Version]
  43. Salvadori, E.; Dieci, F.; Caffarra, P.; Pantoni, L. Qualitative Evaluation of the Immediate Copy of the Rey-Osterrieth Complex Figure: Comparison between Vascular and Degenerative MCI Patients. Arch. Clin. Neuropsychol. 2018. [Google Scholar] [CrossRef] [PubMed]
  44. Taylor, W.D.; Aizenstein, H.J.; Alexopoulos, G.S. The vascular depression hypothesis: Mechanisms linking vascular disease with depression. Mol. Psychiatry 2013, 18, 963–974. [Google Scholar] [CrossRef] [PubMed]
  45. Samara, Z.; Evers, E.A.T.; Peeters, F.; Uylings, H.B.M.; Rajkowska, G.; Ramaekers, J.G.; Stiers, P. Orbital and Medial Prefrontal Cortex Functional Connectivity of Major Depression Vulnerability and Disease. Biol. Psychiatry Cogn. Neurosci. Neuroimaging 2018, 3, 348–357. [Google Scholar] [CrossRef] [PubMed] [Green Version]
  46. Alexopoulos, G.S.; Hoptman, M.J.; Kanellopoulos, D.; Murphy, C.F.; Lim, K.O.; Gunning, F.M. Functional connectivity in the cognitive control network and the default mode network in late-life depression. J. Affect. Disord. 2012, 139, 56–65. [Google Scholar] [CrossRef] [PubMed] [Green Version]
  47. Qiu, W.Q.; Himali, J.J.; Wolf, P.A.; DeCarli, D.C.; Beiser, A.; Au, R. Effects of white matter integrity and brain volumes on late life depression in the Framingham Heart Study. Int. J. Geriatr. Psychiatry 2017, 32, 214–221. [Google Scholar] [CrossRef] [PubMed]
  48. Petersen, R.C.; Caracciolo, B.; Brayne, C.; Gauthier, S.; Jelic, V.; Fratiglioni, L. Mild cognitive impairment: A concept in evolution. J. Intern. Med. 2014, 275, 214–228. [Google Scholar] [CrossRef] [PubMed]
  49. Albert, M.S.; DeKosky, S.T.; Dickson, D.; Dubois, B.; Feldman, H.H.; Fox, N.C.; Gamst, A.; Holtzman, D.M.; Jagust, W.J.; Petersen, R.C.; et al. The diagnosis of mild cognitive impairment due to Alzheimer’s disease: Recommendations from the National Institute on Aging-Alzheimer’s Association workgroups on diagnostic guidelines for Alzheimer’s disease. Alzheimers Dement. 2011, 7, 270–279. [Google Scholar] [CrossRef] [PubMed]
  50. American Psychiatric Association. Diagnostic and Statistical Manual of Mental Disorders, 5th ed.; APA Publishing: Washington, DC, USA, 2013. [Google Scholar]
Figure 1. An example of a multi-layer perceptron neural network with one hidden layer representation.
Applsci 08 01629 g001
Table 1. Diagnostic criteria and clinical features in late-life depression (LLD) and mild cognitive impairment (MCI). CI = cognitive impairment; SD = standard deviation.
Clinical FeaturesLLDMCI
Diagnostic criteriaClinically significant alteration of mood
Beginning in the elderly (>50 years)
Clinically significant CI determined by the presence of alteration of −1.5 SD below the average in one or more cognitive areas.
Other symptomsCan present subjective memory impairment or MCICan or cannot present mood disturbance, apathy, anxiety, or mild behavioral impairment
Daily life activitiesCan give up doing complex instrumental activities for motivational reasons or apathy.Can present difficulties or have delegated complex instrumental activities to others but does not meet criteria for dementia.
EtiologyPsychological factors: motivation, social isolation, stressors, etc./Biological factors: alteration of white matter, brain volume, etc.Biological factors: vascular small vessel disease (alteration of white matter), early signs of Alzheimer’s disease, etc.
Table 2. Neuropsychological z-scores for the two groups studied: MCI with depression and MCI without depression. Data are presented in the following form: mean ± standard deviation. Group differences were performed by analysis of variance (ANOVA) with post hoc analysis (Bonferroni), and the significance level was set at 0.001. The degrees of freedom for F values are (1, 95). MCI = mild cognitive impairment; TMT = Trail Making Test; FAB = Frontal Assessment Battery; TAVEC = Test of Verbal Learning España-Complutense; Rey–OCF = Rey–Osterrieth Complex Figure; a-BT = abbreviated Barcelona test.
VariablesMCI with DepressionMCI without DepressionFp Value
Digit Span Forward0.20 ± 0.890.16 ± 0.740.040.845
Digit Span Backward−0.10 ± 0.960.53 ± 0.639.260.004
TMT A−0.48 ± 1.05−0.31 ± 0.820.490.484
FAB−1.95 ± 1.99−2.35 ± 1.710.670.416
Verbal fluency P−0.51 ± 0.66−0.49 ± 0.730.010.945
Verbal fluency animals−0.81 ± 0.85−1.06 ± 0.721.410.240
TAVEC immediate memory−0.84 ± 1.05−1.67 ± 0.6214.31<0.001
TAVEC short-term free recall−0.77 ± 1.07−1.81 ± 1.0713.25<0.001
TAVEC memory (short-term cued recall)−0.48 ± 0.93−1.71 ± 0.9623.22<0.001
TAVEC long-term free recall−0.86 ± 1.02−2.10 ± 1.0021.10<0.001
TAVEC memory (long-term cued recall)−0.65 ± 1.02−2.14 ± 0.9631.70<0.001
TAVEC recognition−0.57 ± 0.96−1.33 ± 1.127.070.010
Rey–OCF (memory)−0.58 ± 0.93−0.63 ± 0.880.040.838
Rey–OCF (copy)−0.52 ± 0.76−0.08 ± 0.517.110.010
a-BT praxis−0.69 ± 2.22−0.60 ± 1.960.0290.865
a-BT praxis bimanual−0.57 ± 2.11−0.67 ± 3.040.020.900
a-BT command−0.32 ± 1.25−0.05 ± 0.840.970.329
Table 3. Results of the evaluated architectures for the multi-layer perceptron neural network (MLPNN) analysis with the test data. Data are presented in the following form: mean ± standard deviation. Means in a column with no common superscript letter differ significantly according to Tukey’s honest significance test for a value of p < 0.01. Substudy 1 has 17 neurons in the input layer (all the neuropsychological tests) and substudy 2 has eight neurons in the input layer (test with more significant differences from Table 2: the Digit Span Backward, the copy of the Rey complex figure and the six subsets of the TAVEC test). The best results for each substudy are in bold. Net. Archit. = Network Architecture.
Net. Archit.AccuracySensitivitySpecificityAUC
Substudy 1Substudy 2Substudy 1Substudy 2Substudy 1Substudy 2Substudy 1Substudy 2
{3}0.75 ac ± 0.170.69 ac ± 0.110.72 ac ± 0.310.77 a ± 0.240.88 a ± 0.200.74 abc ± 0.190.93 a ± 0.070.89 a ± 0.10
{8}0.78 ac ± 0.180.79 bc ± 0.150.69 ac ± 0.310.80 a ± 0.260.85 a ± 0.270.79 abd ± 0.240.94 a ± 0.040.92 a ± 0.08
{12}0.78 ac ± 0.200.73 ac ± 0.170.76 ac ± 0.210.75 a ± 0.330.80 a ± 0.320.78 abd ± 0.210.94 a ± 0.060.91 a ± 0.07
{15}0.86 b ± 0.190.74 ac ± 0.080.82 b ± 0.320.79 a ± 0.320.89 a± 0.170.68 ac ± 0.260.95 a ± 0.050.90 a ± 0.06
{5 3}0.76 ac ± 0.160.80 b ± 0.120.88 bc ± 0.210.73 ab ± 0.250.69 b ± 0.270.84 bd ± 0.210.93 a ± 0.040.93 a ± 0.07
{8 5}0.71 c ± 0.220.71 ac ± 0.160.76 ac ±0.310.75 a ± 0.290.67 b ± 0.330.68 ac ± 0.250.92 a ± 0.070.90 a ± 0.04
{10 8}0.76 ac ± 0.190.70 ac ± 0.200.68 ac ± 0.390.68 ab ± 0.320.78 a ± 0.220.66 ac ± 0.340.92 a ± 0.040.90 a ± 0.10
{12 10}0.79 b ± 0.150.71 ac ± 0.220.83 bc ± 0.180.62 b ± 0.380.83 a ± 0.190.86 bd ± 0.160.92 a ± 0.090.90 a ± 0.08

