1. Introduction
The pavement community is actively using sustainable pavement options, such as extending pavement life to reduce life-cycle cost and work zones, increasing usage of recycled material, and industrial by-product, improving pavement surface characteristics for high skid resistance and low noise [
1]. Open-graded friction course (OGFC) is a high permeable mixture used as a surface coat for good friction, and splash- and-spray reduction during rain storms. It also decreases the potential for hydroplaning and improve visibility by reducing glare from standing water on pavement [
2,
3,
4,
5].
However, limitations with the use of such mixtures are much more affected by the relatively low strength and low stiffness. OGFC pavements typically fail by raveling. More specifically, the pavement fails when the asphalt binder ages and becomes brittle. Draindown, a separation of asphalt mastic from the course skeleton, can occur during storage or transport, which would result in a thin binder coating that is inadequate to prevent particles from being dislodged by traffic. The thin binder film can also age more rapidly, aggravating the raveling problem. Sometimes, the failure occurs when the pavement is only six to eight years old. Such a short life is difficult to accept [
6,
7,
8].
In order to effectively reduce and prevent the occurrence of raveling damages in OGFC pavements, many researchers all over the world have conducted a large number of fruitful studies. Lyons et al. used different stabilizing additives (cellulose fibers, and styrene-butadiene-styrene (SBS)), and crumb rubber modifier (CRM) in a porous asphalt mixture. The results emphasized the importance of stabilizing additives in porous. Further, the results indicated that CRM or the combination of fibers and SBS were the most effective at increasing the abrasion resistance [
9]; Luo et al. investigated a new open-graded asphalt mixture that used epoxy asphalt as binder to improve mix durability. Results showed superior overall performance of the open-graded epoxy asphalt mix compared to conventional open-graded asphalt mix [
10]. Yang et al., conducted a material testing system fatigue test to investigate the fatigue performance of open graded friction courses modified with rock asphalt and rubber powder under different stress ratios. The results showed that modifiers, including natural rock asphalt and rubber powder, were added into OGFC could improve its fatigue performance [
11]. Shen used rubber aggregate to prepare pavement friction course material. The results indicated that the polymer-rubber aggregate modified porous concrete with the optimum replacing ratio of rubber aggregate to mineral aggregate had higher flexural strength and compressive strength than the ordinary polymer modified porous concrete with mineral aggregate [
12].
The technologies of adding the modifier is an effective technique for prolonging the OGFC pavement service life. However, such type of modifier presents high cost that restricts its application in modifying paving asphalt. In the past few years, many studies have been conducted on alternative environmental friendly materials in OGFC to improve its mechanical properties. The use of industrial waste is a promising solution to minimize environmental pollution by sinking the accumulation of waste materials, which results in a reduction of the construction costs [
13,
14,
15]. Hainin et al. investigated utilization of steel slag as an aggregate replacement in porous asphalt mixtures. It was observed that the use of steel slag could perform admirably during high traffic loading [
16]. Cheng et al. used oil shale ash instead of partial mineral powder in the mixture to improve the high- and low-temperature properties of asphalt pavement [
17]. In conclusion, investigating environmental and economic benefits, as well as mechanical performance of OGFC technology is the future of the pavement.
However, to the best of our knowledge, no work has been conducted on mechanical performance evaluation of oil shale waste (OSW) as partial aggregate replacement in OGFC. Therefore, this research aimed to evaluate the comprehensive performance of the replacement of 100% of the virgin aggregates with particle sizes below 4.75 mm in OGFC with OSW and explore the optimized conditions for the preparation of the high-strength OGFC.
2. Materials and Methods
2.1. Materials
‘Pan Jin’ base asphalt (90#, F40-2004,
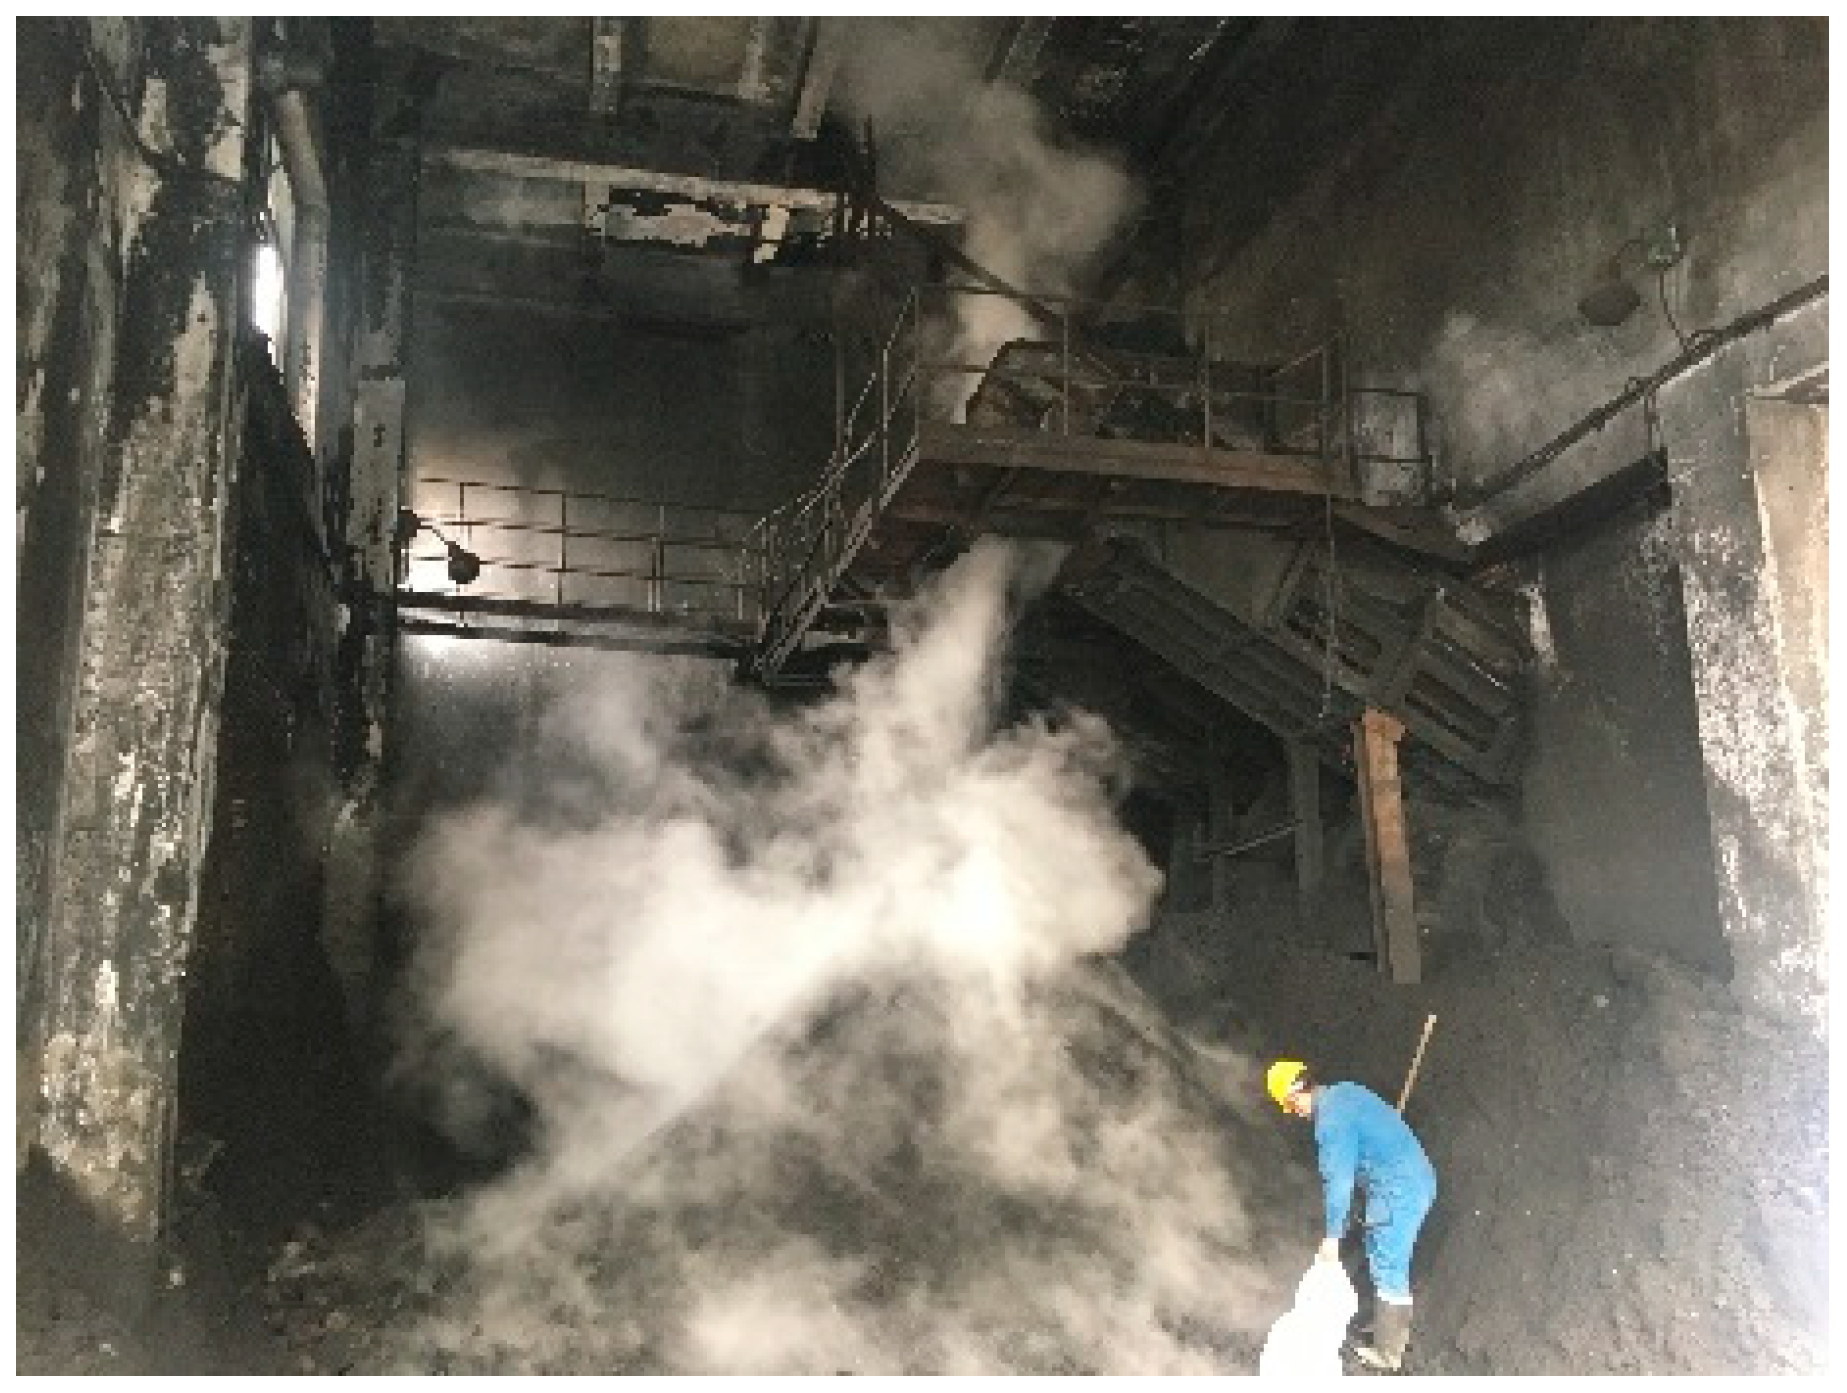
Table 1) acquired from China Petrochemical industry was used in this paper. OSW, acquired from oil shale, was produced by a power plant in Jilin province China, as is shown in
Figure 1. Properties of OSW are shown in
Table 2.
According to
Table 2, it can be seen that the apparent density of the OSW is very close to that of the stone, and the OSW has some characteristics of the rock. However, the OSW generated from the oil shale after extraction has higher crushing value and water absorption. The higher crushing value indicates that the residue cannot bear loads as a skeleton in the asphalt mixture. Higher water absorption may lead to poor water stability of OSW in the pavement material application. So, auxiliary modifiers are needed to improve water stability during application. Silane coupling agent, produced by Shuanglong Chemical Co., Ltd. (Changchun, China), was selected as auxiliary modifiers, since it had been reported to be among the most effective additives for water stability currently available. Silane coupling agent has a special molecular feature, in which it has two different types of functional groups, including organofunctional groups and hydrolysable groups. Silane coupling agent can easily bond silicate material and organic material, due to this molecular feature [
18,
19].
2.2. Oil Shale Waste Preparation
OSW is obtained from combustion of oil shale. Due to the high water absorption of OSW, the OSW stored in open air should be dried in an oven at 120 °C for 4 h. Afterwards, the dried OSW was smashed in the pulverizer, for 3 min, and the used OSW was obtained by sieving the crushed OSW through the 4.75 mm aperture-sized sieve.
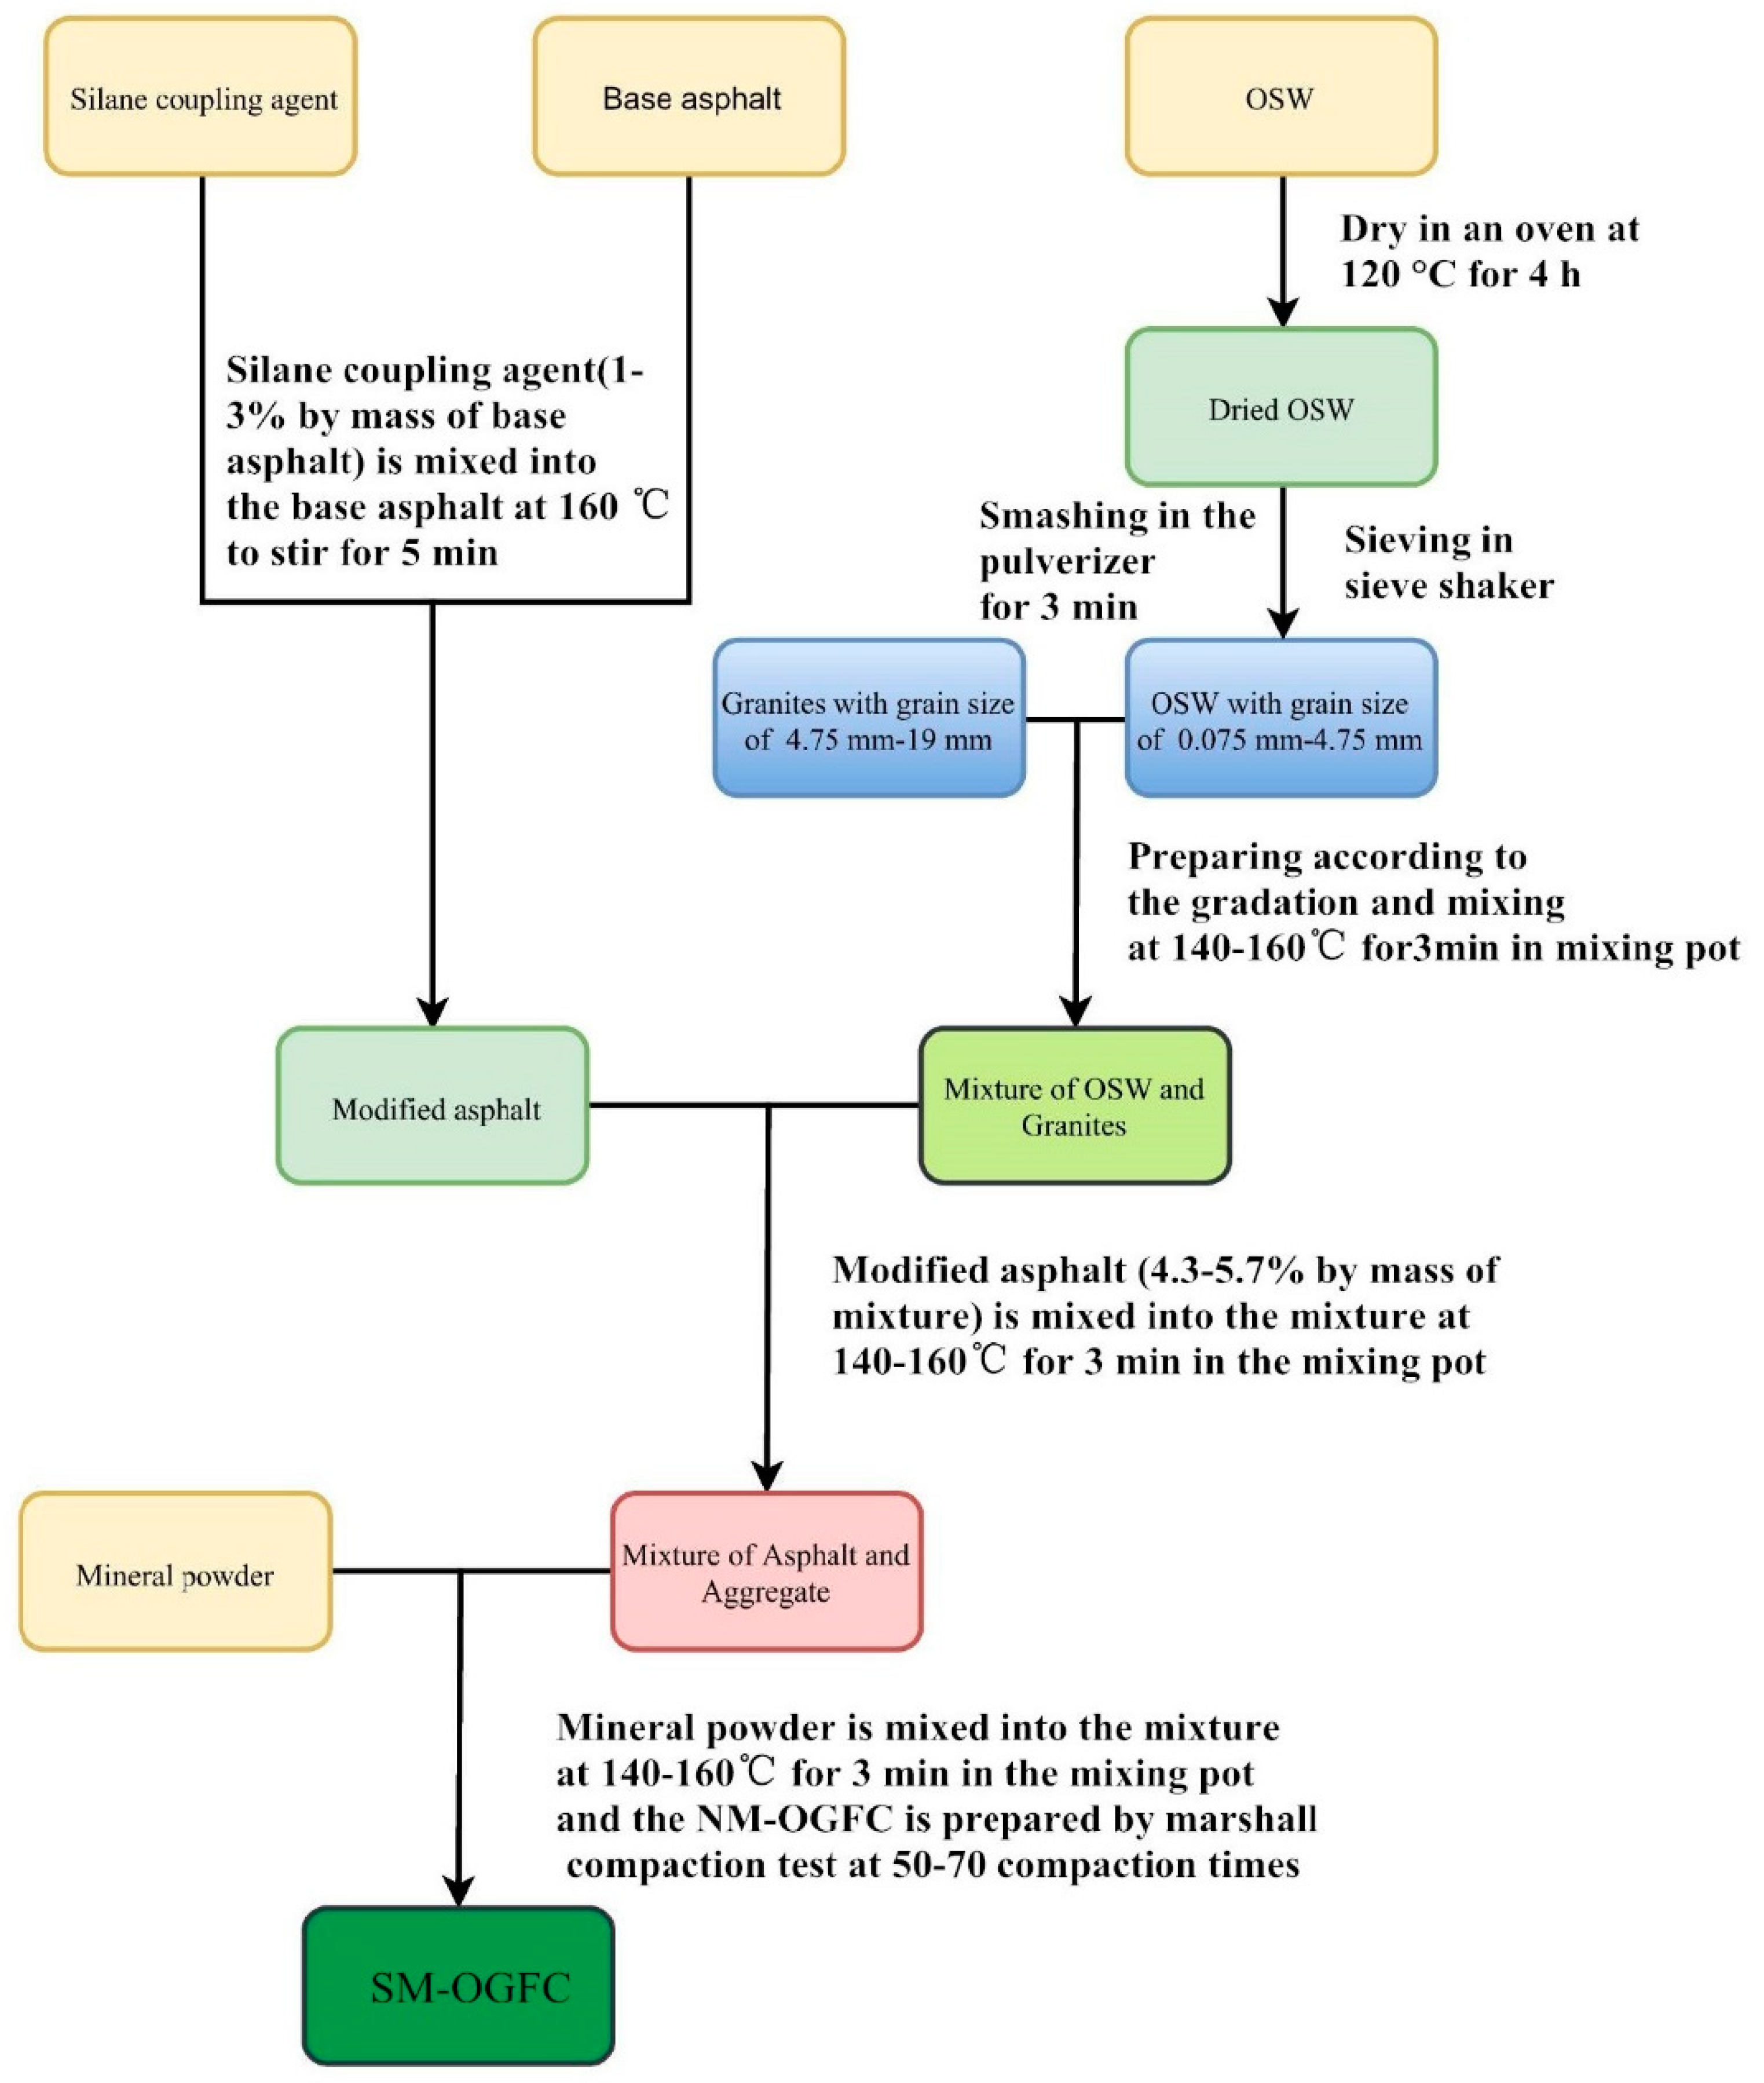
2.3. SM-OGFC Sample Preparation
SM-OGFC samples are prepared to determine the optimization of SM-OGFC with different asphalt-aggregate ratio, different compaction times, different mixing temperature and different silane coupling agent content. Due to the high specific surface of OSW, the silane coupling agent is not suitable for surface treatment of the OSW directly, so pre-mixing of silane coupling agent and the heated base asphalt is necessary for better mixing. Firstly, the silane coupling agent was mixed into the base asphalt at 160 °C to stir for 5 min. After pre-mixing, the asphalt with silane coupling agent, granites with grain size greater than 4.75 mm in gradation, OSW with grain size less than 4.75 mm in gradation and mineral powder with particle size less than 0.075 mm were mixed in the vacuum mixing pot. Finally, the SM-OGFC samples are formed through the compaction of mixture. The gradation of OGFC used in this paper is the most commonly used one in China, which is demonstrated in
Table 3. The flowchart of preparation of the SM-OGFC is shown in
Figure 2. Moreover, two types of OGFC were used for the performance comparison, a conventional OGFC mixture with ’Pan Jin’ base asphalt (OGFC), and a modified OGFC with SBS modified asphalt (SBS-OGFC). All asphalt mixtures were specified based on Technical Specifications for Construction of Highway Asphalt Pavement in China (JTG F40-2004), and the optimum asphalt content was found to be 4.8% and 4.1% for the control mixture.
2.4. Performance Evaluation of SM-OGFC
2.4.1. High-Temperature Mechanical Performance Test
Marshall test and rutting test are conducted to evaluate the high-temperature performance of SM-OGFC according to Chinese standards GB/T0709-2011 and GB/T0719-2011 in this study. By assessing Marshall stability (MS) and dynamic stability (DS), the resistance of SM-OGFC to pressure, horizontal and shear stress induced from the loading in the high-temperature environment can be predicted.
2.4.2. Low-Temperature Mechanical Performance Test
The low-temperature properties of SM-OGFC is observed via Low-temperature splitting test and Low-temperature beam bending test. The splitting strength (RT) of mixtures is obtained by −15 °C splitting test according to Chinese standards GB/T0716-2011. The −15 °C splitting strength is an important factor for assessing the capacity of SM-OGFC to bear dynamic loads at low temperature. The bending-tensile strength (RB), maximum bending strain (ɛB) and the bending stiffness modulus (SB) of mixture is acquired through −10 °C beam bending test according to Chinese standards GB/T0715-2011.
2.4.3. Water Stability Test
Immersion Marshall test was carried out, to evaluate the water stability of SM-OGFC according to Chinese standards GB/T0709-2011 in this study. Due to the interconnected pores and large porosity of OGFC, most of the water can freely discharge in the interconnected pores. However, there is always a part of the moisture remaining in the mixture, due to the surface tension and capillary action of the water, and the presence of the semi-intersecting void semi-connected pore. The volume of free water has expanded after freezing, which generates the internal temperature stress in the OGFC, and this effect can enlarge the micropore and the original crack in the OGFC. The ice crystalloid is transformed into free water, which caused moisture damage with the increase of temperature.
In order to better evaluate the water stability of OGFC in spring-thawing season, this paper use the spring-thawing stability index to evaluate the water stability of OGFC in spring-thawing season. The specimens were treated by vacuum saturation in 97.3 kPa for 15 min and submerged in a container containing water, then the container with specimens were placed in the precision temp-enclosure at −15 °C and frozen 12 h. Then, the specimens were soaked in water at 15 °C for 12 h through controlling the precision temp-enclosure. As described above, a complete freeze-thaw cycle is completed. After 5 freeze-thaw cycles, damaged specimens were collected for Marshall test according to Chinese standards GB/T0709-2011.
2.4.4. Cantabro Test
Standard Cantabro Test was conducted to check the raveling resistance of SM-OGFC mixtures. The SM-OGFC mixtures were mixed and compacted in the laboratory using the Marshall compactor for the Cantabro Test (Chinese standards GB/T0733-2011). The specimens were conditioned to 20 °C for several hours before testing, and the Los Angeles abrasion drum was conditioned to 20 °C ± 0.5 °C. Specimens were weighed, individually subjected to 300 revolutions (30–33 rpm) in the Los Angeles abrasion drum without steel charge, brushed with a soft-bristled brush, and weighed again. The Cantabro losses for each specimen are the mass lost during testing, divided by the specimen initial mass.
2.4.5. Permeability Test and Scanning Electronic Microscopy Test
OGFC mixture is a special type of hot mix asphalt characterized by high interconnected air voids and a coarse, granular skeleton, with proper stone-on-stone contact. The presence of a larger percentage of internal air voids leads to a relatively highly porous structure of OGFC mixes, which helps in quick and effective removal of surface water from the pavement. Thus, the permeability capacity of SM-OGFC determines the performance of permeable pavements. The permeability capacity of SM-OGFC is evaluated via permeability test. The laboratory permeability test is divided into constant head permeability test and falling head permeability test based on Darcy’s law. The constant head permeability test is generally applied to measure the permeability coefficient of high permeability material and the falling head permeability test is applicable to low permeability material [
20,
21]. Therefore, the constant head permeability test was conducted to evaluate the permeability coefficient of SM-OGFC, in accordance with the Specifications for Design of Highway Asphalt Pavement (JTG D50-2006), and the permeability coefficient (
K) is obtained by the Equation (1):
Q: The quality of the water permeating through the specimen during t time (cm3)
L: Infiltration length (cm)
A: Cross-sectional area of the specimen (cm2)
t: Infiltration time (s)
: Water head difference (cm)
Scanning Electron Microscopy test (SEM) was used to magnify the sample and observe its microscopic structure. In this research study, Hitachi SU8000 (Tianmei.co, Tokyo, Japan) scanning electronic microscopy was utilized to observe the micro-structure of OSW particles.
3. Optimization of SM-OGFC by Response Surface Methodology (RSM)
3.1. Central Composite Design
In regards to the optimization of SM-OGFC, several factors, such as the asphalt-aggregate ratio, silane coupling agent content, compaction times and mixing temperature, could remarkably influence the compressive strength SM-OGFC. However, if just a single variable of the aforementioned factors is analyzed, cross-impact of the variables would usually be neglected. On the other hand, a complete experimental design to explore the relationships of the exploratory variables is often time-consuming. In this context, response surface methodology (RSM) has been suggested to find the most valuable point, or called optimization to simplify the experimental design and simultaneously, maximize the production, or minimize the cost, side reactions, etc. RSM has been applied in many fields, such as chemical reactions, industry manufacture and many other product optimization. In regards to the RSM, central composite design (CCD) is often used to support the optimization of a two-level factorial or fraction factorial design, which is usually coded as −1 and 1 so as to simplify the experimental expression and calculation [
22,
23,
24]. Nassar et al. applied a central composite design (CCD) with response surface methodology (RSM) to optimize the mix design parameters of cold bitumen emulsion mixture, namely bitumen emulsion content (BEC), pre-wetting water content (PWC) and curing temperature (CT) [
25]. Wang et al. designed an experimental scheme to optimize three preparation parameters of styrene-butadiene-styrene (SBS)-modified asphalt mixture reinforced with eco-friendly basalt fiber based on response surface methodology (RSM) [
26].
In this study, asphalt-aggregate ratio and silane coupling agent content are considered as key factors in the preparation of SM-OGFC samples; compaction times and mixing temperature are also considered as vital factor in the preparation study. Experiments are designed with six central points.
Table 4 shows the range of asphalt-aggregate ratio, silane coupling agent content, compaction times and mixing temperature respectively. The Marshall stability, −15 °C splitting strength, and spring-thawing stability are considered as the response of the software. In this study, CCD approach suggests 30 experiments; six of them are replicated as the central point.
Table 5 reveals the proffered experiments and results.
3.2. Build RSM Model
Model Fit Summary tab is a statistical appraisement used to suggest the most appropriate model. Take −15 °C splitting strength response model as an example, the details of Model Fit Summary tab are summarized in
Table 6. The proposed quadratic model is suggested, due to the
p-value of the model is less than 0.0001 and the F-value is equal to 44.51.
Based on the experimental data of
Table 5, the regression equation of −15 °C splitting strength is calculated by the Equation (2):
Moreover, it is found that A, B, D, AB, AC, AD, BD, A
2, B
2, and C
2 terms are significant factors with
p-values less than 0.0500 through ANOVA Analysis. The details of ANOVA Analysis are summarized in
Table 7. Based on the analysis above, the original regression is revised. Equation (3) presents the modified regression equation, which deletes the non-significant model terms:
Credibility analysis of modified regression equation is summarized in
Table 8. According to
Table 8, the value of R
2 is almost one, and therefore the experimental results are in good agreement with the predicted values. In addition, the difference between R
2 and R
Adj2 is 0.02, and there is a good accordance between R
Pred2 and R
Adj2 indicating the accuracy of the proposed model.
3.3. RSM Model Validation
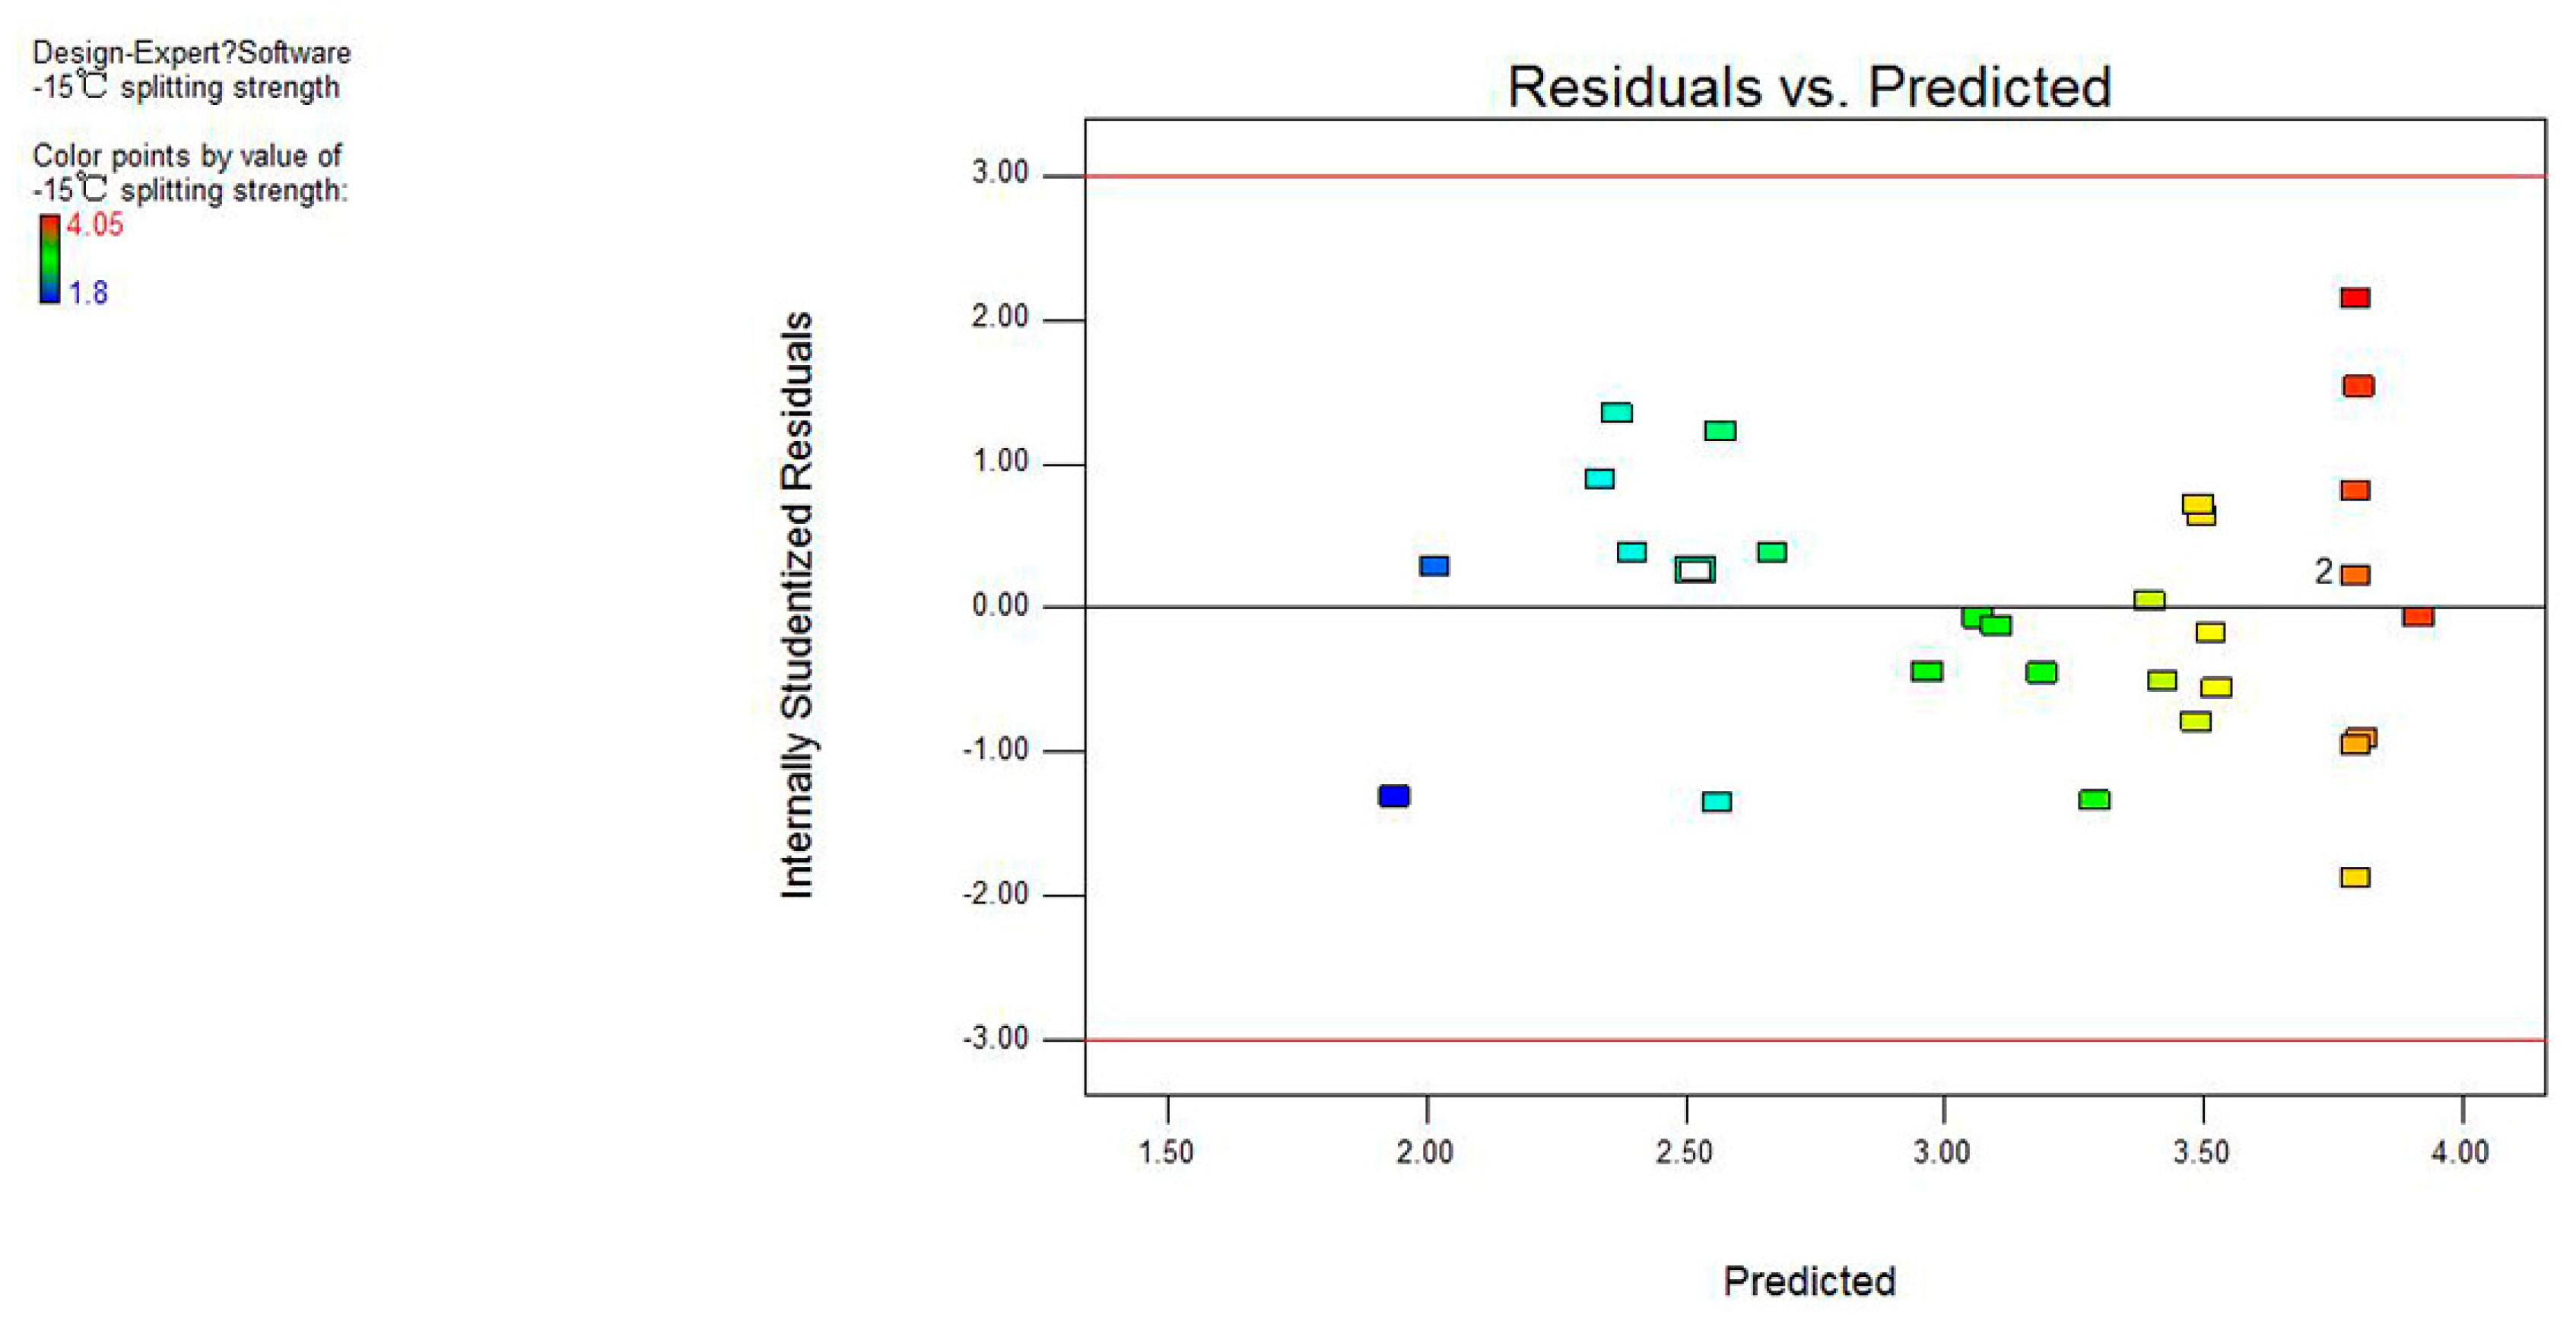
The validation of the model can be examined with the diagnostic tab in the design-expert software. The normal plot of the residuals of −15 °C splitting strength is shown in
Figure 3. A straight line almost covers all the points, and therefore, there is a normal distribution of errors in the experiments. In addition, there is no abnormal pattern or structure in the residuals plot (
Figure 4).
The difference between predicted and actual values of the response is shown in
Figure 5. A straight line almost cover all the points, and therefore there are negligible errors between the predicted and actual responses. Thereupon, the proposed mathematical regression is authentic.
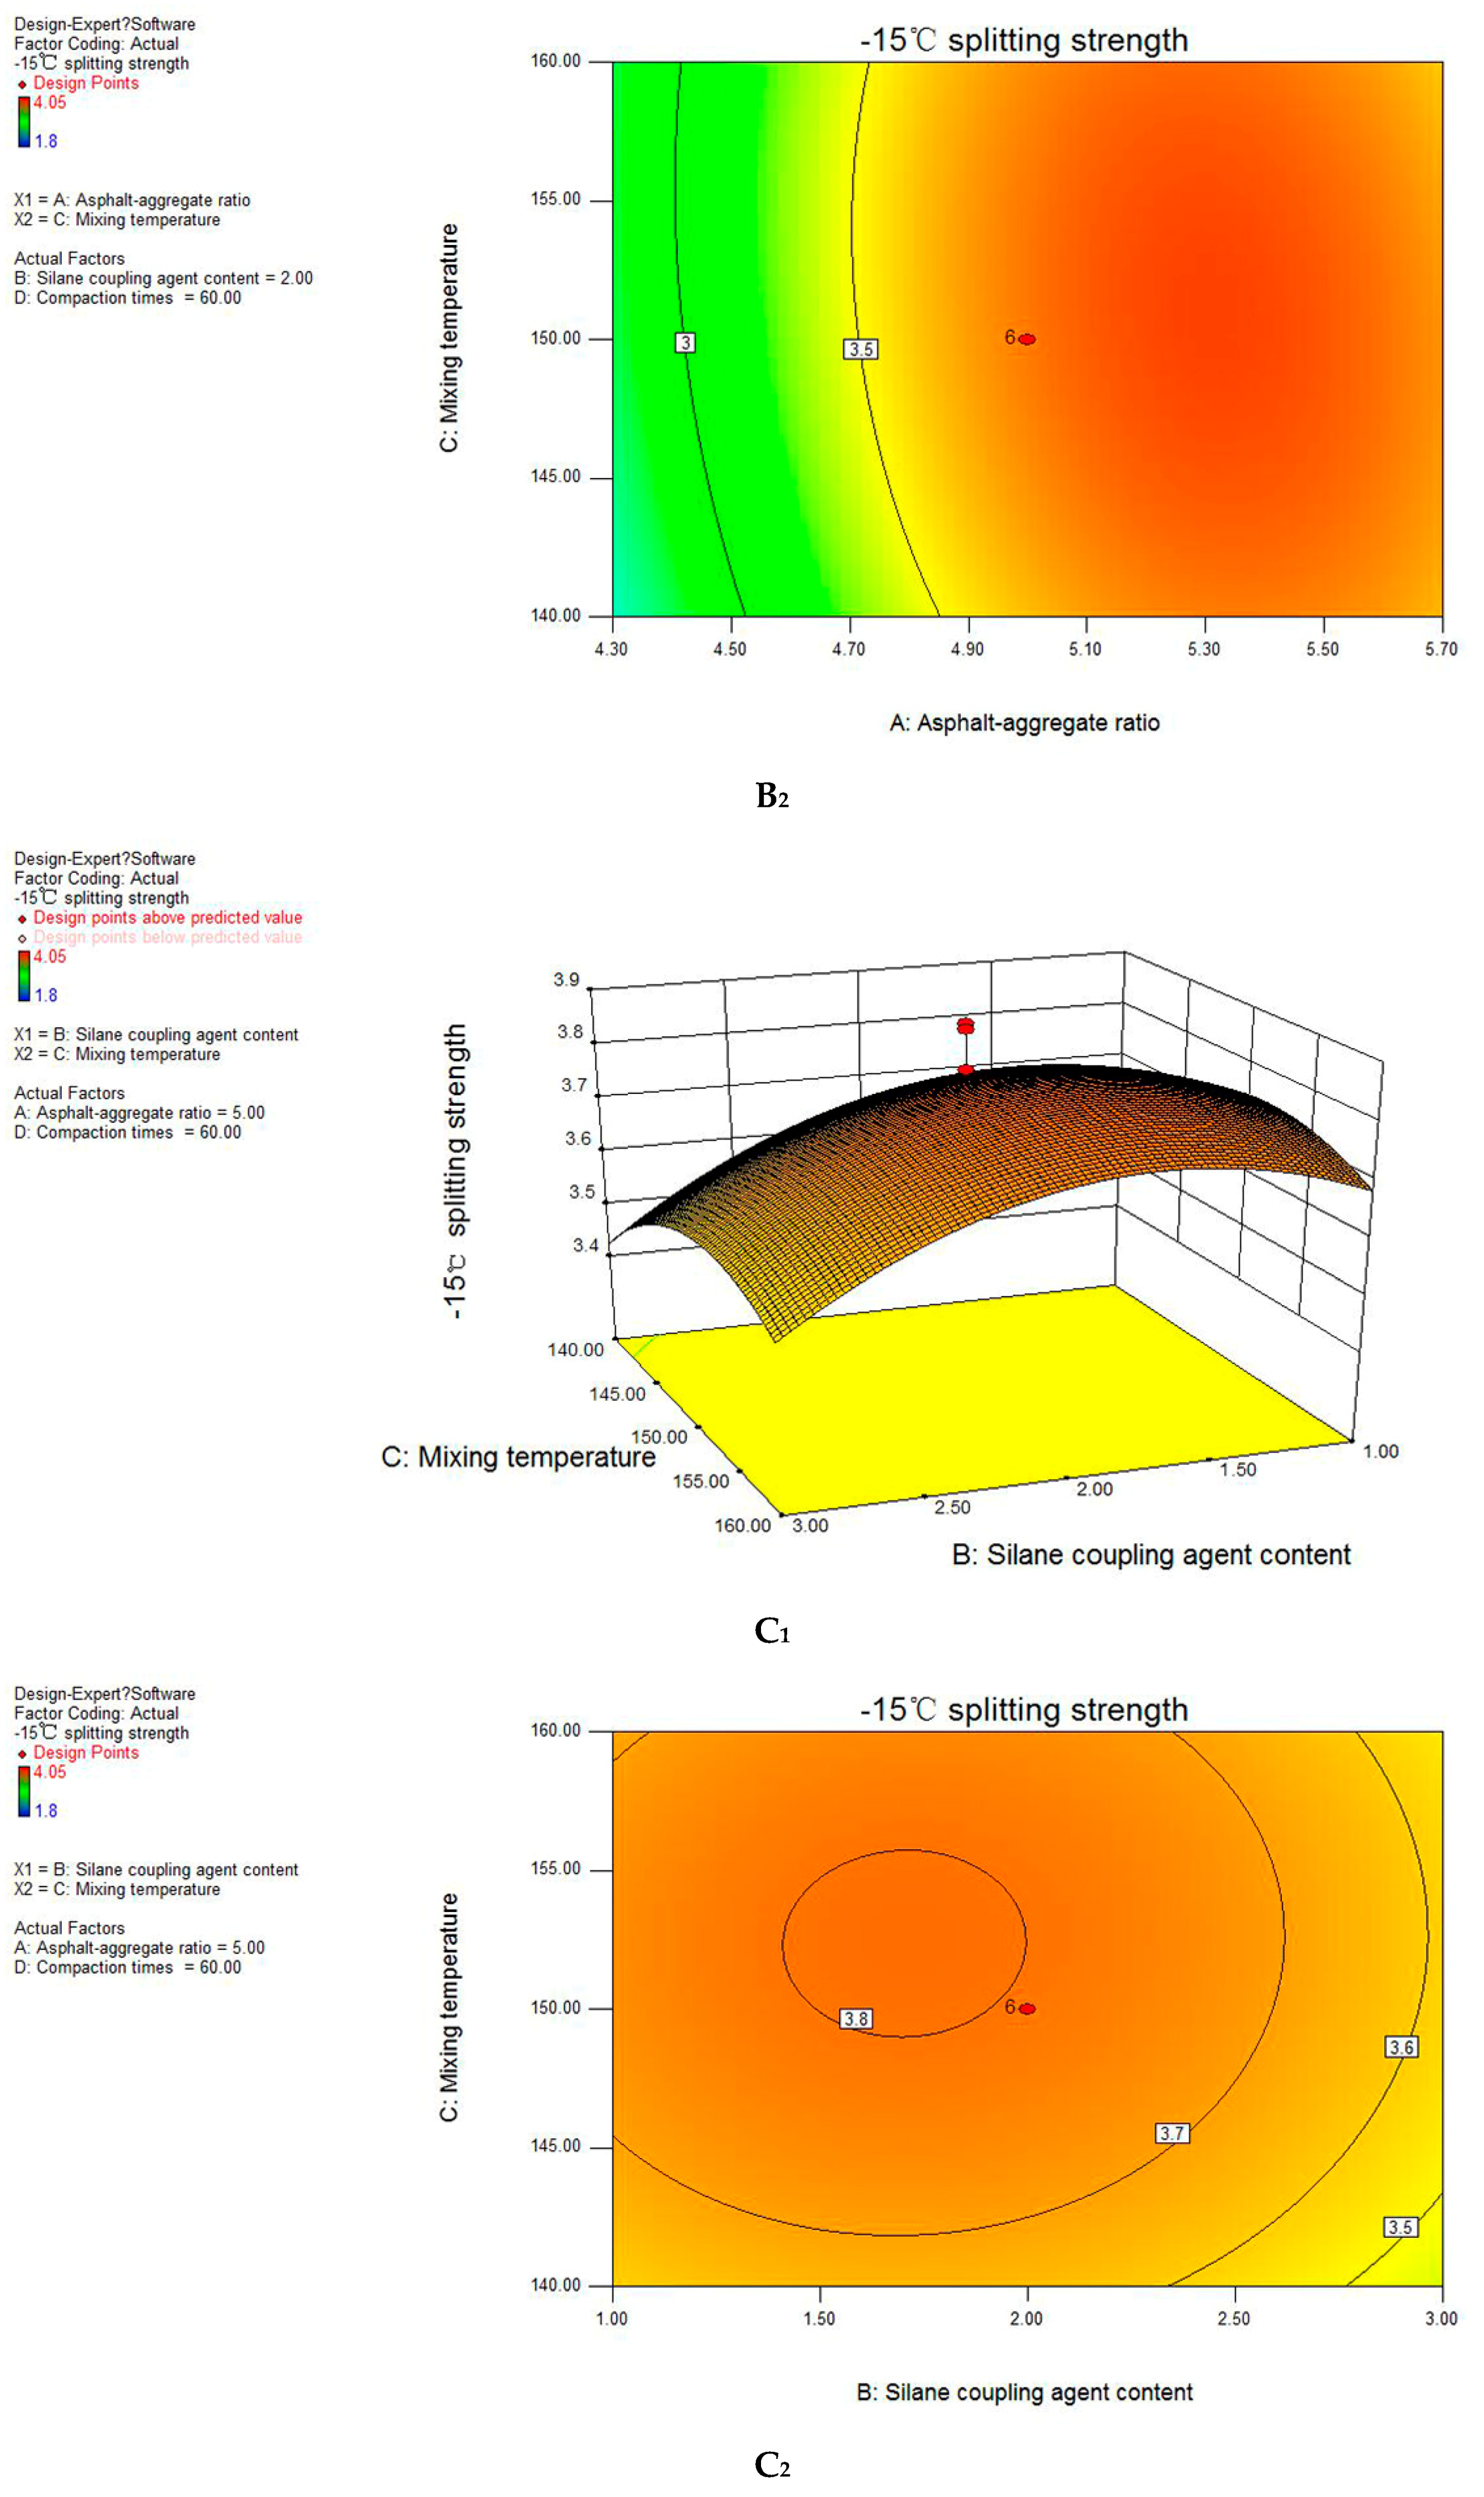
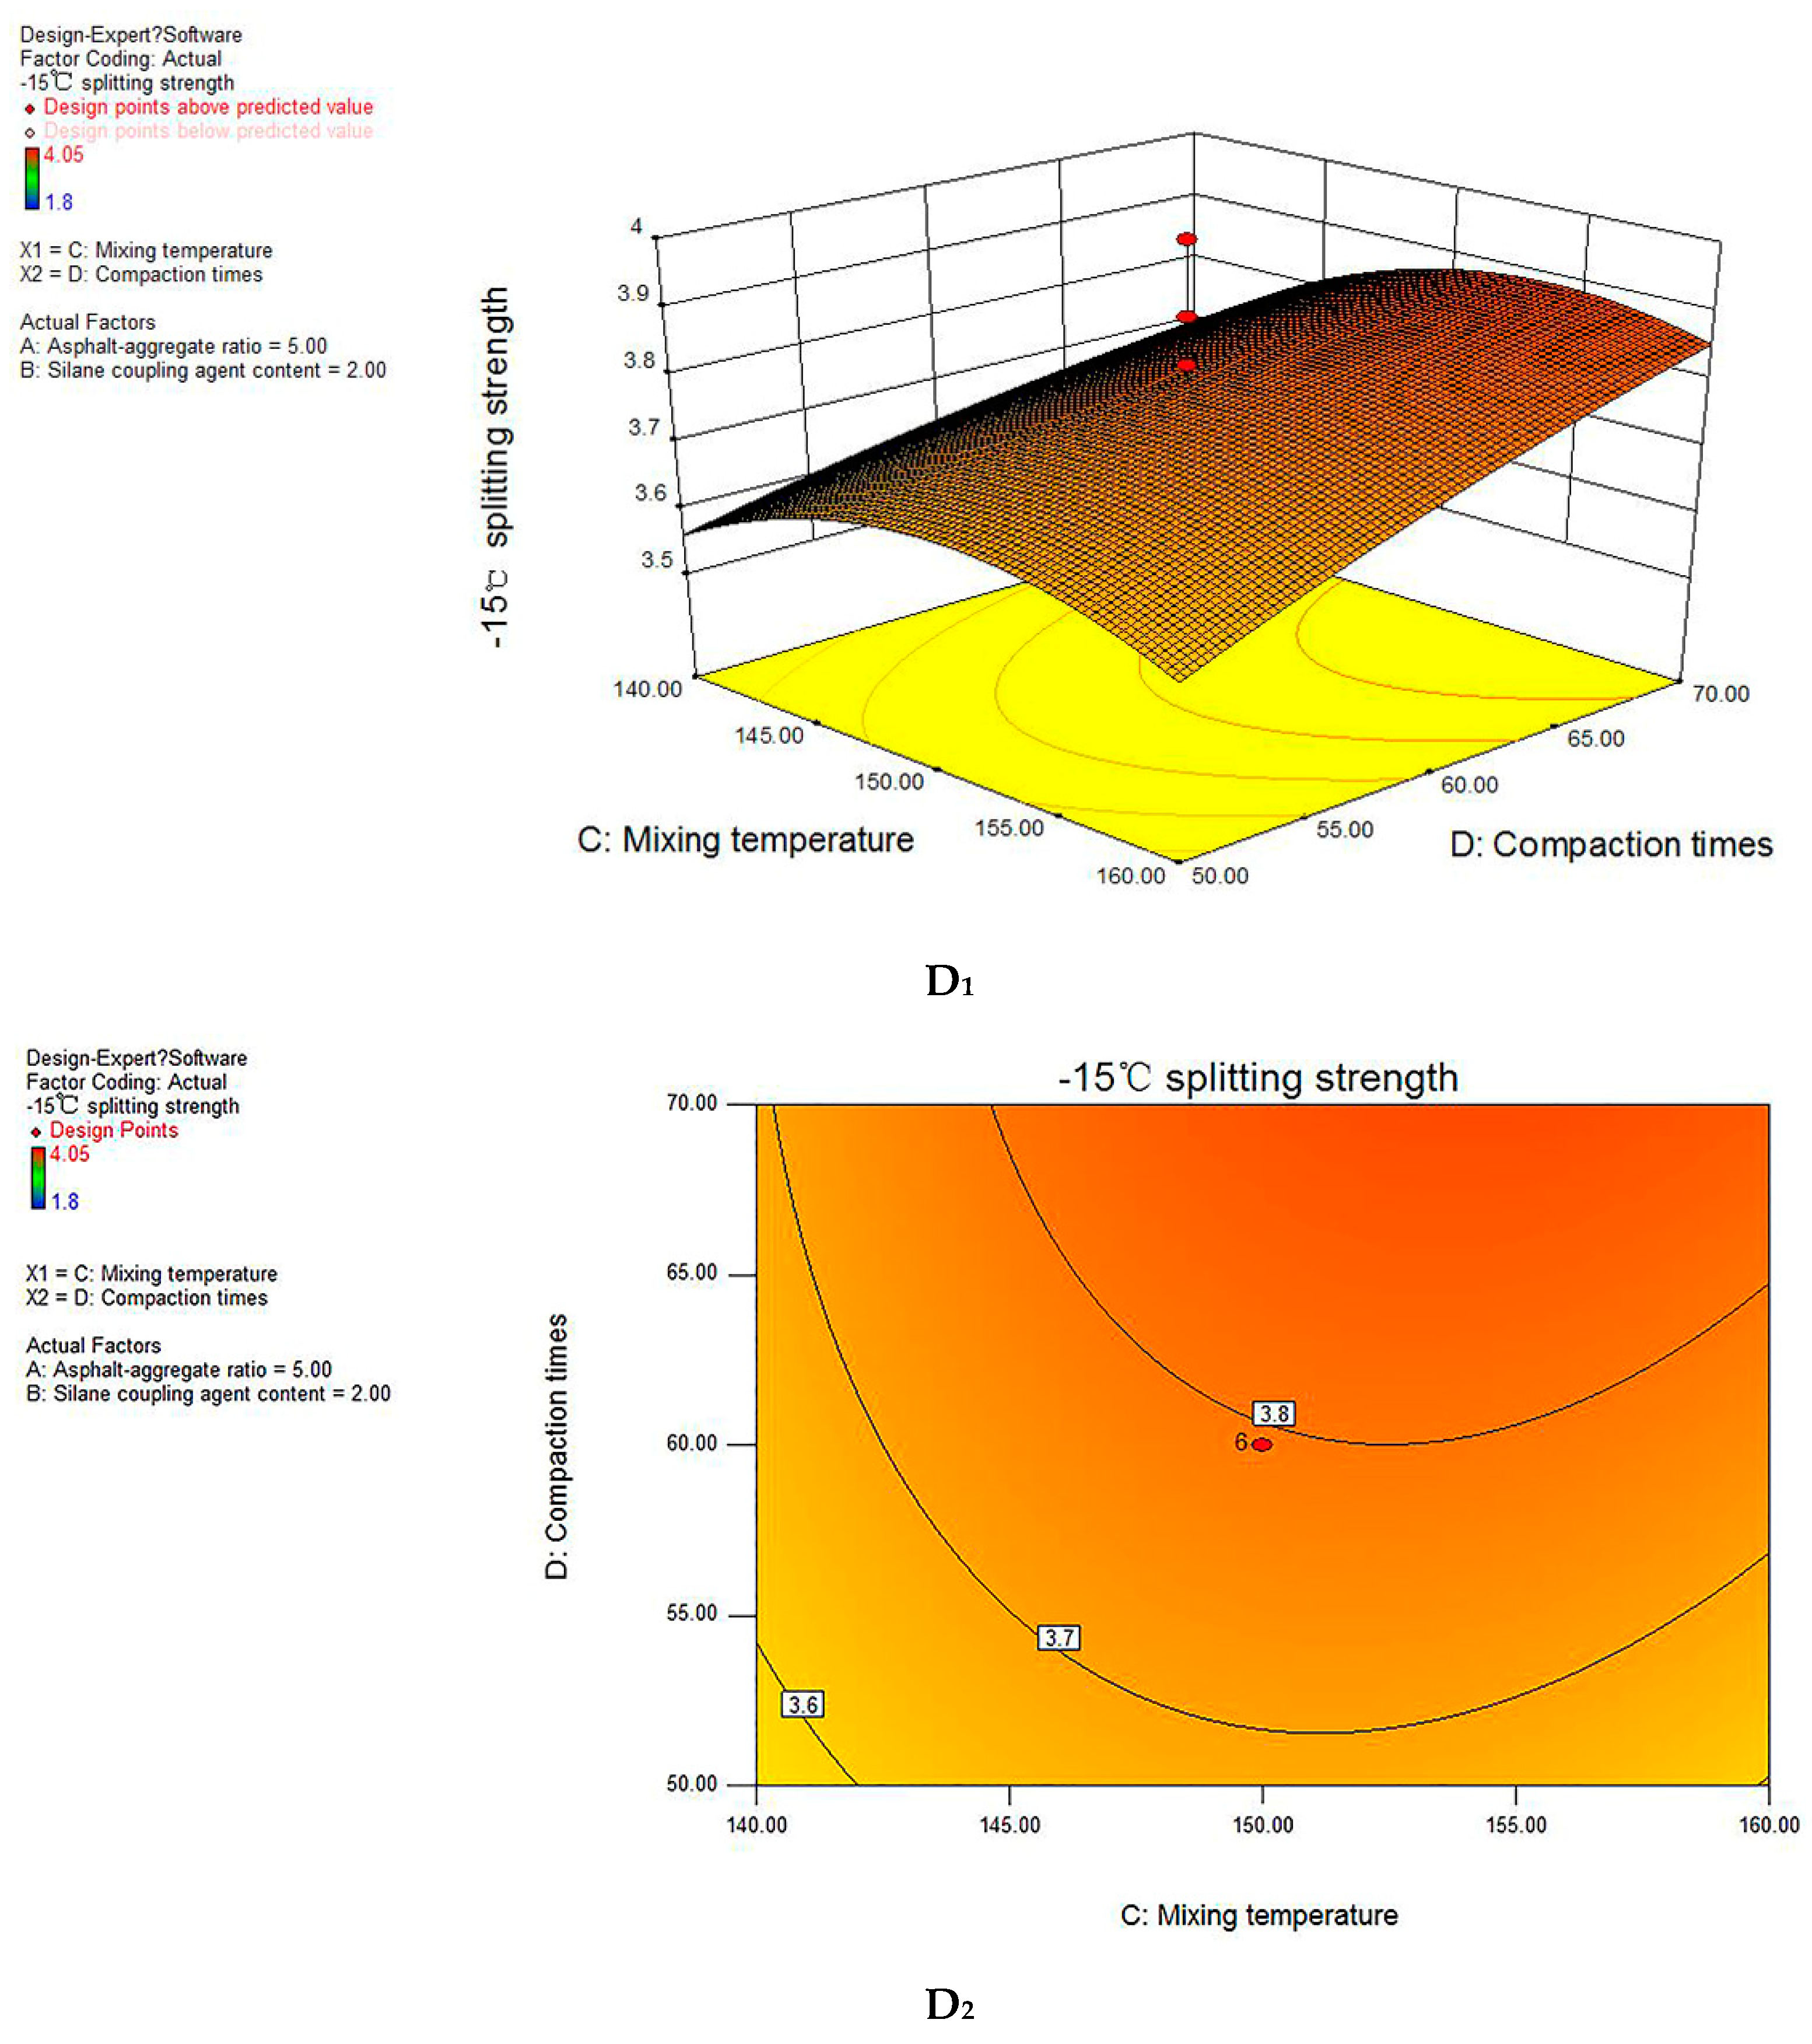
3.4. Response Surface Interaction Analysis
Response surface and Contour plot of regression model is shown in
Figure 6A
1–D
2.
As shown in the comparison between the four group diagrams, the influence of asphalt-aggregate ratio on −15 °C splitting strength is the most significant, which is characterized by the steepness of the surface in
Figure 6A
1,B
1.
Figure 6B
1 shows a three-dimensional plot of −15 °C splitting strength against asphalt-aggregate ratio and mixing temperature when silane coupling agent content is 2% and the compaction times is 60. As can be seen from
Figure 6B
1, with the increase of the asphalt-aggregate, −15 °C splitting strength continues to grow until it reaches a stable value. At the mixing temperature of 140 °C, −15 °C splitting strength rises from 2.52 Mpa to 3.64 Mpa with the increase of asphalt-aggregate ratio from 4.3 to 5%. In addition, with the increasing of asphalt-aggregate ratio within the reasonable range, −15 °C splitting strength is maintained at about 3.64 Mpa. This is because the OSW has higher specific surface area compared with stone, thus it can absorb more free asphalt. With the increase of asphalt-aggregate ratio, the structural asphalt adsorbed on the aggregate surface gradually increased. Therefore, the mechanical properties of SM-OGFC to resist low temperature load are improved.
The shape of contour can reflect the strength of interaction. Oval indicates that the interaction of two factors is significant while circle is the opposite. It can be seen the contour line is oval from
Figure 6A
2,B
2 and D
2), so the interaction of asphalt-aggregate ratio and silane coupling agent content, asphalt-aggregate ratio and mixing temperature, compaction times and mixing temperature are significant. In comparison, the interaction between silane coupling agent content and mixing temperature is slightly weaker.
3.5. Numerical Optimization
Through the discussion of the RSM model, it is found that the process parameters, including asphalt-aggregate ratio, silane coupling agent content, compaction times, and mixing temperature have to confirm in their ranges so that the response factor would be able to reach to its maximum value. The optimal solution to maximin the response factor is shown in
Table 9.
4. Results and Discussion
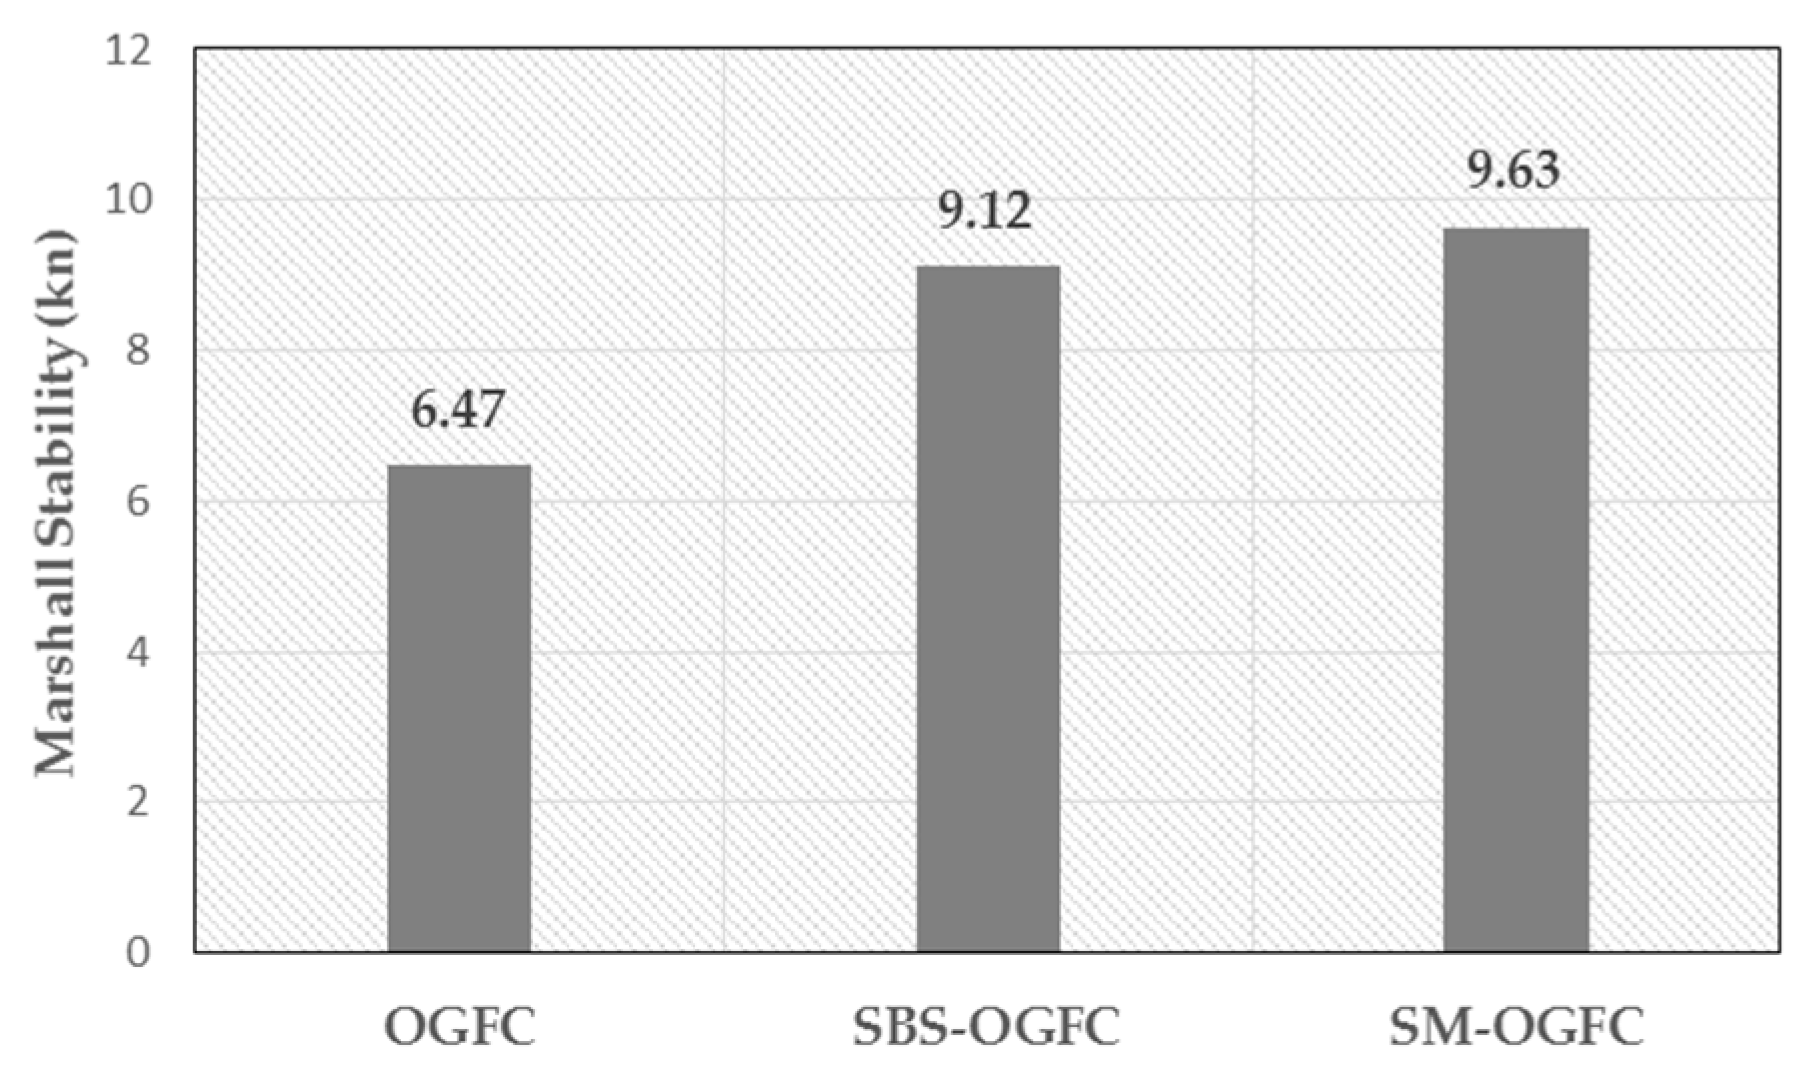
4.1. Marshall Test and Rutting Test Results
The Marshall stability of all OGFC mixtures is shown in
Figure 7. As shown in
Figure 7, the OSW as partial aggregate replacement in OGFC could be effective in enhancing the MS of OGFC mixtures. The higher MS value indicates that the OGFC mixture is stiffer and has better resistance against permanent deformation. The MS value of OGFC, SBS-OGFC, and SM-OGFC were found to be 6.47, 9.12, and 9.63, respectively. It should be noted that the MS value of SM-OGFC was 48.8% higher than OGFC, even 5.6% higher than SBS-OGFC. It is shown that OSW helps to increase the adhesion ability among aggregates of OGFC. The main reason for the increase in adhesion among aggregates in SM-OGFC is that OSW with porous structure has a strong tendency to absorb asphalt binder, which can make the content of the structural asphalt binder increase, and the content of free asphalt binder is decreased as a result. This structural change improves the overall ability of the OGFC to bear loads. Moreover, The RSM predicated the MS value of the optimal SM-OGFC to 9.78, the measured MS value of SM-OGFC was 9.63, and the difference between the two was 1.5%, indicating that the RSM has high prediction accuracy.
Figure 8 shows the dynamic stability of all OGFC mixtures. As seen, the DS value of SM-OGFC was 48.9% higher than OGFC, reached 94.7% of SBS-OGFC. This observation indicated that SM-OGFC had better resistance to permanent deformation at high temperature.
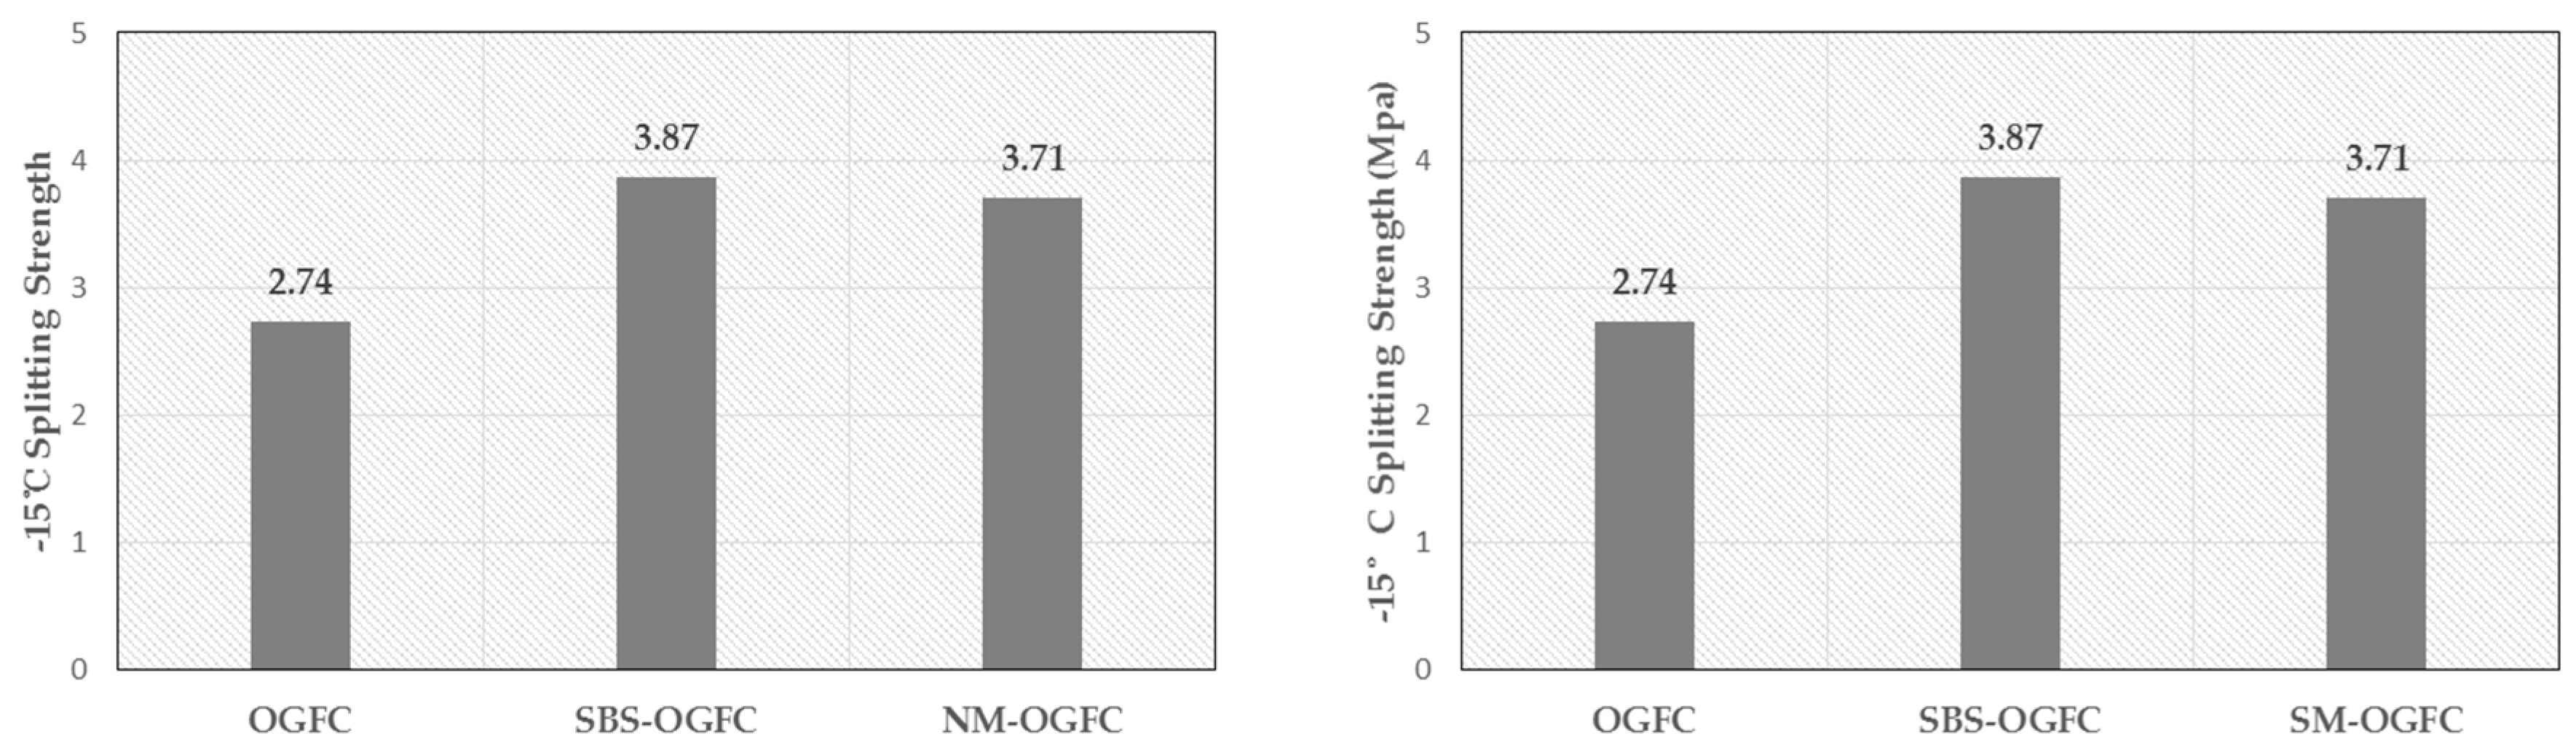
4.2. Low-Temperature Splitting Test and Low-Temperature Beam Bending Test Results
The low-temperature splitting test results are shown in
Figure 9. The S
T value of OGFC, SBS-OGFC and SM-OGFC were found to be 2.74, 3.87 and 3.71. Furthermore, the S
T value of SM-OGFC was 35.4% higher than OGFC, and almost equaled to SBS-OGFC. The higher S
T value indicates that the mixture has better resistance against pressure, horizontal and shear stress induced from the loading in the low-temperature environment. It can be seen that SM-OGFC showed better low-temperature mechanical performance in comparison with OGFC. Moreover, The RSM predicated the S
T value of the optimal SM-OGFC to 3.75, the measured S
T value of SM-OGFC is 3.71, and the difference between the two is 0.8%, indicating that the RSM has high prediction in predicting the mechanical properties of SM-OGFC at low temperature.
Table 10 shows the −10 °C beam bending test results of three OGFC samples. As seen, the R
B value of SBS-OGFC and SM-OGFC was notably higher than OGFC. However, there are different reasons for the improvement. The main reason for the increase of R
B value of SBS-OGFC relative to OGFC is, due to the effective modification effect of SBS. The SBS modifier enhances the adhesion and cohesion of asphalt binder, which consequently contribute to the capacity of mixture to bear dynamic loads at low temperature. The main reason for the increase of R
B value of SM-OGFC is that the OSW with porous structure absorbs the light weight component with less molecular weight of the asphalt, enhances the bond between the asphalt mortar and the aggregate, and improves the mechanical structure of OGFC. In winter, the greater the stiffness modulus of the material, the weaker the stress relaxation performance, the more brittle the material will be, and the more likely the material to produce shrinkage cracks. Therefore, in order to make the OGFC have good low-temperature crack resistance, a smaller bending stiffness modulus is expected. SM-OGFC has the smallest S
B of the three mixes. The most probable reason for this phenomenon is that the low-temperature bending failure process of the specimen is caused by the tensile failure caused by the internal stress, so the adhesion between the OGFC skeletons mainly play a key role to prevent the damage, while, the added OSW adsorbed asphalt binder to form the OSW-asphalt cement with greater stiffness, and the firm structural asphalt coating on the coarse aggregate enhances the adhesion between the skeletons.
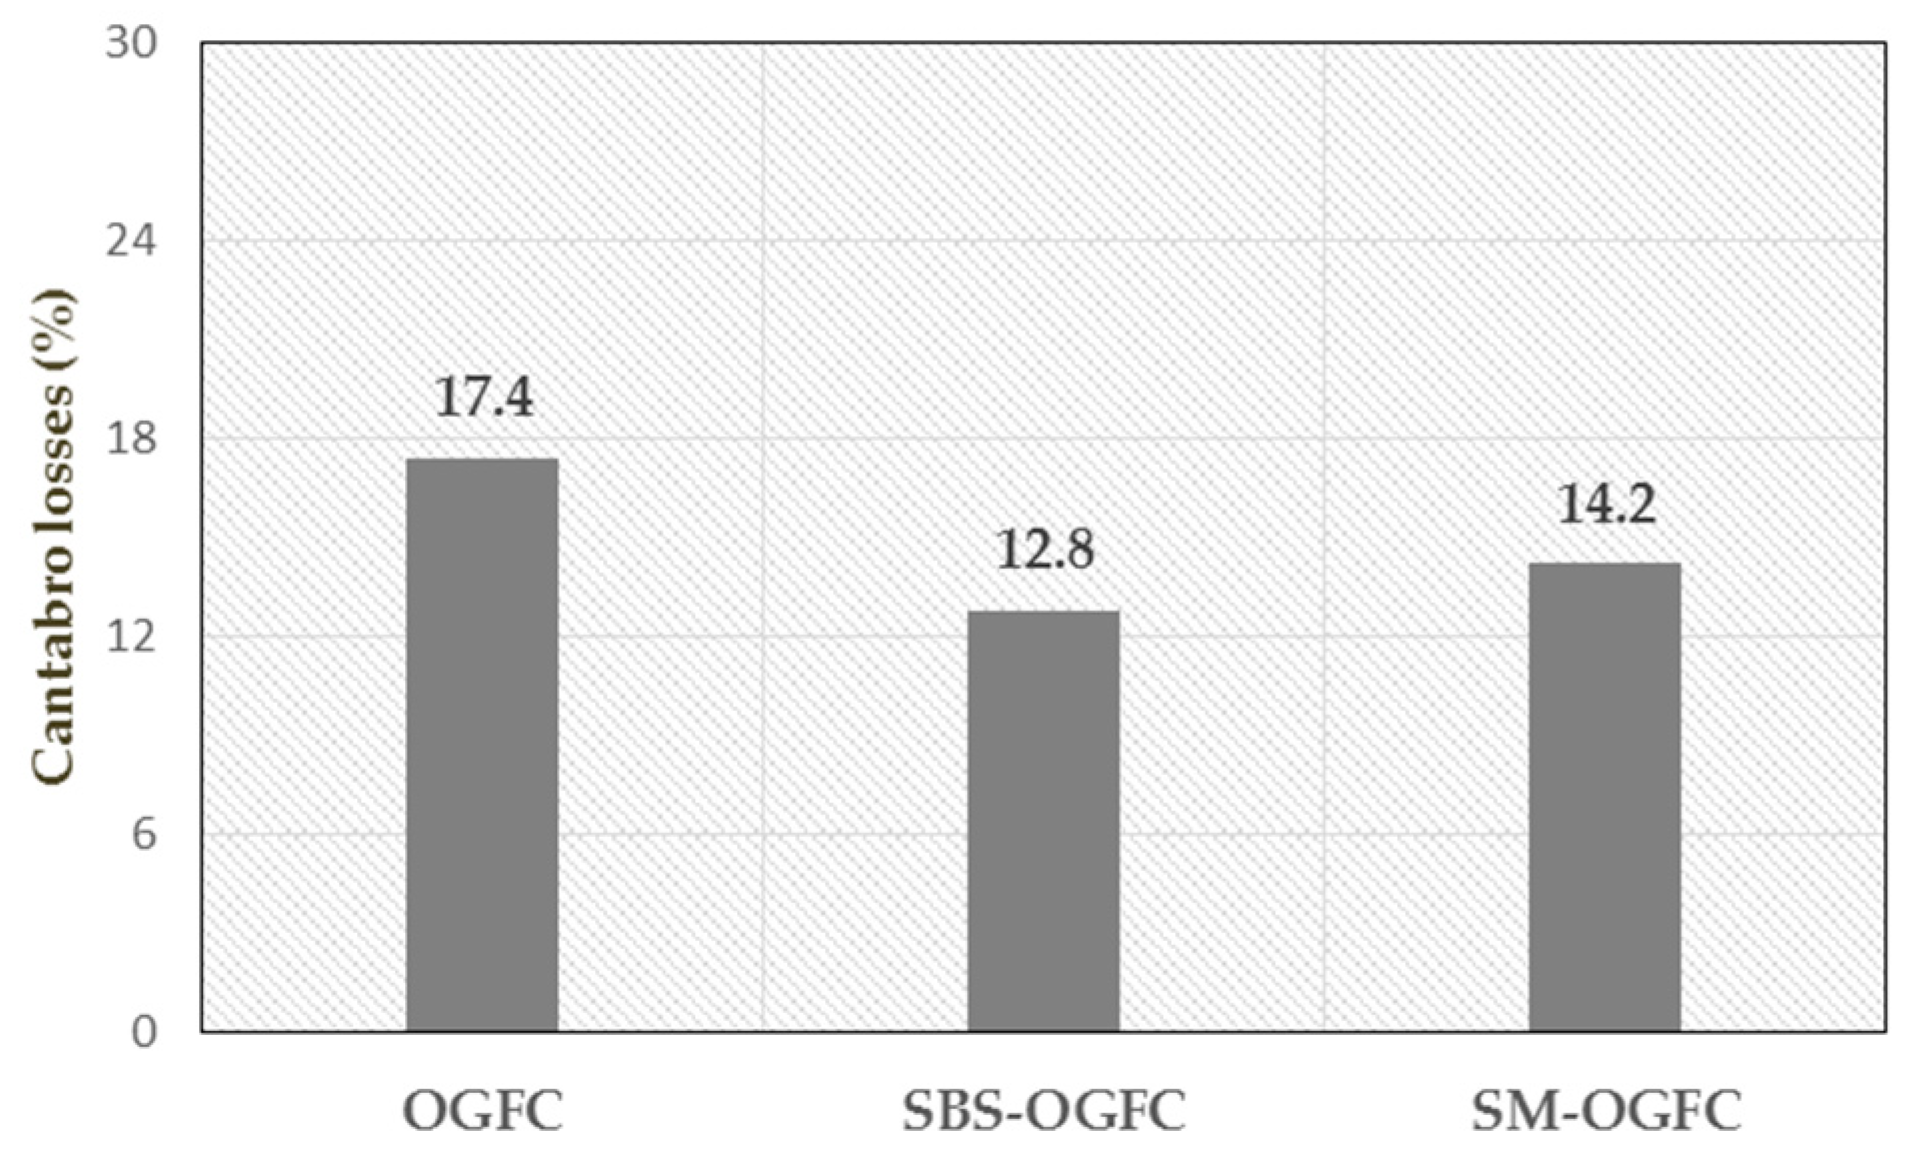
4.3. Cantabro Test Results
Figure 10 shows the Cantabro losses of different mixtures after Cantabro test. The Cantabro test was conducted on three replicates of each mixture, so the standard deviation values were shown as the error bar from the averages in the figure. The greater Cantabro losses indicates that the worse raveling resistance. The SBS-OGFC shows the greatest raveling resistance among all OGFC mixtures, which means that the SBS modified asphalt provides a better adhesion and improved raveling resistance of OGFC. SM-OGFC has better raveling resistance than OGFC in this paper. The conclusion drawn here can be confirmed by the result of splitting test and beam bending test.
4.4. Immersion Marshall Test and Spring-Thawing Stability Test Results
Figure 11 and
Figure 12 present the spring-thawing stability (SS), immersion Marshall stability (MS
1) and immersion residual stability (MS
0) for three mixtures. The MS
1 value is obtained by performing Marshall test after the specimen has been immersed in water at 60 °C for 48 h, and the MS
0 value is obtained by the Equation (4):
As shown in
Figure 11, the SS value of SM-OGFC was the largest of the three mixtures, and the SS value of SM-OGFC was 42% higher than OGFC, even 1.6% higher than SBS-OGFC. The results indicated that SM-OGFC had excellent performance in resisting moisture damage during spring-thawing season. One reason for the increase of the SS value of SM-OGFC is that silane coupling agent with two different types of functional groups has a strong tendency to bond asphalt and aggregate, which can make the content of moisture that penetrates into the interface between asphalt and aggregate decrease as a result. This improves the performance of SM-OGFC against moisture damage during spring-thawing season. As shown in
Figure 12, the MS
1 value of SM-OGFC was 41.4% higher than OGFC, reached 98.7% of SBS-OGFC. The results showed that SM-OGFC had a high Marshall stability after immersion at 60°C for 48h. However, the MS
0 value of SM-OGFC was the smallest of the three mixtures, which indicated that Marshall stability attenuation of SM-OGFC was the largest among three mixtures after immersion at 60 °C for 48 h. The main reason for this is the high water absorption of OSW. Nevertheless, the higer MS
1 value proved that SM-OGFC had a higher bearing capacity relative to OGFC after immersion at 60 °C for 48 h.
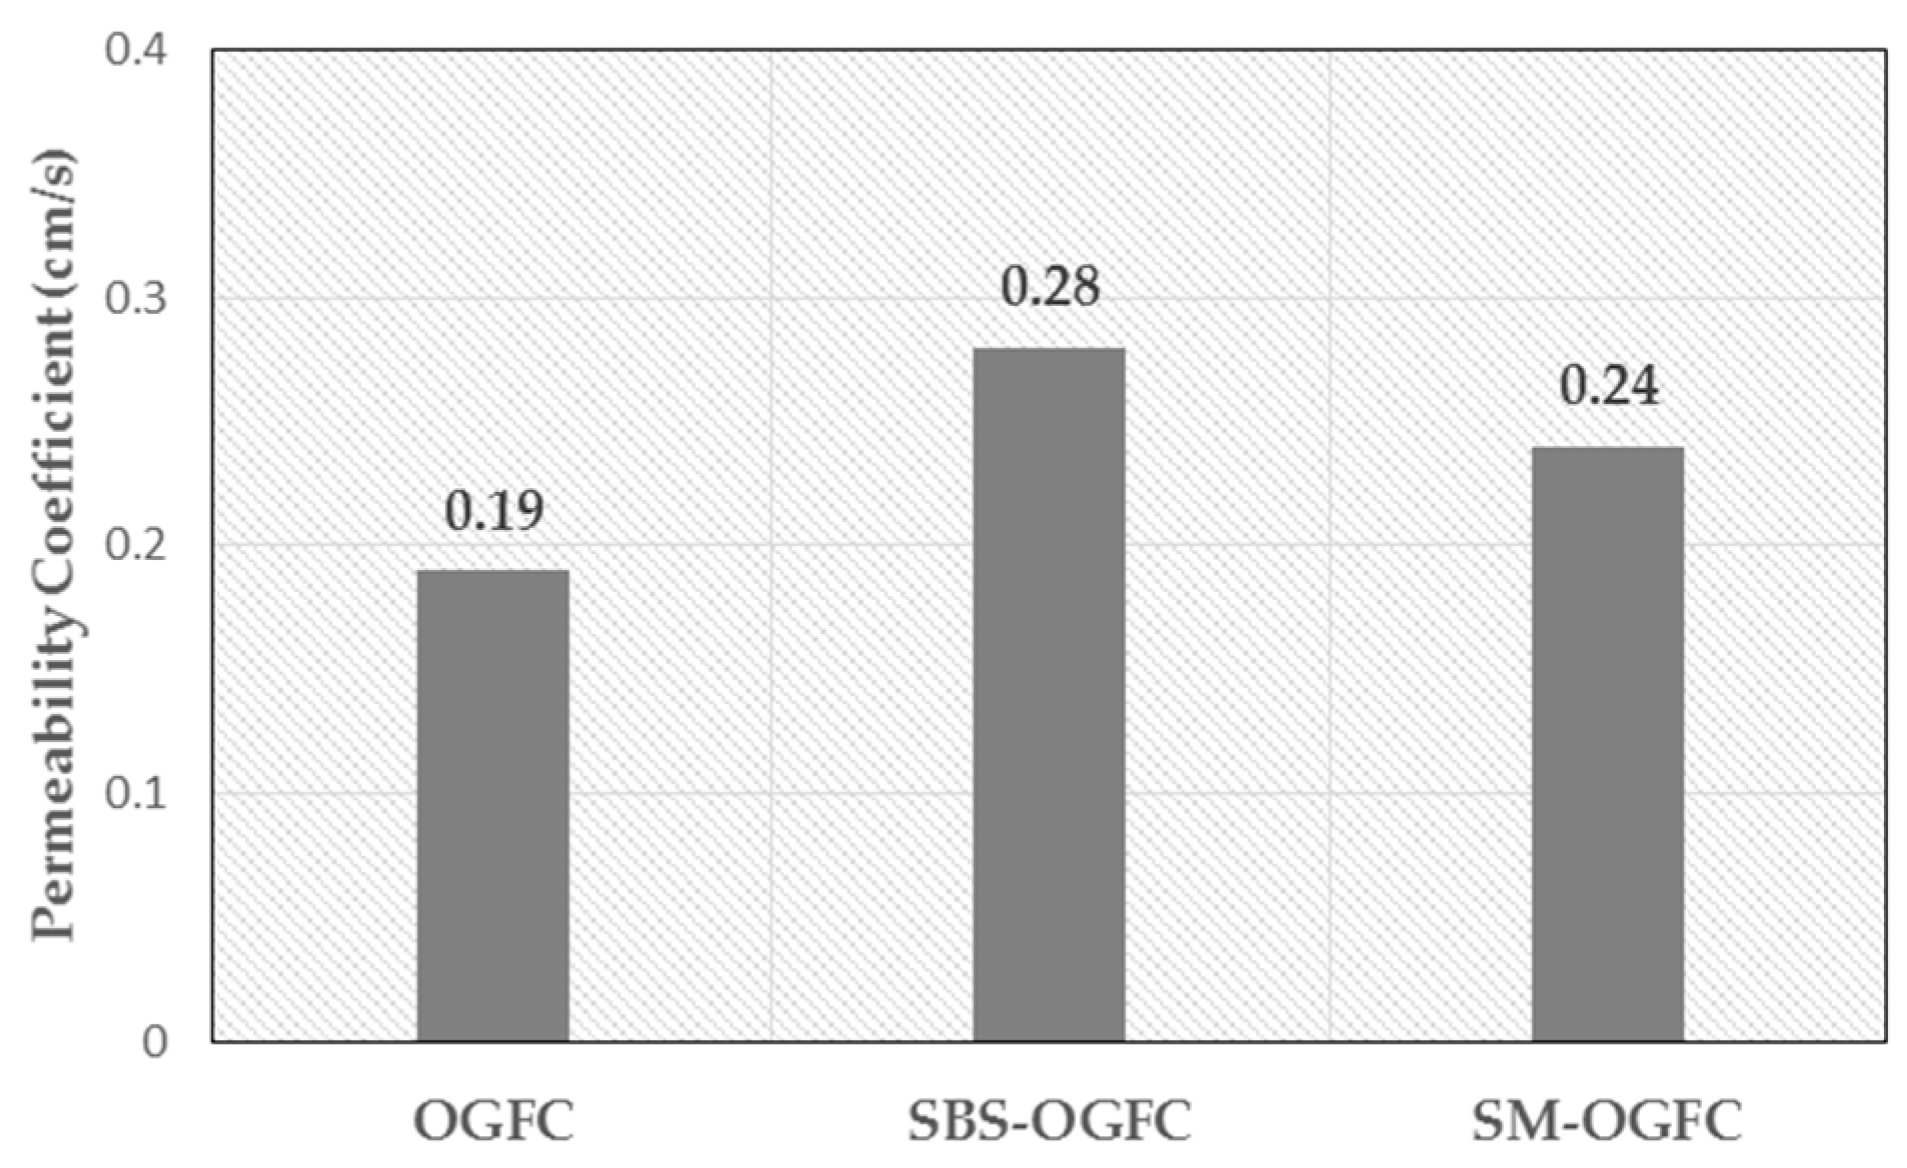
4.5. Permeability Test Results
Figure 13 shows the permeability coefficient of three mixtures at temperature of 20 °C. The
K20°C value of OGFC, SBS-OGFC and SM-OGFC were found to 0.19, 0.28 and 0.24. According to the technical requirements of the open grade asphalt mixture in the Specifications for design of Highway Asphalt Pavement in China (JTG D50-2006), It is recommended that the permeability coefficient (
K20°C) should be greater than 0.01 cm/s, and the
K20°C value of three mixtures meets the specifications. It is well known that asphalt-aggregate ratio plays a key role in permeability performance of OGFC. The lower the asphalt-aggregate ratio, the better the permeability performance of OGFC. Thus, SBS-OGFC shows better permeability performance than OGFC. What is interesting is that SM-OGFC has a higher asphalt-aggregate ratio than OGFC, but has better permeability performance. The main reason for this phenomenon is that SM-OGFC has relatively less free asphalt, which leads to a lower probability of free asphalt blocking the interconnected pores, thus showing better permeability performance.
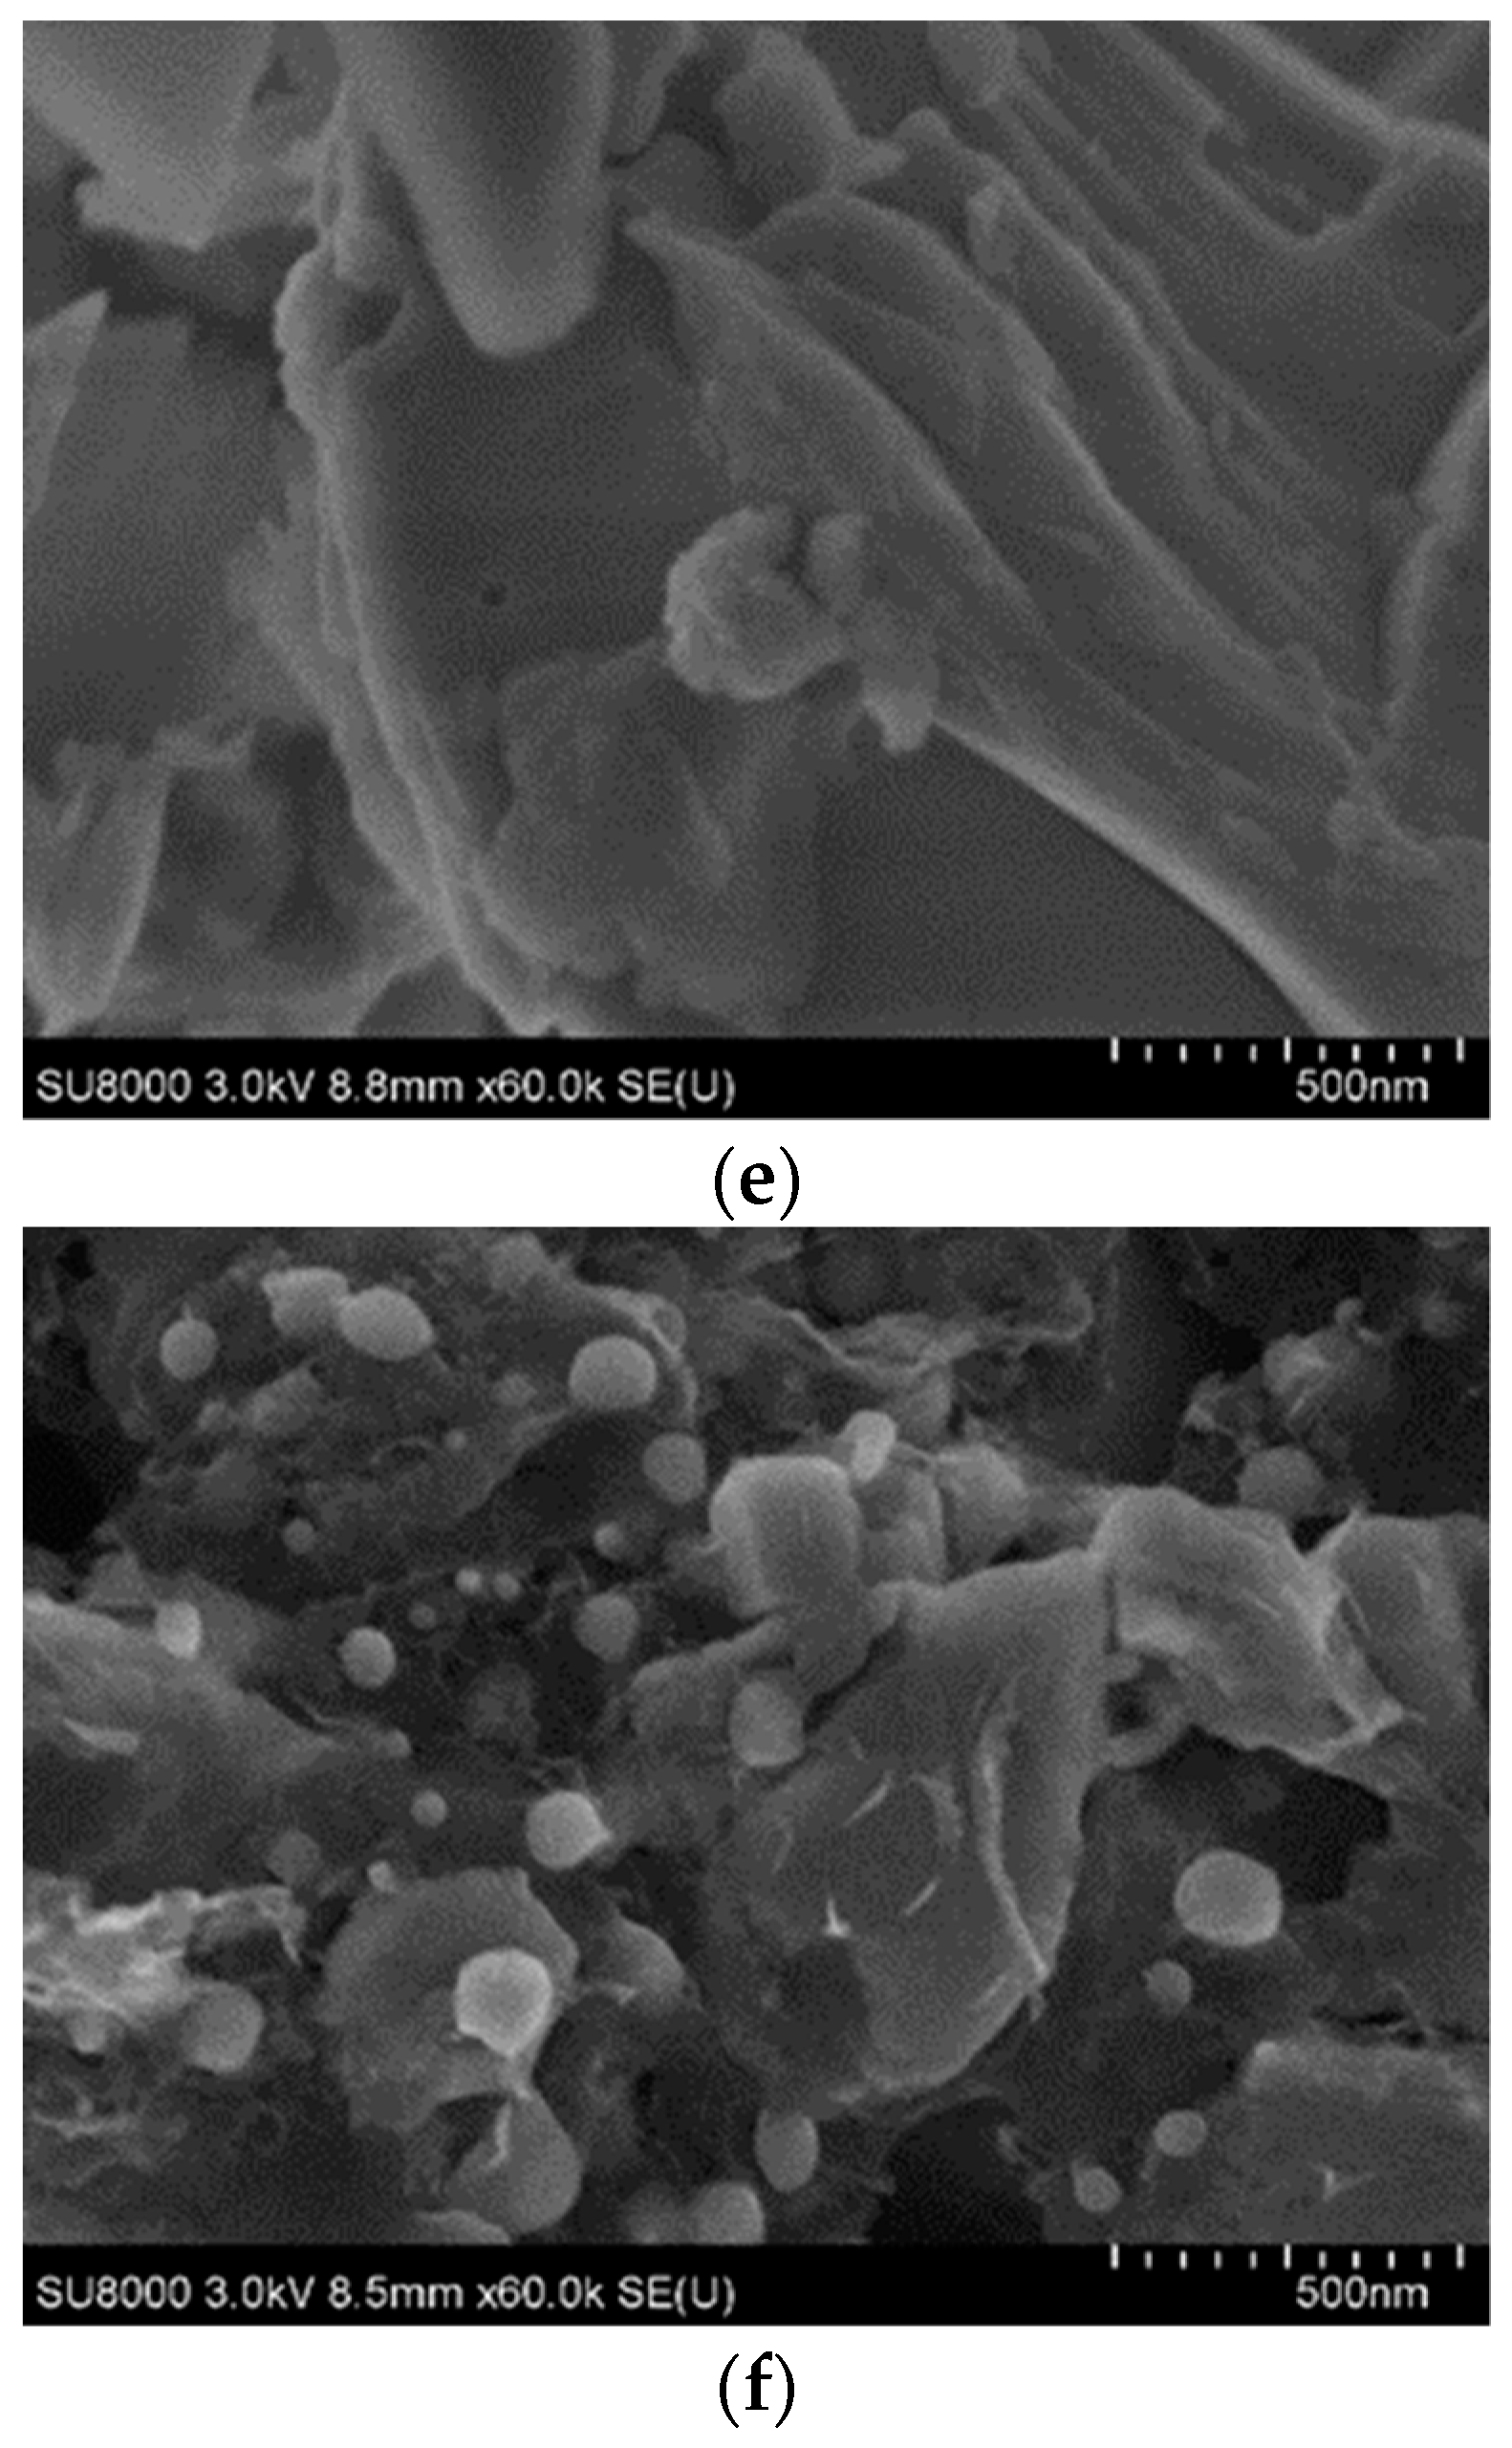
4.6. Scanning Electronic Microscopy Test Results
Scanning electron micrographs of granite and OSW with a grain size of 0.6 mm were observed at magnifying power of ×1000, ×10,000 and ×60,000, as are shown in
Figure 14a–f.
It can be seen from
Figure 14 that the surface of OSW is rougher than the granite particles, the micropores of OSW are relatively developed, and the void content of OSW is higher. On the low-magnification scanned image, it was found that the OSW has a large number of micron-sized pores, and the edge of the pores is surrounded by mossy and petal-like protrusions. The micropores with sizes ranging from several microns to about 30 µm can be seen in the
Figure 14b,d. The special structure can provide high specific surface area and adsorption capacity for OSW. On the high-magnification scanned image, the multi-layered cave-like pores are embedded in the micropore, the cavity is embedded with a plurality of cave-like pores, which are connected to each other in the deep micropore, showing an irregular laminar columnar connected structure. On the locally enlarged nano-scale image, many small cell-like structure tentacles appear inside the micropore, this structure has internal surface area provided by the interlayer structure compared with the granite. Due to the unique laminar columnar connected structure and cell-like structure antennae of OSW, it can achieve better bite with asphalt. Compared with granite-asphalt mortar, OSW-asphalt mortar has better structural stability and mechanical properties.
5. Economic Analysis
In this section, the economic analysis of SM-OGFC and SBS-OGFC mixture in improving properties is conducted compared normal OGFC mixture. The price ratio PR and performance improvement ration PIR can be calculated by the following equation. The results are listed in
Table 10
where
Pm and
PIm are the price and properties of SBS-OGFC and SM-OGFC,
POGFC and
PIOGFC are the price and properties of the normal OGFC mixture [
27].
It should be noted that when referring to the marked price in China, the prices of unmodified asphalt binder, SBS and silane coupling agent are 4 CNY/kg, 15 CNY/kg and 6 CNY/kg, respectively. The average price of OGFC-16 unmodified asphalt mixture is 0.380 CNY/kg. It can be calculated that the price of graded broken stone of OGFC-16 is 0.197 (value as 0.20) CNY/kg.
As shown in
Table 11, when the 2.5% silane coupling agent is added to the base asphalt and the oil shale waste is used to replace the fine aggregate of the mixtures (SM-OGFC mixture), the pavement performance, including high and low temperature stability, water stability, raveling resistance performance and permeability performance, has an improvement compared to OGFC mixture, while its price is also relatively lower. It is also can be seen that SBS-OGFC mixture has better properties than OGFC mixture, while its price is not rising obviously. Moreover, analyzing the data in
Table 11, SM-OGFC has almost the same pavement performance as SBS-OGFC, but has a cheaper price.
6. Conclusions
From test results the following conclusions were drawn:
A new modified OGFC (SM-OGFC) was prepared by replacing the fine aggregate below 4.75 mm in OGFC with the oil shale waste, and the silane coupling agent modifier was used to assist modification. The preparation process of SM-OGFC was optimized by CCD to obtain a SM-OGFC with the best mechanical properties. High-temperature mechanical test, low-temperature mechanical test, water stability test, raveling test and permeability test are adopted to evaluate the comprehensive ability of SM-OGFC. The results prove that SM-OGFC has better high temperature mechanical performance, lower temperature mechanical performance, water stability, raveling resistance and permeability performance than OGFC mixture—and even superior to SBS modified OGFC mixture in some aspects. Therefore, it is likely that the development of SM-OGFC could be helpful to make conventional OGFC qualified for complex service ambient, as well as improve the recycling rate of industrial waste to reduce environmental pollution and reduce the cost of asphalt pavement.
SEM analysis are adopted to explore the modification mechanism of oil shale waste. These results indicate that the unique laminar columnar connected structure, and cell-like structure antennae of oil shale waste, could be the main reasons why SM-OGFC obtained excellent comprehensive performance.
Author Contributions
Conceptualization, X.G.; Data curation, W.G., X.C. and W.D.; Formal analysis, W.G.; Funding acquisition, X.G.; Investigation, X.G. and W.D.; Project administration, W.D.; Software, W.G. and X.C.; Supervision, X.G.; Writing—original draft, W.G. and X.C.; Writing—review & editing, X.G. and W.D.
Funding
This research was funded by the National Nature Science Foundation of China (NSFC) (Grant No. 51178204).
Acknowledgments
This research was funded by the National Nature Science Foundation of China (NSFC) (Grant No. 51178204). This financial support is gratefully acknowledged.
Conflicts of Interest
The authors declare that there is no conflict of interests regarding the publication of this paper.
References
- Chen, J.; Yin, X.J.; Wang, H.; Ding, Y.M. Evaluation of durability and functional performance of porous polyurethane mixture in porous pavement. J. Clean. Prod. 2018, 188, 12–19. [Google Scholar] [CrossRef]
- Punith, V.S.; Suresha, S.N.; Raju, S.; Bose, S.; Veeraragavan, A. Laboratory investigation of open-graded friction-course mixtures containing polymers and cellulose fibers. J. Trans. Eng. 2012, 138, 67–74. [Google Scholar] [CrossRef]
- Alvarez, A.E.; Martin, A.E.; Estakhri, C. A review of mix design and evaluation research for permeable friction course mixtures. Constr. Build. Mater. 2011, 25, 1159–1166. [Google Scholar] [CrossRef]
- Pattanaik, M.L.; Choudhary, R.; Kumar, B. Evaluation of frictional pavement resistance as a function of aggregate physical properties. J. Trans. Eng. Part B Pavement 2017, 143, 1–8. [Google Scholar] [CrossRef]
- Song, W.; Shu, X.; Huang, B.; Woods, M. Laboratory investigation of interlayer shear fatigue performance between open-graded friction course and underlying layer. Constr. Build. Mater. 2016, 115, 381–389. [Google Scholar] [CrossRef]
- Hassan, H.F.; Al-Oraimi, S.; Taha, R. Evaluation of open-graded friction course mixtures containing cellulose fibers and styrene butadiene rubber polymer. J. Mater. Civ. Eng. 2015, 17, 416–422. [Google Scholar] [CrossRef]
- Onyango, M.; Woods, M. Analysis of the Utilization of Open-Graded Friction Course (OGFC) in the United States. In Proceedings of the International Conference on Highway Pavements and Airfield Technology, Philadelphia, PA, USA, 27–30 August 2017; AlQadi, I.L., Ozer, H., VelezVega, E.M., Murrell, S., Eds.; American Society Civil Engineers: New York, NY, USA, 2017. [Google Scholar]
- Ouyang, X.Y. Research on moisture damage research in Hunan province expressway pavement. In Proceedings of the International Conference on Automation, Communication, Architectonics and Materials, Wuhan, China, 18–19 June 2011; Zhang, H., Shen, G., Jin, D., Eds.; Trans Tech Publications Inc.: Durnten-Zurich, Switzerland, 2011. [Google Scholar]
- Lyons, K.R.; Putman, B.J. Laboratory evaluation of stabilizing methods for porous asphalt mixtures. Constr. Build. Mater. 2013, 49, 772–780. [Google Scholar] [CrossRef]
- Luo, S.; Qian, Z.D.; Xue, Y.C. Performance evaluation of open-graded epoxy asphalt concrete with two nominal maximum aggregate sizes. J. Cent. South Univ. (Engl. Ed.) 2015, 22, 4483–4489. [Google Scholar] [CrossRef]
- Yang, B.; Xiong, B.; Ji, Y.; Ban, G. Experimental study of the fatigue performance of open-graded asphalt mixture friction course. Mater. Res. Innov. 2015, 19, 464–468. [Google Scholar] [CrossRef]
- Shen, W.G.; Shan, L.; Zhang, T.; Ma, H.K.; Cai, Z.; Shi, H. Investigation on polymer-rubber aggregate modified porous concrete. Constr. Build. Mater. 2013, 38, 667–674. [Google Scholar] [CrossRef]
- Fang, F.T.; Chong, Y.C.; Nyunt, T.T.; Loi, S.S. Development of environmentally sustainable pavement mix. Int. J. Pavement Res. Technol. 2013, 6, 440–446. [Google Scholar]
- Li, C.H.; Xiang, X.D.; Zhou, X.Y.; Tu, X.Q. Utilization of Steel Slag as Aggregates for Porous Asphalt Mixture. In Proceedings of the Annual Meetings of Chinese-Society’s-Building-Materials, Professional Committees of Stone and Aggregate and Utilization of Solid Waste, Wuhan, China, 28 November–1 December 2013; Wu, S., Chen, M.H., Eds.; Trans Tech Publications Inc.: Durnten-Zurich, Switzerland, 2014. [Google Scholar]
- Wang, Y.H.; Wang, G.; Ahn, Y.H. Effects of Using Recycled Asphalt Shingles in Open-Graded Friction Course on Flexible Pavement Performance. J. Test. Eval. 2014, 42, 1173–1182. [Google Scholar] [CrossRef]
- Hainin, M.R.; Rusbintardjo, G.; Hameed, M.A.S.; Hassan, N.A.; Yusoff, N.I.M. Utilisation of steel slag as an aggregate replacement in porous asphalt mixtures. J. Teknol. 2014, 69, 67–73. [Google Scholar] [CrossRef]
- Cheng, Y.C.; Wang, W.S.; Tan, G.J.; Shi, C.L. Assessing High- and Low-Temperature Properties of Asphalt Pavements Incorporating Waste Oil Shale as an Alternative Material in Jilin Province, China. Sustainability 2018, 10, 2179. [Google Scholar] [CrossRef]
- Peng, C.; Chen, P.X.; You, Z.P.; Lv, S.T.; Zhang, R.; Xu, F.; Zhang, H.; Chen, H.L. Effect of silane coupling agent on improving the adhesive properties between asphalt binder and aggregates. Constr. Build. Mater. 2018, 169, 591–600. [Google Scholar] [CrossRef]
- Min, Y.; Fang, Y.; Huang, X.; Zhu, Y.; Li, W.; Yuan, J.; Tan, L.; Wang, S.; Wu, Z. Surface modification of basalt with silane coupling agent on asphalt mixture moisture damage. Appl. Surf. Sci. 2015, 346, 497–502. [Google Scholar] [CrossRef]
- Chen, J.; Sun, P.T.; Li, F.J. Study on permeability coefficient of asphalt mixture. J. Highw. Transp. Res. Dev. 2006, 23, 5–8. [Google Scholar] [CrossRef]
- Woelfl, G.A.; Wei, I.W.; Faulstich, C.N.; Litwack, H.S. Laboratory testing of asphalt concrete for porous pavements. J. Test. Eval. 1981, 9, 175–181. [Google Scholar] [CrossRef]
- Bezerra, M.A.; Santelli, R.E.; Oliveira, E.P.; Villar, L.S.; Escaleira, L.A. Response surface methodology (RSM) as a tool for optimization in analytical chemistry. Talanta 2008, 76, 965–977. [Google Scholar] [CrossRef] [PubMed]
- Zhao, W.Z.; Yu, Z.P.; Liu, J.B.; Yu, Y.D.; Yin, Y.G.; Lin, S.Y.; Chen, F. Optimized extraction of polysaccharides from corn silk by pulsed electric field and response surface quadratic design. J. Sci. Food Agric. 2011, 91, 2201–2209. [Google Scholar] [CrossRef] [PubMed]
- Borzoei, M.; Zanjanchi, M.A.; Sadeghi-Aliabadi, H.; Saghaie, L. Optimization of a methodology for determination of iron concentration in aqueous samples using a newly synthesized chelating agent in dispersive liquid-liquid microextraction. Food Chem. 2018, 264, 9–15. [Google Scholar] [CrossRef] [PubMed]
- Nassar, A.I.; Thom, N.; Parry, T. Optimizing the mix design of cold bitumen emulsion mixtures using response surface methodology. Constr. Build. Mater. 2016, 104, 216–229. [Google Scholar] [CrossRef]
- Wang, W.S.; Cheng, Y.C.; Tan, G.J. Design Optimization of SBS-Modified Asphalt Mixture Reinforced with Eco-Friendly Basalt Fiber Based on Response Surface Methodology. Materials 2018, 11. [Google Scholar] [CrossRef] [PubMed]
- Cai, L.C.; Shi, X.G.; Xue, J. Laboratory evaluation of composed modified asphalt binder and mixture containing nano-silica/rock asphalt/SBS. Constr. Build. Mater. 2018, 172, 204–211. [Google Scholar] [CrossRef]
Figure 1.
Oil shale waste (OSW) in a power plant in Jilin province China.
Figure 1.
Oil shale waste (OSW) in a power plant in Jilin province China.
Figure 2.
The flowchart of preparation of the SM-OGFC.
Figure 2.
The flowchart of preparation of the SM-OGFC.
Figure 3.
Normal probability plot of residuals of −15 °C splitting strength.
Figure 3.
Normal probability plot of residuals of −15 °C splitting strength.
Figure 4.
Residual versus predicted values of −15 °C splitting strength.
Figure 4.
Residual versus predicted values of −15 °C splitting strength.
Figure 5.
Predicted against actual responses of −15 °C splitting strength.
Figure 5.
Predicted against actual responses of −15 °C splitting strength.
Figure 6.
(A1) 3D surface graph of −15 °C splitting strength against A and B; (A2) contour plot of −15 °C splitting strength against A and B; (B1) 3D surface graph of −15 °C splitting strength against A and C; (B2) contour plot of −15 °C splitting strength against A and C; (C1) 3D surface graph of −15 °C splitting strength against B and C; (C2) contour plot of −15 °C splitting strength against B and C; (D1) 3D surface graph of −15 °C splitting strength against C and D; (D2) contour plot of −15 °C splitting strength against C and D.
Figure 7.
Marshall stability for all Open graded friction course (OGFC) mixtures.
Figure 7.
Marshall stability for all Open graded friction course (OGFC) mixtures.
Figure 8.
Dynamic stability for all OGFC mixtures.
Figure 8.
Dynamic stability for all OGFC mixtures.
Figure 9.
−15 °C Splitting strength for all OGFC mixtures.
Figure 9.
−15 °C Splitting strength for all OGFC mixtures.
Figure 10.
Cantabro losses of all OGFC mixtures.
Figure 10.
Cantabro losses of all OGFC mixtures.
Figure 11.
Spring-thawing stability for all OGFC mixtures.
Figure 11.
Spring-thawing stability for all OGFC mixtures.
Figure 12.
Immersion Marshall stability and Immersion residual stability for all OGFC stability.
Figure 12.
Immersion Marshall stability and Immersion residual stability for all OGFC stability.
Figure 13.
Permeability coefficient for all OGFC mixtures.
Figure 13.
Permeability coefficient for all OGFC mixtures.
Figure 14.
(a) Scanning electron microscope image of granite particles (×1000); (b) Scanning electron microscope image of OSW particles (×1000); (c) Scanning electron microscope (SEM) image of granite particles (×10,000); (d) Scanning electron microscope image of OSW particles (×10,000); (e) Scanning electron microscope image of granite particles (×60,000); (f) Scanning electron microscope image of OSW particles (×60,000).
Table 1.
Technical parameters of ‘Pan Jin’ asphalt.
Table 1.
Technical parameters of ‘Pan Jin’ asphalt.
| Technical Parameters | Penetration | 25 °C Ductility | Softening Point | Wax Content | Flash Point | Solubility | Density |
|---|
| 15 °C | 25 °C | 30 °C |
|---|
| Units | 0.1 mm | cm | °C | %≤ | °C | %≥ | g·cm−3 |
| Test results | 27.5 | 81.3 | 132.6 | >130 | 44.2 | 18 | 340 | 99.9 | 1.003 |
Table 2.
Physical parameters of OSW.
Table 2.
Physical parameters of OSW.
| Physical Property | Apparent Density (g/cm3) | Water Absorption (%) | Crushing Value (%) | Cohesion (Kpa) | Internal Friction Angle (°) | Optimum Water Rate (%) |
|---|
| OSW | 2.627 | 18.6 | 42.2 | 13.84 | 33.3 | 28.3 |
Table 3.
Properties of aggregate and gradation of OGFC-16.
Table 3.
Properties of aggregate and gradation of OGFC-16.
| Sieve (mm) | 16 | 13.2 | 9.5 | 4.75 | 2.36 | 1.18 | 0.6 | 0.3 | 0.15 | 0.075 |
| Apparent density | 2.78 | 2.78 | 2.78 | 2.74 | 2.74 | 2.75 | 2.70 | 2.70 | 2.69 | 2.67 |
| Bulk density | 2.77 | 2.76 | 2.75 | 2.68 | 2.64 | 2.59 | 2.60 | 2.59 | 2.57 | 2.55 |
| Gradation (%) | 97.5 | 65 | 47.5 | 23.5 | 11.5 | 11.5 | 9 | 7.5 | 6.0 | 4.5 |
Table 4.
The coded level of affected variable.
Table 4.
The coded level of affected variable.
| Name | Units | Lower Limit (−1) | Upper Limit (+1) |
|---|
| Asphalt-aggregate ratio | % | 4.3 | 5.7 |
| Silane coupling agent content | % | 1 | 3 |
| Mixing temperature | °C | 140 | 160 |
| Compaction times | n | 50 | 70 |
Table 5.
Central composite design.
Table 5.
Central composite design.
| Run | Asphalt-Aggregate Ratio (A) | Silane Coupling Agent Content (B) | Mixing Tem-Perature (C) | Compaction Times (D) | Marshall Stability (KN) | −15 °C Splitting Strength (Mpa) | Spring-Thawing Stability (KN) |
|---|
| 1 | 1 | −1 | 1 | −1 | 9.01 | 3.06 | 7.62 |
| 2 | −1 | 1 | −1 | 1 | 8.49 | 2.04 | 7.32 |
| 3 | 1 | 1 | 1 | −1 | 9.33 | 3.4 | 7.99 |
| 4 | 0 | 0 | 2 | 0 | 8.98 | 3.55 | 7.80 |
| 5 | 1 | −1 | −1 | 1 | 8.98 | 3.93 | 7.63 |
| 6 | −1 | −1 | 1 | −1 | 8.50 | 2.67 | 7.30 |
| 7 | 1 | 1 | −1 | −1 | 9.02 | 3.55 | 7.73 |
| 8 | 0 | −2 | 0 | 0 | 8.78 | 3.38 | 7.82 |
| 9 | 1 | 1 | −1 | 1 | 8.97 | 3.42 | 7.80 |
| 10 | 1 | 1 | 1 | 1 | 8.67 | 3.5 | 7.52 |
| 11 | 1 | −1 | −1 | −1 | 8.67 | 3.15 | 7.63 |
| 12 | 0 | 0 | 0 | 0 | 9.57 | 3.89 | 8.24 |
| 13 | 0 | 0 | 0 | 0 | 9.64 | 4.05 | 8.17 |
| 14 | −1 | 1 | 1 | 1 | 8.14 | 2.41 | 7.17 |
| 15 | −1 | 1 | 1 | −1 | 8.56 | 2.45 | 7.62 |
| 16 | 0 | 0 | −2 | 0 | 9.06 | 3.18 | 7.93 |
| 17 | 2 | 0 | 0 | 0 | 7.10 | 2.54 | 6.07 |
| 18 | −1 | −1 | 1 | 1 | 8.17 | 2.93 | 7.14 |
| 19 | 0 | 0 | 0 | 2 | 9.30 | 3.91 | 8.07 |
| 20 | 0 | 0 | 0 | 0 | 9.87 | 3.82 | 8.66 |
| 21 | −1 | 1 | −1 | −1 | 8.28 | 2.48 | 7.19 |
| 22 | 0 | 0 | 0 | 0 | 9.22 | 3.68 | 8.27 |
| 23 | 0 | 0 | 0 | −2 | 9.81 | 3.48 | 8.42 |
| 24 | −1 | −1 | −1 | 1 | 8.06 | 2.7 | 7.27 |
| 25 | −1.429 | 0 | 0 | 0 | 7.57 | 1.8 | 6.52 |
| 26 | 0 | 2 | 0 | 0 | 9.13 | 3.09 | 8.24 |
| 27 | 1 | −1 | 1 | 1 | 8.67 | 3.73 | 7.28 |
| 28 | 0 | 0 | 0 | 0 | 9.63 | 3.57 | 8.41 |
| 29 | −1 | −1 | −1 | −1 | 8.09 | 2.43 | 6.91 |
| 30 | 0 | 0 | 0 | 0 | 9.67 | 3.82 | 8.36 |
Table 6.
Different statistical values form Model Fit Summary tab.
Table 6.
Different statistical values form Model Fit Summary tab.
| Source | Sequential p-Value | Lack of Fit p-Value | Adjusted R-Squared | Predicted R-Squared |
|---|
| Linear | 0.0345 | 0.0050 | 0.2225 | 0.0708 |
| 2Fl | 0.9022 | 0.0030 | 0.0783 | −0.1258 |
| Quadratic | <0.0001 | 0.8855 | 0.9546 | 0.9240 |
| Cubic | 0.7924 | 0.9204 | 0.9382 | |
Table 7.
ANOVA Analysis of −15 °C splitting strength response model.
Table 7.
ANOVA Analysis of −15 °C splitting strength response model.
| Source | Sum of Squares | df | Mean Square | F-Value | p-Value |
|---|
| Model | 10.6 | 14 | 0.76 | 44.51 | <0.0001 |
| A-Asphalt-aggregate ratio | 5.06 | 1 | 5.06 | 297.6 | <0.0001 |
| B-Silane coupling agent content | 0.16 | 1 | 0.16 | 9.12 | 0.0086 |
| C-Mixing temperature | 0.059 | 1 | 0.059 | 3.47 | 0.0823 |
| D-Compaction times | 0.23 | 1 | 0.23 | 13.29 | 0.0024 |
| AB | 0.11 | 1 | 0.11 | 6.69 | 0.0206 |
| AC | 0.086 | 1 | 0.086 | 5.03 | 0.0405 |
| AD | 0.12 | 1 | 0.12 | 6.89 | 0.0191 |
| BC | 5.06 × 10⁻⁴ | 1 | 5.06 × 10⁻⁴ | 0.03 | 0.8654 |
| BD | 0.39 | 1 | 0.39 | 22.77 | 0.0002 |
| CD | 0.016 | 1 | 0.016 | 0.96 | 0.3439 |
| A2 | 5.94 | 1 | 5.94 | 349.09 | <0.0001 |
| B2 | 0.49 | 1 | 0.49 | 28.95 | <0.0001 |
| C2 | 0.28 | 1 | 0.28 | 16.54 | 0.001 |
| D2 | 9.14 × 10⁻³ | 1 | 9.14 × 10⁻³ | 0.54 | 0.475 |
| Residual | 0.26 | 15 | 0.017 | | |
Table 8.
Credibility analysis of modified regression equation.
Table 8.
Credibility analysis of modified regression equation.
| Std.Dev. | 0.13 | R2 | 0.9765 |
| Mean | 3.19 | RAdj2 | 0.9546 |
| C.V.% | 4.09 | RPred2 | 0.9240 |
| PRESS | 0.82 | Adeq Precisior | 21.416 |
Table 9.
Optimal conditions obtained by Numerical optimization.
Table 9.
Optimal conditions obtained by Numerical optimization.
| Asphalt-aggregate ratio | 5.18% |
| Silane coupling agent content | 2.50% |
| Mixing temperature | 153 °C |
| Compaction times | 50 |
| Desirability | 0.056 |
Table 10.
Low-temperature beam bending test results of all OGFC mixtures.
Table 10.
Low-temperature beam bending test results of all OGFC mixtures.
| Types | Bending-Tensile Strength/RB | Maximum Bending Strain/εB | Bending Stiffness Modulus/SB |
|---|
| OGFC | 5.202 | 2886 | 1802 |
| SBS-OGFC | 7.465 | 4155 | 1796 |
| SM-OGFC | 6.842 | 4077 | 1678 |
Table 11.
Economic benefit analysis.
Table 11.
Economic benefit analysis.
| Mixture Type | Marshall Stability (kn) | Dynamic Stability (n/min) | −15 °C Splitting Strength (Mpa) | Bending-Tensile Strength (Mpa) | Cantabro Losses (%) | Immersion Marshall Stability (kn) | Spring-Thawing Stability (kn) | Permeability Coefficient (cm/s) | Asphalt Price (CNH/kg) | Mixture Price (CNH/kg) |
|---|
| SBS-OGFC | 9.12 | 5250 | 3.71 | 7.465 | 12.8 | 8.21 | 8.16 | 0.28 | 4.52 | 0.382 |
| SM-OGFC | 9.63 | 4972 | 3.87 | 6.842 | 14.2 | 8.1 | 8.29 | 0.24 | 4.05 | 0.363 |
| OGFC | 6.47 | 3340 | 2.74 | 5.202 | 17.4 | 5.73 | 5.84 | 0.19 | 4.00 | 0.380 |
| PIRSBS-OGFC and PRSBS-OGFC | 1.41 | 1.57 | 1.35 | 1.44 | 0.74 | 1.43 | 1.40 | 1.47 | 1.13 | 1.01 |
| PIRSM-OGFC and PRSM-OGFC | 1.49 | 1.49 | 1.41 | 1.32 | 0.82 | 1.41 | 1.42 | 1.26 | 1.01 | 0.96 |
© 2018 by the authors. Licensee MDPI, Basel, Switzerland. This article is an open access article distributed under the terms and conditions of the Creative Commons Attribution (CC BY) license (http://creativecommons.org/licenses/by/4.0/).


