Article

Determination of Relative Ionization Cross Sections for Resonance Enhanced Multiphoton Ionization of Polycyclic Aromatic Hydrocarbons

1
Joint Mass Spectrometry Centre, Chair of Analytical Chemistry, Institute of Chemistry, University of Rostock, Dr. Lorenz—Weg 2, 18059 Rostock, Germany
2
Joint Mass Spectrometry Centre, Cooperation Group Comprehensive Molecular Analytics, Helmholtz Zentrum München-German Research Center of Environmental Health (GmbH), Ingolstädter Landstrasse 1, 85764 Neuherberg, Germany
*
Author to whom correspondence should be addressed.
Appl. Sci. 2018, 8(9), 1617; https://doi.org/10.3390/app8091617
Submission received: 15 July 2018 / Revised: 4 September 2018 / Accepted: 6 September 2018 / Published: 11 September 2018
(This article belongs to the Special Issue Photoionization Mass Spectrometry)

Abstract

:
Resonance enhanced multiphoton ionization (REMPI) is a powerful method for the sensitive determination of polycyclic aromatic hydrocarbons (PAHs) in gaseous mixtures via mass spectrometry (MS). In REMPI, ions are produced by the absorption of at least two photons including defined electronic intermediate states. As a result—unlike other laser-based ionization techniques—spectroscopic selectivity is involved into the ionization process. Nevertheless, these wavelength-dependent ionization rates impede the quantification using REMPI. For this purpose, relative photoionization cross sections (relPICS) give an easy-to-use approach to quantify REMPI-MS measurements. Hereby, the ionization behavior of a single compound was compared to that of a reference substance of a given concentration. In this study, relPICS of selected single-core aromatics and PAHs at wavelengths of 266 nm and 248 nm were determined using two different time-of-flight mass spectrometric systems (TOFMS). For PAHs, relPICS were obtained which showed a strong dependence on the applied laser intensity. In contrast, for single-core aromatics, constant values of relPICS were determined. Deviations of relPICS between both TOFMS systems were found for small aromatics (e.g., benzene), which can be assigned to the differences in UV generation in the particular system. However, the relPICS of this study were found to be in good agreement with previous results and can be used for system-independent quantification.

1. Introduction

Over the past decades, the investigation of the environmental issues and health-related effects of polycyclic aromatic hydrocarbons (PAHs) has become an important research field. Due to their high biological and ecological importance, analytical techniques for a fast and sensitive determination of these compounds are in the state of continuous improvements. Resonance enhanced multiphoton ionization (REMPI) coupled to time-of-flight mass spectrometry (TOFMS) is a powerful technique in this respect, particularly for online measurements of PAHs in gaseous samples. Since its very first application in the late 1970s [1,2,3], REMPI-TOFMS has been evolved as a versatile tool for the selective and sensitive analysis of PAHs in combustion processes and environmental monitoring [4,5,6,7,8,9,10,11].
To date, some profound papers have been published, reviewing the fundamentals of REMPI as well as REMPI-MS in detail [12,13,14]. In respect to the detailed information given in those publications, only a short overview is presented in this work.
REMPI occurs by the simultaneous or sequential absorption of two or more photons including resonant molecular excited states. The energy of each photon is below the ionization threshold of the molecules. REMPI can be classified with respect to the number and energy of the photons involved in the ionization process.
Figure 1a illustrates the ionization schemes of one of the most common REMPI techniques, which is known as (1 + 1) one-color REMPI. Herein, molecules are excited into their intermediate states by absorbing one photon with a distinct wavelength. The following absorption of a second photon of the same energy, within the lifetime of this intermediate state, leads to ionization. Based on the molecular electronic structure, REMPI is particularly selective for PAHs. For these compounds, the intermediate states are accessible via UV-photons, whereas other components (e.g., N2, O2, H2O, alkanes, etc.) are not ionized.
A quantitative description of REMPI rates is given by Equation (1) and is known as the formal intensity law. This expression originates from kinetic considerations discussed in References [15,16,17]. As expressed in the equation, the ionization rate (R) depends on the squared intensity (I) of the irradiating laser beam.
R = N M 0 = σ 1 ( ω ) σ 2 ( ω ) 2 I 2 t p 2   ,  
here, N—number of ions; M 0 —number of initial molecules; σ 1 —photoabsorption cross section; σ 2 —photoionization cross section; ω —angular frequency; t p —laser pulse duration.
However, this expression only holds well for moderate laser intensities (≈104—106 W/cm2), where no saturation effects occur, and for resonant intermediate states that are long-lived compared to the pulse length of the laser. If one of the ionization steps is saturated, the quadratic intensity dependence of the ionization rate will change to exhibit a more linear behavior. Besides this intrinsic intensity dependency, geometrical effects of the laser beam may result in a non-integer deviation from the formal intensity law, as was shown by Brophy et al. [18,19].
Fragmentation of molecular ions when using REMPI is controllable and depends on the applied laser intensity. With moderate laser intensities, REMPI is a very soft ionization method, producing mostly molecular ions. On the other hand, applying higher laser intensities (above 108 W/cm2) will lead to increased fragmentation and the production of much smaller fragments (e.g., C+ for benzene) compared to electron ionization [17,20,21].
The ionization rate depends on the applied laser wavelength, since the cross sections for absorption and ionization vary with the wavelength. This behavior complicates quantification and internal or external standards are only applicable for target screening. Another possibility is the utilization of absolute photoionization cross sections [22]. These parameters neglect thermal effects as well as mass spectrometric parameters and are difficult to determine. Therefore, absolute cross sections may only give an estimation of the ionization rate under certain conditions. However, one possible approach to overcome this drawback is the introduction of relative photoionization cross sections (relPICS). In this approach, the ionization rate of the analytes at a given wavelength is compared with that of a reference substance. Once determined, these relPICS can be used to recalculate the concentrations of compounds in an unknown gas mixture just by measuring the concentration of the reference substance. Therefore, relPICS may be used for a simple and system-independent quantification in REMPI-TOFMS measurements at a given laser wavelength.
The principle of relPICS has already been used by Adam et al. [23] and will be shortly described in the following. Based on the scheme given in Figure 1b, the number of ions ( N 1 , i ) produced by (1 + 1) one-color REMPI can be derived from Equation (1). These ions are transferred through the mass spectrometric system with a distinct transmission (T) and are separated based on their mass-to-charge ratio (m/z). The number of detected ions ( N 2 , i ) is given by Equation (2).
N 2 , i = N 1 , i T = σ 1 ( ω ) σ 2 ( ω ) 2 M 0 , i I 2 t p 2 T   ,  
This expression can be normalized to the ionization behavior of the reference substance, which results in:
N 2 , A N 2 , ref = σ 1 , A ( ω ) σ 2 , A ( ω ) M 0 , A I 2 t p 2 T σ 1 , ref ( ω ) σ 2 , ref ( ω ) M 0 , ref I 2 t p 2 T   ,  
where A—analyte and ref—reference.
For time-of-flight mass spectrometers, T can be approximated as a constant for all ions in a mass range between m/z 20 and 300. Therefore, Equation (3) simplifies to:
σ rel ,   ref ( ω ) = σ 1 , A ( ω ) σ 2 , A ( ω ) σ 1 , ref ( ω ) σ 2 , ref ( ω ) = N 2 , A N 2 , ref M 0 , ref M 0 , A = r A r ref ,  
Here, r i   = N 2 , i M 0 , i is the response factor of a single substance at a distinct wavelength. If the ionization behavior ( R i   I n i ) of both substances differs, Equation (4) can be written as:
σ rel ,   ref ( I , ω ) = N 2 , A N 2 , ref M 0 , ref M 0 , A I ( n A n ref ) = r A r ref I ( n A n ref )  
Here, Equation (5) emphasizes an intensity-dependent trend for relPICS.
Based on these considerations, we determined cross sections for selected aromatic and polycyclic aromatic compounds relative to toluene as a reference substance ( σ rel , tol ). With regard to laser systems frequently used for REMPI (fourth harmonic of Nd:YAG and KrF-Excimer), we examined the corresponding wavelengths (266 nm and 248 nm) and demonstrated the system-independent quantification using two different mass spectrometric systems. Our presented approach is primarily devoted to take a step towards the complicated semi-quantification of online REMPI-TOFMS experiments for environmental and process monitoring. For online gas phase REMPI-MS measurements [24,25,26] or direct REMPI-MS analysis of liquid samples with either membrane inlet [27,28,29] or direct inlet techniques [30], a native or isotope labeled internal standard (e.g., toluene or D3-toluene) can be added to semi-quantify the polycyclic aromatic compounds via relPICS. Additionally, for REMPI-based analytical techniques, which do not allow a straight forward internal standardization approach, such as laser desorption REMPI-MS online analysis of PAHs on a single aerosol particle [31], the relPICS allow the determination of the pattern of the aromatic compounds.

2. Materials and Methods

2.1. Experimental Setup

2.1.1. Mass Spectrometric Systems

In this study, two different REMPI-TOFMS systems were used. The first REMPI-TOFMS (PITOF 1) was described by Mühlberger et al. [32] and was custom-built by Stefan Kaesdorf GmbH, Munich, Germany. To minimize the influence of photoelectrons on the ionization process, a delayed extraction with a delay time of 100 ns was utilized. Two 8-Bit converters with different amplifications (DP210, Acqiris, Plan-les-Quates, Switzerland) were used to extend the dynamic range of the MS. In this setup, a tunable UV laser beam was generated from 1064 nm of a Nd:YAG (Continuum Surelite II, Amplitude Laser Group, San Jose, USA; pulse duration = 5 ns; repetition rate = 10 Hz) using an optic parametric oscillator (VISIR 2, GWU-Lasertechnik, Erftstadt, Germany). For the purpose of this study, 266 nm (0.29 mJ/pulse) and 248 nm (0.28 mJ/pulse) were used. The laser intensity was varied by a variable neutral density attenuator (NDM2/M, Thorlabs Inc.; Newton, USA) placed in front of the ion source. A focusing lens (focal length = 350 mm) was used to increase the power density of the irradiating laser beam. Additionally, by varying the position of the lens relative to the ion source, the examinable intensity range was extended. The focal point inside the ion source was determined by monitoring the total ion current (TIC) as a function of the lens location. The determination of relPICS were performed at three different lens positions (3.5 cm, 2.5 cm, and 0 cm relative to the focal point). The power density of the focused laser beam was calculated with the assumption of a Gaussian beam shape. By monitoring the pulse energy behind the ion source, the power density was recalculated with an attenuation factor of 10% (energy loss of the UV window).
The second mass spectrometric system (PITOF 2) was a compact TOFMS custom-built by Stefan Kaesdorf GmbH, Munich, Germany. Mass spectra were recorded by two 8-Bit converter cards (AP240, Acqiris, Plan-les-Quates, Switzerland). UV radiation of 266 nm wavelength was produced by the fourth harmonic generation of a Nd:YAG laser (Big Sky Ultra, Quantel, Les Ulis, France; repetition rate = 20 Hz; pulse duration = 10 ns). In contrast to PITOF 1, an unfocused Gaussian laser beam was expanded to an estimated diameter of 3 mm. The averaged power density was calculated from the pulse energy behind the ion source (attenuation factor = 7%).

2.1.2. Sample Introduction

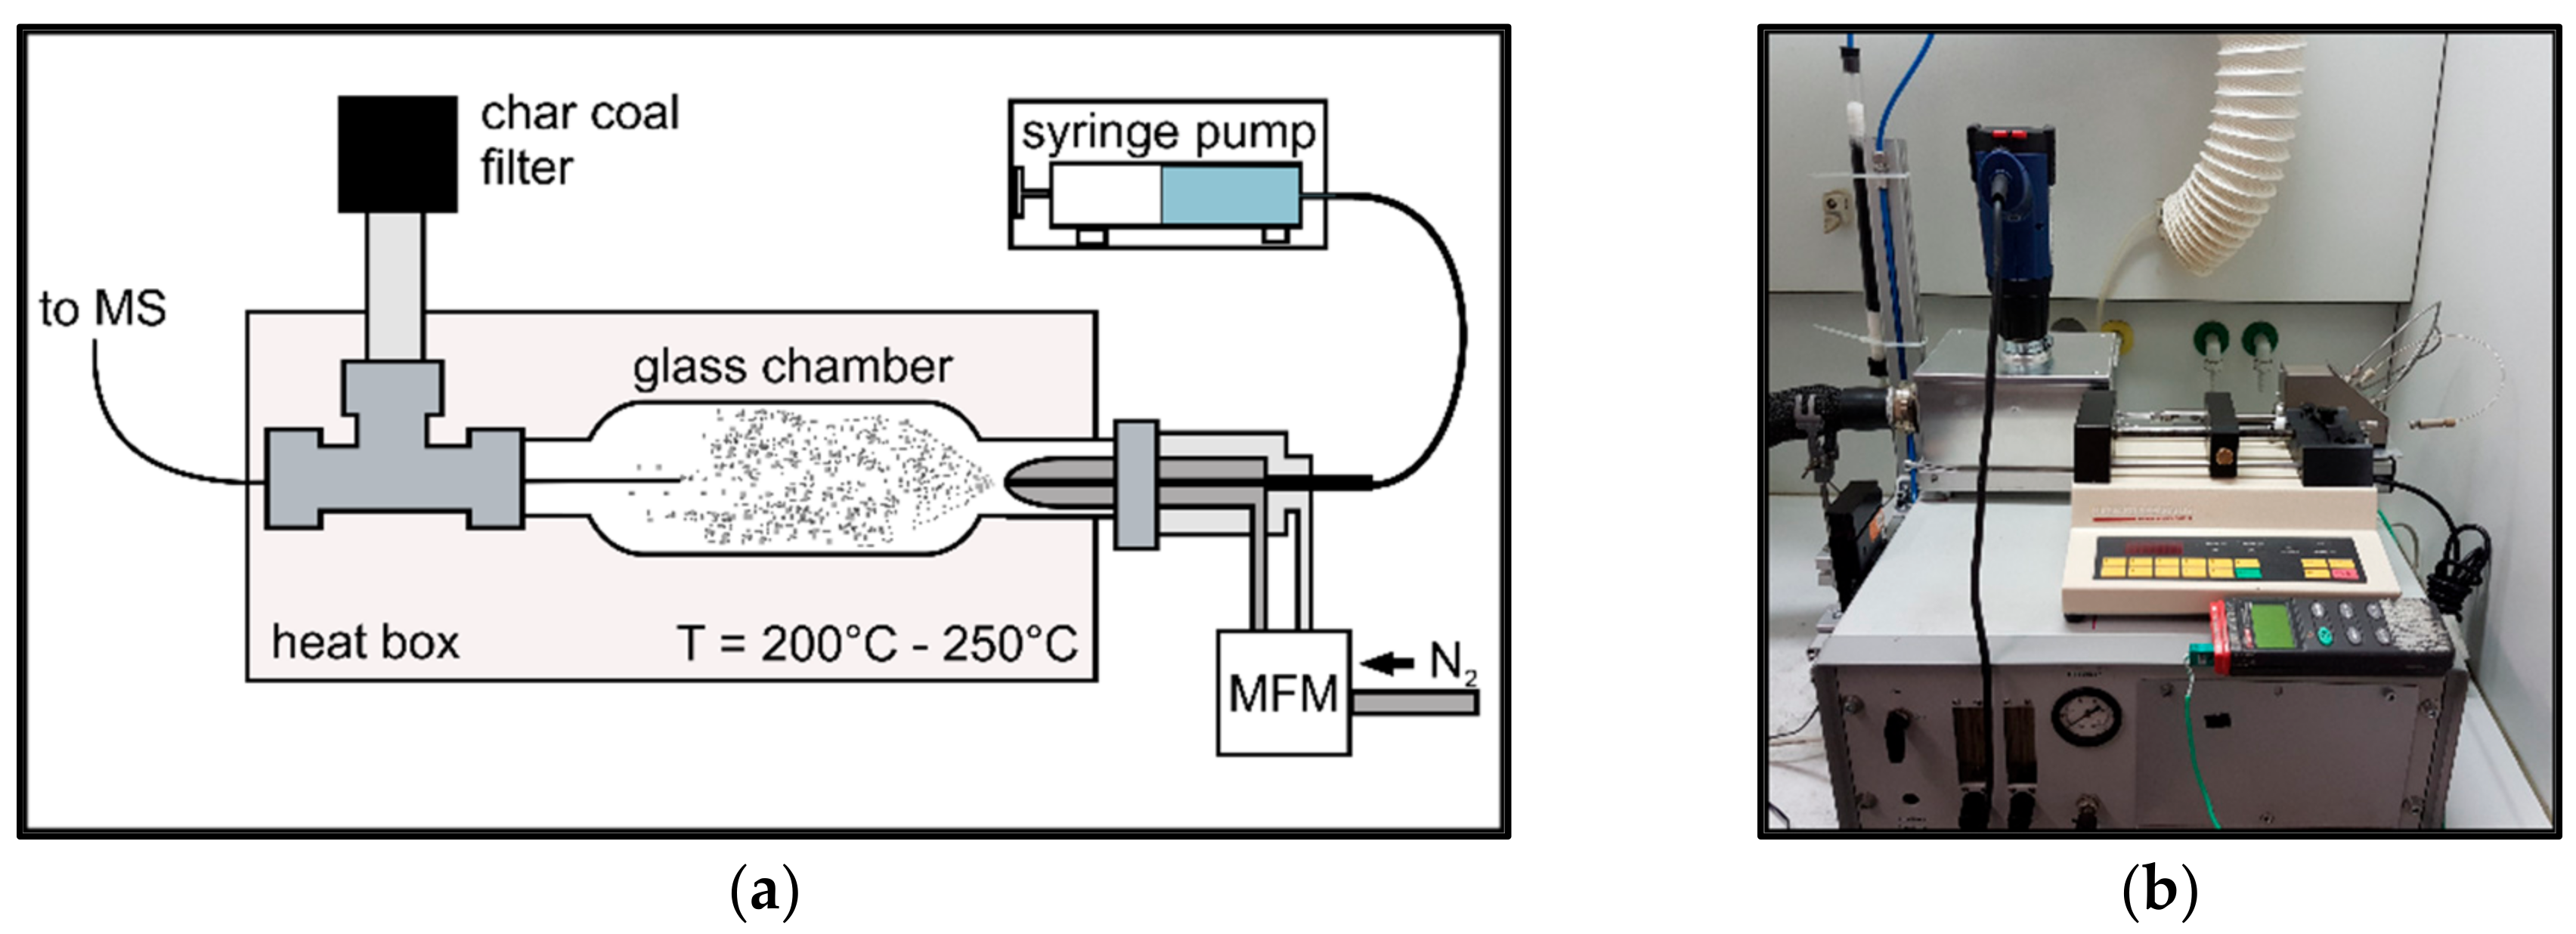
For the determination of σ rel , tol , gaseous mixtures with known concentrations of the analytes are needed. A custom inlet system for the introduction of (semi-)volatile organic compounds ((S)VOCs) was used to transfer the analytes into the gas phase, see Figure 2. A non-heated nebulizer assembly, demounted from an API-LCMS system (AB SCIEX, Concord, Toronto, ON, Canada), was connected to a glass chamber. The chamber was placed in a box, which was heated up to 250 °C. Standard solutions of the analytes were introduced by a syringe pump (Harvard Apparatus Syringe Infusion pump 22) at various flow rates, ranging from 10 µL/min to 50 µL/min. The liquid samples were sprayed into the heated glass chamber with the aid of nitrogen at a total flow rate of 1.3 L/min. The concentrations of the analytes were calculated from their individual molar flow rate F:
c = F analyt F N 2 + F solvent + F analyt  
The sample introduction system was coupled to the mass spectrometers using a capillary (stainless steel with an inner diameter (ID) of 200 µm for PITOF 1; fused silica capillary with ID = 230 µm for PITOF 2), transferring the gaseous analytes into the ion source of the MS at a temperature of 235 °C.

2.2. Standard Mixtures

Standard solutions of selected single-core aromatics and PAHs (various distributors; purity 98–99.6%) with known concentrations were prepared in n-hexane (Fisher Scientific GmbH, Schwerte, Germany; purity 95%), cyclohexane (Carl Roth GmbH+Co. KG, Karlsruhe, Germany; purity 99.9%), and isopropanol (Carl Roth GmbH+Co. KG, Karlsruhe, Germany; purity 99.5%). Toluene (Sigma-Aldrich, Munich, Germany; 99.9%) was added as a reference substance to each standard mixture. The concentrations of these standard solutions were chosen in such a way to gain approximately the same signal heights in the mass spectra for the analytes as well as for toluene.
Additionally, 1 ppm and 10 ppm standard gas mixtures containing benzene, toluene, p-xylene, and 1,2,4-trimethylbenzene (Linde AG, Pullach, Germany) were investigated. The toluene signal of the standard gas mixture was also used to check the toluene concentrations of all standard solutions.

2.3. Data Handling

Data acquisition on both systems was performed by customized software. Peak areas of each compound were calculated at a unit mass resolution.
For the determination of time-dependent mass profiles and response factors, 10 and 300 mass spectra were averaged, respectively. Response factors for each substance were calculated by dividing the peak area by c. The pulse energy was recorded for each measurement, and every value represents an averaged measurement of 10 s. The power density was estimated by considerations mentioned in Section 2.1.

3. Results

3.1. Evaluation of the Sample Introduction System

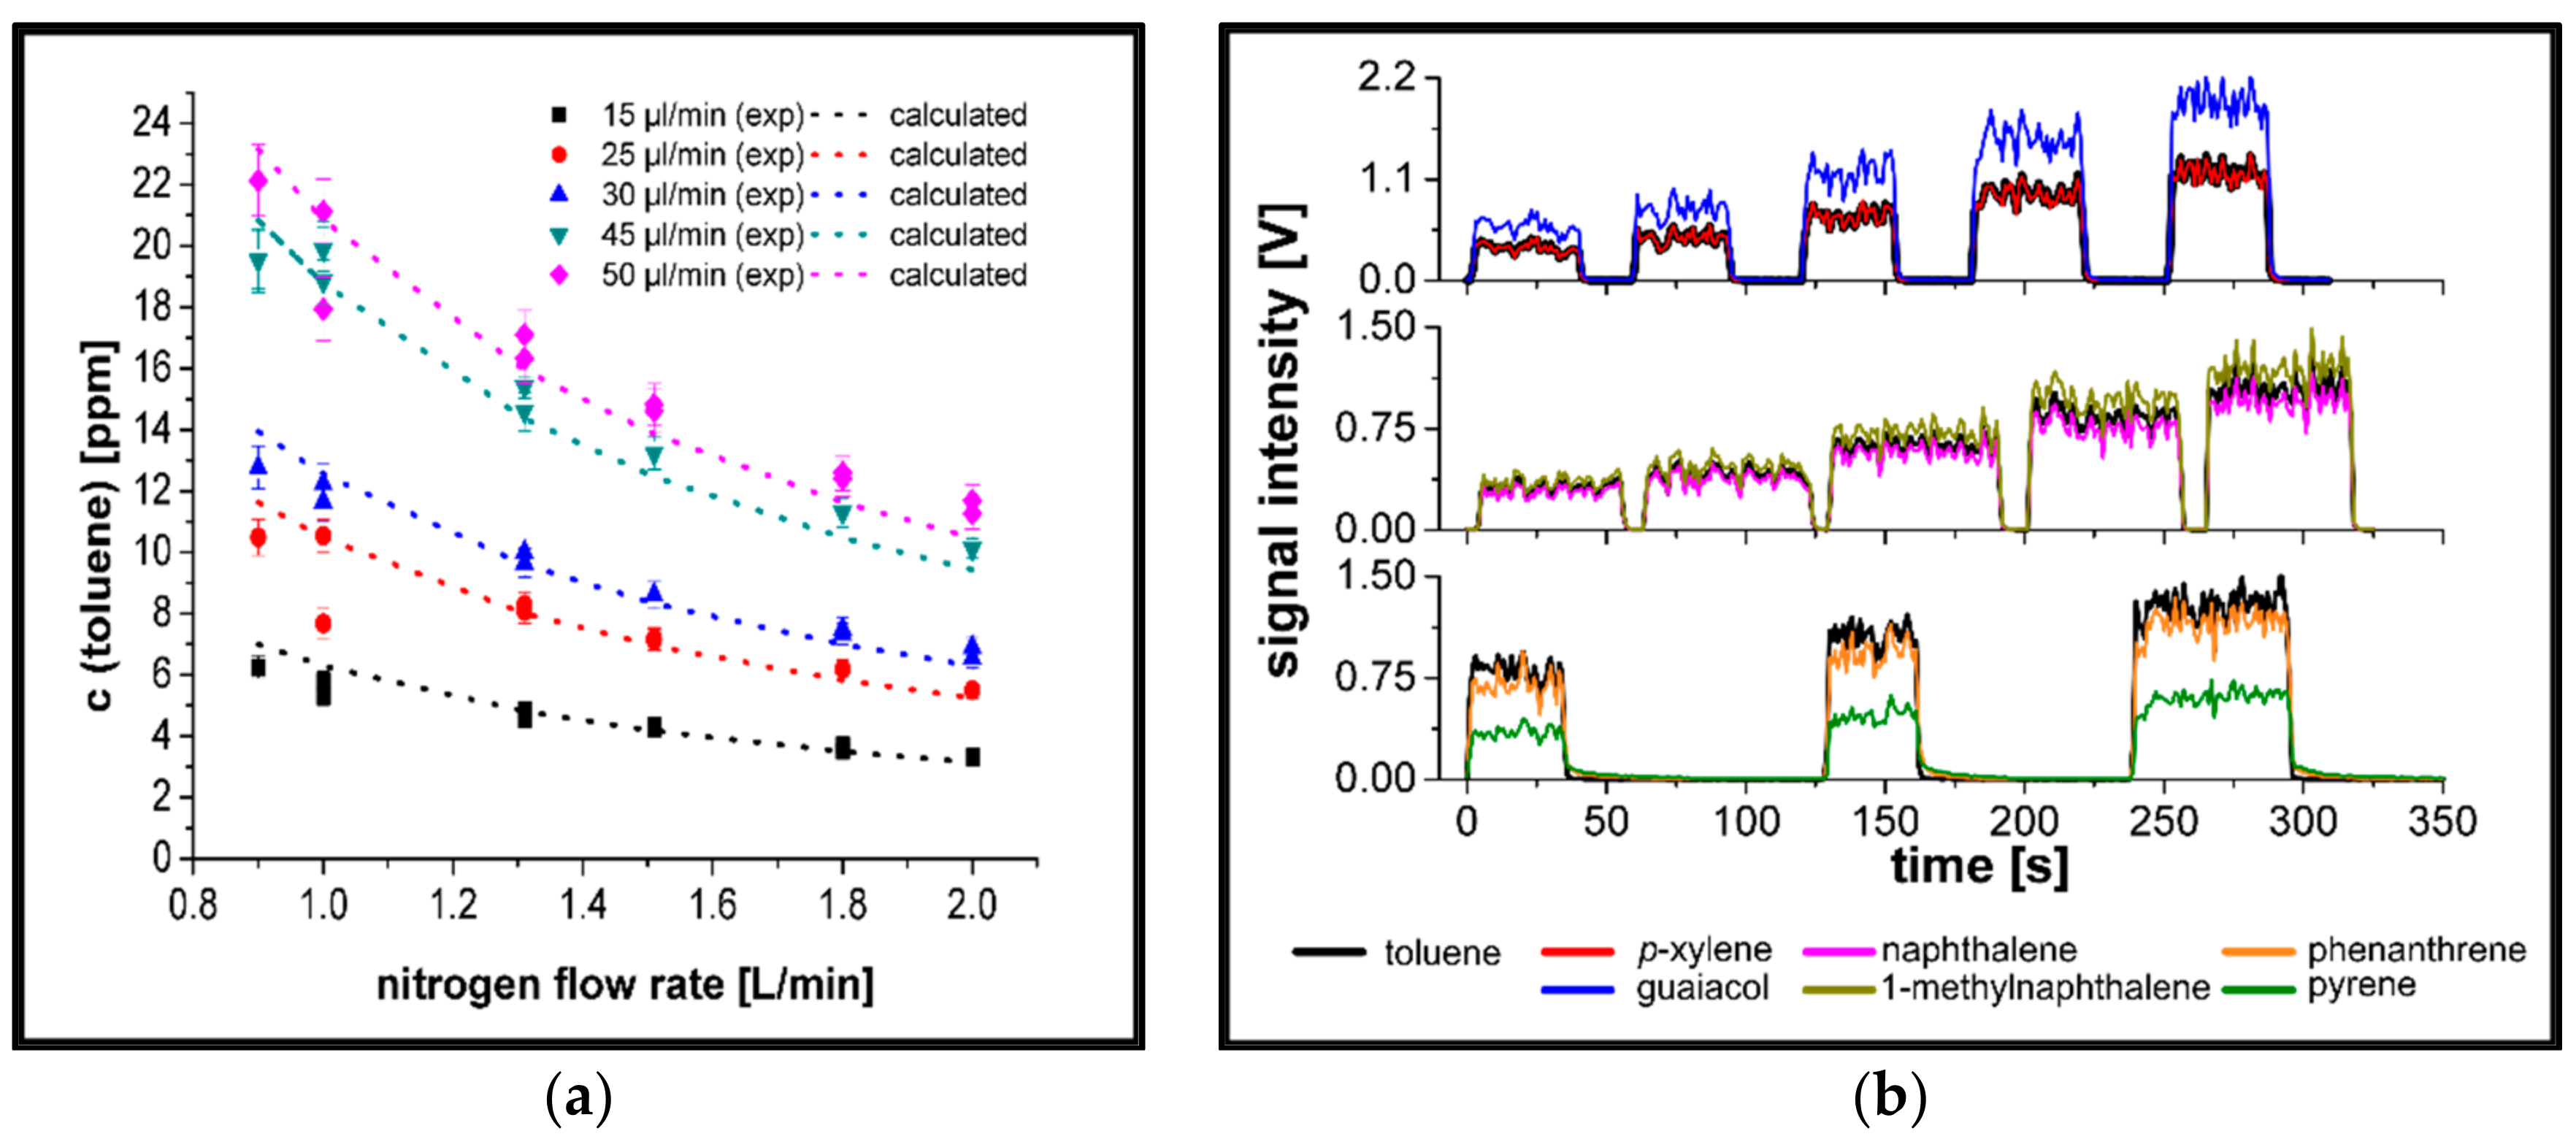
The determination of σ rel , tol requires known analyte concentrations entering the MS. Therefore, the sample introduction system has to be carefully characterized. For this purpose, different measurements were performed on both mass spectrometric systems. The suitability of the inlet device was proven by comparing the theoretical and experimental concentrations of toluene, which are easily accessible via standard gas mixtures. A toluene standard solution (10 µL/mL in hexane) was introduced into the system. Different concentrations of toluene inside of the glass chamber were achieved by varying the flow rates of the sample as well as that of nitrogen. A summary of these results for PITOF 1 is given in Figure 3a. The findings for the variation of the nitrogen flow as well as for the sample flow are in good agreement with the theoretical results. The best results were achieved at medium sample and nitrogen flow rates at values of 25 µL/min and 1.3 L/min, respectively. The signal stability and response characteristics of the introduction system for selected analytes are shown in Figure 3b. The variations in signal heights are mainly a result of shot-to-shot fluctuations of the laser beam. VOCs such as toluene and xylene show a rapid response and high signal stability. The time to reach maximal signal heights is approximately 2 s, whereas the time for returning to the baseline was below 10 s. Compounds with a much lower vapor pressure show rise times similar to that of toluene, but longer decline times up to 30 s.

3.2. Determination of relPICS for 266 nm

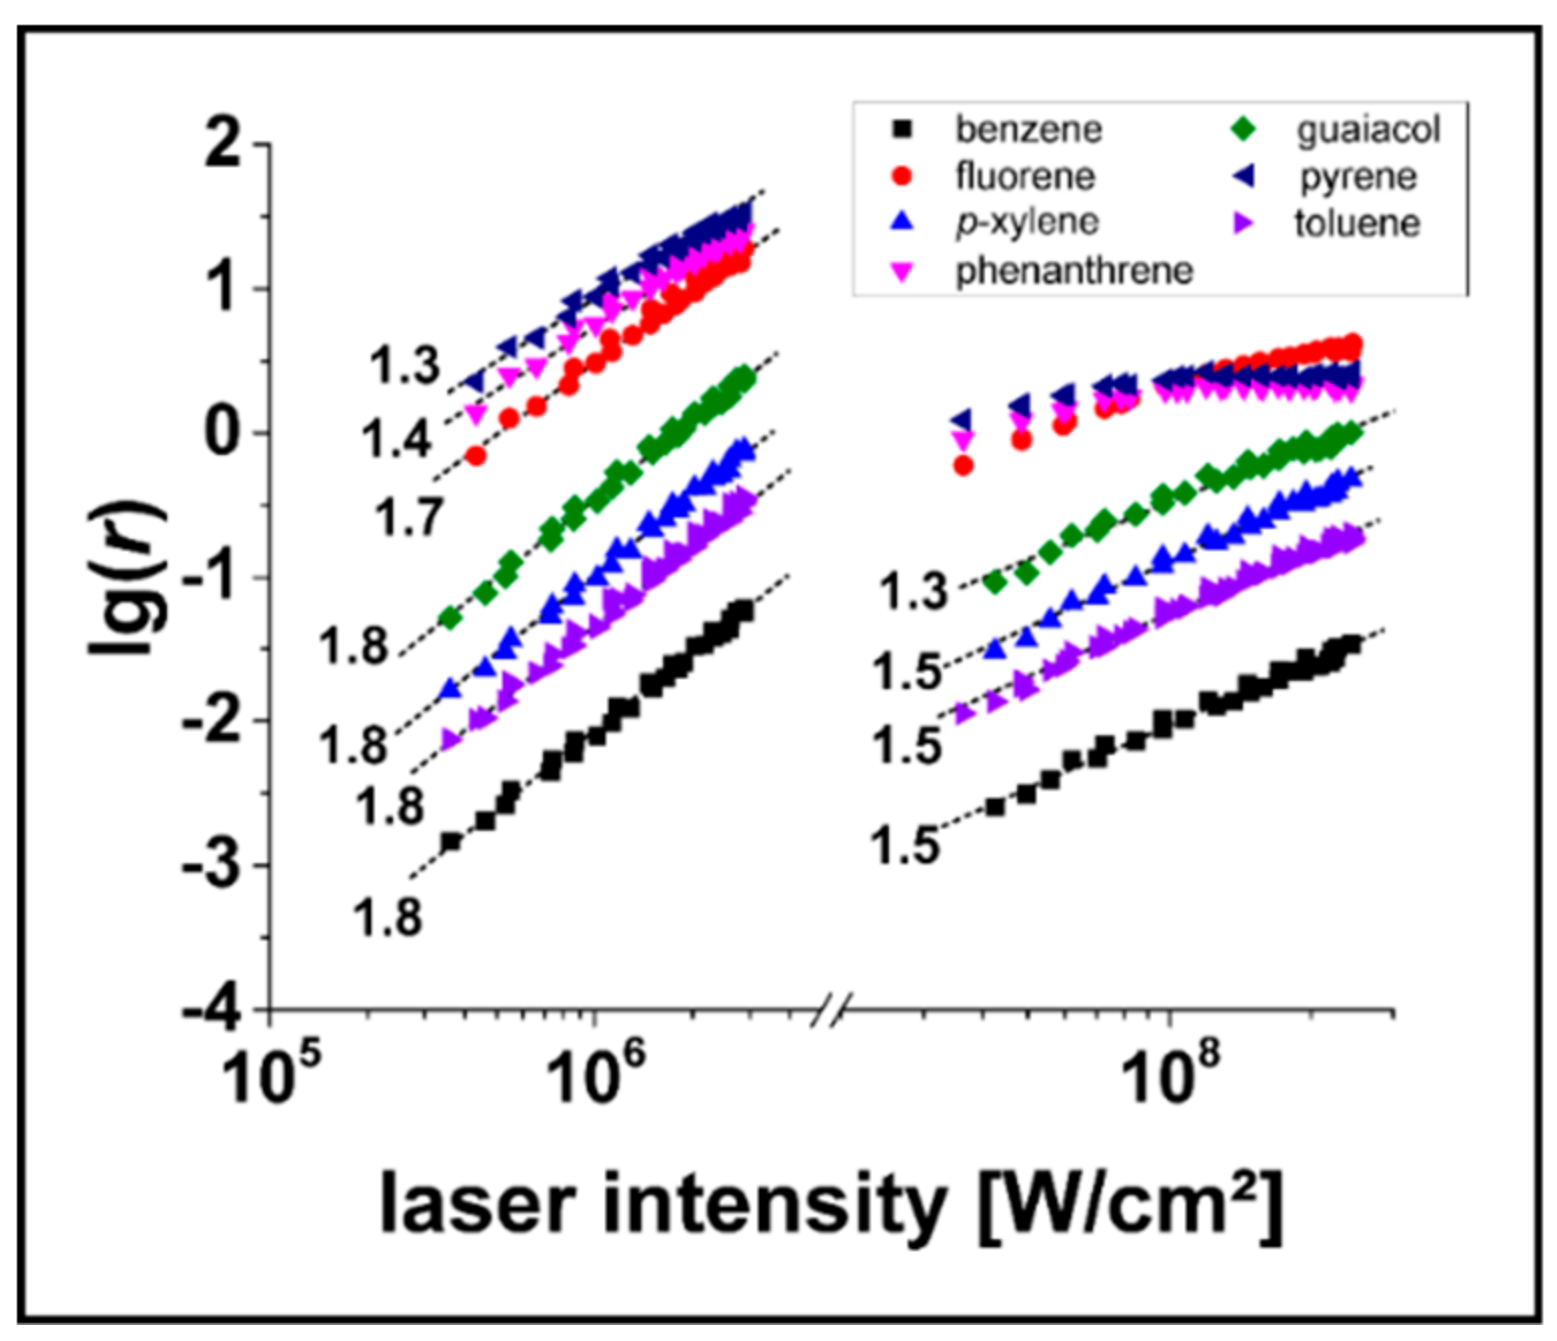
The intensity-dependent ionization behavior of selected aromatic and polycyclic aromatic species at 266 nm is shown in Figure 4. The slope of the regression line reflects the intensity dependence of the REMPI signal for each compound. Exact quadratic behavior was not observed for all compounds, which may have originated from the geometrical effects of the laser beam. Additionally, saturation occurred for phenanthrene and pyrene at higher laser intensities. However, for single-core and small polycyclic aromatics, similar trends appeared. These similarities in the ionization behavior between analyte and reference substance led to constant values of σ rel , tol over a wide intensity range. In contrast, an intensity-dependent course of σ rel , tol was determined for the case where the ionization behavior differs between both substances.
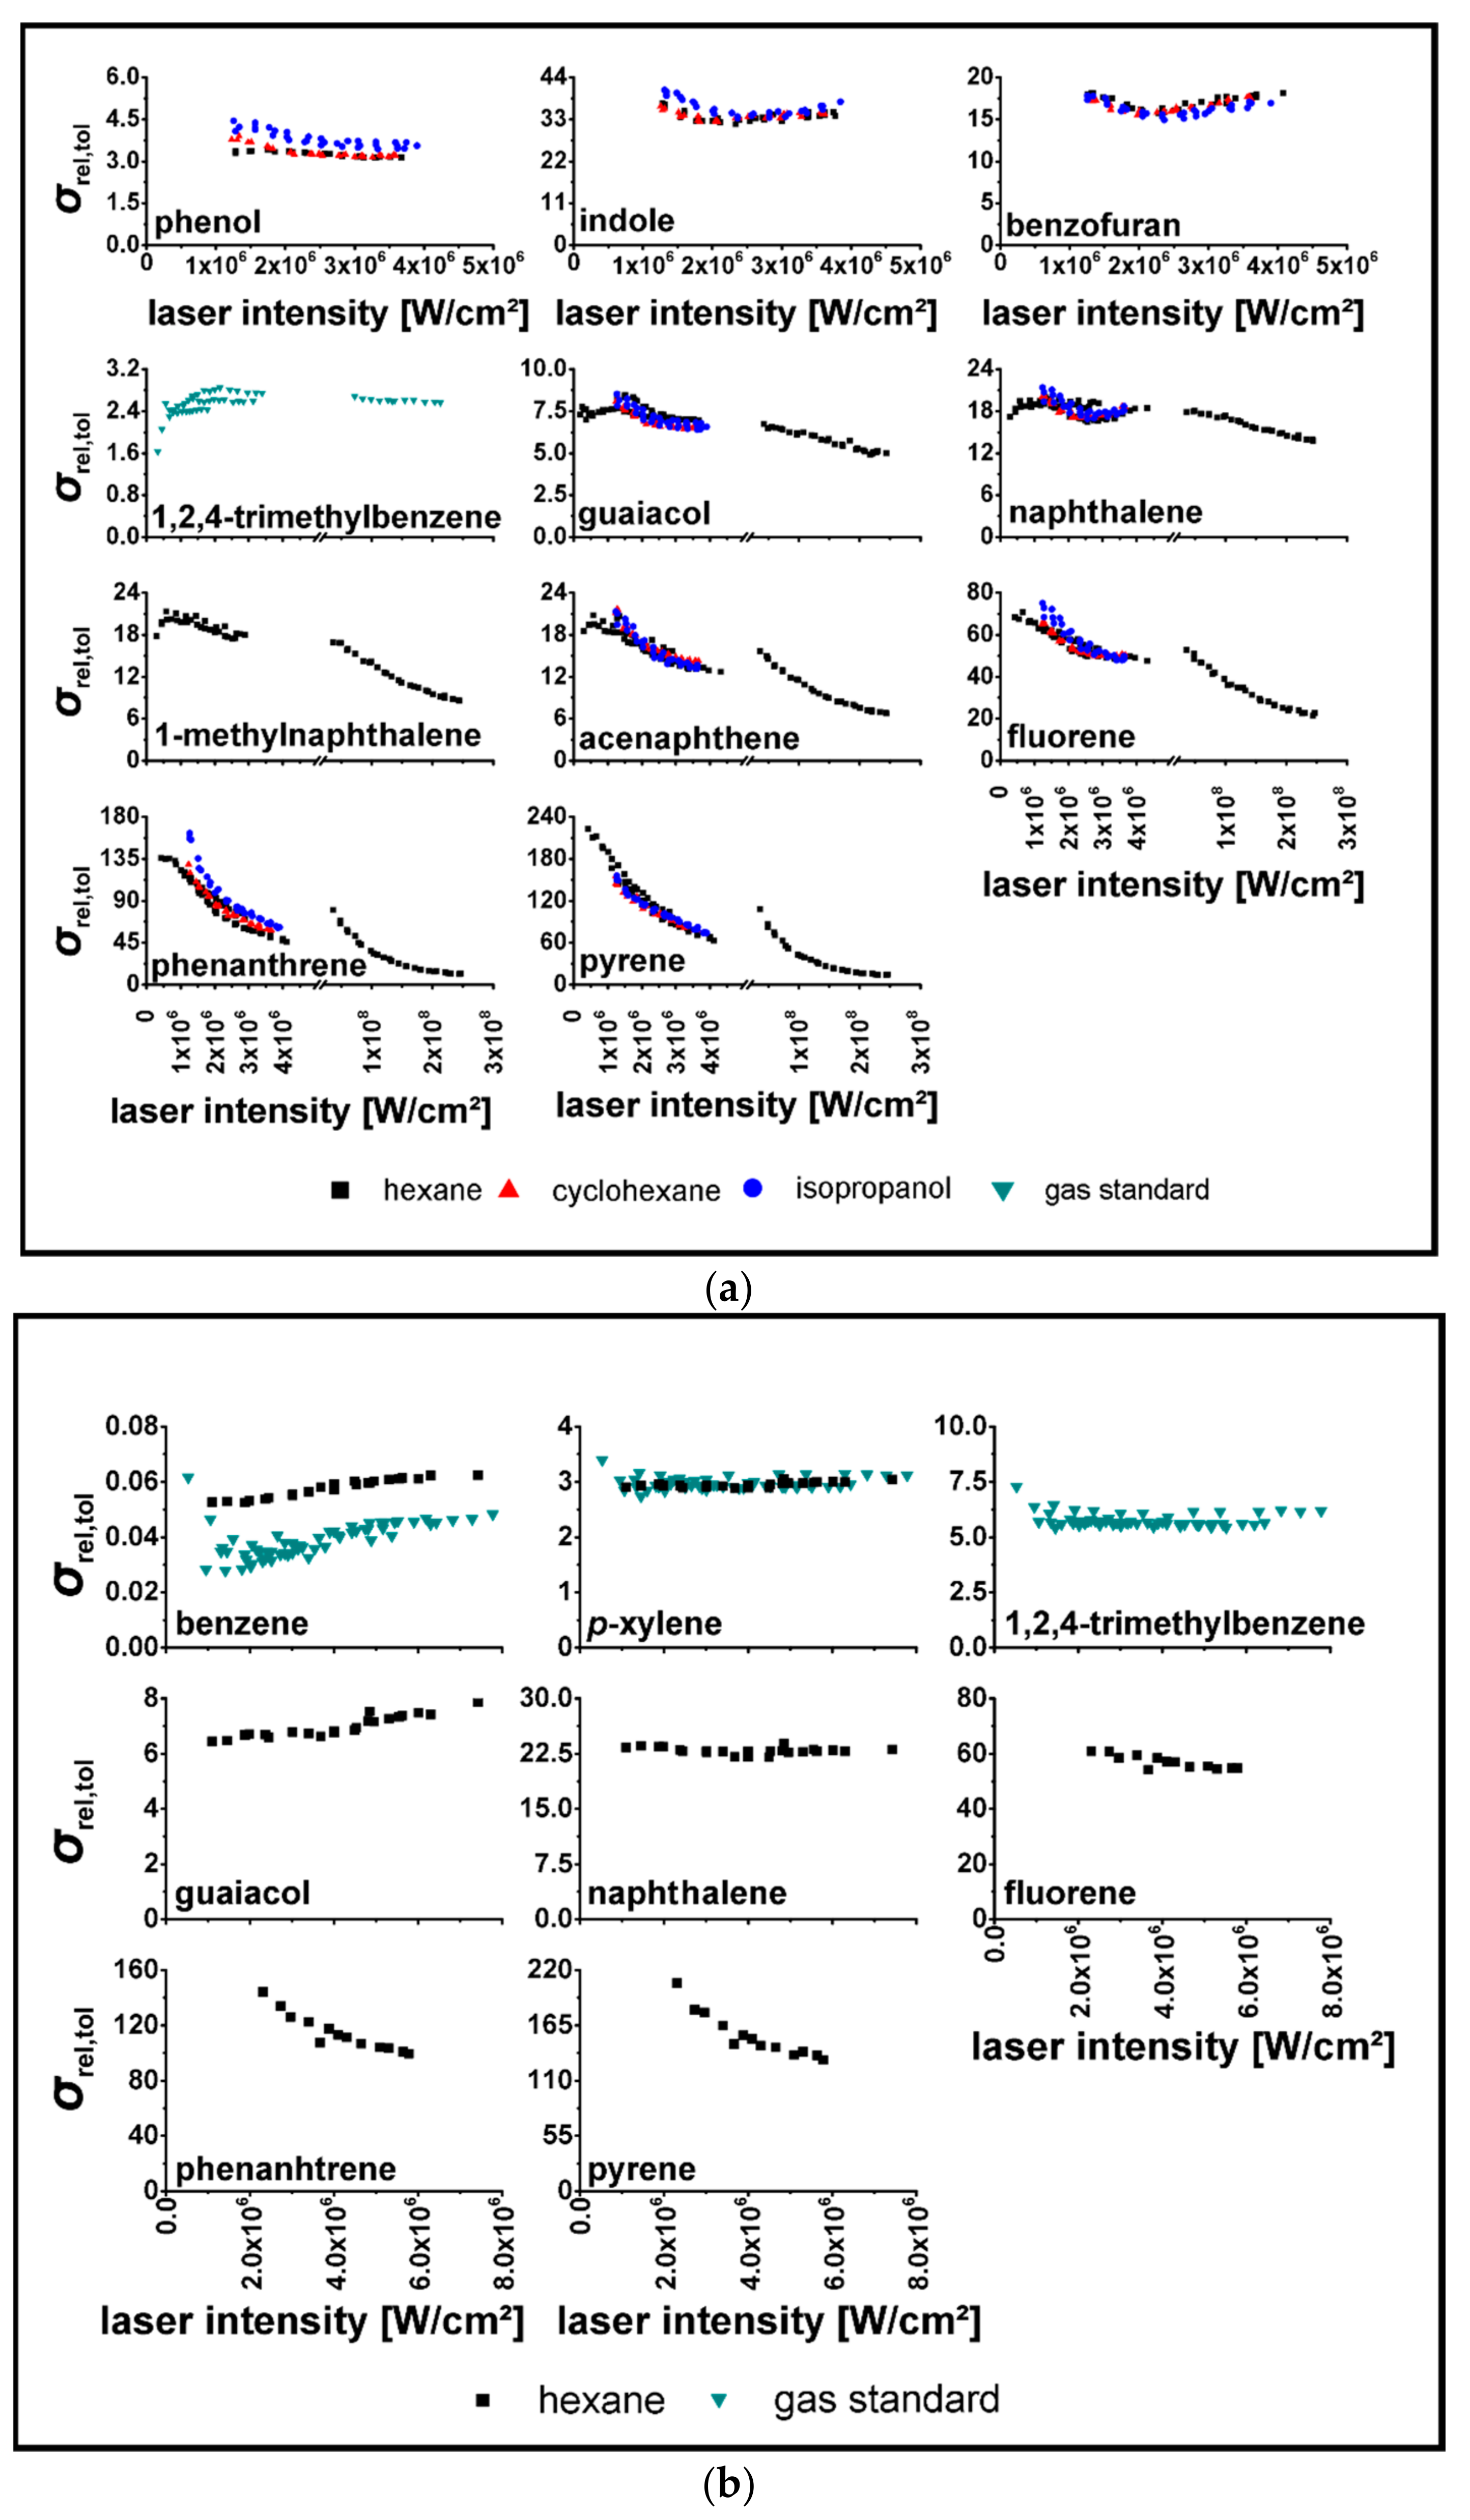
A graphical overview of the obtained σ rel , tol is given in Figure 5.
The investigated single-core aromatic compounds show mostly intensity-independent σ rel , tol . Benzene ( σ rel , tol 0.13 ) had the lowest response of all the investigated compounds. The methylation of the benzene ring leads to a higher σ rel , tol in order of the number of methyl groups ( p xylene :   σ rel , tol = 2.4 ; 1 , 2 , 4 trimethylbenzene :   σ rel , tol 4.2 ). Due to the increase of the electron density of the chromophoric center and the resonance stabilization of the ionic state, the insertion of other substituents with a positive mesomeric effect (+M-effect) led to increasing σ rel , tol compared to benzene (phenol: σ rel , tol = 3.5 ; guaiacol: σ rel , tol = 7.1 ). For indole ( σ rel , tol = 35 ) and benzofurane ( σ rel , tol = 17 ), relPICs increased as a result of oxygen being replaced by nitrogen. With the exception of naphthalene, intensity-dependent σ rel , tol were observed for larger aromatic ring systems even at lower laser intensities. Higher numbers of condensed rings led to higher values of σ rel , tol , whereas the effect of methylation was reduced. Thus, σ rel , tol of naphthalene with an approximate value of 21 showed a slight intensity-dependent behavior at laser intensities above 107 W/cm2, whereas pyrene had a strong intensity-dependent σ rel , tol in the range of approximately 25–225. The used solvents slightly influenced σ rel , tol (see for example fluorene in Figure 5a), which might be due to the different solubilities of the investigated compounds.
For higher condensed ring systems, the obtained relPICS were in good agreement for both mass spectrometers, whereas for small aromatics (benzene, p-xylene, 1,2,4-trimethylbenzene) significant differences were found. This effect was also observed when different datasets (A: only hexane measurements; B: different solvents, performed approximately one year after A) for benzene and xylene using PITOF 1 were compared (Figure 6). The relPICS for benzene and p-xylene in hexane for dataset A were supported by results of measurements of the 10-ppm gas standard with the same position of the focus lens (3.5 cm). These findings were reproduced by measurements of the same standard gas mixture from dataset B. Moreover, the measurements of all standard solutions of dataset B were well confirmed by the standard gas measurements of dataset A at a lens position of 2.5 cm.

3.3. Determination of relPICS for 248 nm

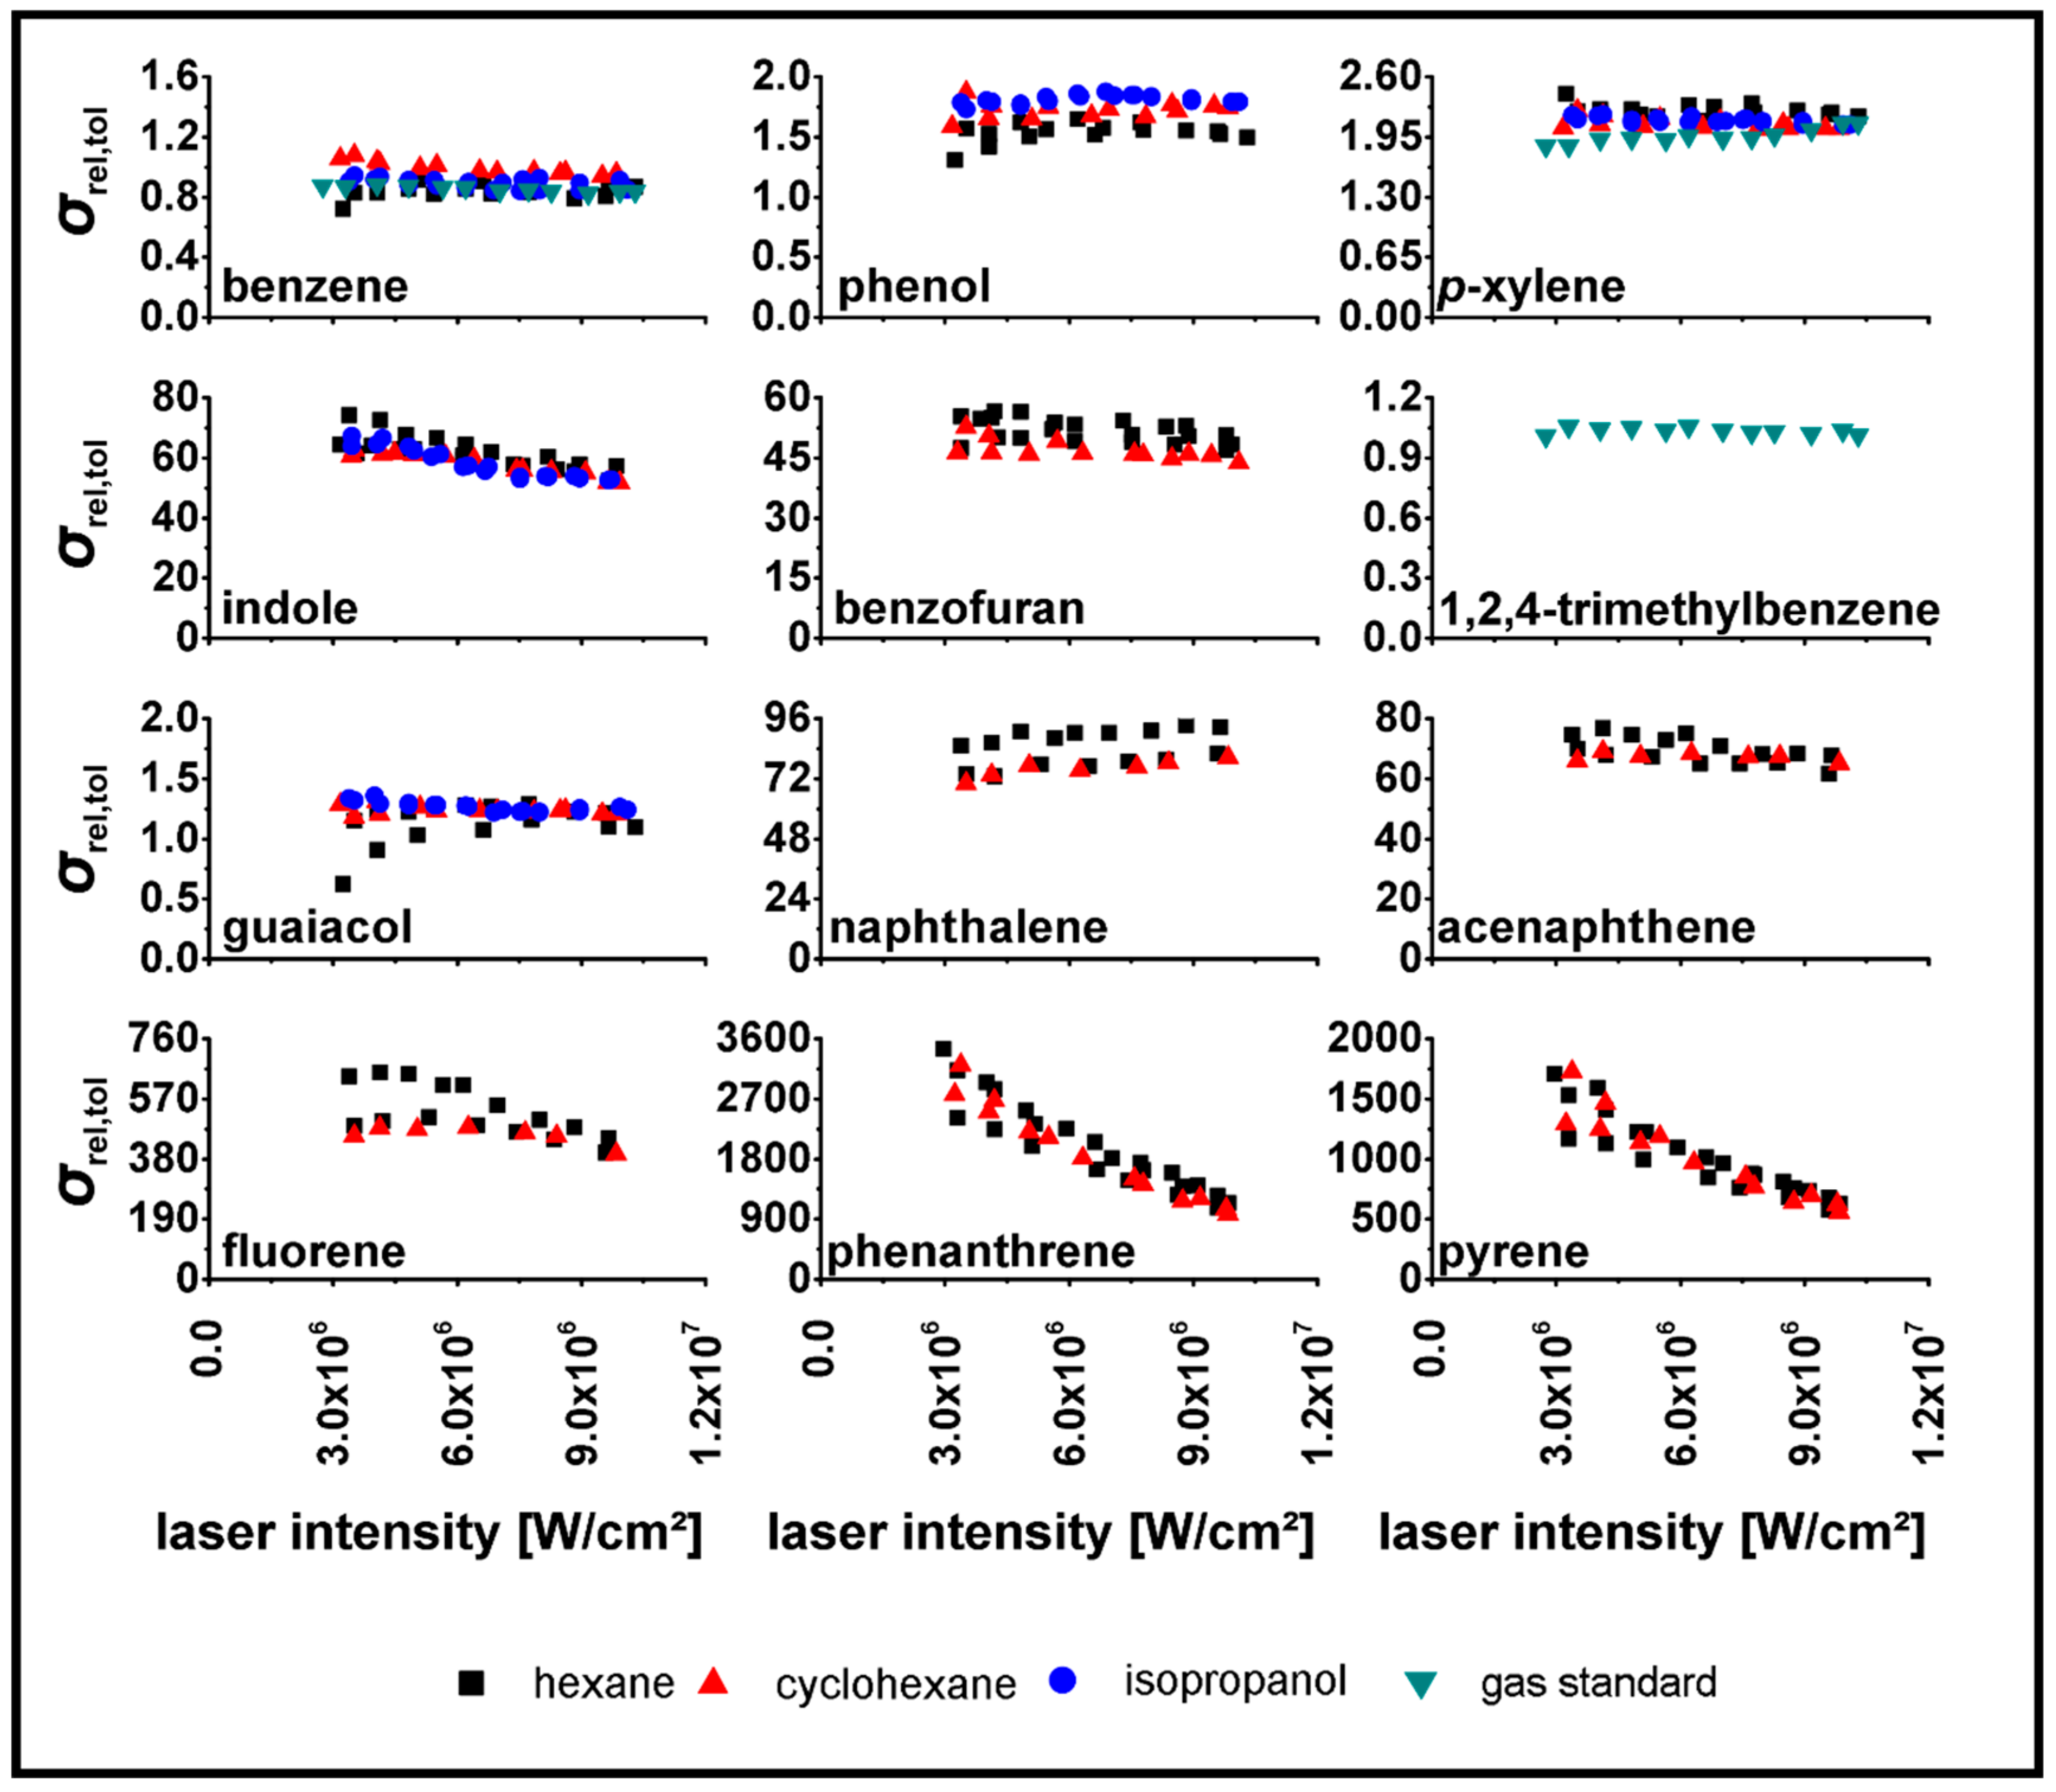
Results for 248 nm measurements are shown in Figure 7. Hereby, no laser intensities higher than 1.2 × 10⁷ W/cm2 were investigated. However, as expected, σ rel , tol of 248 nm and 266 nm showed significant differences in quantity, whereas similar intensity-dependent behaviors of σ rel , tol were observed. It has to be noted that σ rel , tol   are influenced by the wavelength-dependent ionization behavior of the analyte as well as the reference substance. The σ rel , tol of benzene at 248 nm was increased by a factor of 7 compared to that at 266 nm. Much higher σ rel , tol were achieved for PAHs, such as fluorene, phenanthrene, and pyrene. In contrast, the σ rel , tol for p-xylene, 1,2,4-trimethylbenzene, guaiacol, and phenol were lower compared to that at 266 nm.
An estimation of the differences in ionization efficiency between 266 nm and 248 nm can be accomplished by comparing the response factors of a single compound for both wavelengths (e.g., toluene is ionized three times better at 266 nm than at 248 nm). Therefore, it is possible to recalculate the relPICS at 248 nm, neglecting the influence of the wavelength-dependent ionization behavior of toluene. By doing this, benzene is ionized about 2.5 times better at 248 nm compared to 266 nm, whereas acenaphthene is ionized with approximately the same efficiency.

4. Discussion

The obtained results are in good agreement with general considerations based on UV-spectroscopic properties of these compounds given in Reference [33] and REMPI spectroscopic investigations presented in References [34,35,36]. For single-core aromatics, the most prominent transition into the excited state is S0 → S1. For benzene the origin of this S0 → S1 transition is symmetry forbidden and located at 262.5 nm. Only vibrationally-induced electronic transitions are allowed at 259.3 nm and 247.3 nm and can be assigned to the transition into the v6 and v1 modes. Herein, benzene showed the narrowest absorption bands of all the investigated aromatic species. These sharp absorption bands were broadened and shifted to longer wavelengths by the insertion of electron-donating substituents (e.g., –CH3, –OH, –OCH3). For example, the allowed S0 → S1 transitions of toluene and p-xylene were at 266.8 nm and 272.2 nm, respectively. Therefore, the ionization efficiencies for single-core aromatics (except benzene) were higher at 266 nm compared to those at 248 nm. Larger PAHs showed broadened absorption bands with a bathochromic shift (compared to benzene), whereas the density of electronic states increased with the number of condensed aromatic rings. Additionally, the energy of singlet states decreased. Therefore, transitions into higher states (S2, S3, etc.) are possible and much more stabilized. Consequently, PAHs showed higher ionization yields compared to single-core aromatics. The ionization rate was then determined by the second absorption step, leading to deviations from the quadratic intensity dependence [35]. Additionally, naphthalene and acenaphthene were ionized more efficiently at 266 nm (S0 → S2), while PAHs such as phenanthrene and pyrene showed increased ionization efficiencies at 248 nm (S0 → S3). Due to the lower ionization yield of toluene and the increased REMPI response, phenanthrene and pyrene showed very high σ rel , tol at 248 nm.
For measurements at 266 nm, the obtained σ rel , tol were in good agreement with previous results obtained using PITOF 2 (Table 1), which were verified by gas chromatographic (GC) measurements by Adam et al. [23]. In their study, the direct comparison of emission factors (obtained by REMPI-TOFMS or GC-MS) from different vehicle engines shows variations mostly below 10%. Though these results did not focus on intensity-dependent behavior, these σ rel , tol were successfully used in other studies [25,37].
In our study, laser intensities larger than 107 W/cm2 led to an increased fragmentation of all single-core aromatics and some PAHs (e.g., 1-methylnaphthalene and acenaphthene). The fundamental model (ladder-switching-model) of this fragmentation behavior was published by Dietz et al. [17]. Herein, due to the high photon density inside of the ionization volume, the initially produced ions absorbed more photons and were excited into higher ionic states. This additional input of energy eventually leds to fragmentation. For toluene, the tropylium ion (m/z 91) is a prominent fragment, which is produced by rearrangement of the deprotonated toluene ion [38]. The ratio between the tropylium ion and the molecular ion of toluene can be drawn upon to assess the hardness of the ionization process. In our measurements, the ratio of the signal intensities obtained at m/z = 91 and 92 was approximately 70% at 108 W/cm2. Other fragments (m/z 65, 51, and 39) of toluene were also observed at these high laser intensities and showed similarities to conventional electron ionization (EI) spectra [39]. Based on EI spectra, xylene and 1,2,4-trimethylbenzene produced fragments similar to those of toluene, especially in the lower m/z range. Since toluene was part of each standard solution, no satisfying discrimination between fragments originating from toluene, xylene, and 1,2,4-trimethylbenzene can be accomplished. Therefore, we only used the molecular ions to calculate the response factors of each compound. Additionally, this strategy is also more suitable for investigations of complex gas mixtures, since fragment ions of toluene (the reference substance) and analytes cannot be distinguished.
Fluorene, phenanthrene, and pyrene showed no fragmentation at elevated laser intensities, which was attributed to the stabilization of molecular ions by a high degree of freedom of higher conjugated π-systems [40,41]. Hence, saturation phenomena for phenanthrene and pyrene can be explained by the saturation of both absorption steps. Even though this is an interesting finding, it should be noted that such high laser intensities are not used in conventional REMPI-TOFMS experiments for the analysis of combustion processes or environmental monitoring. At moderate laser intensities (<107 W/cm2), REMPI is a very soft ionization technique, producing mostly molecular ions (for toluene: (m/z 91)/(m/z 92) < 15% at 5 × 10⁶ W/cm2).
Saturation phenomena can also explain the deviations from quadratic intensity dependence given by the formal intensity law. The intensity in some parts of the ionization volume may be high enough to induce saturation effects in one or both of the involved transitions. Therefore, the measured ionization yields are mixture of certain saturated and unsaturated proportions, resulting from geometrical effects of the laser beam [18,42]. In order to minimize the effect of the geometrical power density distribution of the laser beam, a top hat rather than a Gaussian laser profile may be used.
Absolute cross sections of toluene (σ1 = 6 × 10⁻¹⁸ cm2, σ2 = 2 × 10⁻¹⁷ cm2) at 266.8 nm were published by Boesl et al. [22]. Therefore, based on the REMPI spectra of toluene given by Weickhardt et al. [44] (recorded using a warm effusive molecular beam inlet similar to the setup in this study) and Carpentier et al. [34], the absolute REMPI cross section of toluene at 266 nm (approx. 45% of the cross section at 266.8 nm) and 248 nm (approx. 50% of the cross section at 266 nm) could be calculated. With these two-photon REMPI cross sections of toluene (σtol,266nm = 5.4 × 10⁻³⁵ cm4; σtol,248nm = 2.7 × 10⁻³⁵ cm4) and the σrel,tol determined in this work, an estimation of absolute two-photon ionization cross section of all investigated compounds could be carried out (Table 2). Absolute REMPI cross sections of single-core aromatics at 248 nm were lower than those obtained at 266 nm, which is in good agreement with the REMPI spectra presented in References [34,35,44]. For naphthalene, acenaphthene, and fluorene, a similar behavior would be expected. However, absolute REMPI cross sections were higher at 248 nm, which cannot be explained at this point and further studies are necessary. On the other hand, absolute REMPI cross sections for phenanthrene and pyrene were higher at 248 nm, as expected from the REMPI spectra. Phenanthrene showed the strongest REMPI response at ~250 nm, which was attributed to the S0 → S4 transition [45], resulting in the highest absolute REMPI cross section of all investigated compounds. In Table 2, ionization energies (IE) are also shown. (1 + 1) REMPI is only possible if the energy of two photons is higher than the IE. For all investigated analytes, the two-photon absorption at 266 nm and 248 nm (4.66 eV and 5 eV, respectively) exceeded the IE. Thus, absolute REMPI cross sections at 266 nm increased with decreasing IEs, although this trend is not applicable to explain ionization yields in REMPI. For effective REMPI processes, the lifetime of the excited state should be sufficiently long compared to the laser pulse duration, which was true for all of the compounds in this study.
The results of this study suggested that the principle of relPICS can be used for a system-independent quantification of PAHs in gaseous matrices. For single-core aromatics, the observed deviations of σ rel , tol between both systems were attributed to differences in UV laser generation. Preliminary results obtained with an additional REMPI-TOFMS at 266 nm (UV generation by the fourth harmonic generation of 1064 nm of Nd:YAG) for p-xylene and 1,2,4-trimethylbenzene confirmed the cross section values of these compounds, as determined by PITOF 2.

Author Contributions

R.Z. and T.S. conceived and designed the experiments; C.G. performed the experiments, analyzed the data, and wrote the paper with the input of all authors.

Funding

This research was funded by the German Research Foundation (DFG) grant number ZI 764/12-1.

Acknowledgments

We would like to thank Martin Sklorz (University of Rostock, Chair of Analytical Chemistry) and Robert Strehse (University of Rostock, Chair of Soil Science) for the theoretical and experimental support.

Conflicts of Interest

The authors declare no conflict of interest.

References

  1. Boesl, U.; Neusser, H.J.; Schlag, E.W. Two-photon spectroscopy in the gas phase: First excited state of naphthalene, 1B3u. Chem. Phys. 1976, 15, 167–178. [Google Scholar] [CrossRef]
  2. Boesl, U.; Neusser, H.J.; Schlag, E.W. Two Photon Ionization of Polyatomic Molecules in a Mass Spectrometer. Z. Naturforsch. 1978, 33, 1546–1548. [Google Scholar] [CrossRef]
  3. Boesl, U.; Neusser, H.J.; Schlag, E.W. Lifetime measurements of two-photon excited vibronic levels in the low pressure limit: Naphthalene. Chem. Phys. Lett. 1976, 42, 16–21. [Google Scholar] [CrossRef]
  4. Zimmermann, R. Laser ionisation mass spectrometry for on-line analysis of complex gas mixtures and combustion effluents. Anal. Bioanal. Chem. 2005, 381, 57–60. [Google Scholar] [CrossRef] [PubMed]
  5. Boesl, U.; Heger, H.J.; Zimmermann, R.; Nagel, H.; Püffel, P. Laser Mass Spectrometry in Trace Analysis. In Encyclopedia of Analytical Chemistry; Meyers, R.A., Ed.; John Wiley & Sons, Ltd.: Chichester, UK, 2006. [Google Scholar]
  6. Streibel, T.; Zimmermann, R. Resonance-enhanced multiphoton ionization mass spectrometry (REMPI-MS): Applications for process analysis. Annu. Rev. Anal. Chem. 2014, 7, 361–381. [Google Scholar] [CrossRef] [PubMed]
  7. Kohse-Höinghaus, K.; Schocker, A.; Kasper, T.; Kamphus, M.; Brockhinke, A. Combination of Laser- and Mass-Spectroscopic Techniques for the Investigation of Fuel-Rich Flames. Z. Phys. Chem. 2005, 219, 583–599. [Google Scholar] [CrossRef]
  8. Kamphus, M.; Braun-Unkhoff, M.; Kohse-Höinghaus, K. Formation of small PAHs in laminar premixed low-pressure propene and cyclopentene flames: Experiment and modeling. Combust. Flame 2008, 152, 28–59. [Google Scholar] [CrossRef] [Green Version]
  9. Ahrens, J.; Kovacs, R.; Shafranovskii, E.A.; Homann, K.H. On-line multi-photon ionization mass spectrometry applied to PAH and fullerenes in flames. Ber. Bunsengesellschaft für Physikalische Chemie 1994, 98, 265–268. [Google Scholar] [CrossRef]
  10. Ahrens, J.; Keller, A.; Kovacs, R.; Homann, K. Large molecules, radicals, ions, and small soot particles in fuel-rich hydrocarbon flames: Part III: REMPI mass spectrometry of large flame PAHs and fullerenes and their quantitative calibration through sublimation. Berichte Bunsenges. Phys. Chem. 1998, 102, 1823–1839. [Google Scholar] [CrossRef]
  11. Otto, S.; Streibel, T.; Erdmann, S.; Klingbeil, S.; Schulz-Bull, D.; Zimmermann, R. Pyrolysis–gas chromatography–mass spectrometry with electron-ionization or resonance-enhanced-multi-photon-ionization for characterization of polycyclic aromatic hydrocarbons in the Baltic Sea. Mar. Pollut. Bull. 2015, 99, 35–42. [Google Scholar] [CrossRef] [PubMed]
  12. Antonov, V.S.; Letokhov, V.S. Laser multiphoton and multistep photoionization of molecules and mass spectrometry. Appl. Phys. 1981, 24, 89–106. [Google Scholar] [CrossRef]
  13. Boesl, U.; Zimmermann, R.; Weickhardt, C.; Lenoir, D.; Schramm, K.W.; Kettrup, A.; Schlag, E.W. Resonance-enhanced multi-photon ionization: A species-selective ion source for analytical time-of-flight mass spectroscopy. Chemosphere 1994, 29, 1429–1440. [Google Scholar] [CrossRef]
  14. Boesl, U. Laser mass spectrometry for environmental and industrial chemical trace analysis. J. Mass Spectrom. 2000, 35, 289–304. [Google Scholar] [CrossRef]
  15. Zakheim, D.S.; Johnson, P.M. Rate equation modelling of molecular multiphoton ionization dynamics. Chem. Phys. 1980, 46, 263–272. [Google Scholar] [CrossRef]
  16. Letokhov, V.S.; Mishin, V.I.; Puretzky, A.A. Selective photoionization of atoms by laser radiation and its applications. Prog. Quantum Electron. 1979, 5, 139–203. [Google Scholar] [CrossRef]
  17. Dietz, W.; Neusser, H.J.; Boesl, U.; Schlag, E.W.; Lin, S.H. A model for multiphoton ionisation mass spectroscopy with application to benzene. Chem. Phys. 1982, 66, 105–127. [Google Scholar] [CrossRef]
  18. Brophy, J.H.; Rettner, C.T. Laser two-photon ionization of aniline in a molecular beam and the bulk gas phase. Chem. Phys. Lett. 1979, 67, 351–355. [Google Scholar] [CrossRef]
  19. Rettner, C.T.; Brophy, J.H. Resonance enhanced laser ionisation mass spectrometry of four aromatic molecules. Chem. Phys. 1981, 56, 53–61. [Google Scholar] [CrossRef]
  20. Reilly, J.P.; Kompa, K.L. Laser induced multiphoton ionization mass spectrum of benzene. J. Chem. Phys. 1980, 73, 5468. [Google Scholar] [CrossRef]
  21. Boesl, U.; Neusser, H.J.; Schlag, E.W. Visible and UV multiphoton ionization and fragmentation of polyatomic molecules. J. Chem. Phys. 1980, 72, 4327. [Google Scholar] [CrossRef]
  22. Boesl, U.; Neusser, H.J.; Schlag, E.W. Multi-photon ionization in the mass spectrometry of polyatomic molecules: Cross sections. Chem. Phys. 1981, 55, 193–204. [Google Scholar] [CrossRef]
  23. Adam, T.W.; Clairotte, M.; Streibel, T.; Elsasser, M.; Pommeres, A.; Manfredi, U.; Carriero, M.; Martini, G.; Sklorz, M.; Krasenbrink, A.; et al. Real-time analysis of aromatics in combustion engine exhaust by resonance-enhanced multiphoton ionisation time-of-flight mass spectrometry (REMPI-TOF-MS): A robust tool for chassis dynamometer testing. Anal. Bioanal. Chem. 2012, 404, 273–276. [Google Scholar] [CrossRef] [PubMed]
  24. Czech, H.; Schepler, C.; Klingbeil, S.; Ehlert, S.; Howell, J.; Zimmermann, R. Resolving Coffee Roasting-Degree Phases Based on the Analysis of Volatile Compounds in the Roasting Off-Gas by Photoionization Time-of-Flight Mass Spectrometry (PI-TOFMS) and Statistical Data Analysis: Toward a PI-TOFMS Roasting Model. J. Agric. Food Chem. 2016, 64, 5223–5231. [Google Scholar] [CrossRef] [PubMed]
  25. Radischat, C.; Sippula, O.; Stengel, B.; Klingbeil, S.; Sklorz, M.; Rabe, R.; Streibel, T.; Harndorf, H.; Zimmermann, R. Real-time analysis of organic compounds in ship engine aerosol emissions using resonance-enhanced multiphoton ionisation and proton transfer mass spectrometry. Anal. Bioanal. Chem. 2015, 407, 5939–5951. [Google Scholar] [CrossRef] [PubMed]
  26. Heger, H.J.; Zimmermann, R.; Dorfner, R.; Beckmann, M.; Griebel, H.; Kettrup, A.; Boesl, U. On-Line Emission Analysis of Polycyclic Aromatic Hydrocarbons down to pptv Concentration Levels in the Flue Gas of an Incineration Pilot Plant with a Mobile Resonance-Enhanced Multiphoton Ionization Time-of-Flight Mass Spectrometer. Anal. Chem. 1999, 71, 46–57. [Google Scholar] [CrossRef] [PubMed]
  27. Oser, H.; Coggiola, M.J.; Young, S.E.; Crosley, D.R.; Hafer, V.; Grist, G. Membrane introduction/laser photoionization time-of-flight mass spectrometry. Chemosphere 2007, 67, 1701–1708. [Google Scholar] [CrossRef] [PubMed]
  28. Soni, M.H.; Baronavski, A.P.; McElvany, S.W. Trace analysis of polyaromatic hydrocarbons in water using multiphoton ionization-membrane introduction mass spectrometry. Rapid Commun. Mass Spectrom. 1998, 12, 1635–1638. [Google Scholar] [CrossRef]
  29. Gehm, C.; Streibel, T.; Passig, J.; Schulz-Bull, D.; Zimmermann, R. Development and optimization of a membrane introduction photoionization mass spectrometer for the real time analysis of (poly)aromatic compounds in aquatic systems. Rapid Commun. Mass Spectrom. 2018. Submitted. [Google Scholar]
  30. Kruth, C.; Czech, H.; Sklorz, M.; Passig, J.; Ehlert, S.; Cappiello, A.; Zimmermann, R. Direct Infusion Resonance-Enhanced Multiphoton Ionization Mass Spectrometry of Liquid Samples under Vacuum Conditions. Anal. Chem. 2017, 89, 10917–10923. [Google Scholar] [CrossRef] [PubMed]
  31. Passig, J.; Schade, J.; Oster, M.; Fuchs, M.; Ehlert, S.; Jäger, C.; Sklorz, M.; Zimmermann, R. Aerosol Mass Spectrometer for Simultaneous Detection of Polyaromatic Hydrocarbons and Inorganic Components from Individual Particles. Anal. Chem. 2017, 89, 6341–6345. [Google Scholar] [CrossRef] [PubMed]
  32. Mühlberger, F.; Hafner, K.; Kaesdorf, S.; Ferge, T.; Zimmermann, R. Comprehensive On-Line Characterization of Complex Gas Mixtures by Quasi-Simultaneous Resonance-Enhanced Multiphoton Ionization, Vacuum-UV Single-Photon Ionization, and Electron Impact Ionization in a Time-of-Flight Mass Spectrometer: Setup and Instrument Characterization. Anal. Chem. 2004, 76, 6753–6764. [Google Scholar] [CrossRef] [PubMed]
  33. Etzkorn, T.; Klotz, B.; Sørensen, S.; Patroescu, I.V.; Barnes, I.; Becker, K.H.; Platt, U. Gas-phase absorption cross sections of 24 monocyclic aromatic hydrocarbons in the UV and IR spectral ranges. Atmos. Environ. 1999, 33, 525–540. [Google Scholar] [CrossRef]
  34. Carpentier, Y.; Pino, T.; Bréchignac, P. R2PI Spectroscopy of Aromatic Molecules Produced in an Ethylene-Rich Flame. J. Phys. Chem. A 2013, 117, 10092–10104. [Google Scholar] [CrossRef] [PubMed]
  35. Haefliger, O.P.; Zenobi, R. Laser mass spectrometric analysis of polycyclic aromatic hydrocarbons with wide wavelength range laser multiphoton ionization spectroscopy. Anal. Chem. 1998, 70, 2660–2665. [Google Scholar] [CrossRef] [PubMed]
  36. Boesl, U. Multiphoton excitation and mass-selective ion detection for neutral and ion spectroscopy. J. Phys. Chem. 1991, 95, 2949–2962. [Google Scholar] [CrossRef]
  37. Sippula, O.; Stengel, B.; Sklorz, M.; Streibel, T.; Rabe, R.; Orasche, J.; Lintelmann, J.; Michalke, B.; Abbaszade, G.; Radischat, C.; et al. Particle emissions from a marine engine: Chemical composition and aromatic emission profiles under various operating conditions. Environ. Sci. Technol. 2014, 48, 11721–11729. [Google Scholar] [CrossRef] [PubMed]
  38. Opsal, R.B.; Reilly, J.P. Ionization of alkylbenzenes studied by gas chromatography/laser ionization mass spectrometry. Anal. Chem. 2002, 60, 1060–1065. [Google Scholar] [CrossRef]
  39. Linstrom, P.J.; Mallard, W.G. (Eds.) NIST Chemistry WebBook, NIST Standard Reference Database Number 69. Available online: http://webbook.nist.gov (accessed on 1 August 2018).
  40. Ławicki, A.; Holm, A.I.S.; Rousseau, P.; Capron, M.; Maisonny, R.; Maclot, S.; Seitz, F.; Johansson, H.A.B.; Rosén, S.; Schmidt, H.T.; et al. Multiple ionization and fragmentation of isolated pyrene and coronene molecules in collision with ions. Phys. Rev. A 2011, 83, 22704. [Google Scholar] [CrossRef]
  41. Gotkis, Y.; Oleinikova, M.; Naor, M.; Lifshitz, C. Time-dependent mass spectra and breakdown graphs. 17. Naphthalene and phenanthrene. J. Phys. Chem. 1993, 97, 12282–12290. [Google Scholar] [CrossRef]
  42. Speiser, S.; Jortner, J. The power law for high order multiphoton processes. Chem. Phys. Lett. 1976, 44, 399–403. [Google Scholar] [CrossRef]
  43. Dufour, A.; Weng, J.; Jia, L.; Tang, X.; Sirjean, B.; Fournet, R.; Le Gall, H.; Brosse, N.; Billaud, F.; Mauviel, G.; et al. Revealing the chemistry of biomass pyrolysis by means of tunable synchrotron photoionisation-mass spectrometry. RSC Adv. 2013, 3, 4786–4792. [Google Scholar] [CrossRef]
  44. Weickhardt, C.; Boesl, U.; Schlag, E.W. Laser Mass Spectrometry for Time-Resolved Multicomponent Analysis of Exhaust Gas. Anal. Chem. 2002, 66, 1062–1069. [Google Scholar] [CrossRef]
  45. Salama, F.; Joblin, C.; Allamandola, L.J. Electronic absorption spectroscopy of matrix-isolated polycyclic aromatic hydrocarbon cations. II. The phenanthrene cation (C14H10+) and its 1-methyl derivative. J. Chem. Phys. 1998, 101, 10252–10262. [Google Scholar] [CrossRef]
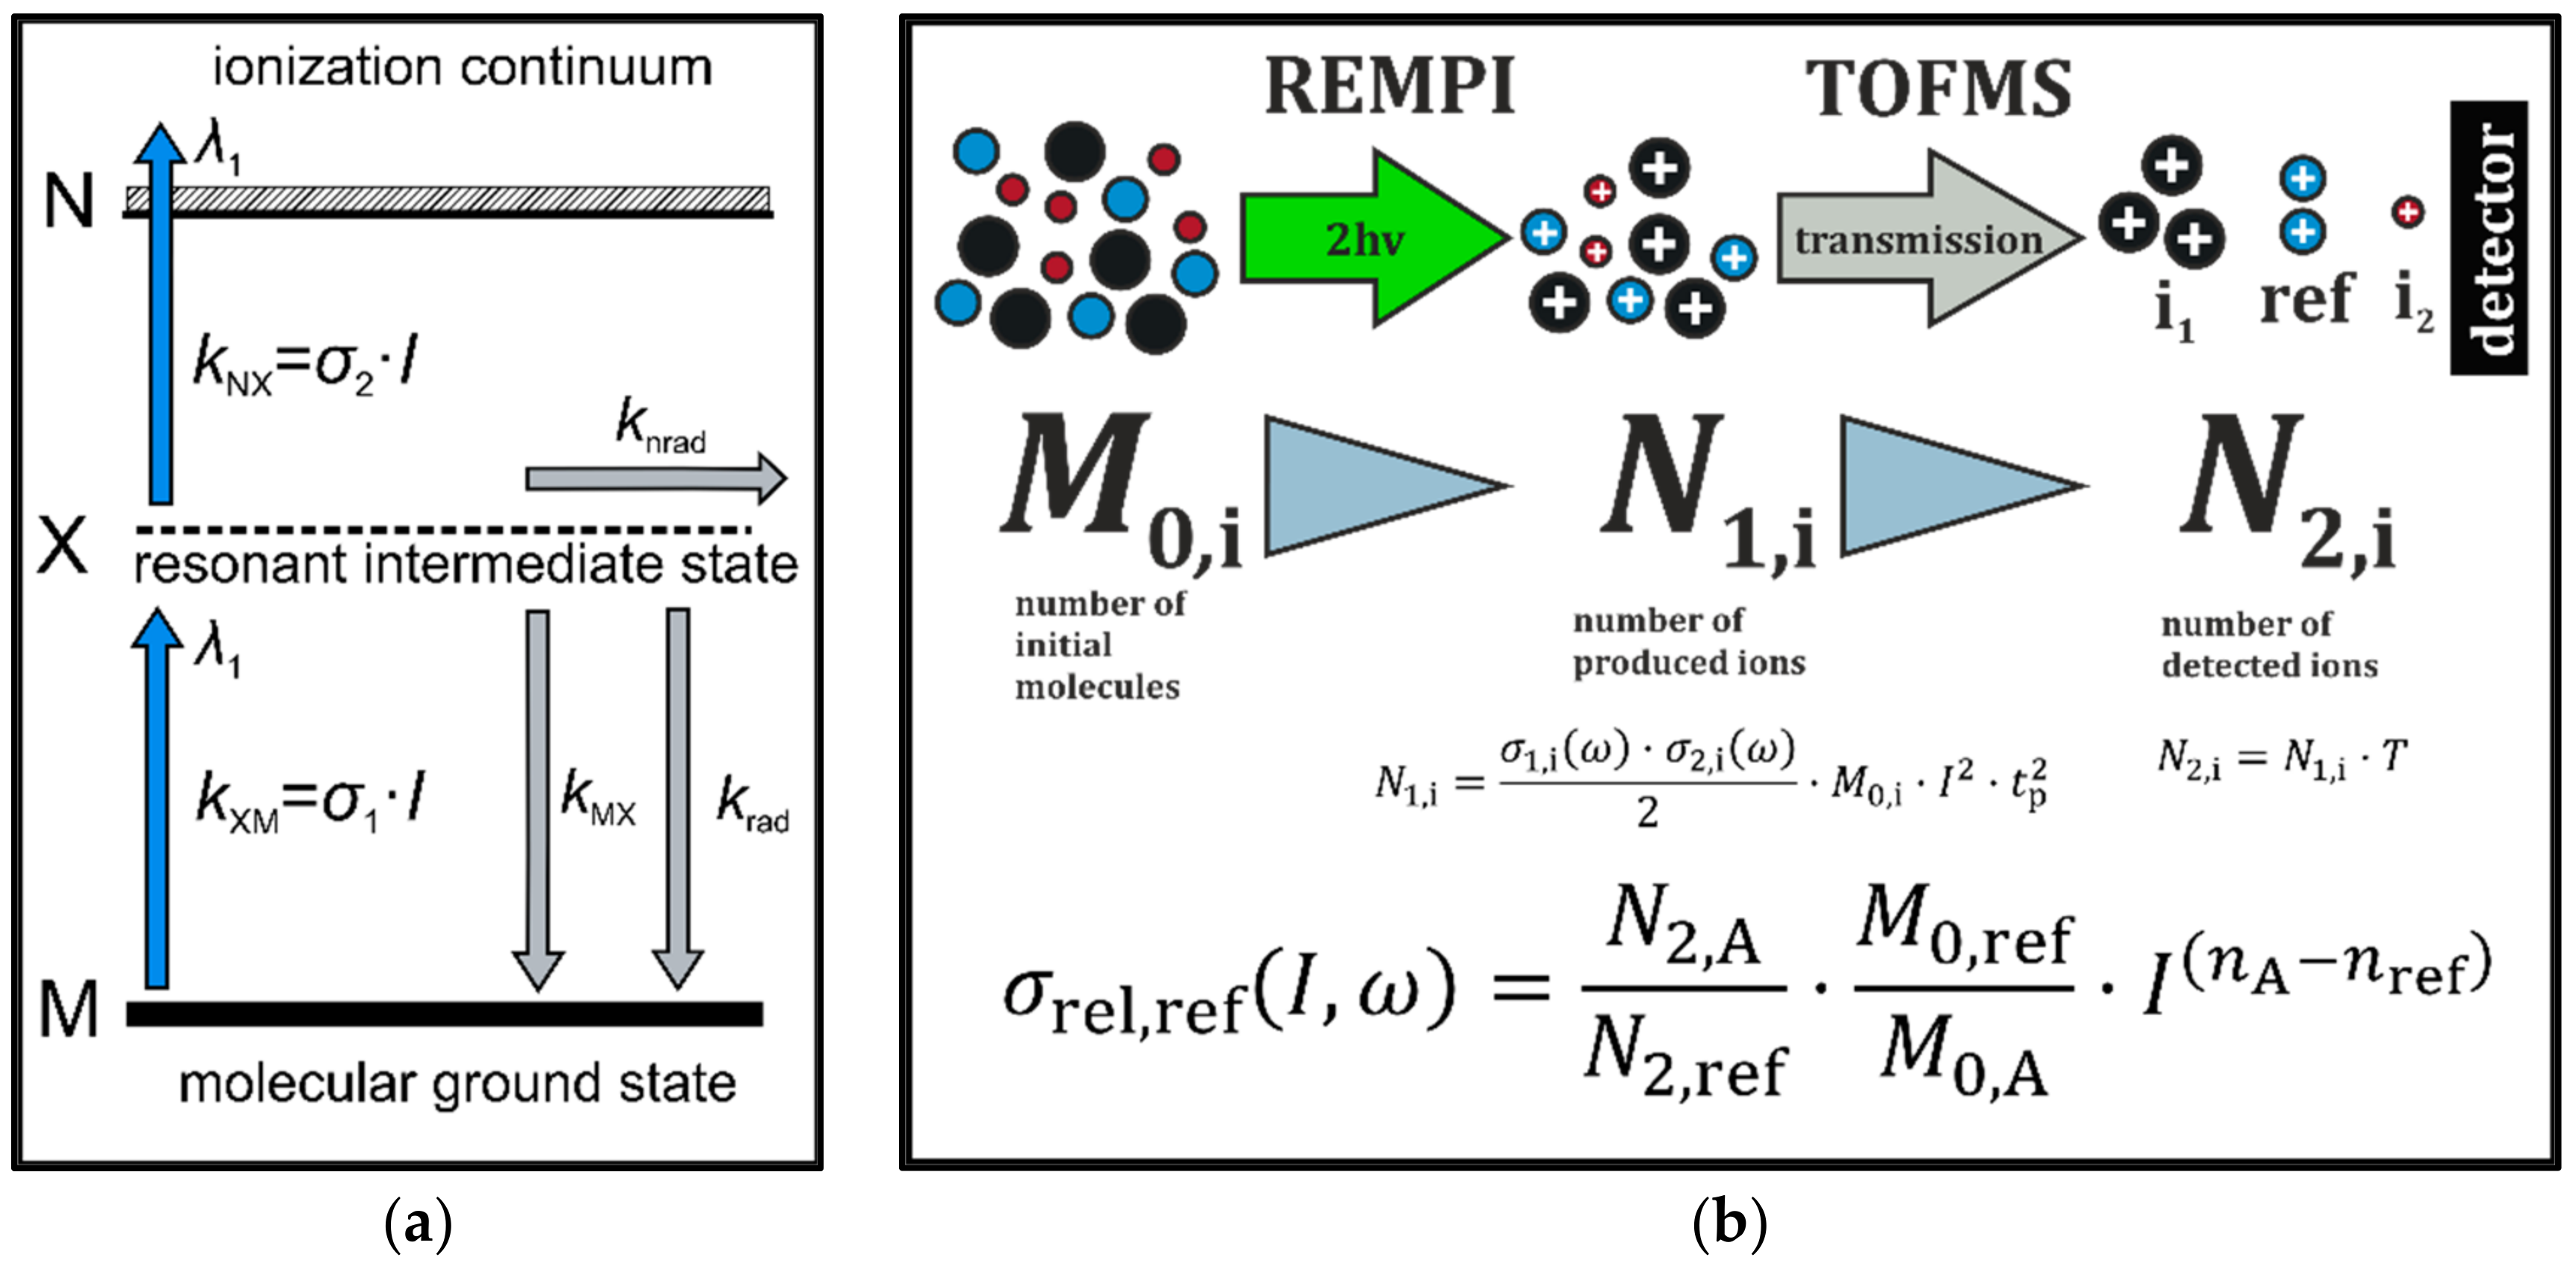
Figure 1. (a) Ionization scheme of (1 + 1) one-color resonance enhanced multiphoton ionization (REMPI) (λi—wavelength; ki—rate constant of the transition; σ 1 , 2 —photoabsorption/photoionization cross section; I—laser intensity; nrad—non-radiational decay; rad—radiational decay). (b) Simplified model for relative photoionization cross sections for REMPI-time-of-flight mass spectrometry (TOFMS); ions (N1,i) of the molecules (M0,i) are formed by REMPI and are guided through the TOFMS with a distinct transmission (T). Relative photoionization cross sections (relPICS) are calculated by dividing the amount of detected ions for a given number of initial molecules of a single compound by the ratio of detected ions and initial molecules of the reference substance.
Applsci 08 01617 g001
Figure 2. (a) Experimental setup of the sample introduction system for (semi-)volatile organic compounds; standard solutions, containing known amounts of compounds, are introduced into a nebulizer via syringe pump and sprayed into a heated glass chamber. The evaporated analytes are transferred via a heated transfer line into the ion source of the mass spectrometer. (b) Photograph of the introduction system.
Applsci 08 01617 g002
Figure 3. Evaluation of the sample inlet system. (a) Comparison of theoretical (calculation based on Equation (6); dotted lines) and experimental (symbols) toluene concentrations for different sample flow rates as a function of nitrogen flux. (b) Signal response and stability for selected single-core aromatics and polycyclic aromatic hydrocarbons (PAHs) at different sample flow rates.
Applsci 08 01617 g003
Figure 4. Intensity-dependent REMPI response of selected aromatic and polycyclic aromatic compounds; values on the left side correspond to a lens position of 3.5 cm relative to the focal point, whereas data points on the right side were determined at the focus position. The slope of the regression line is given for each compound; similar values for the analytes compared to toluene (reference) result in constant relPICS over a wide intensity range.
Applsci 08 01617 g004
Figure 5. Relative REMPI cross sections ( σ rel , tol ; toluene was used as a reference substance) at 266 nm (a) obtained by PITOF 1; (b) obtained by PITOF 2. Clear intensity-dependent trends of σ rel , tol of PAHs were obtained, whereas for small aromatic compound constant values of σ rel , tol were determined. For 1,2,4-trimethylbenzene, only data of the gas standard were available.
Applsci 08 01617 g005
Figure 6. Relative REMPI cross sections ( σ rel , tol ; toluene was used as a reference substance) at 266 nm for benzene and p-xylene of different datasets: (a) dataset A; (b) dataset B (for benzene, no data were available at high intensities).
Applsci 08 01617 g006
Figure 7. Relative REMPI cross sections ( σ rel , tol ; toluene was used as a reference substance) at 248 nm. For 1,2,4-trimethylbenzene, only data of the gas standard were available.
Applsci 08 01617 g007
Table 1. Overview of relative REMPI cross sections ( σ rel , tol ; toluene was used as a reference substance) at 266 nm and 248 nm obtained using different mass spectrometric systems.
Substance σ rel , tol
m/zPITOF 1
(266 nm)
PITOF 2
(266 nm)
PITOF 2 Used in Reference [17] (266 nm)PITOF 1
(248 nm)
benzene780.11 * (0,15 *)0.05 *0.060.91 * (0.86 *)
phenol943.6 *-1.661.70
o-xylene1062.0 *-2.1-
p-xylene1062.5 * (2.4 *)3.0*2.3 * (3.1 *)2.2 * (1.96 *)
indole11732.2–40.7-31.151.8–74.2
benzofuran11815.0–18.1-13.649.3
1,2,4-trimethylbenzene120(2.6 *)(5.8 *)(5.13 *)(1.03 *)
guaiacol1244.9–8.56.5–7.95.451.2 *
naphthalene12813.8–21.422.925.559.4–93.3
1-methylnaphthalene1429.0–20-24.1-
acenaphthene1546.8–21.6-28.540.4–76.8
fluorene16621.3–75.054.2–61.086.8270–654
phenanthrene17811.5–16399.4–144179976–3451
pyrene20214.0–223130–207196555–1730
* Averaged values; values in brackets are obtained from measurements of the gas standard.
Table 2. Overview of absolute REMPI cross sections at 266 nm and 248 nm.
SubstanceIonization Energy (eV)Absolute REMPI Cross Sections at 266 nm (cm4)
(I = 3 × 10⁶ W/cm2)
Absolute REMPI Cross Sections at 248 nm (cm4)
(I = 6 × 10⁶ W/cm2)
toluene8.83 a5.4 × 10−352.7 × 10⁻³⁵
benzene9.24 a4.9 × 10−362.4 × 10⁻³⁵
phenol8.49 a1.9 × 10−344.6 × 10⁻³⁵
o-xylene8.56 a1.1 × 10−34n.d.
p-xylene8.44 a1.5 ×10−345.7 × 10⁻³⁵
indole7.76 a1.8 × 10−331.6 × 10⁻³³
benzofuran8.36 a9.1 × 10−341.3 × 10⁻³³
1,2,4-trimethylbenzene8.27 a2.3 × 10−342.8 × 10⁻³⁵
guaiacol7,99 b3.9 × 10−343.2 × 10⁻³⁵
naphthalene8.14 a1.1 × 10−332.2 × 10⁻³³
1-methylnaphthalene7.96 a9.8 × 10−34n.d.
acenaphthene7.75 a7.7 × 10−341.8 × 10⁻³³
fluorene7.91 a2.8 × 10−331.4 × 10⁻³²
phenanthrene7,89 a4.4 × 10−337.9 × 10⁻³²
pyrene7.43 a6.1 × 10−332.8 × 10⁻³²
n.d.: not determined a: [39] b: [43].