A Spatial Pyramid Pooling-Based Deep Convolutional Neural Network for the Classification of Electrocardiogram Beats


Abstract
1. Introduction
1.1. Present Situation for Electrocardiogram Pattern Recognition
1.2. Computer-Aided Method for Pattern Recognition and Preprocessing of Heartbeat Signals
1.3. Feature Extraction Method for an ECG
1.4. CNN and Spatial Pyramid Pooling (SPP)-Net for Pattern Recognition
1.5. Goal and Arrangement of This Paper
2. Method
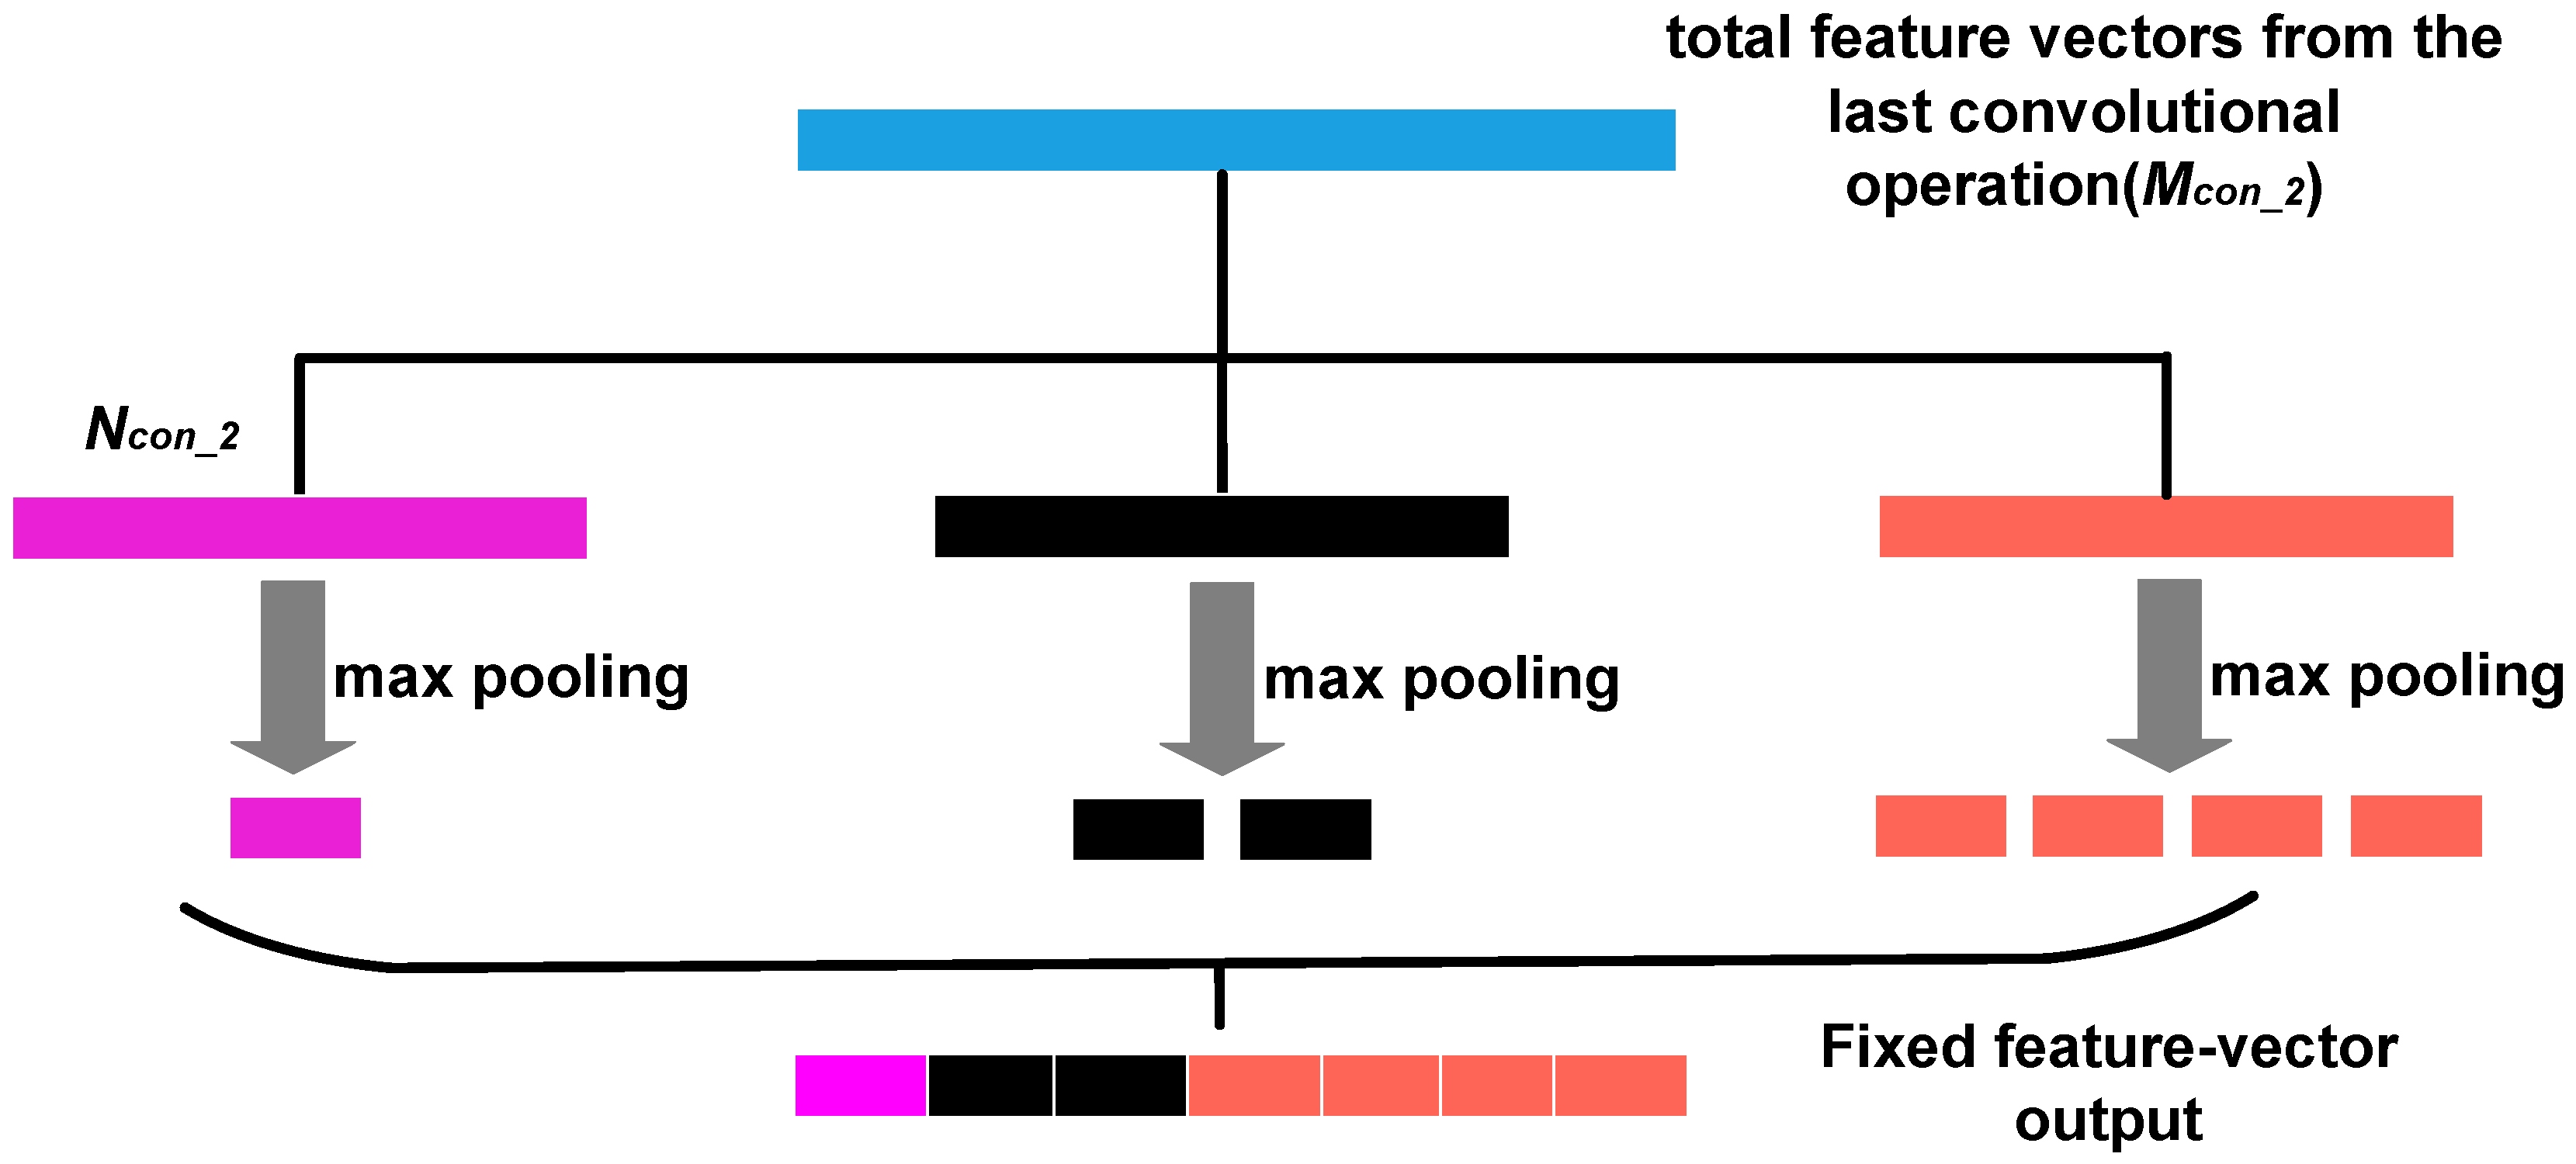
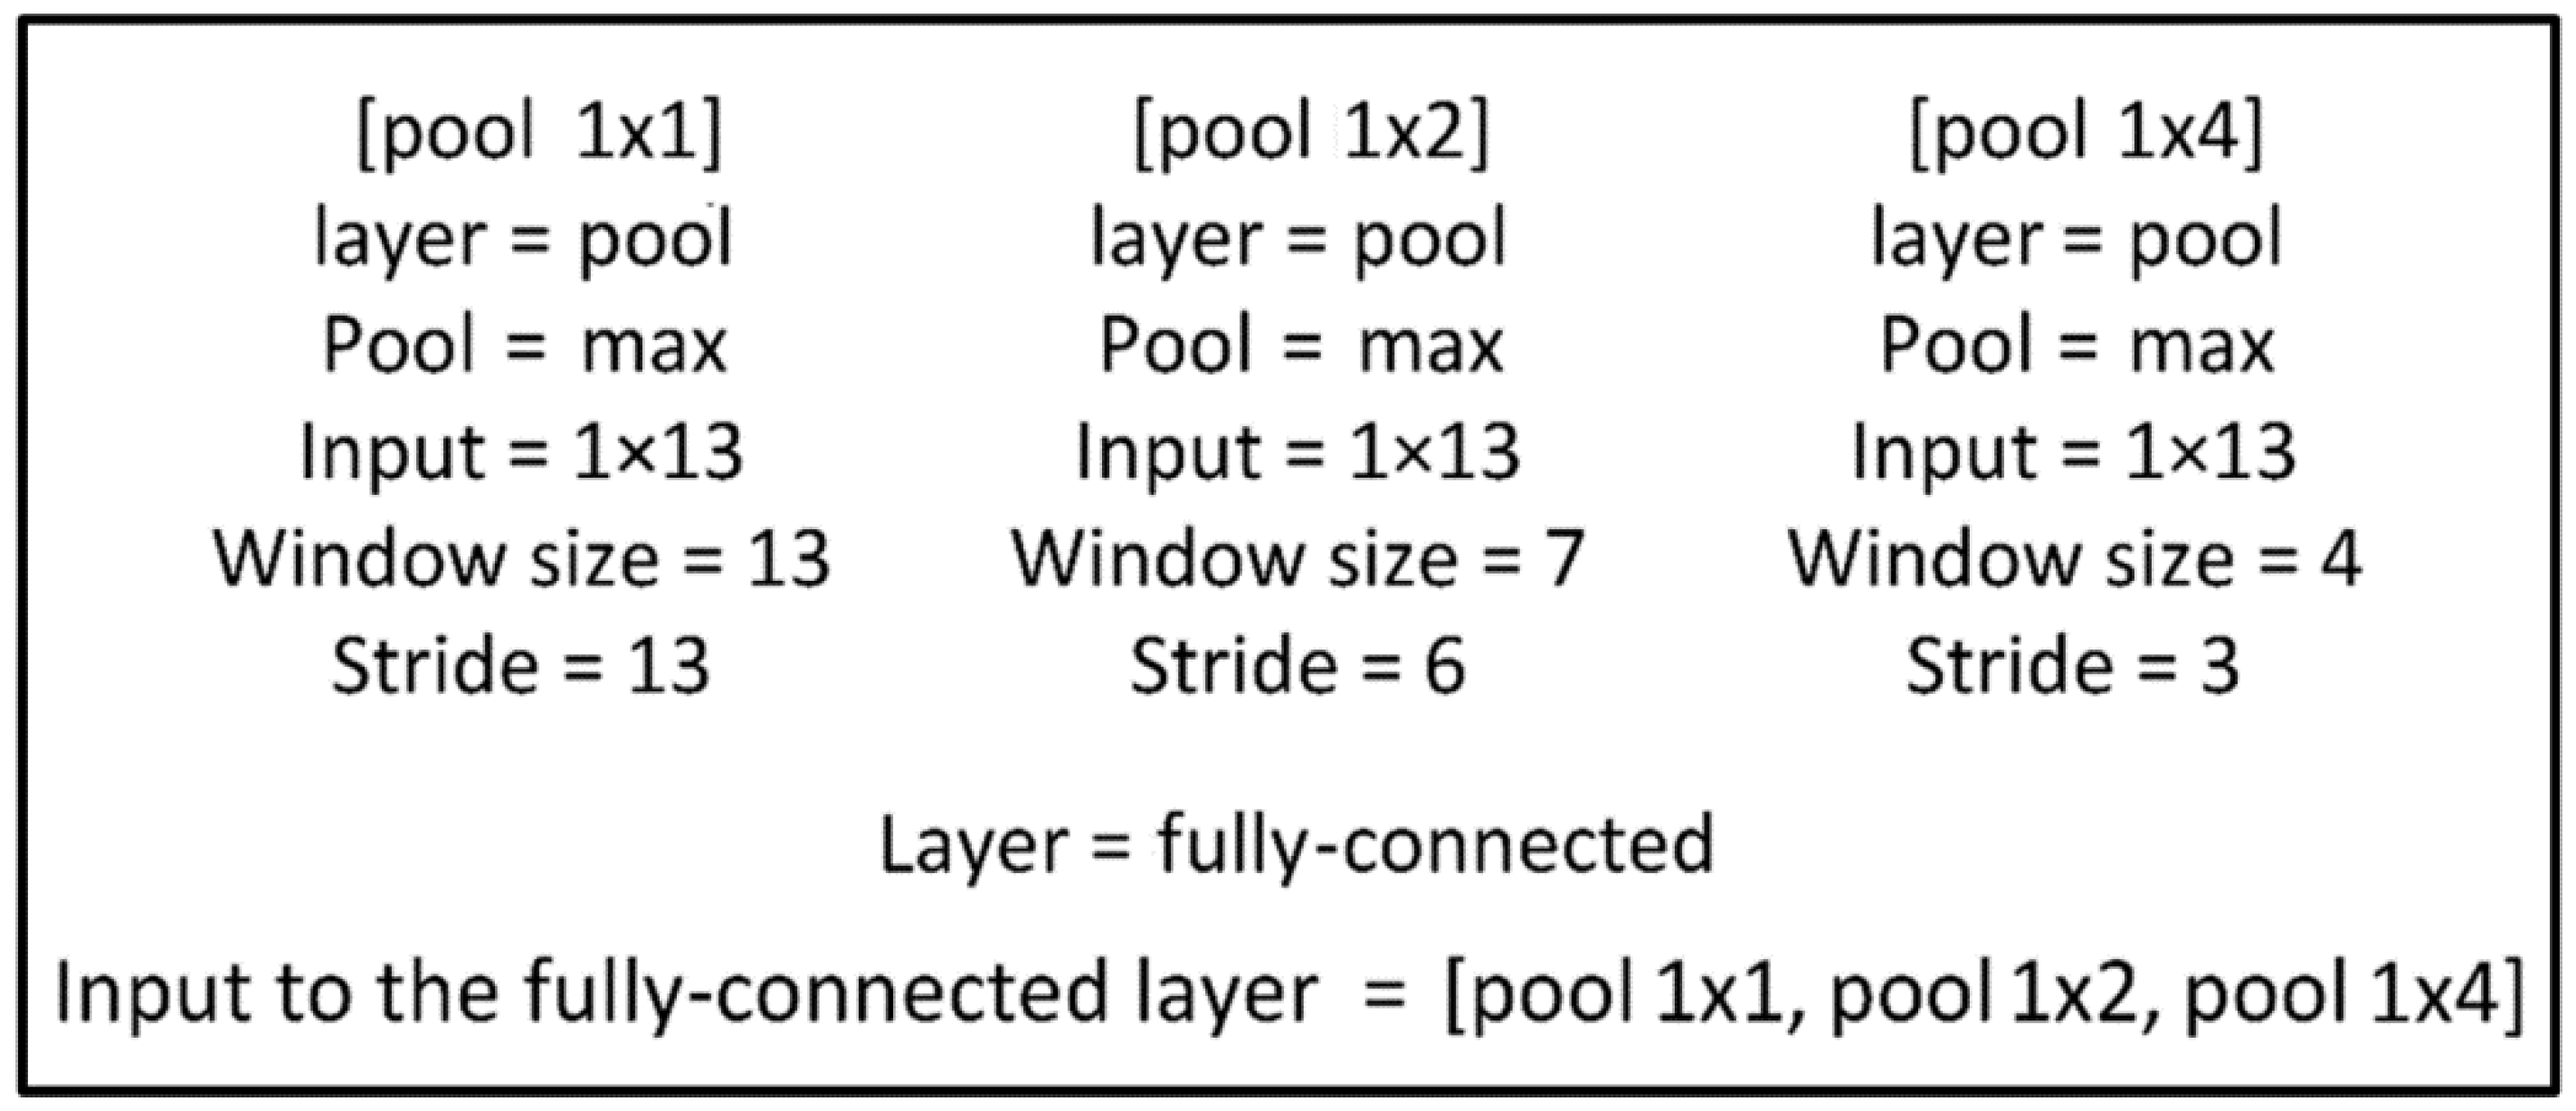
2.1. Spatial Pyramid Pooling Method
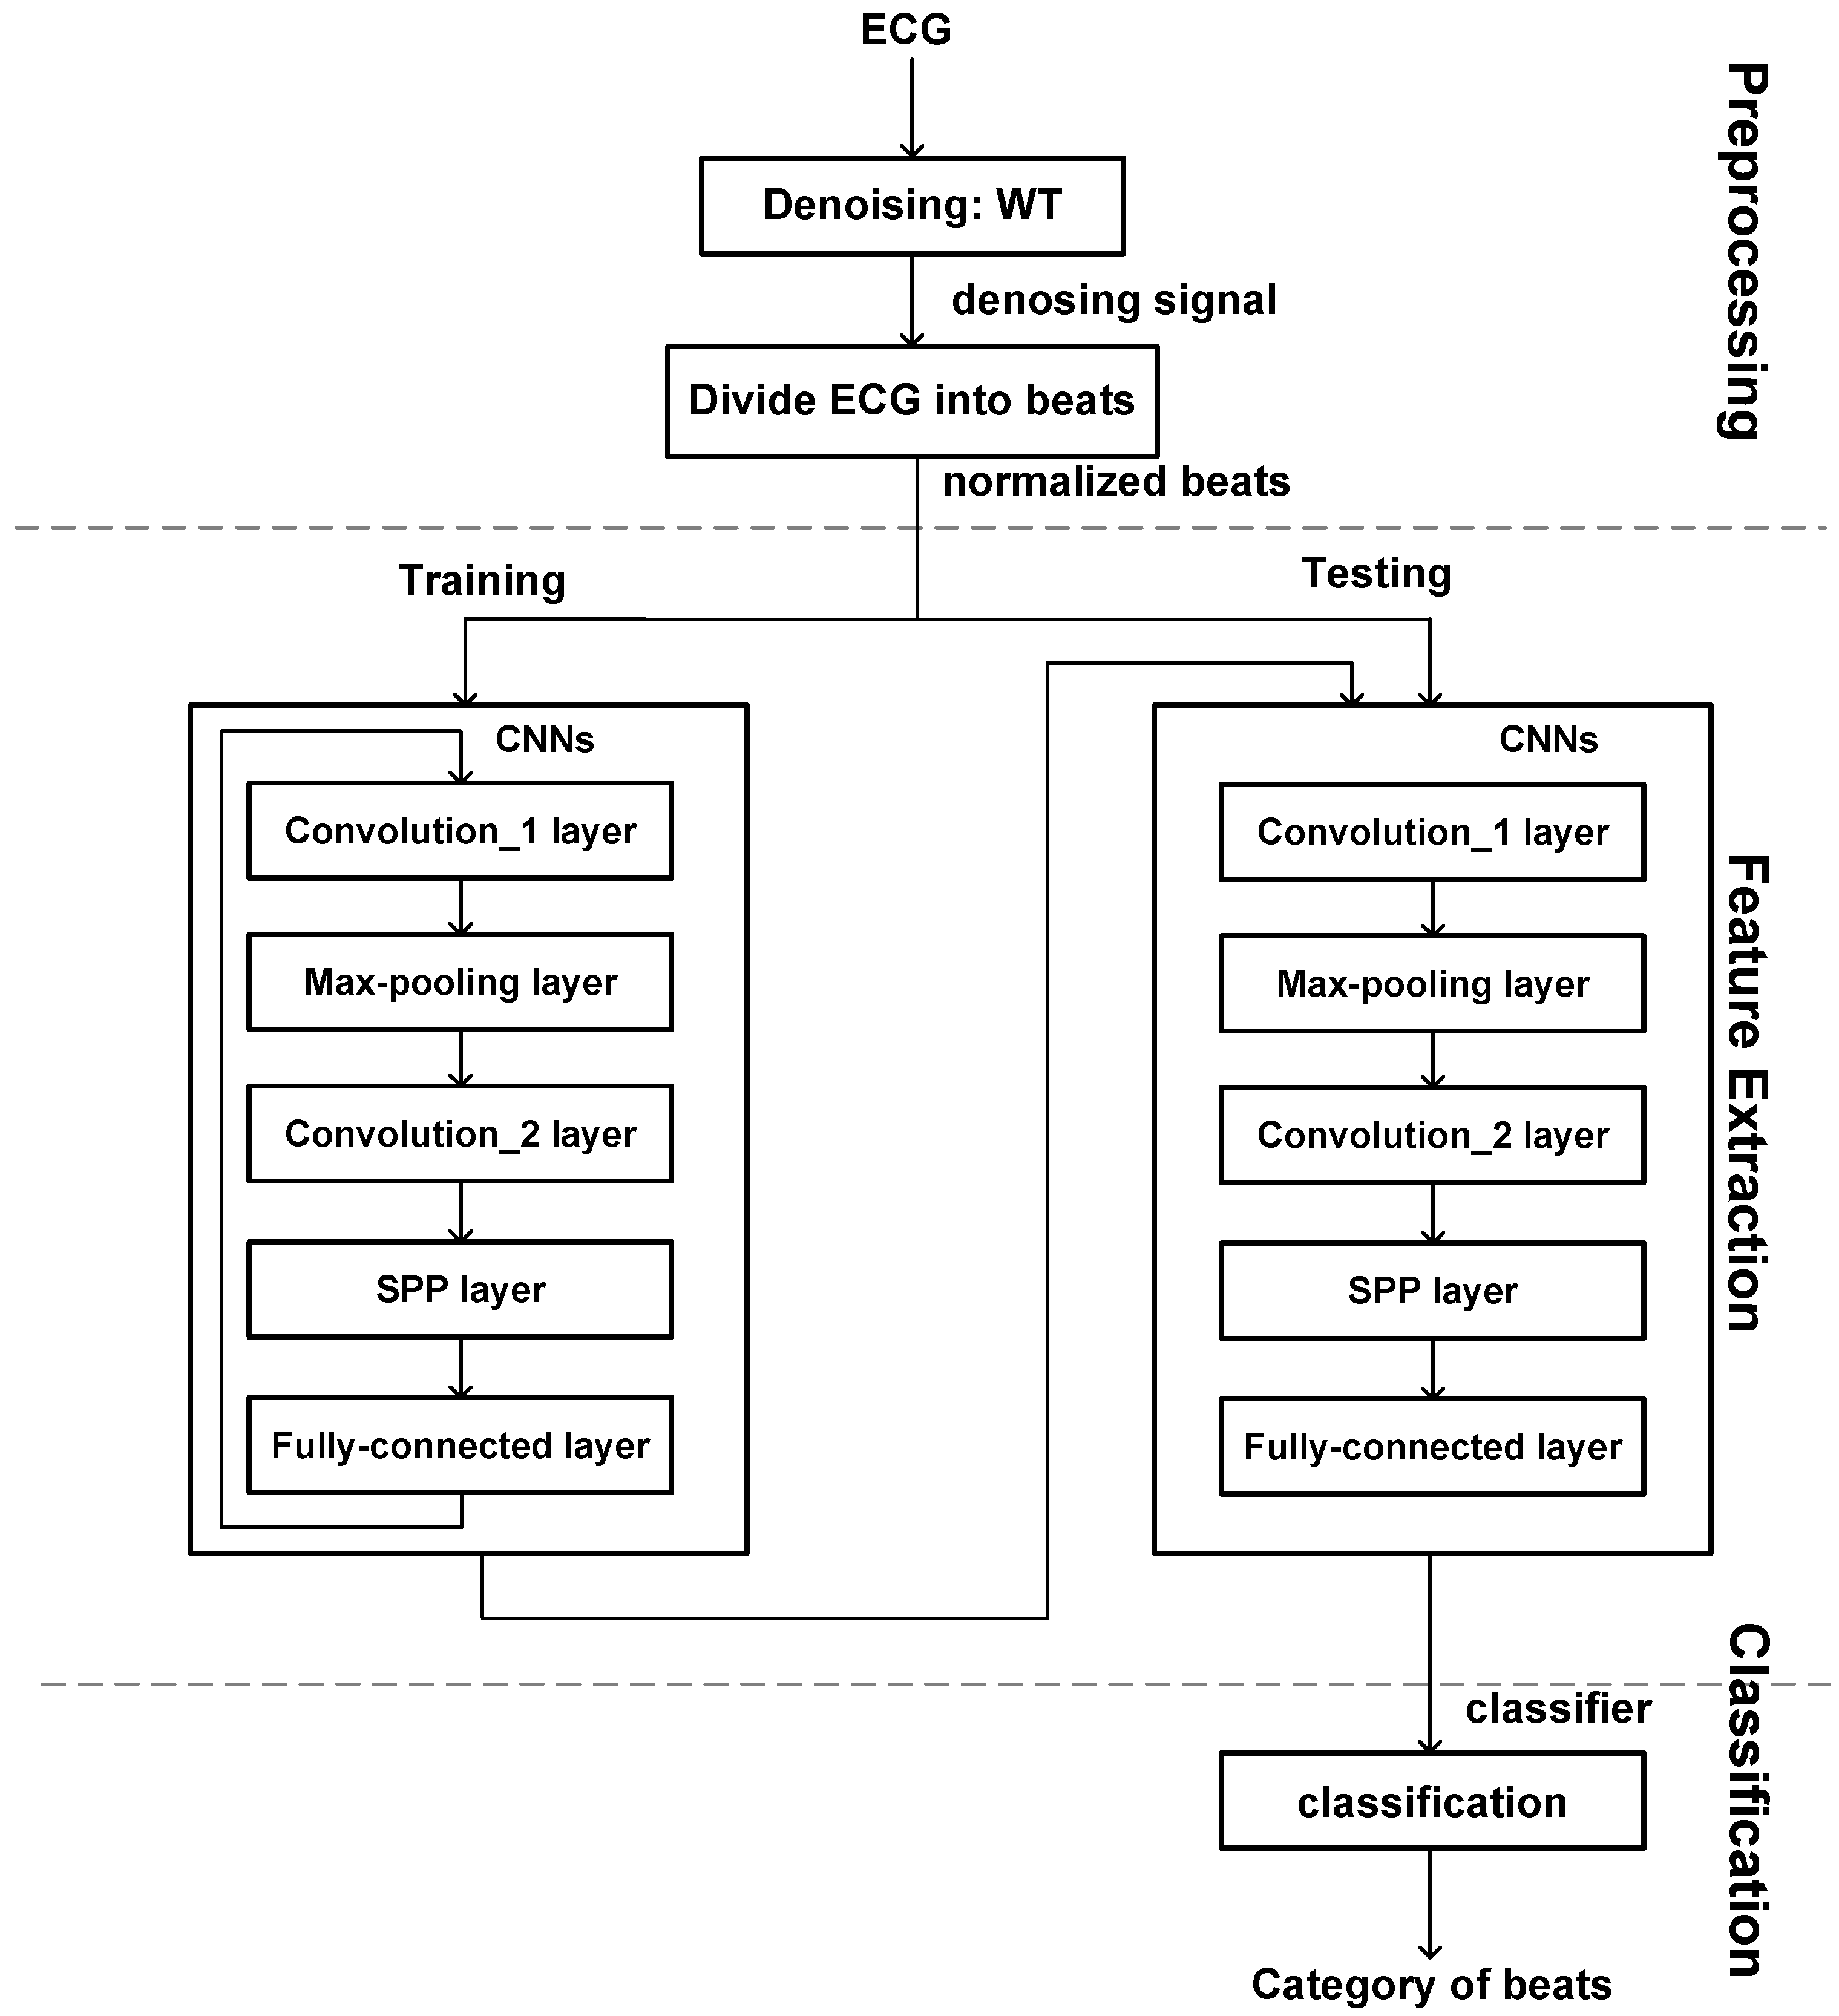
2.2. Electrocardiogram-Spatial Pyramid Pooling-Net Method
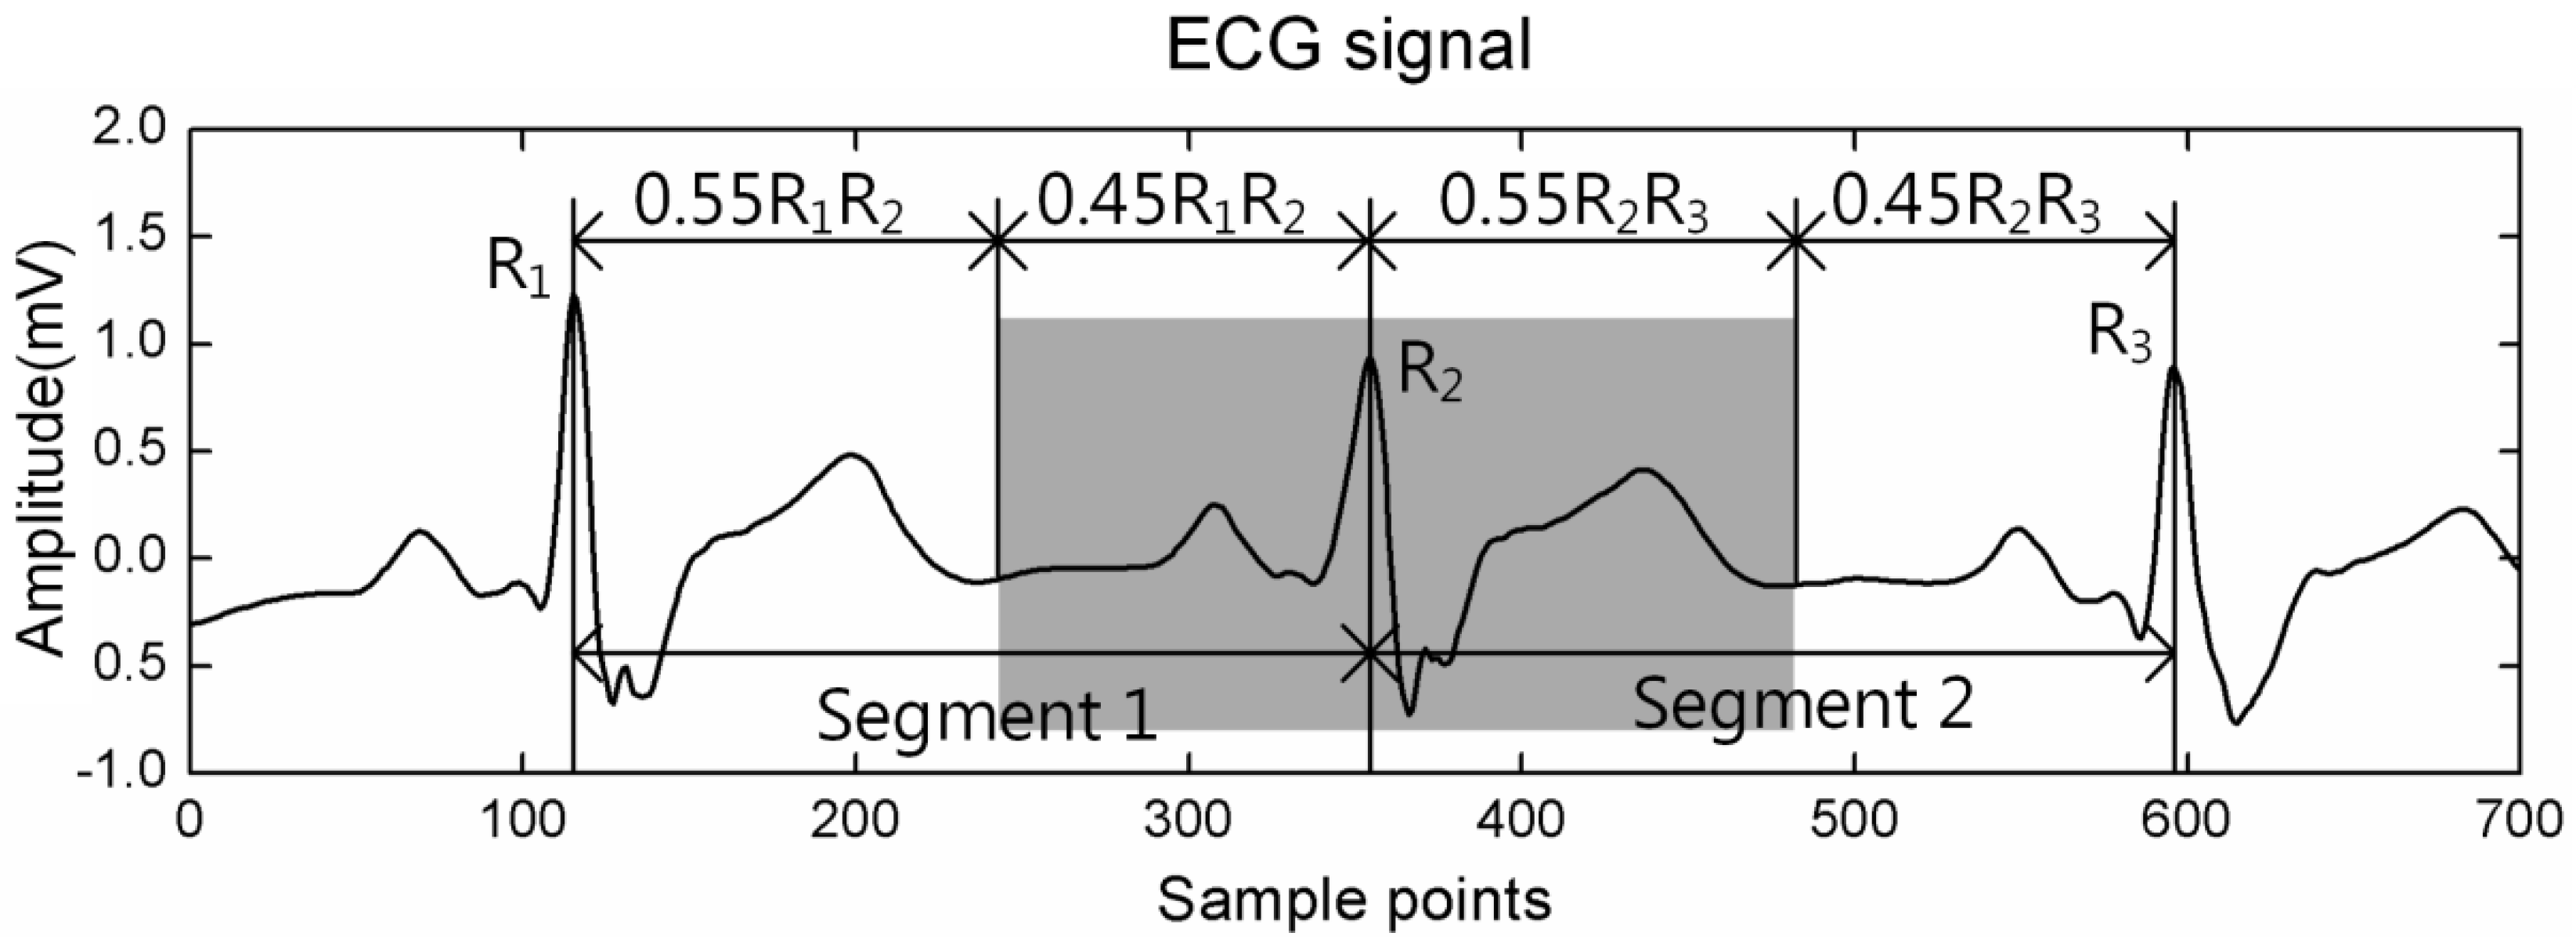
2.3. Pre-Processing
2.4. Feature Extraction
2.5. Classifier
2.6. Experimental Setting
3. Results and Analysis
4. Discussion
5. Conclusions
Author Contributions
Funding
Conflicts of Interest
References
- Kiranyaz, S.; Ince, T.; Gabbouj, M. Real-time patient-specific ECG classification by 1-D convolutional neural networks. IEEE Trans. Biomed. Eng. 2016, 63, 664–675. [Google Scholar] [CrossRef] [PubMed]
- Ma, J.; Dong, M. R&D of versatile distributed e-home healthcare system for cardiovascular disease monitoring and diagnosis. In Proceedings of the IEEE-EMBS International Conference on Biomedical and Health Informatics (BHI), Valencia, Spain, 1–4 June 2014; pp. 444–447. [Google Scholar]
- Shen, C.; Kao, W.; Yang, Y.; Hsu, M.; Wu, Y.; Lai, F. Detection of cardiac arrhythmia in electrocardiograms using adaptive feature extraction and modified support vector machines. Expert Syst. Appl. 2012, 39, 7845–7852. [Google Scholar] [CrossRef]
- Sharma, S.; Nagal, D. Identification of QRS complexes in single-lead ECG Using LS-SVM. In Proceedings of the International Conference on Recent Advances and Innovations in Engineering (ICRAIE-2014), Jaipur, India, 25 September 2014; pp. 1–4. [Google Scholar]
- Fei, S.W. Diagnostic study on arrhythmia cordis based on particle swarm optimization-based support vector machine. Expert Syst. Appl. 2010, 37, 6748–6752. [Google Scholar] [CrossRef]
- Gui, X.; Han, L.; Guo, S. An ECG fuzzy classification method based on adaptive PSO-RBF algorithm. J. Am. Coll. Cardiol. 2016, 68, C111. [Google Scholar]
- El-Khafif, S.H.; El-Brawany, M.A. Artificial neural network-based automated ECG signal classifier. ISRN Biomed. Eng. 2013, 2013. Available online: http://dx.doi.org/10.1155/2013/261917 (accessed on 31 August 2018). [CrossRef]
- Minami, K.; Nakajima, H.; Toyoshima, T. Real-time discrimination of ventricular tachyarrhythmia with Fourier-transform neural network. IEEE Trans. Biomed. Eng. 1999, 46, 179–185. [Google Scholar] [CrossRef] [PubMed]
- Kim, J.; Shin, H.S.; Shin, K.; Lee, M. Robust algorithm for arrhythmia classification in ECG using extreme learning machine. Biomed. Eng. Online 2009, 8, 31. [Google Scholar] [CrossRef] [PubMed]
- Li, S.; Liu, G.; Lin, Z. Comparisons of wavelet packet, lifting wavelet and stationary wavelet transform for de-noising ECG. In Proceedings of the IEEE International Conference on Computer Science and Information Technology, Beijing, China, 8–14 August 2009; pp. 491–494. [Google Scholar]
- Al-Nashash, H. A dynamic Fourier series for the compression of ECG using FFT and adaptive coefficient estimation. Med. Eng. Phys. 1995, 17, 197–203. [Google Scholar] [CrossRef]
- Khorrami, H.; Moavenian, M. A comparative study of DWT, CWT and DCT transformations in ECG arrhythmias classification. Expert Syst. Appl. 2010, 37, 5751–5757. [Google Scholar] [CrossRef]
- Cvetkovic, D.; Übeyli, E.D.; Cosic, I. Wavelet transform feature extraction from human PPG, ECG, and EEG signal responses to ELF PEMF exposures: A pilot study. Digit. Signal Process. 2008, 18, 861–874. [Google Scholar] [CrossRef]
- Liu, T.; Si, Y.; Wen, D.; Zang, M.; Lang, L. Dictionary learning for VQ feature extraction in ECG beats classification. Expert Syst. Appl. 2016, 53, 129–137. [Google Scholar] [CrossRef]
- Acharya, U.R.; Fujita, H.; Lih, O.S.; Adam, M.; Tan, J.H.; Chua, C.K. Automated detection of coronary artery disease using different durations of ECG segments with convolutional neural network. Knowl. Based Syst. 2017, 132, 62–71. [Google Scholar] [CrossRef]
- Acharya, U.R.; Fujita, H.; Lih, O.S.; Hagiwara, Y.; Tan, J.H.; Adam, M. Automated detection of arrhythmias using different intervals of tachycardia ECG segments with convolutional neural network. Inf. Sci. 2017, 405, 81–90. [Google Scholar] [CrossRef]
- Liu, F.; Lin, G.; Shen, C. CRF learning with CNN features for image segmentation. Pattern Recognit. 2015, 48, 2983–2992. [Google Scholar] [CrossRef]
- He, K.; Zhang, X.; Ren, S.; Sun, J. Spatial pyramid pooling in deep convolutional networks for visual recognition. IEEE Trans. Pattern Anal. Mach. Intell. 2015, 37, 1904–1916. [Google Scholar] [CrossRef] [PubMed]
- Qu, T.; Zhang, Q.; Sun, S. Vehicle detection from high-resolution aerial images using spatial pyramid pooling-based deep convolutional neural networks. Multimedia Tools Appl. 2017, 76, 21651–21663. [Google Scholar] [CrossRef]
- Yue, J.; Mao, S.; Li, M. A deep learning framework for hyperspectral image classification using spatial pyramid pooling. Remote Sens. Lett. 2016, 7, 875–884. [Google Scholar] [CrossRef]
- Üstündağ, M.; Gökbulut, M.; Şengür, A.; Ata, F. Denoising of weak ECG signals by using wavelet analysis and fuzzy thresholding. Netw. Model. Anal. Health Inf. Bioinf. 2012, 1, 135–140. [Google Scholar] [CrossRef]
- Sayadi, O.; Shamsollahi, M.B. ECG denoising and compression using a modified extended Kalman filter structure. IEEE Trans. Biomed. Eng. 2008, 55, 2240–2248. [Google Scholar] [CrossRef] [PubMed]
- Lu, G.; Brittain, J.S.; Holland, P.; Yianni, J.; Green, A.L.; Stein, J.F.; Aziz, T.Z.; Wang, S. Removing ECG noise from surface EMG signals using adaptive filtering. Neurosci. Lett. 2009, 462, 14–19. [Google Scholar] [CrossRef] [PubMed]
- Alfaouri, M.; Daqrouq, K. ECG signal denoising by wavelet transform thresholding. Am. J. Appl. Sci. 2008, 5, 276–281. [Google Scholar] [CrossRef]
- Wu, D.; Bai, Z. An improved method for ECG signal feature point detection based on wavelet transform. In Proceedings of the IEEE Conference on Industrial Electronics and Applications (ICIEA), Singapore, 26 November 2012; pp. 1836–1841. [Google Scholar]
- Zeiler, M.D.; Fergus, R. Stochastic pooling for regularization of deep convolutional neural networks. In Proceedings of the International Conference on Learning Representation, Scottsdale, AZ, USA, 4 May 2013; pp. 1–9. [Google Scholar]
- Serre, T.; Wolf, L.; Poggio, T. Object recognition with features inspired by visual cortex. In Proceedings of the IEEE Computer Society Conference on Computer Vision and Pattern Recognition (CVPR’05), San Diego, CA, USA, 20–25 June 2005; pp. 994–1000. [Google Scholar]
- Liu, M.; Li, G.; Hao, H.; Hou, Z.; Liu, X.T. Wave Shape Classification Based on Convolutional Neural Network. Acta Autom. Sin. 2016, 42, 1339–1346. [Google Scholar]
- Gibbons, J.D.; Chakraborti, S. Nonparametric Statistical Inference. International Encyclopedia of Statistical Science, 1st ed.; Springer: Berlin, Germany, 2011; pp. 977–979. [Google Scholar]
- Zhao, J.; Wong, P.K.; Ma, X.; Xie, Z. Chassis integrated control for active suspension, active front steering and direct yaw moment systems using hierarchical strategy. Veh. Syst. Dyn. 2017, 55, 72–103. [Google Scholar] [CrossRef]
- Zhao, J.; Wong, P.K.; Ma, X.; Xie, Z. Design and analysis of an integrated SMC-TPWP strategy for a semi-active air suspension with stepper motor-driven GFASA. Proc. Inst. Mech. Eng. Part I J. Syst. Control Eng. 2018. [Google Scholar] [CrossRef]
- Ma, X.; Wong, P.K.; Zhao, J. Practical multi-objective control for automotive semi-active suspension system with nonlinear hydraulic adjustable damper. Mech. Syst. Signal Process. 2019, 117, 667–688. [Google Scholar] [CrossRef]
- Zhai, X.; Tin, C. Automated ECG Classification using Dual Heartbeat Coupling based on Convolutional Neural Network. IEEE Access 2018, 6, 27465–27472. [Google Scholar] [CrossRef]


| Layers | Type | No. of Neurons (Output Layers) | Kernel Size for Each Output Feature Map | Stride |
|---|---|---|---|---|
| 1 | Convolution_1 | 5 | 1 | |
| 2 | Max pooling | 2 | 2 | |
| 3 | Convolution_2 | 5 | 1 | |
| 4 | SPP | 7 × 12 | ||
| 5 | Fully connected | 84 | -- | -- |
| Class | N | / | A | V | L | R | Total |
|---|---|---|---|---|---|---|---|
| Beats | 6000 | 3616 | 2480 | 6676 | 8069 | 5916 | 32,757 |
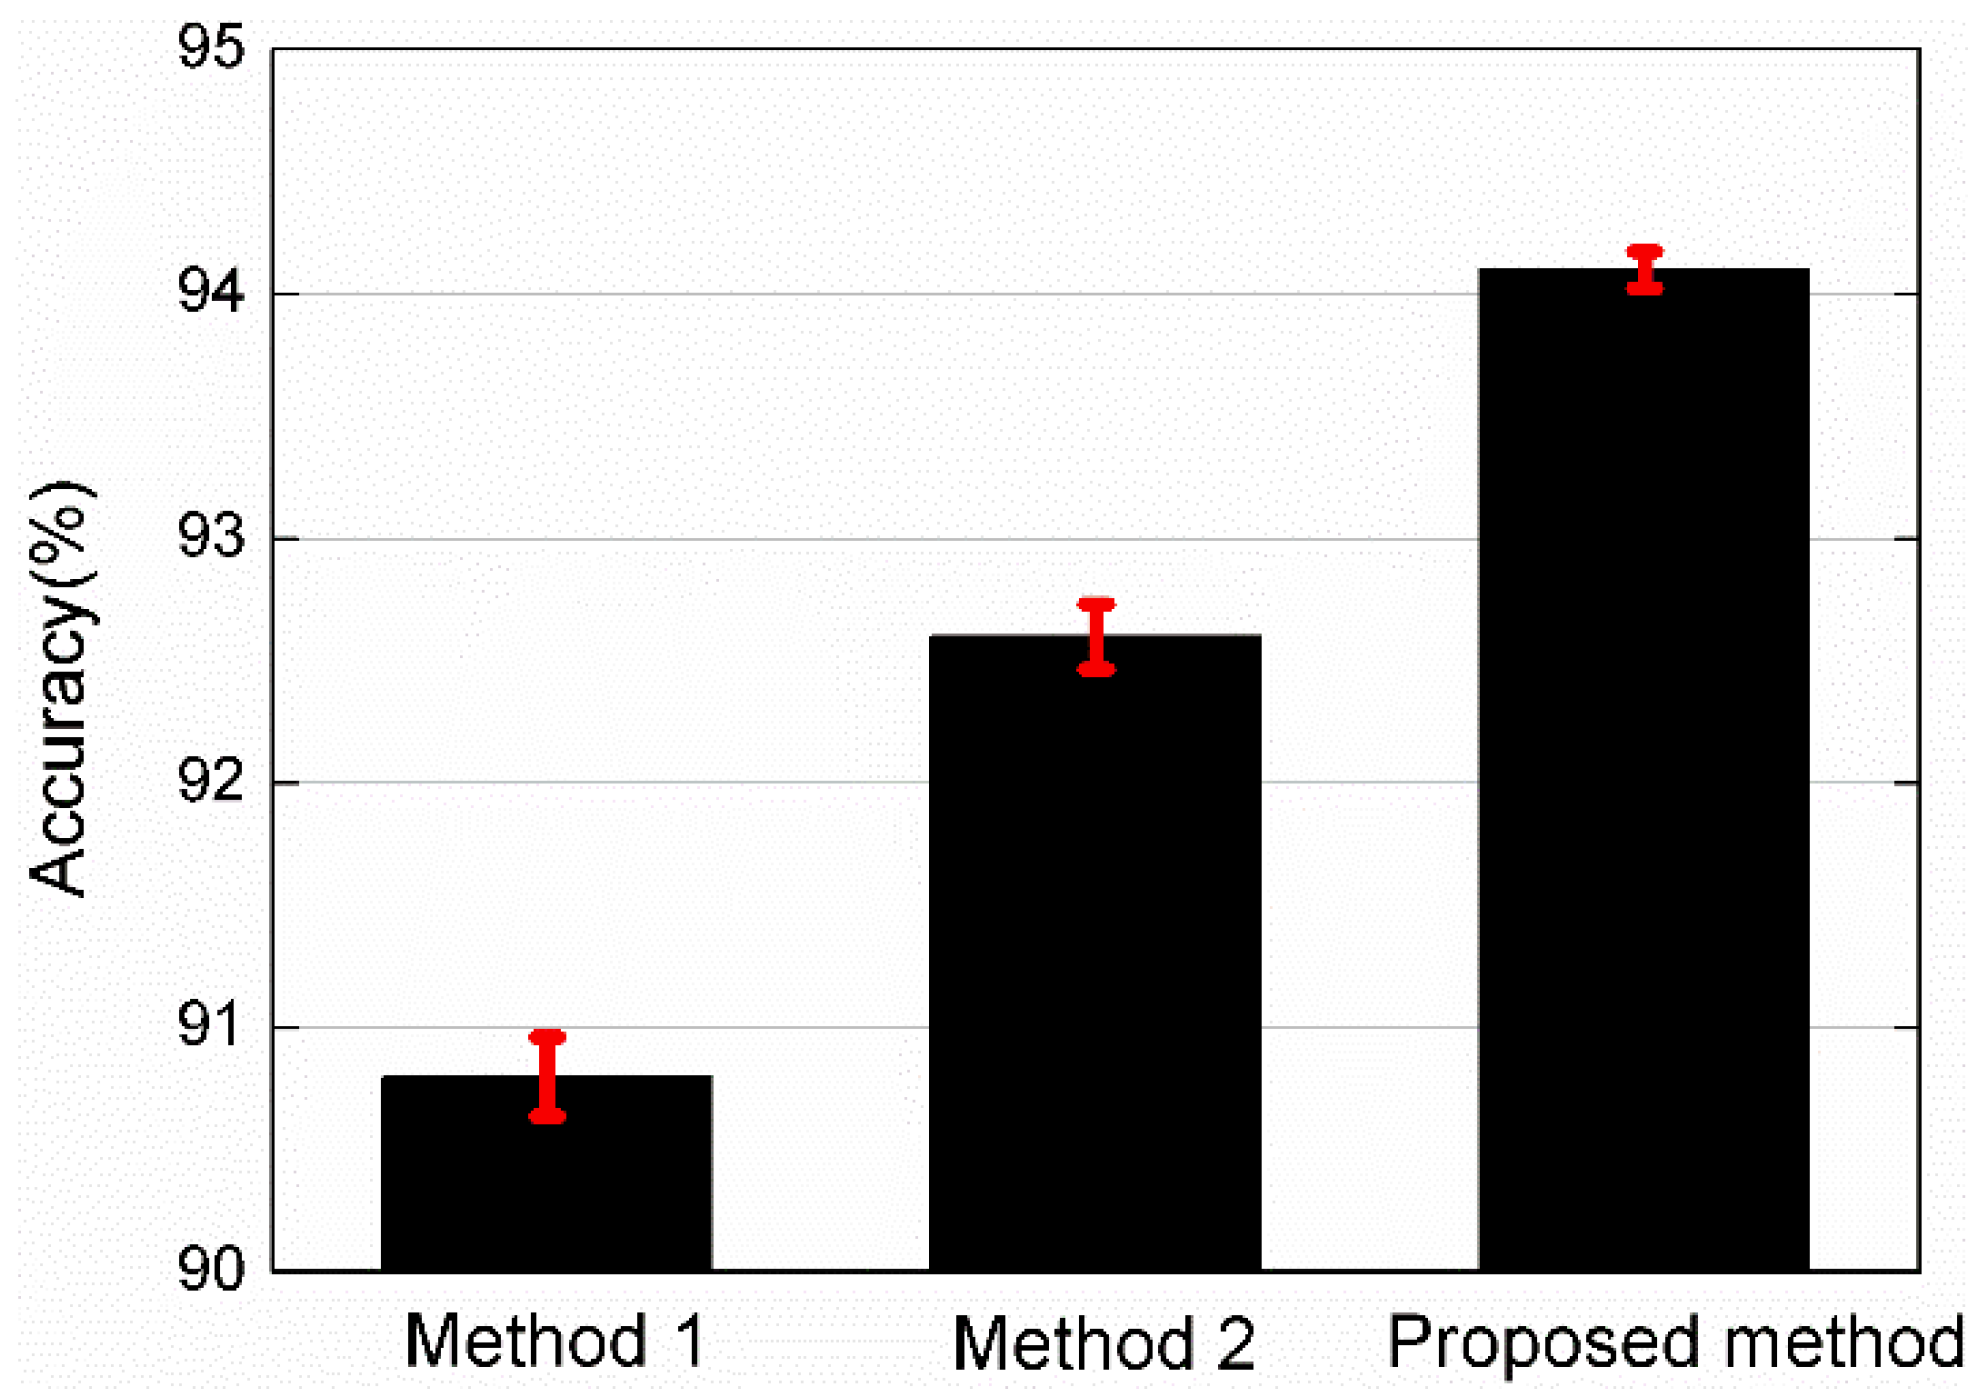
| Main Operating | Method 1 | Method 2 | Proposed Method |
|---|---|---|---|
| Fixed-size heartbeat | Y | Y | N |
| CNNs | Y | Y | Y |
| SPP layer | N | Y | Y |
| Ground Truth | Classification Result | ||||||
|---|---|---|---|---|---|---|---|
| N | \ | A | V | L | R | Accuracy | |
| N | 1794 | 1 | 1 | 0 | 0 | 4 | 99.7% |
| \ | 0 | 1077 | 0 | 0 | 7 | 1 | 99.26% |
| A | 43 | 2 | 530 | 63 | 37 | 69 | 71.24% |
| V | 0 | 6 | 13 | 1921 | 31 | 32 | 95.9% |
| L | 0 | 1 | 1 | 5 | 2402 | 12 | 99.2% |
| R | 0 | 0 | 4 | 1 | 6 | 1764 | 99.38% |
| Against to | Probability of Accept | |
|---|---|---|
| Method 1 | Proposed method | 1.15 × 10⁻⁵ |
| Method 2 | Proposed method | 1.72 × 10⁻⁵ |
© 2018 by the authors. Licensee MDPI, Basel, Switzerland. This article is an open access article distributed under the terms and conditions of the Creative Commons Attribution (CC BY) license (http://creativecommons.org/licenses/by/4.0/).
Share and Cite
Li, J.; Si, Y.; Lang, L.; Liu, L.; Xu, T. A Spatial Pyramid Pooling-Based Deep Convolutional Neural Network for the Classification of Electrocardiogram Beats. Appl. Sci. 2018, 8, 1590. https://doi.org/10.3390/app8091590
Li J, Si Y, Lang L, Liu L, Xu T. A Spatial Pyramid Pooling-Based Deep Convolutional Neural Network for the Classification of Electrocardiogram Beats. Applied Sciences. 2018; 8(9):1590. https://doi.org/10.3390/app8091590
Chicago/Turabian StyleLi, Jia, Yujuan Si, Liuqi Lang, Lixun Liu, and Tao Xu. 2018. "A Spatial Pyramid Pooling-Based Deep Convolutional Neural Network for the Classification of Electrocardiogram Beats" Applied Sciences 8, no. 9: 1590. https://doi.org/10.3390/app8091590
APA StyleLi, J., Si, Y., Lang, L., Liu, L., & Xu, T. (2018). A Spatial Pyramid Pooling-Based Deep Convolutional Neural Network for the Classification of Electrocardiogram Beats. Applied Sciences, 8(9), 1590. https://doi.org/10.3390/app8091590