A Novel Dictionary-Based Image Reconstruction for Photoacoustic Computed Tomography

 ,
,
Abstract
1. Introduction
2. Methods
2.1. Analytical Reconstruction
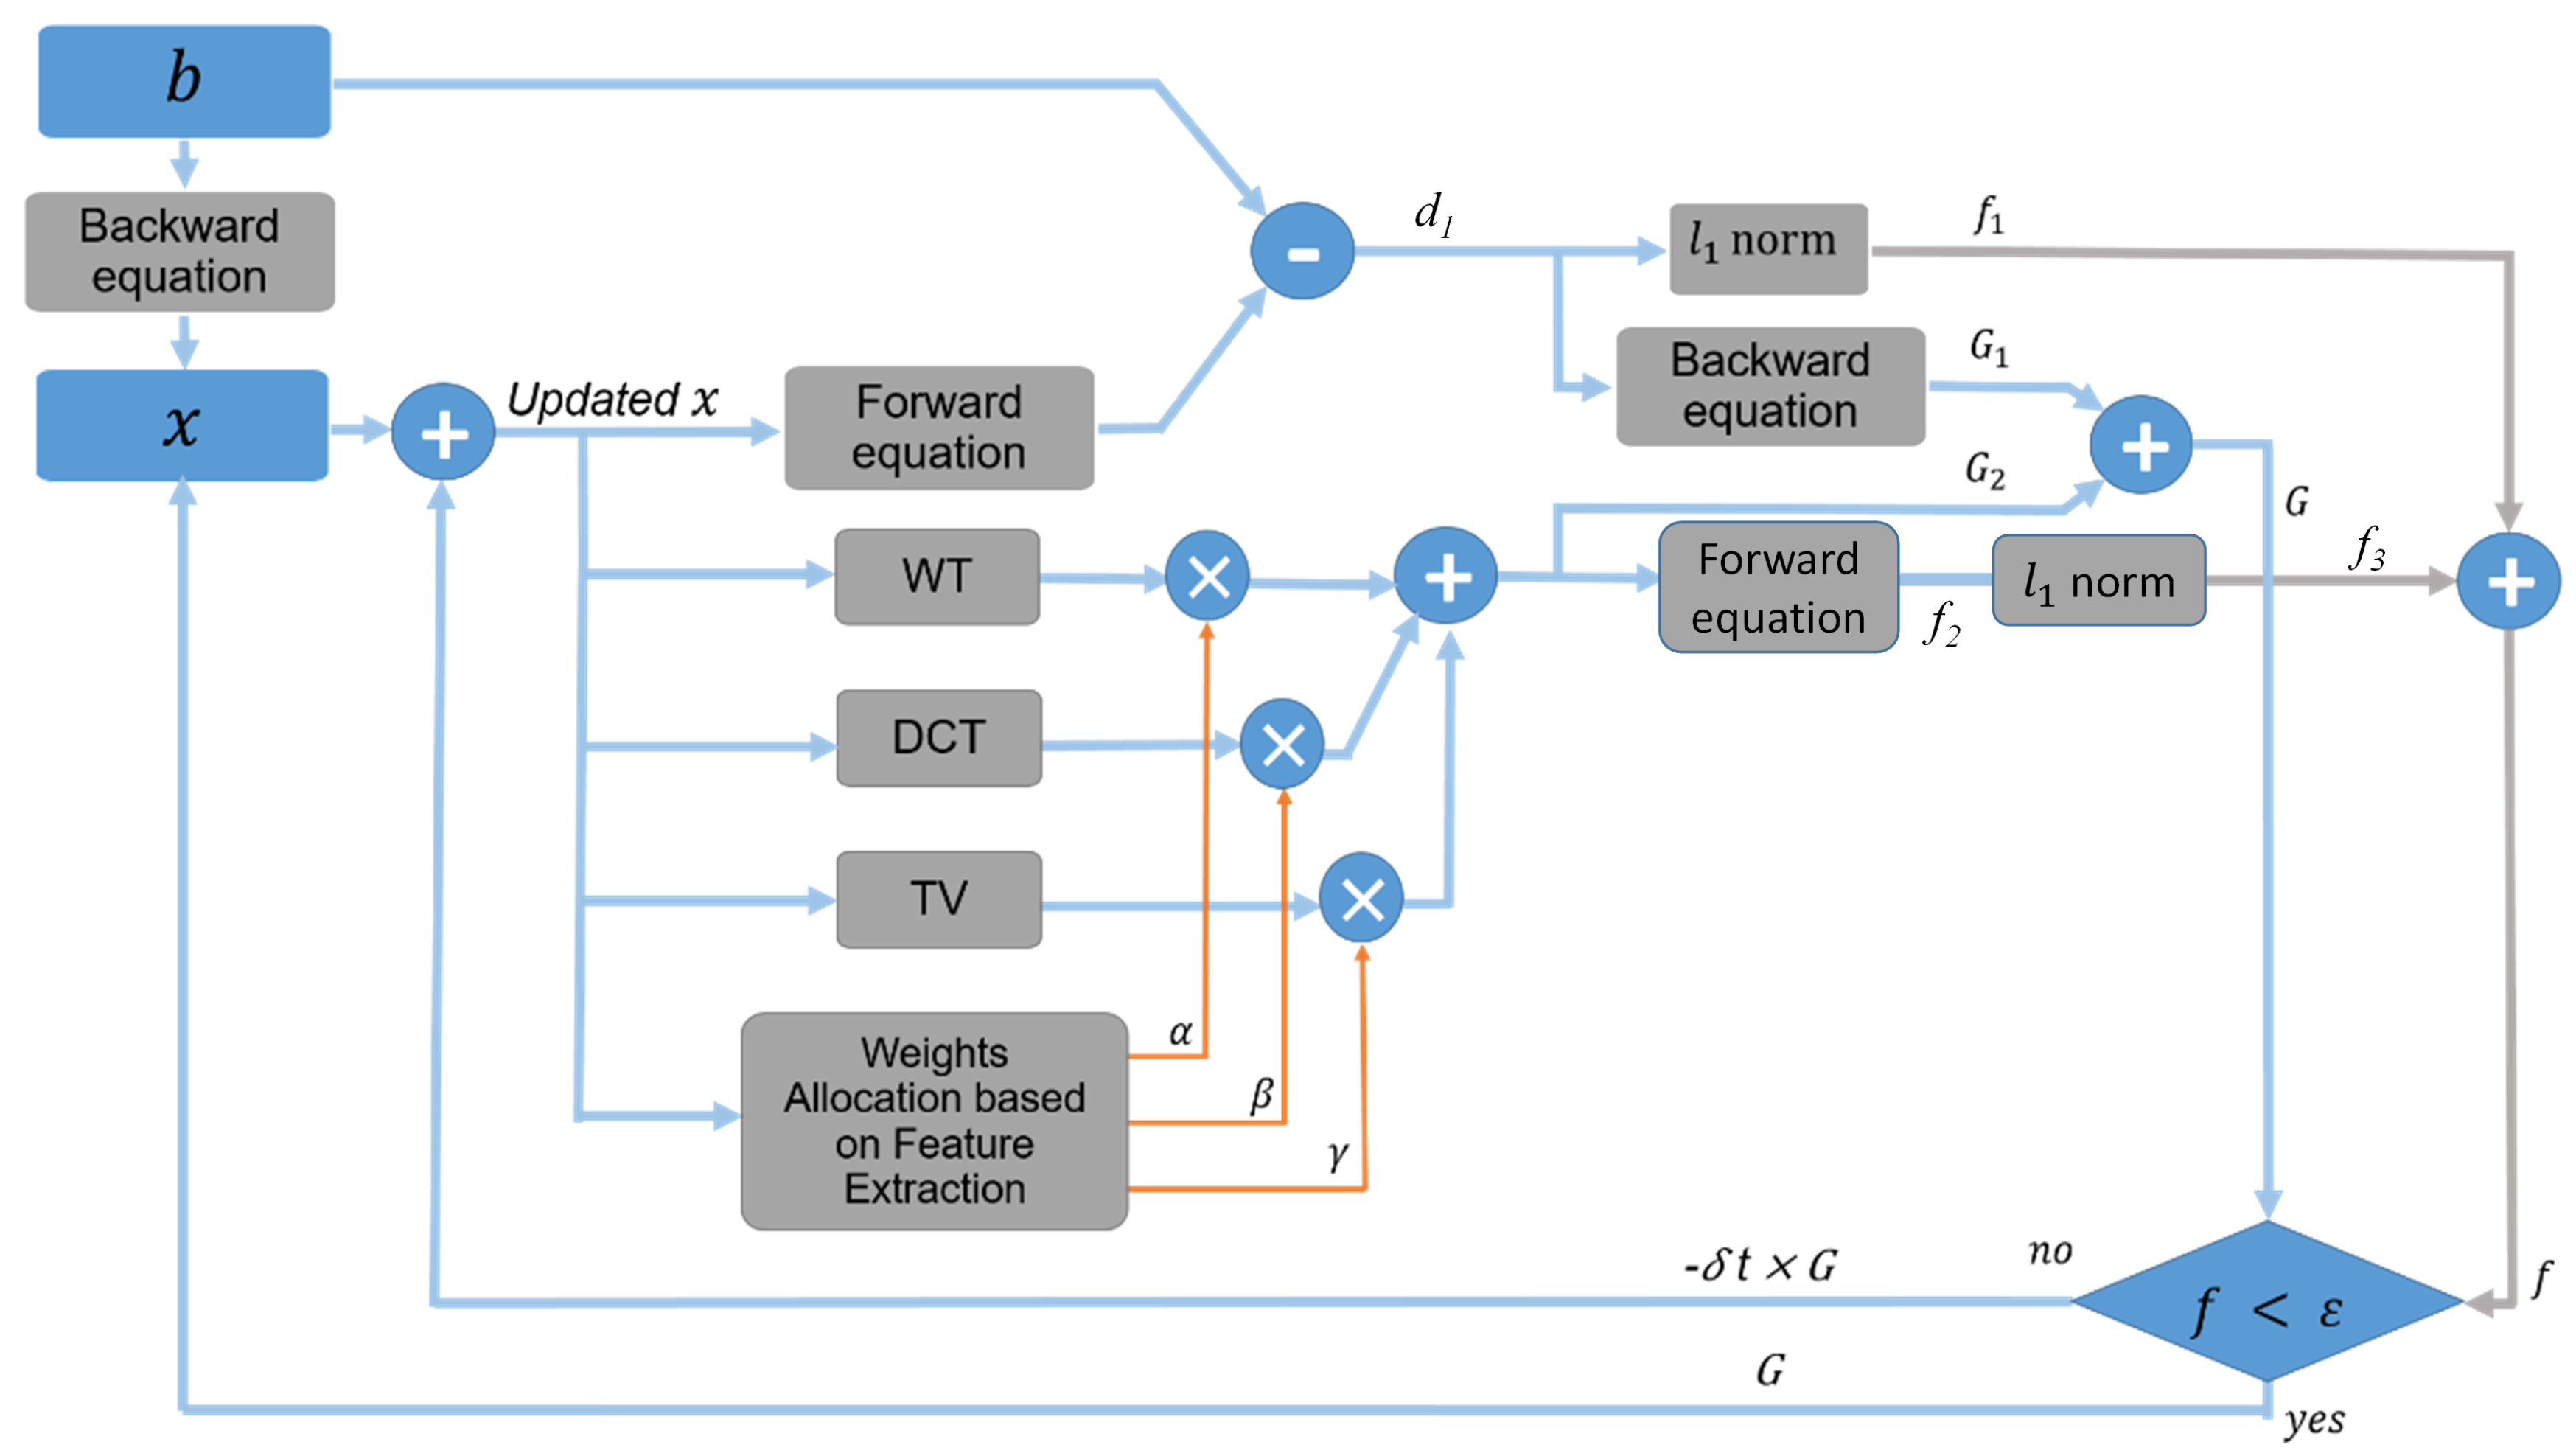
2.2. The Proposed Method
Paradigm of the Proposed Method
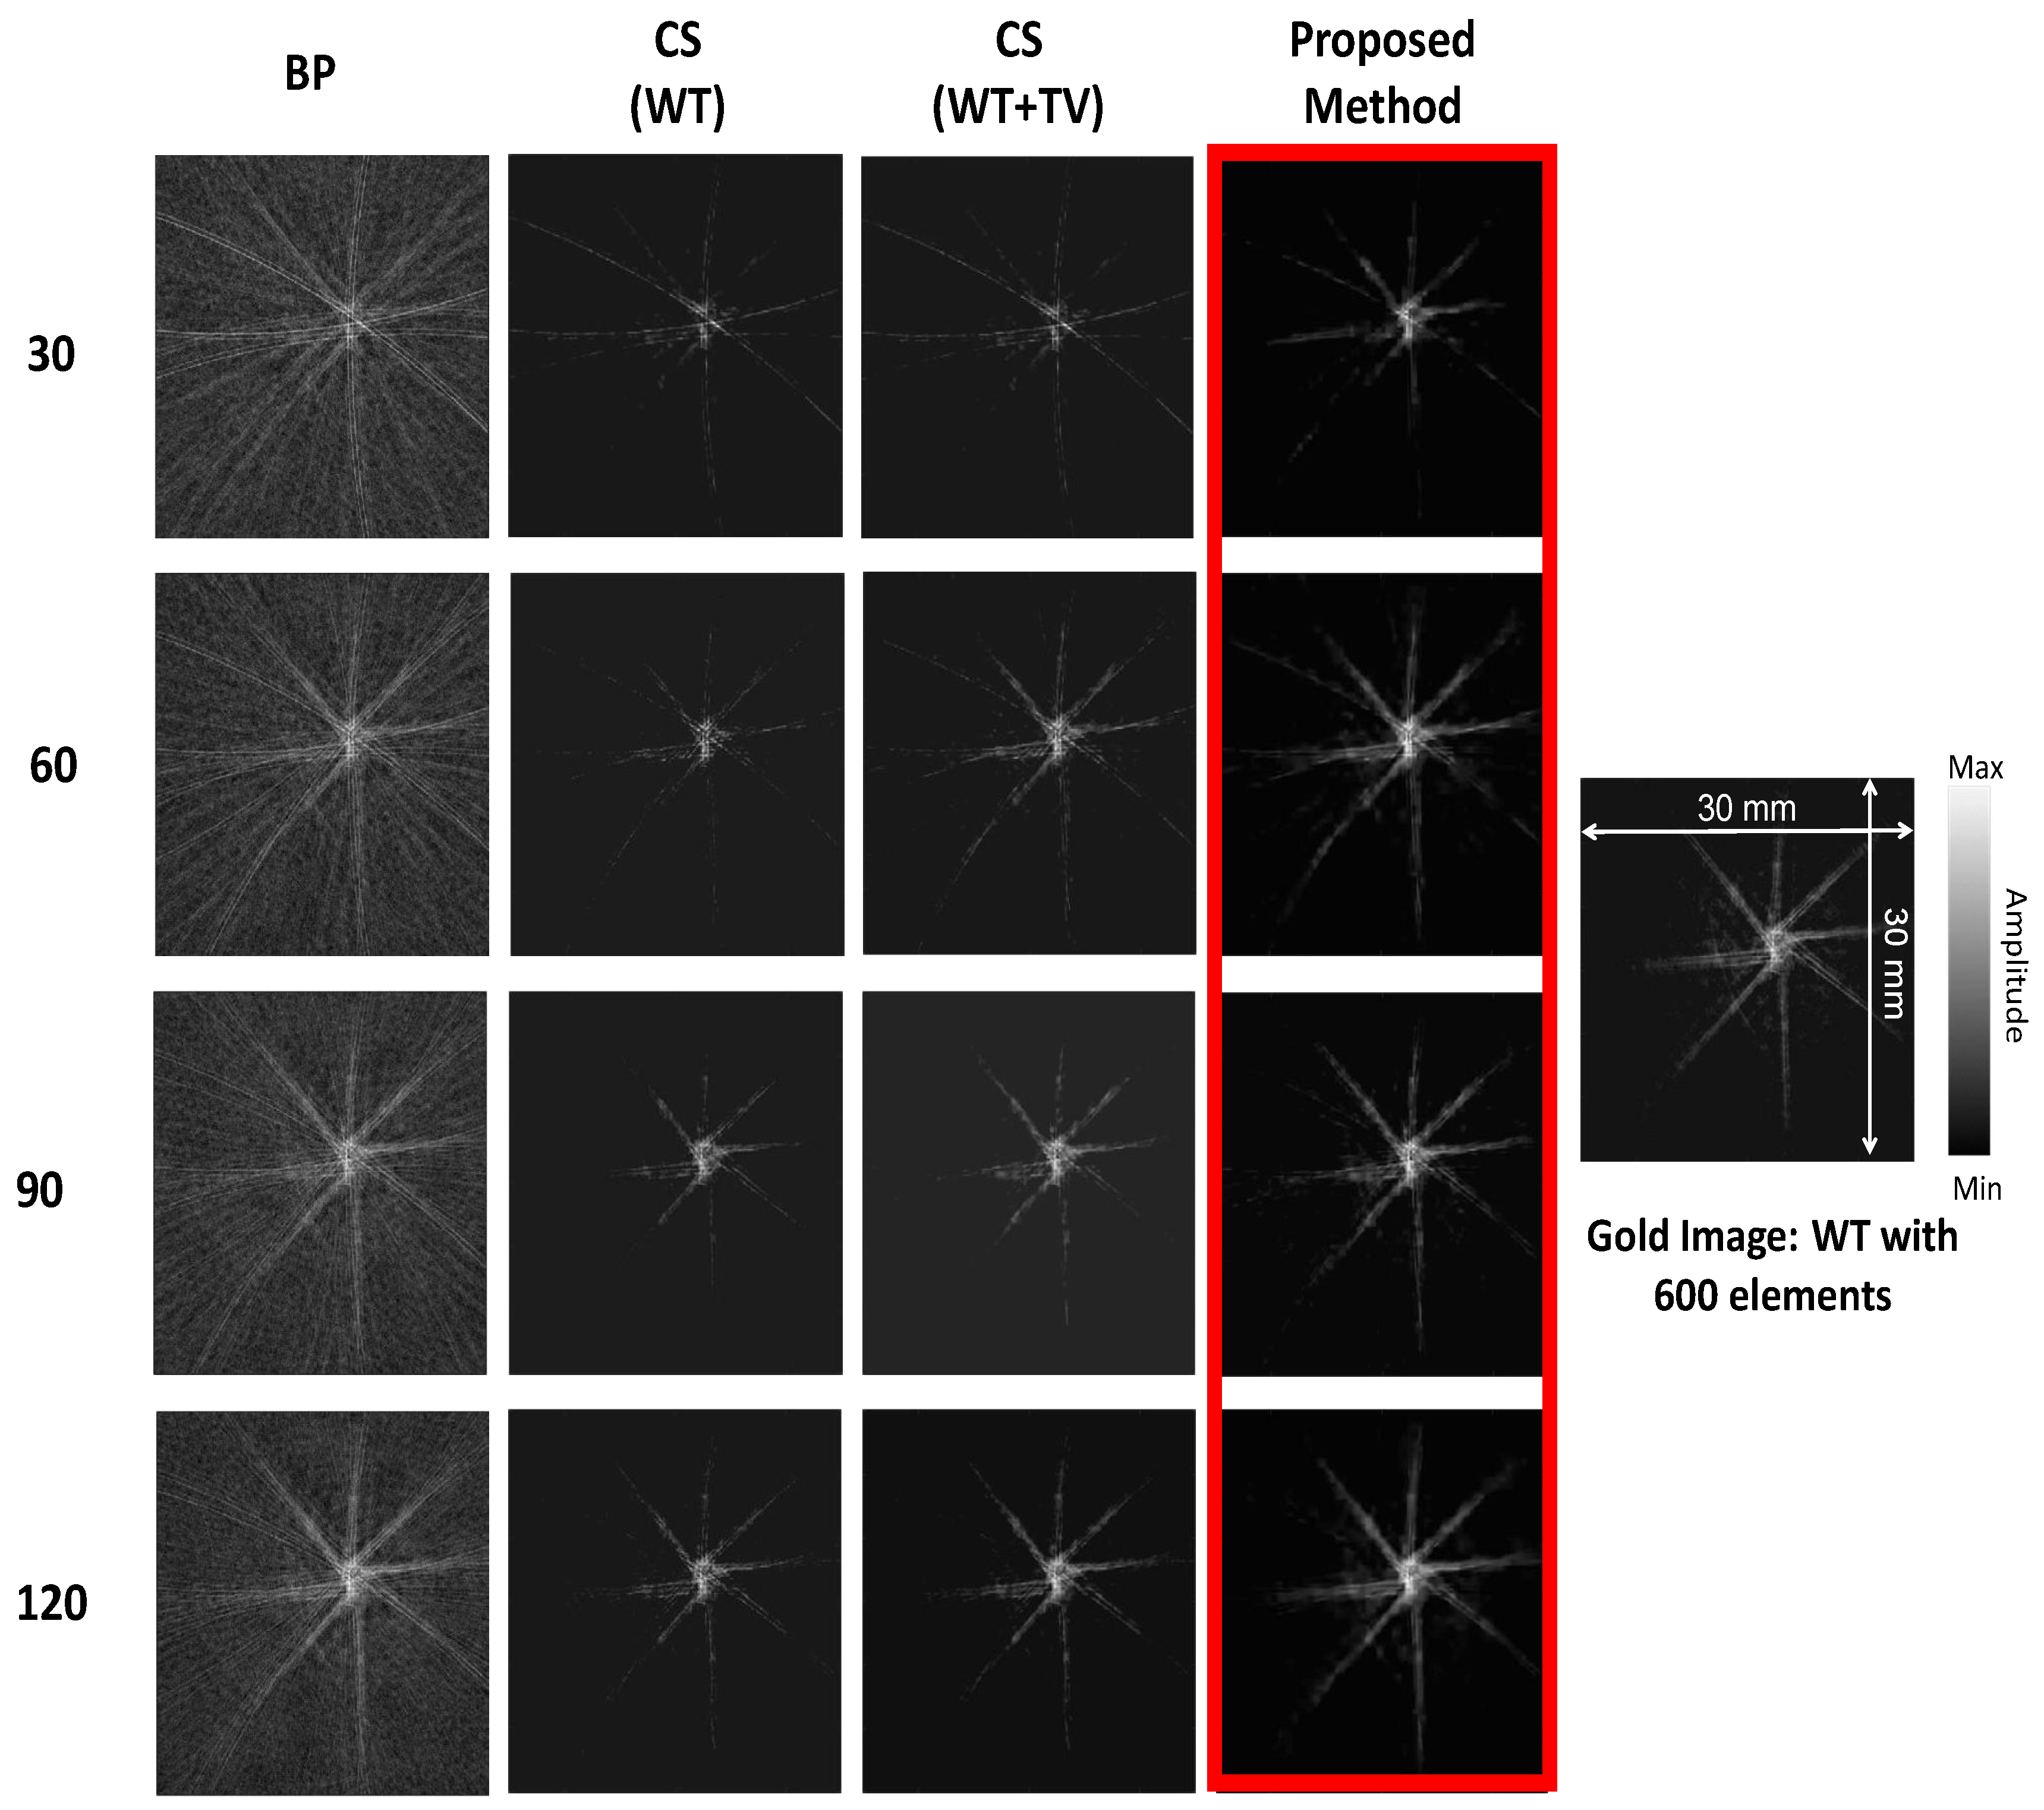
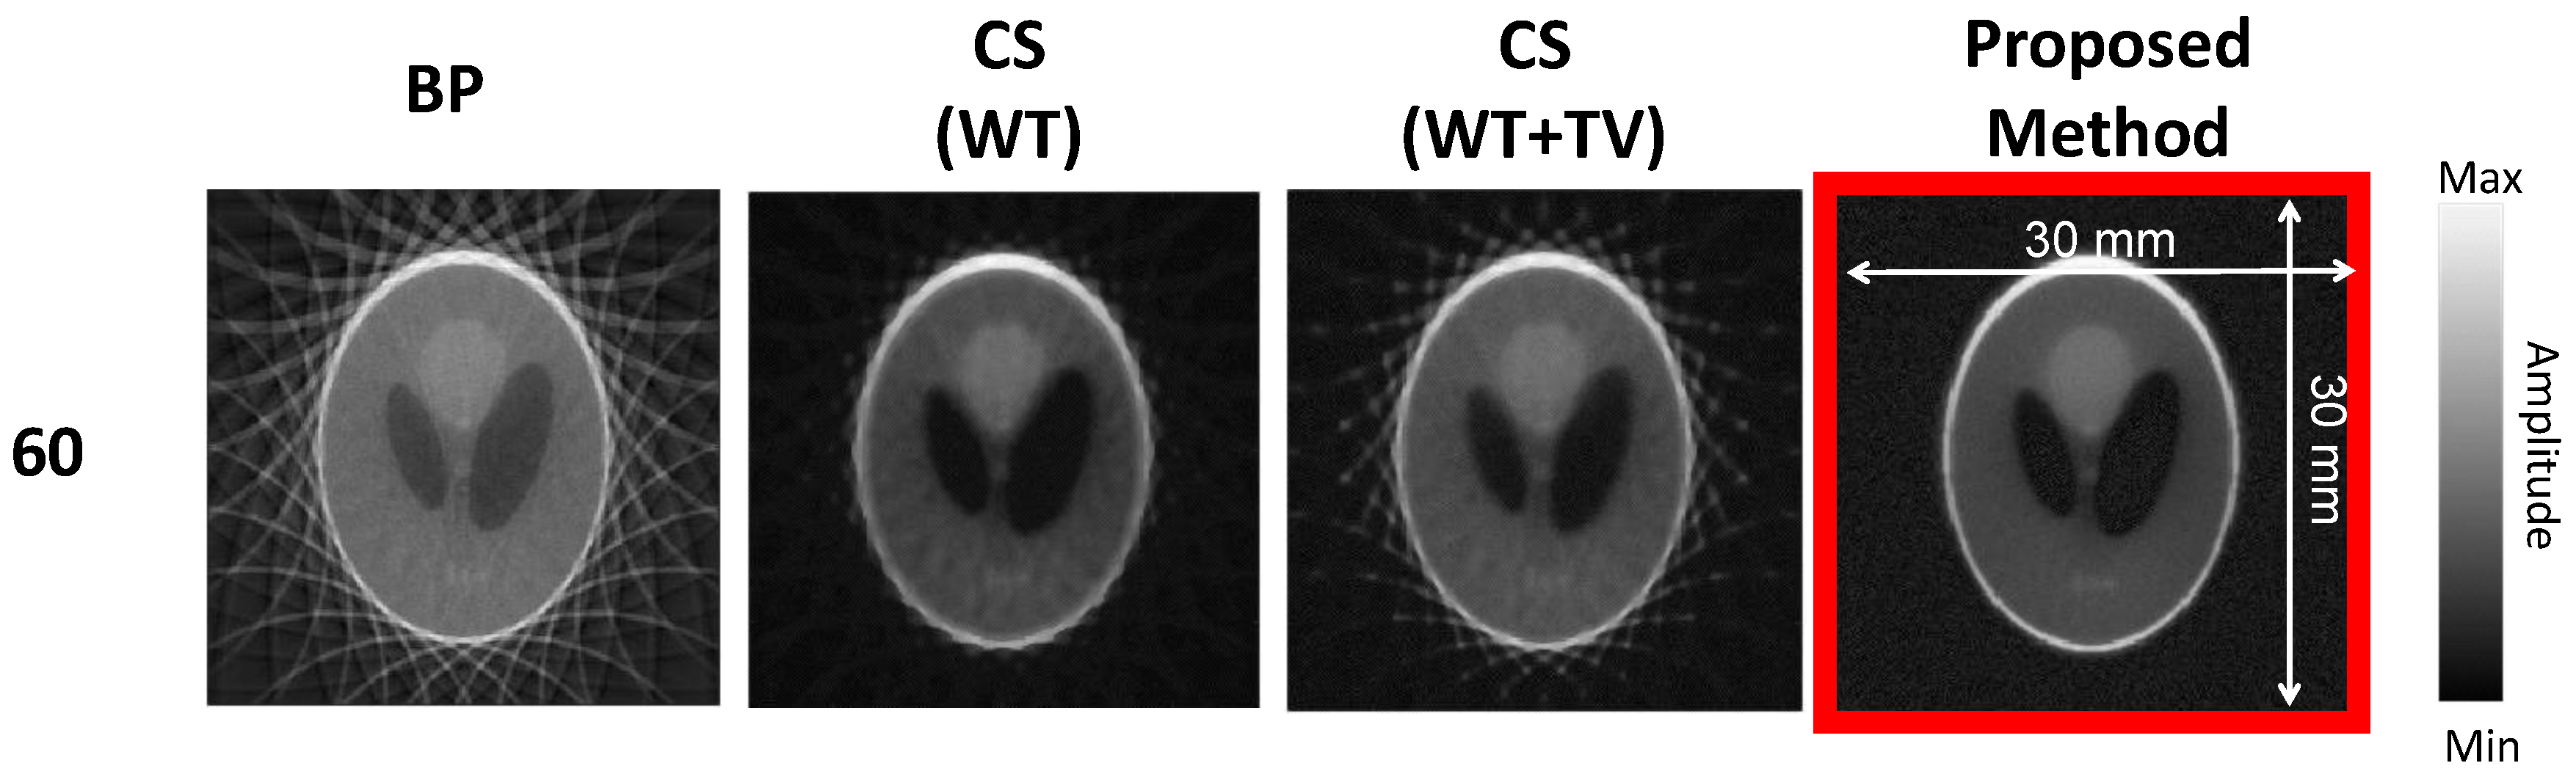
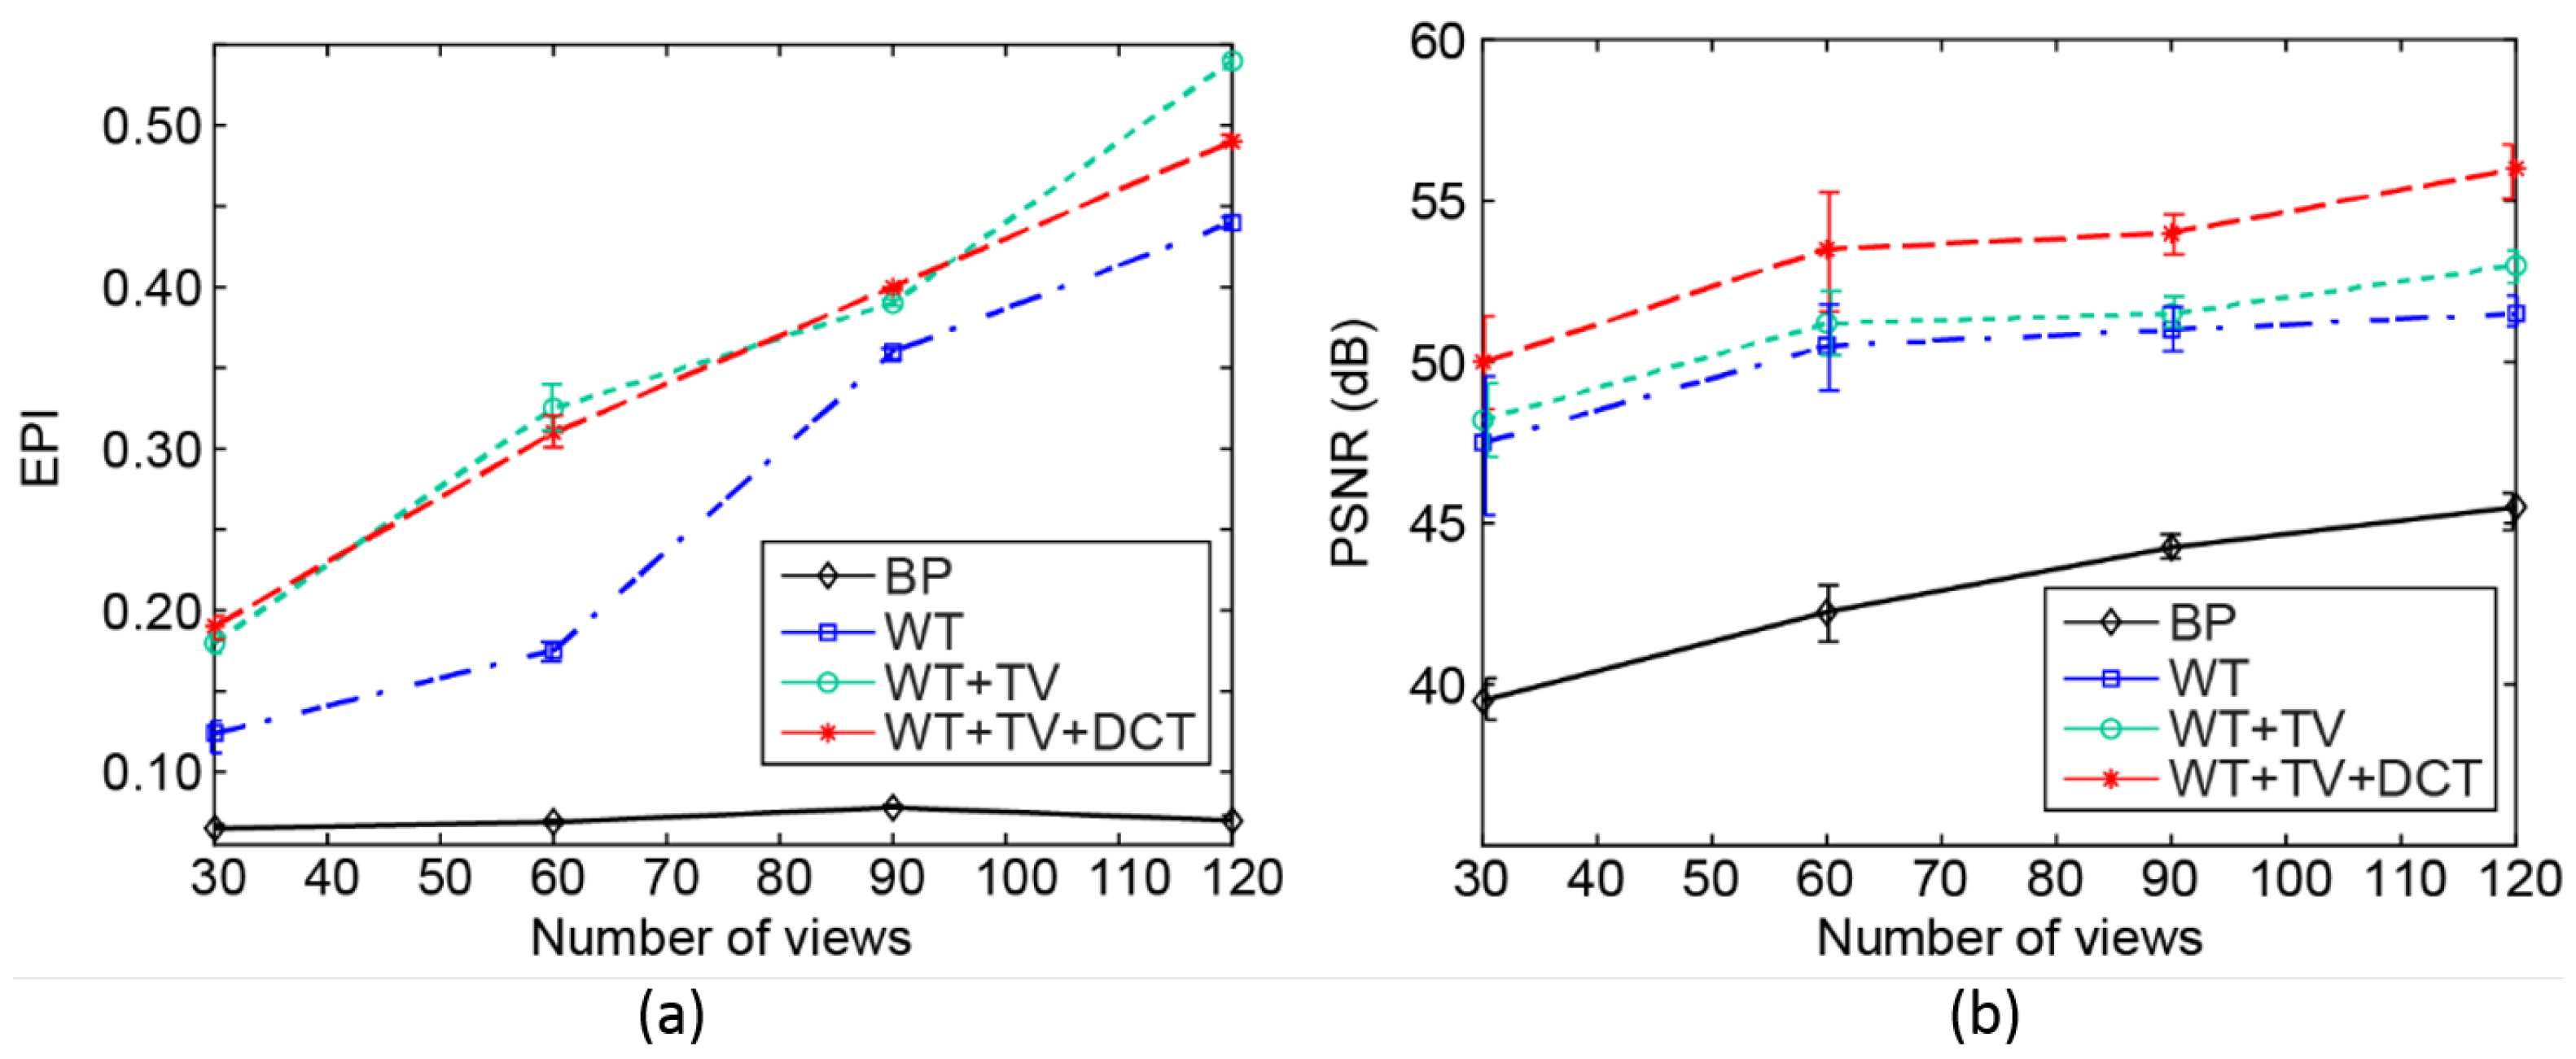
3. Results
4. Conclusions
Author Contributions
Funding
Acknowledgments
Conflicts of Interest
Abbreviations
| PACT | Photoacoustic Computed Tomography |
| BP | Back Projection |
| WT | Wavelet Transform |
| DCT | Discrete Cosine Transform |
| TV | Total Variation |
| EPI | Edge Preservation Index |
| PSNR | Peak Signal-to-Noise Ratio |
| FBP | Filtered Back Projection |
| PA | Photoacoustic |
| CS | Compressed Sensing |
| MRI | Magnetic Resonance Imaging |
| TAI | Theracoustic Imaging |
| DAQ | Data Acquisition |
| MCA | Morphological Component Analysis |
| GLCM | Gray-Level Co-occurrence Matrix |
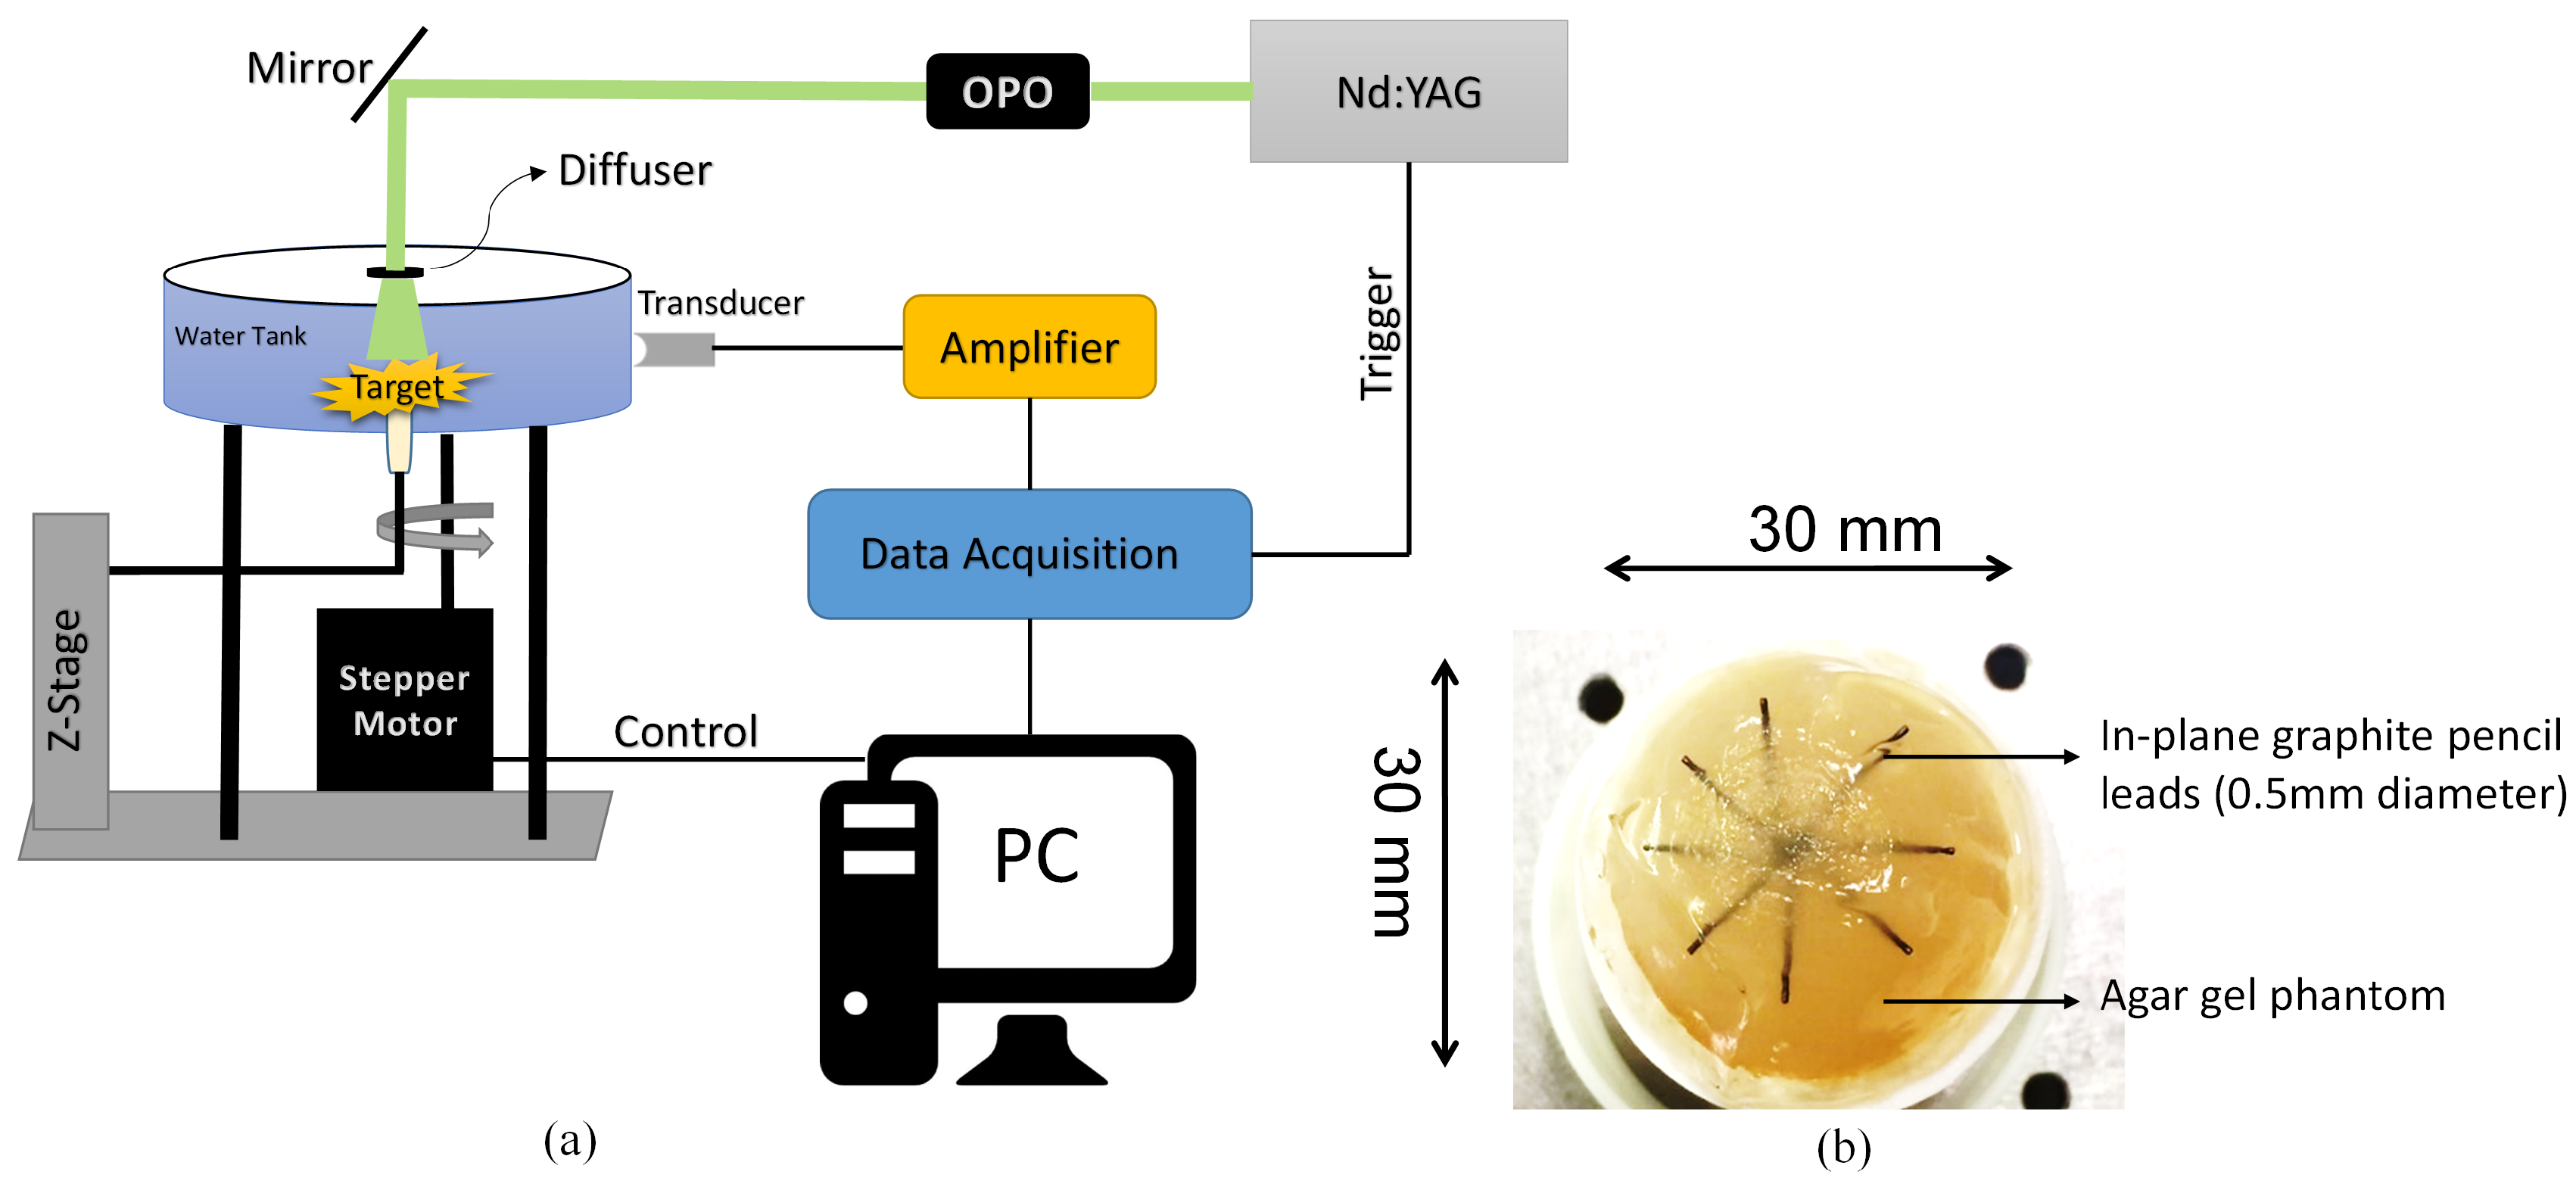
| OPO | Optical Parametric Oscillator |
| NI | National Instrument |
| MSE | Minimum Square Error |
References
- Xu, M.; Wang, L.V. Photoacoustic imaging in biomedicine. Rev. Sci. Instrum. 2006, 77, 041101. [Google Scholar] [CrossRef]
- Nasiriavanaki, M.; Xia, J.; Wan, H.; Bauer, A.Q.; Culver, J.P.; Wang, L.V. High-resolution photoacoustic tomography of resting-state functional connectivity in the mouse brain. Proc. Natl. Acad. Sci. USA 2014, 111, 21–26. [Google Scholar] [CrossRef] [PubMed]
- Jeon, M.; Song, W.; Huynh, E.; Kim, J.; Kim, J.; Helfield, B.L.; Leung, B.Y.; Geortz, D.E.; Zheng, G.; Oh, J.; et al. Methylene blue microbubbles as a model dual-modality contrast agent for ultrasound and activatable photoacoustic imaging. J. Biomed. Opt. 2014, 19, 016005. [Google Scholar] [CrossRef] [PubMed]
- Mohammadi-Nejad, A.R.; Mahmoudzadeh, M.; Hassanpour, M.S.; Wallois, F.; Muzik, O.; Papadelis, C.; Hansen, A.; Soltanian-Zadeh, H.; Gelovani, J.; Nasiriavanaki, M. Neonatal brain resting-state functional connectivity imaging modalities. Photoacoustics 2018, 10, 1–19. [Google Scholar] [CrossRef] [PubMed]
- Mahmoodkalayeh, S.; Lu, X.; Ansari, M.A.; Li, H.; Nasiriavanaki, M. Optimization of light illumination for photoacoustic computed tomography of human infant brain. In Proceedings of the Photons Plus Ultrasound: Imaging and Sensing 2018, International Society for Optics and Photonics, San Francisco, CA, USA, 27 January–1 February 2018; Volume 10494, p. 104946U. [Google Scholar]
- Mozaffarzadeh, M.; Mahloojifar, A.; Orooji, M.; Kratkiewicz, K.; Adabi, S.; Nasiriavanaki, M. Linear-array photoacoustic imaging using minimum variance-based delay multiply and sum adaptive beamforming algorithm. J. Biomed. Opt. 2018, 23, 026002. [Google Scholar] [CrossRef] [PubMed]
- Hariri, A.; Fatima, A.; Mohammadian, N.; Mahmoodkalayeh, S.; Ansari, M.A.; Bely, N.; Avanaki, M.R. Development of low-cost photoacoustic imaging systems using very low-energy pulsed laser diodes. J. Biomed. Opt. 2017, 22, 075001. [Google Scholar] [CrossRef] [PubMed]
- Mozaffarzadeh, M.; Mahloojifar, A.; Orooji, M.; Adabi, S.; Nasiriavanaki, M. Double-Stage Delay Multiply and Sum Beamforming Algorithm: Application to Linear-Array Photoacoustic Imaging. IEEE Trans. Biomed. Eng. 2018, 65, 31–42. [Google Scholar] [CrossRef] [PubMed]
- Mozaffarzadeh, M.; Mahloojifar, A.; Periyasamy, V.; Pramanik, M.; Orooji, M. Eigenspace-Based Minimum Variance Combined with Delay Multiply and Sum Beamformer: Application to Linear-Array Photoacoustic Imaging. IEEE J. Sel. Top. Quantum Electron. 2019, 25, 1–8. [Google Scholar] [CrossRef]
- Yeh, C.; Li, L.; Zhu, L.; Xia, J.; Li, C.; Chen, W.; Garcia-Uribe, A.; Maslov, K.I.; Wang, L.V. Dry coupling for whole-body small-animal photoacoustic computed tomography. J. Biomed. Opt. 2017, 22, 041017. [Google Scholar] [CrossRef] [PubMed]
- Cho, Y.; Chang, C.C.; Yu, J.; Jeon, M.; Kim, C.; Wang, L.V.; Zou, J. Handheld photoacoustic tomography probe built using optical-fiber parallel acoustic delay lines. J. Biomed. Opt. 2014, 19, 086007. [Google Scholar] [CrossRef] [PubMed]
- Li, G.; Li, L.; Zhu, L.; Xia, J.; Wang, L.V. Multiview Hilbert transformation for full-view photoacoustic computed tomography using a linear array. J. Biomed. Opt. 2015, 20, 066010. [Google Scholar] [CrossRef] [PubMed]
- Zhang, P.; Li, L.; Lin, L.; Hu, P.; Shi, J.; He, Y.; Zhu, L.; Zhou, Y.; Wang, L.V. High-resolution deep functional imaging of the whole mouse brain by photoacoustic computed tomography in vivo. J. Biophotonics 2018, 11, e201700024. [Google Scholar] [CrossRef] [PubMed]
- Jo, J.; Tian, C.; Xu, G.; Sarazin, J.; Schiopu, E.; Gandikota, G.; Wang, X. Photoacoustic tomography for human musculoskeletal imaging and inflammatory arthritis detection. Photoacoustics 2018, in press. [Google Scholar] [CrossRef]
- Lin, L.; Xia, J.; Wong, T.T.; Li, L.; Wang, L.V. In vivo deep brain imaging of rats using oral-cavity illuminated photoacoustic computed tomography. J. Biomed. Opt. 2015, 20, 016019. [Google Scholar] [CrossRef] [PubMed]
- Wang, J.; Wang, Y. An Efficient Compensation Method for Limited-View Photoacoustic Imaging Reconstruction Based on Gerchberg–Papoulis Extrapolation. Appl. Sci. 2017, 7, 505. [Google Scholar] [CrossRef]
- Li, L.; Zhu, L.; Ma, C.; Lin, L.; Yao, J.; Wang, L.; Maslov, K.; Zhang, R.; Chen, W.; Shi, J.; et al. Single-impulse panoramic photoacoustic computed tomography of small-animal whole-body dynamics at high spatiotemporal resolution. Nat. Biomed. Eng. 2017, 1, 0071. [Google Scholar] [CrossRef] [PubMed]
- Matthews, T.P.; Anastasio, M.A. Joint reconstruction of the initial pressure and speed of sound distributions from combined photoacoustic and ultrasound tomography measurements. Inverse Probl. 2017, 33, 124002. [Google Scholar] [CrossRef] [PubMed]
- Matthews, T.P.; Wang, K.; Li, C.; Duric, N.; Anastasio, M.A. Regularized dual averaging image reconstruction for full-wave ultrasound computed tomography. IEEE Trans. Ultrason. Ferroelectr. Freq. Control 2017, 64, 811–825. [Google Scholar] [CrossRef] [PubMed]
- Xu, M.; Wang, L.V. Universal back-projection algorithm for photoacoustic computed tomography. Phys. Rev. E 2005, 71, 016706. [Google Scholar] [CrossRef] [PubMed]
- Egolf, D.M.; Chee, R.K.; Zemp, R.J. Sparsity-based reconstruction for super-resolved limited-view photoacoustic computed tomography deep in a scattering medium. Opt. Lett. 2018, 43, 2221–2224. [Google Scholar] [CrossRef] [PubMed]
- Dean-Ben, X.L.; Buehler, A.; Ntziachristos, V.; Razansky, D. Accurate model-based reconstruction algorithm for three-dimensional optoacoustic tomography. IEEE Trans. Med. Imaging 2012, 31, 1922–1928. [Google Scholar] [CrossRef] [PubMed]
- Zhang, Y.; Wang, Y.; Zhang, C. Total variation based gradient descent algorithm for sparse-view photoacoustic image reconstruction. Ultrasonics 2012, 52, 1046–1055. [Google Scholar] [CrossRef] [PubMed]
- Zhang, Y.; Wang, Y.; Zhang, C. Efficient discrete cosine transform model–based algorithm for photoacoustic image reconstruction. J. Biomed. Opt. 2013, 18, 066008. [Google Scholar] [CrossRef] [PubMed]
- Zhang, C.; Zhang, Y.; Wang, Y. A photoacoustic image reconstruction method using total variation and nonconvex optimization. Biomed. Eng. Online 2014, 13, 117. [Google Scholar] [CrossRef] [PubMed]
- Mozaffarzadeh, M.; Mahloojifar, A.; Nasiriavanaki, M.; Orooji, M. Model-based photoacoustic image reconstruction using compressed sensing and smoothed L0 norm. In Proceedings of the Photons Plus Ultrasound: Imaging and Sensing 2018, International Society for Optics and Photonics, San Francisco, CA, USA, 27 January–1 February 2018; Volume 10494, p. 104943Z. [Google Scholar]
- Guo, Z.; Li, C.; Song, L.; Wang, L.V. Compressed sensing in photoacoustic tomography in vivo. J. Biomed. Opt. 2010, 15, 021311. [Google Scholar] [CrossRef] [PubMed]
- Provost, J.; Lesage, F. The application of compressed sensing for photo-acoustic tomography. IEEE Trans. Med. Imaging 2009, 28, 585–594. [Google Scholar] [CrossRef] [PubMed]
- Rosenthal, A.; Razansky, D.; Ntziachristos, V. Quantitative optoacoustic signal extraction using sparse signal representation. IEEE Trans. Med. Imaging 2009, 28, 1997–2006. [Google Scholar] [CrossRef] [PubMed]
- Donoho, D.L. Compressed sensing. IEEE Trans. Inf. Theory 2006, 52, 1289–1306. [Google Scholar] [CrossRef]
- Ramirez-Giraldo, J.; Trzasko, J.; Leng, S.; Yu, L.; Manduca, A.; McCollough, C.H. Nonconvex prior image constrained compressed sensing (NCPICCS): Theory and simulations on perfusion CT. Med. Phys. 2011, 38, 2157–2167. [Google Scholar] [CrossRef] [PubMed]
- Xi, Y.; Zhao, J.; Bennett, J.R.; Stacy, M.R.; Sinusas, A.J.; Wang, G. Simultaneous CT-MRI reconstruction for constrained imaging geometries using structural coupling and compressive sensing. IEEE Trans. Biomed. Eng. 2016, 63, 1301–1309. [Google Scholar] [CrossRef] [PubMed]
- Qin, T.; Wang, X.; Qin, Y.; Wan, G.; Witte, R.S.; Xin, H. Quality improvement of thermoacoustic imaging based on compressive sensing. IEEE Antennas Wirel. Propag. Lett. 2015, 14, 1200–1203. [Google Scholar] [CrossRef]
- Meng, J.; Wang, L.V.; Liang, D.; Song, L. In vivo optical-resolution photoacoustic computed tomography with compressed sensing. Opt. Lett. 2012, 37, 4573–4575. [Google Scholar] [CrossRef] [PubMed]
- Liu, Q.; Wang, S.; Ying, L.; Peng, X.; Zhu, Y.; Liang, D. Adaptive dictionary learning in sparse gradient domain for image recovery. IEEE Trans. Image Process. 2013, 22, 4652–4663. [Google Scholar] [CrossRef] [PubMed]
- Zhou, W.; Cai, J.F.; Gao, H. Adaptive tight frame based medical image reconstruction: a proof-of-concept study for computed tomography. Inverse Probl. 2013, 29, 125006. [Google Scholar] [CrossRef]
- Duarte-Carvajalino, J.M.; Sapiro, G. Learning to sense sparse signals: Simultaneous sensing matrix and sparsifying dictionary optimization. IEEE Trans. Image Process. 2009, 18, 1395–1408. [Google Scholar] [CrossRef] [PubMed]
- Haralick, R.M. Statistical and structural approaches to texture. Proc. IEEE 1979, 67, 786–804. [Google Scholar] [CrossRef]
- Harris, C.; Stephens, M. A combined corner and edge detector. In Proceedings of the Alvey Vision Conference, Manchester, UK, 31 August–2 September 1988; Volume 15, pp. 10–5244. [Google Scholar]
- Adabi, S.; Mohebbikarkhoran, H.; Mehregan, D.; Conforto, S.; Nasiriavanaki, M. An intelligent despeckling method for swept source optical coherence tomography images of skin. In Proceedings of the Medical Imaging 2017: Biomedical Applications in Molecular, Structural, and Functional Imaging, International Society for Optics and Photonics, Orlando, FL, USA, 13 March 2017; Volume 10137, p. 101372B. [Google Scholar]


| Transducer | 5 MHz |
| Laser energy | 20 mJ/cm2 |
| Laser pulse width | 7 ns |
| Laser rep-rate | 30 Hz |
| Wavelength | 532 nm |
| Amplifier | ZFL500LN |
| DAQ | National instrument |
| Algorithm | BP | Sparse (WT) | Sparse (WT+TV) | Proposed |
|---|---|---|---|---|
| Execution Time (sec) | 18.99 | 387.28 | 369.79 | 547.30 |
© 2018 by the authors. Licensee MDPI, Basel, Switzerland. This article is an open access article distributed under the terms and conditions of the Creative Commons Attribution (CC BY) license (http://creativecommons.org/licenses/by/4.0/).
Share and Cite
Omidi, P.; Zafar, M.; Mozaffarzadeh, M.; Hariri, A.; Haung, X.; Orooji, M.; Nasiriavanaki, M. A Novel Dictionary-Based Image Reconstruction for Photoacoustic Computed Tomography. Appl. Sci. 2018, 8, 1570. https://doi.org/10.3390/app8091570
Omidi P, Zafar M, Mozaffarzadeh M, Hariri A, Haung X, Orooji M, Nasiriavanaki M. A Novel Dictionary-Based Image Reconstruction for Photoacoustic Computed Tomography. Applied Sciences. 2018; 8(9):1570. https://doi.org/10.3390/app8091570
Chicago/Turabian StyleOmidi, Parsa, Mohsin Zafar, Moein Mozaffarzadeh, Ali Hariri, Xiangzhi Haung, Mahdi Orooji, and Mohammadreza Nasiriavanaki. 2018. "A Novel Dictionary-Based Image Reconstruction for Photoacoustic Computed Tomography" Applied Sciences 8, no. 9: 1570. https://doi.org/10.3390/app8091570
APA StyleOmidi, P., Zafar, M., Mozaffarzadeh, M., Hariri, A., Haung, X., Orooji, M., & Nasiriavanaki, M. (2018). A Novel Dictionary-Based Image Reconstruction for Photoacoustic Computed Tomography. Applied Sciences, 8(9), 1570. https://doi.org/10.3390/app8091570