Article

Part Qualification Methodology for Composite Aircraft Components Using Acoustic Emission Monitoring

by
Shane Esola
1,
Brian J. Wisner
1,
Prashanth Abraham Vanniamparambil
1,
John Geriguis
2 and
Antonios Kontsos
1,*
1
Theoretical & Applied Mechanics Group, Mechanical Engineering & Mechanics Department, Drexel University, 3141 Chestnut Street, Philadelphia, PA 19104, USA
2
General Atomics-Aeronautical Systems Inc., 9779 Yucca Rd., Adelanto, CA 92301, USA
*
Author to whom correspondence should be addressed.
Appl. Sci. 2018, 8(9), 1490; https://doi.org/10.3390/app8091490
Submission received: 31 July 2018 / Revised: 21 August 2018 / Accepted: 24 August 2018 / Published: 29 August 2018

Abstract

:
The research presented in this article aims to demonstrate how acoustic emission (AE) monitoring can be implemented in an industrial setting to assist with part qualification, as mandated by related industry standards. The combined structural and nondestructive evaluation method presented departs from the traditional pass/fail criteria used for part qualification, and contributes toward a multi-dimensional assessment by taking advantage of AE data recorded during structural testing. To demonstrate the application of this method, 16 composite fixed-wing-aircraft spars were tested using a structural loading sequence designed around a manufacturer-specified design limit load (DLL). Increasing mechanical loads, expressed as a function of DLL were applied in a load-unload-reload pattern so that AE activity trends could be evaluated. In particular, the widely used Felicity ratio (FR) was calculated in conjunction with specific AE data post-processing, which allowed for spar test classification in terms of apparent damage behavior. To support such analysis and to identify damage critical regions in the spars, AE activity location analysis was also employed. Furthermore, recorded AE data were used to perform statistical analysis to demonstrate how AE datasets collected during part qualification could augment testing conclusions by providing additional information as compared to traditional strength testing frequently employed e.g., in the aerospace industry. In this context, AE data post-processing is presented in conjunction with ultimate strength information, and it is generally shown that the incorporation of AE monitoring is justified in such critical part qualification testing procedures.

1. Introduction

Current aircraft structural design and qualification methodologies require large amounts of testing in bottom-up type approaches that typically start at the coupon level and extend to full aircraft evaluation [1,2,3,4,5,6,7]. The prescribed assessment process is, therefore costly and time consuming, which additionally makes the adoption of new materials or design modifications difficult. This is especially challenging in the case of composite materials for which slight changes in manufacturing parameters can invalidate prior test data and require re-qualification of the material performance [8,9]. Typically, once extensive coupon testing is completed, design limit loads are computed for specific critical components. In this process, safety factors are added to account for reliability and uncertainty effects. Furthermore, pass/fail qualification criteria are implemented during component testing. This approach, however, limits the information that engineers can gather during full-scale part qualification testing that can be related to material performance.
In an effort to gather supplemental data, prior research has explored nondestructive evaluation (NDE) methods, including acoustic emission (AE), thermography, shearography, X-ray computed tomography (XCT), and ultrasonic testing (UT), for use during composite end-item qualification testing [10,11]. NDE data can, in general, augment existing structural test protocols by providing additional datasets, while also offering insight into damage initiation and progression. Modern NDE tools, however, have not yet been fully integrated into legacy aircraft qualification testing protocols, partially due to a lack of expertise, equipment, and knowledge on the usefulness of such methods, or even confidence that NDE could assist in this process. In this context, the U.S. Federal Aviation Administration has only recently proposed that the use of NDE tools for on-board structural health monitoring (SHM) could provide more confidence in complex aircraft designs while decreasing risk and maintenance costs [12].
AE is a NDE tool with the immediate potential to augment existing airframe strength test protocols, which is the focus of this investigation. Specifically, AE is a versatile, passive NDE method that senses pressure waves emitted from a variety of sources, predominantly linked to damage, across length scales and materials [13,14,15,16]. A physical analogue for AE is seismic activity resulting from tectonic plate motion of the Earth’s crust. Provided that the appropriate sensing equipment and data-processing is applied, AE can provide real time volumetric information about dynamic changes related to damage. Based on this method, material damage processes at the coupon [17,18,19,20], component [21,22,23,24], and structural [25,26,27] scales have been reported. AE datasets can be further leveraged for advanced analytics such as data-driven models and machine learning [28,29,30,31,32], which may lead to a validated SHM methodology with potential even to be applied on-board, e.g., on aircraft [33].
Structural monitoring using AE is most commonly found in civil infrastructure [34,35,36,37], where it can be employed to passively collect data while a structure remains in use. The AE method has also been applied in wind turbine applications to prevent catastrophic failure of the large composite blades [38,39,40,41]. In addition, there have been some attempts to use AE in aircraft structural monitoring and component testing. Both military and civilian aircraft examples have been reported [42]. Other aircraft-focused investigations have used AE to examine damage localization and ultimate failure in landing gear [43], assess skin-spar bond-line integrity [44], evaluate impact damage locations [45,46], assess damage modes in composite fuselage under complex loading [47], determine the failure modes in composite airframe parts under quasi-static and cyclic loading [48], and assess rotorcraft composite fuselage durability and damage tolerance [49]. However, more progress is needed to gain the confidence required to integrate AE into structural qualification test standards [50,51].
In general, AE analysis and post-processing can leverage the recorded waveforms and a number of useful parameters extracted from them. Common AE waveform parameters are described in Shull [13] and ASNT’s NDT Handbook [52]. Certain AE patterns can provide information about the test specimen’s structural integrity, beyond pass/fail load criteria. For example, AE activity may not be observed until load levels are reached that previously induced damage. Specifically, if a structure is progressively loaded, new damage may not be initiated until the prior maximum load has been exceeded. This observation is known as the Kaiser effect [13,53], which, however, may not hold for composite materials similar to those evaluated in this manuscript [54,55]. In cases where AE activity is detected at loads that are lower than the previous maximum, then a specific number is computed called the Felicity ratio (FR)—defined as the load at which significant AE reinitiates, divided by the previous maximum load. Materials that consistently emit AE at loads below their previous maximum, thus, have a FR value of less than one, and investigations have shown that they exhibit progressive damage behavior. In fact, changes in observed Kaiser and FR effects as well as other AE activity patterns have been correlated with the presence of damage [56,57,58,59].
Based on this introduction, this research seeks to evaluate the progressive failure of full-scale, composite aircraft spars using AE during structural testing, and associate such information with ultimate failure prognosis. The insight gained from AE is intended to augment current test methodologies in order to capitalize on readily-available data and decrease the time taken to qualify novel airframe materials. The overall approach described includes the following parts: (1) characterization of damage progression by examining AE activity trends; (2) identification of probable damage regions; (3) ultimate failure load prognosis; and (4) statistical evaluation of the spar static strength requirements using AE data.

2. Technical Approach

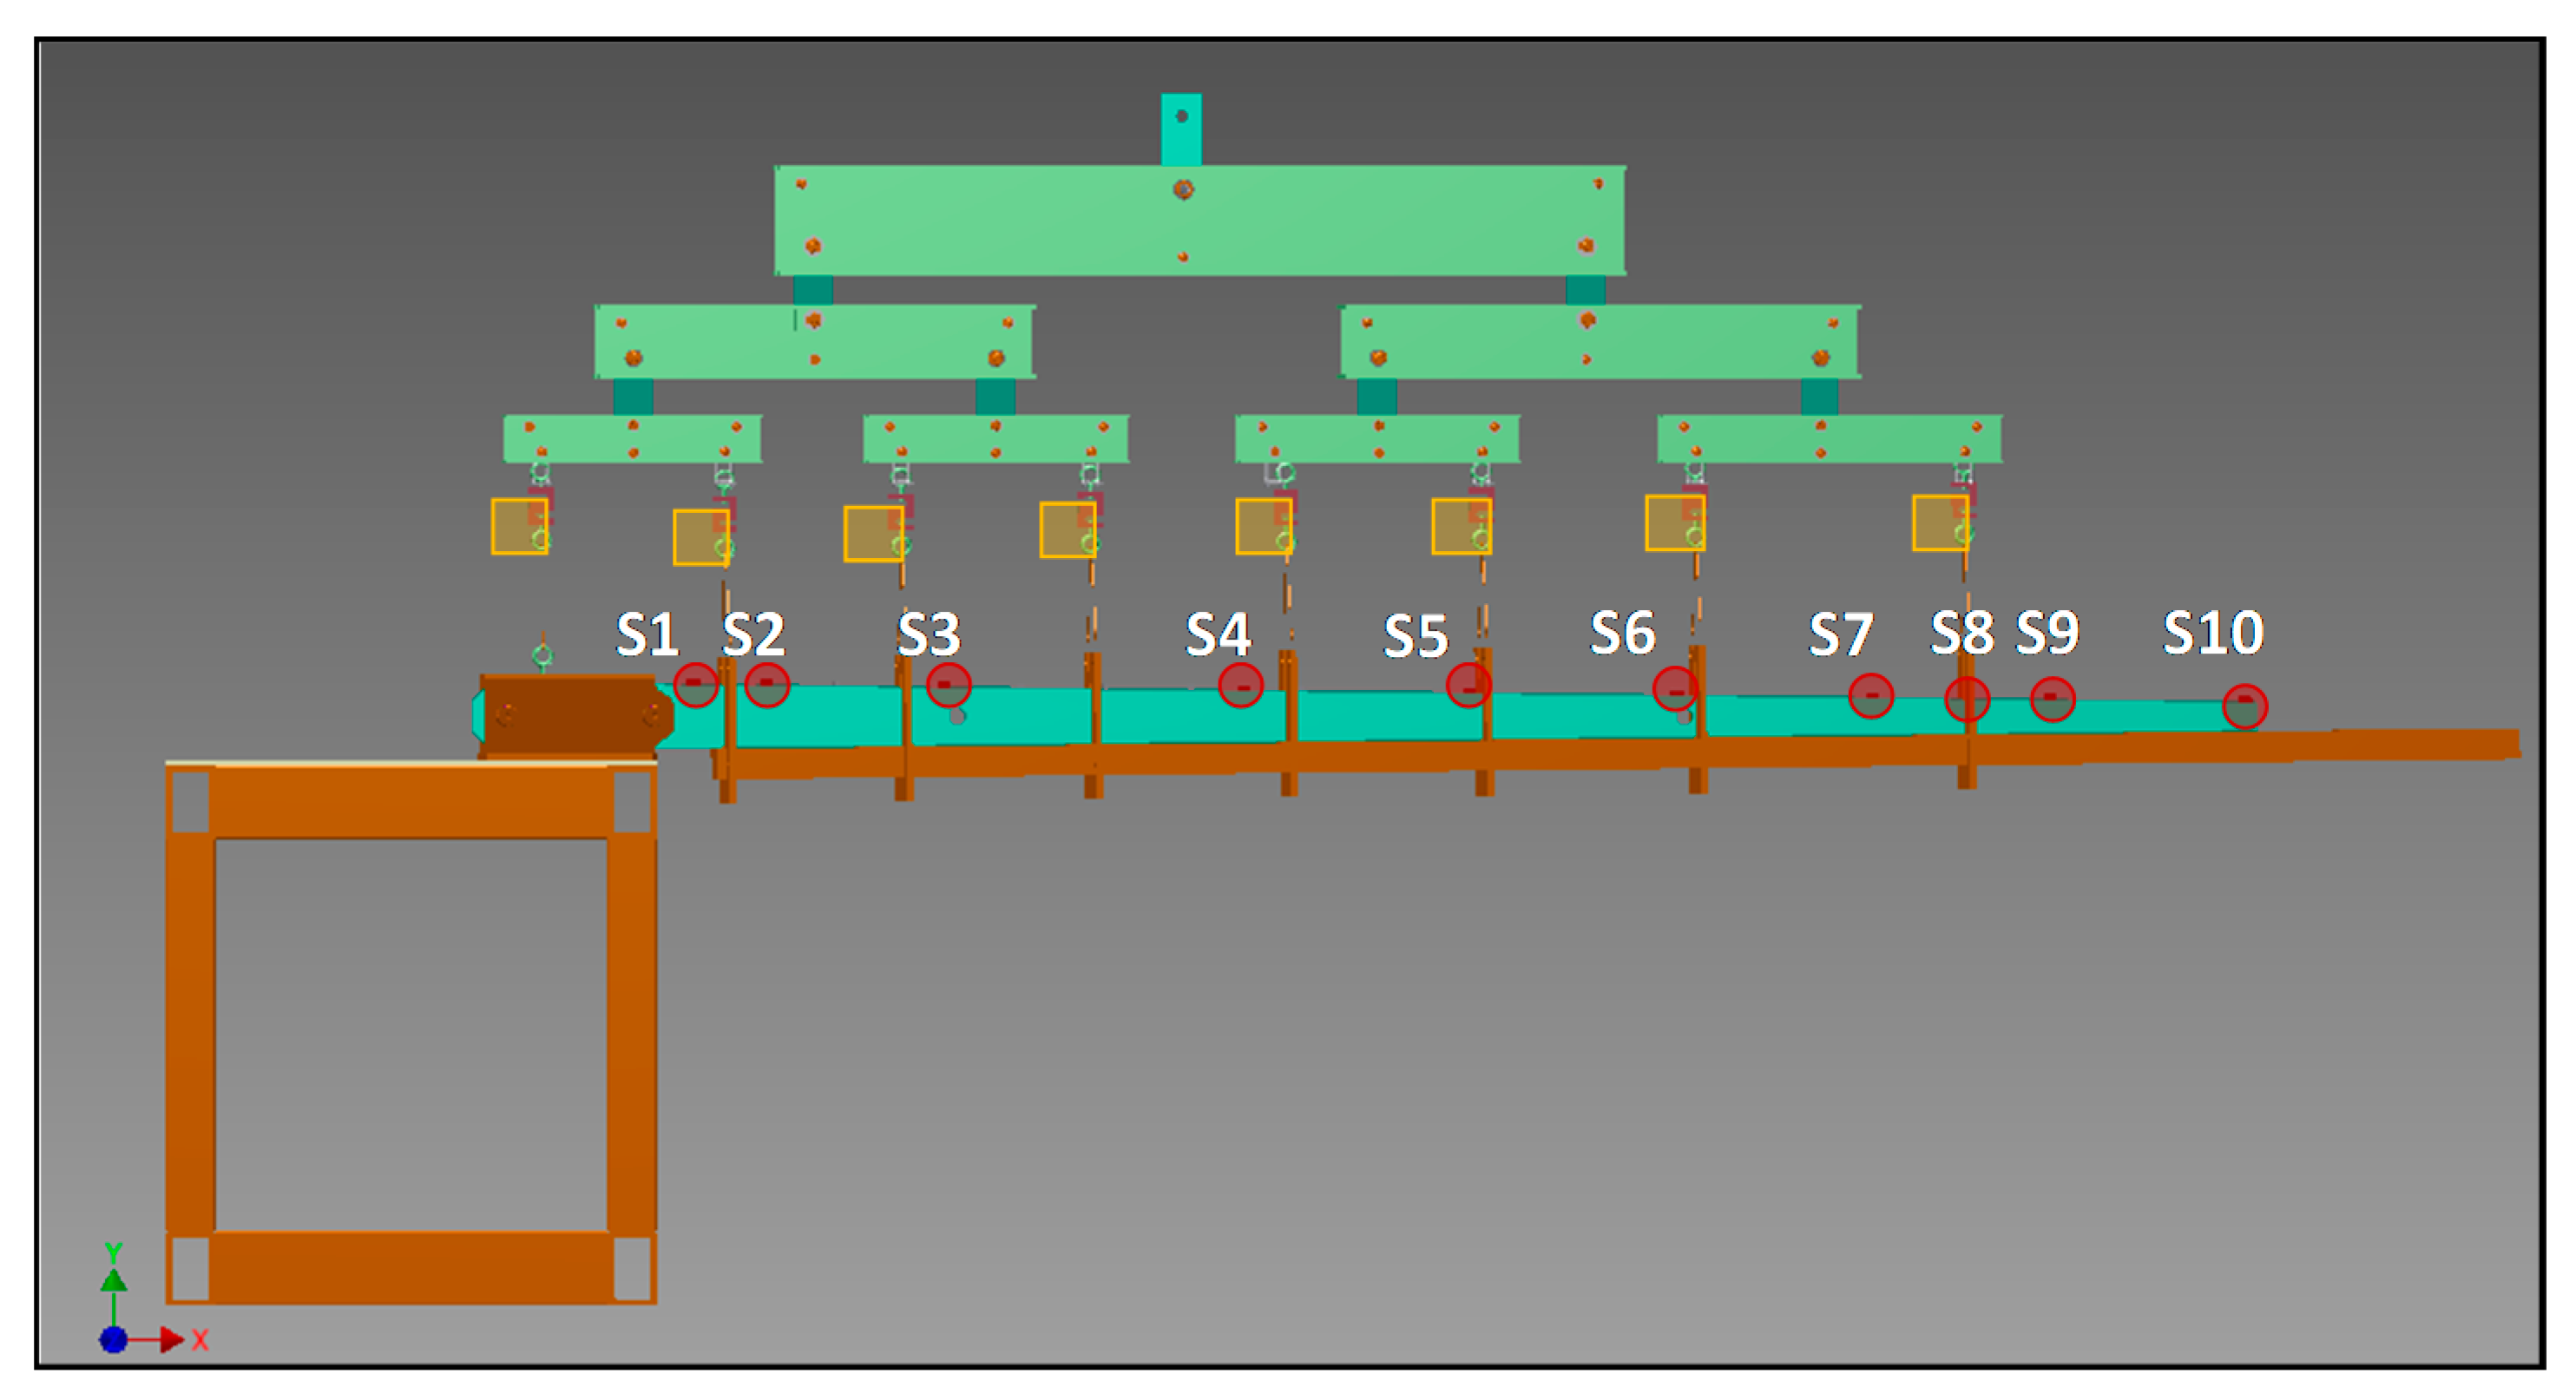
2.1. Experimental Setup

The testing methodology applied generally follows the MIL-A-8867C(AS) protocol [1], and it is similar to the wind turbine blade qualification testing approach [60]. Sixteen composite spars were tested to bending failure while instrumented with AE sensors. Load was applied to a cantilevered spar in a stepwise repeated (pseudo-cyclic) loading manner while test samples were monitored by an AE sensing network. All tests were performed with flight hardware bushings installed. Slack was taken out of the loading apparatus before the load was applied to a spar. A given load was applied with a load rate of approximately 200 lbf/s. Once the target load was reached, it was held for approximately 150 s and then released before the spar was loaded to the following load level. Care was taken to apply the load slowly and steadily, to avoid imparting sudden impact loading. The applied load was distributed in the spar using the “whiffle-tree” device shown in Figure 1; a concentrated crane-load applied at the top of the loading apparatus was distributed through a series of beams and connectors to the eight ribs on the spar test bed. The load was distributed along the spar at the locations indicated by yellow boxes in Figure 1. The spar was pinned in two locations at the root, and laid along the test bed. By loading in this manner, the highest shear stress and moments occurred at the spar root, while gradually reducing toward the spar tip, to accurately represent the load distribution observed by the component during flight. Four target crane-load levels were tested for each spar (identified in the text as LL1, LL2, LL3, and LL4). After the final target crane load was achieved, loading continued at a rate of 200 lbf/s until part failure.
Acoustic emission activity was recorded using eight to 10 commercially available R15I resonant piezoelectric sensors (operating frequency range of 50–400 kHz, manufactured by Physical Acoustics, Princeton Junction, NJ, USA), distributed along the top of the spar from root to tail. Sensors were placed on the top surface of the spar since the top surface showed less attenuation in pre-testing and the mounting surface was relatively flat. The approximate sensor locations along the length of the spar measured as a distance from the spar root are given in Table 1 for each of the 16 tests. It should be noted that sensor locations varied by several inches from test-to-test, while no data was recorded during the first test, which was used to validate the loading method.
Sensors were bonded firmly in accordance with ASTM E650 and secured with tape in order to minimize the sensor loss during ultimate structural failure. Sensor cables were also taped, and sufficient cable slack was left free to allow movement during loading, unloading, and failure. Sensors were placed with sufficient spacing such that signal attenuation would not negatively impact results and they were field-calibrated in accordance with ASTM E976/1106 using a pencil lead source.

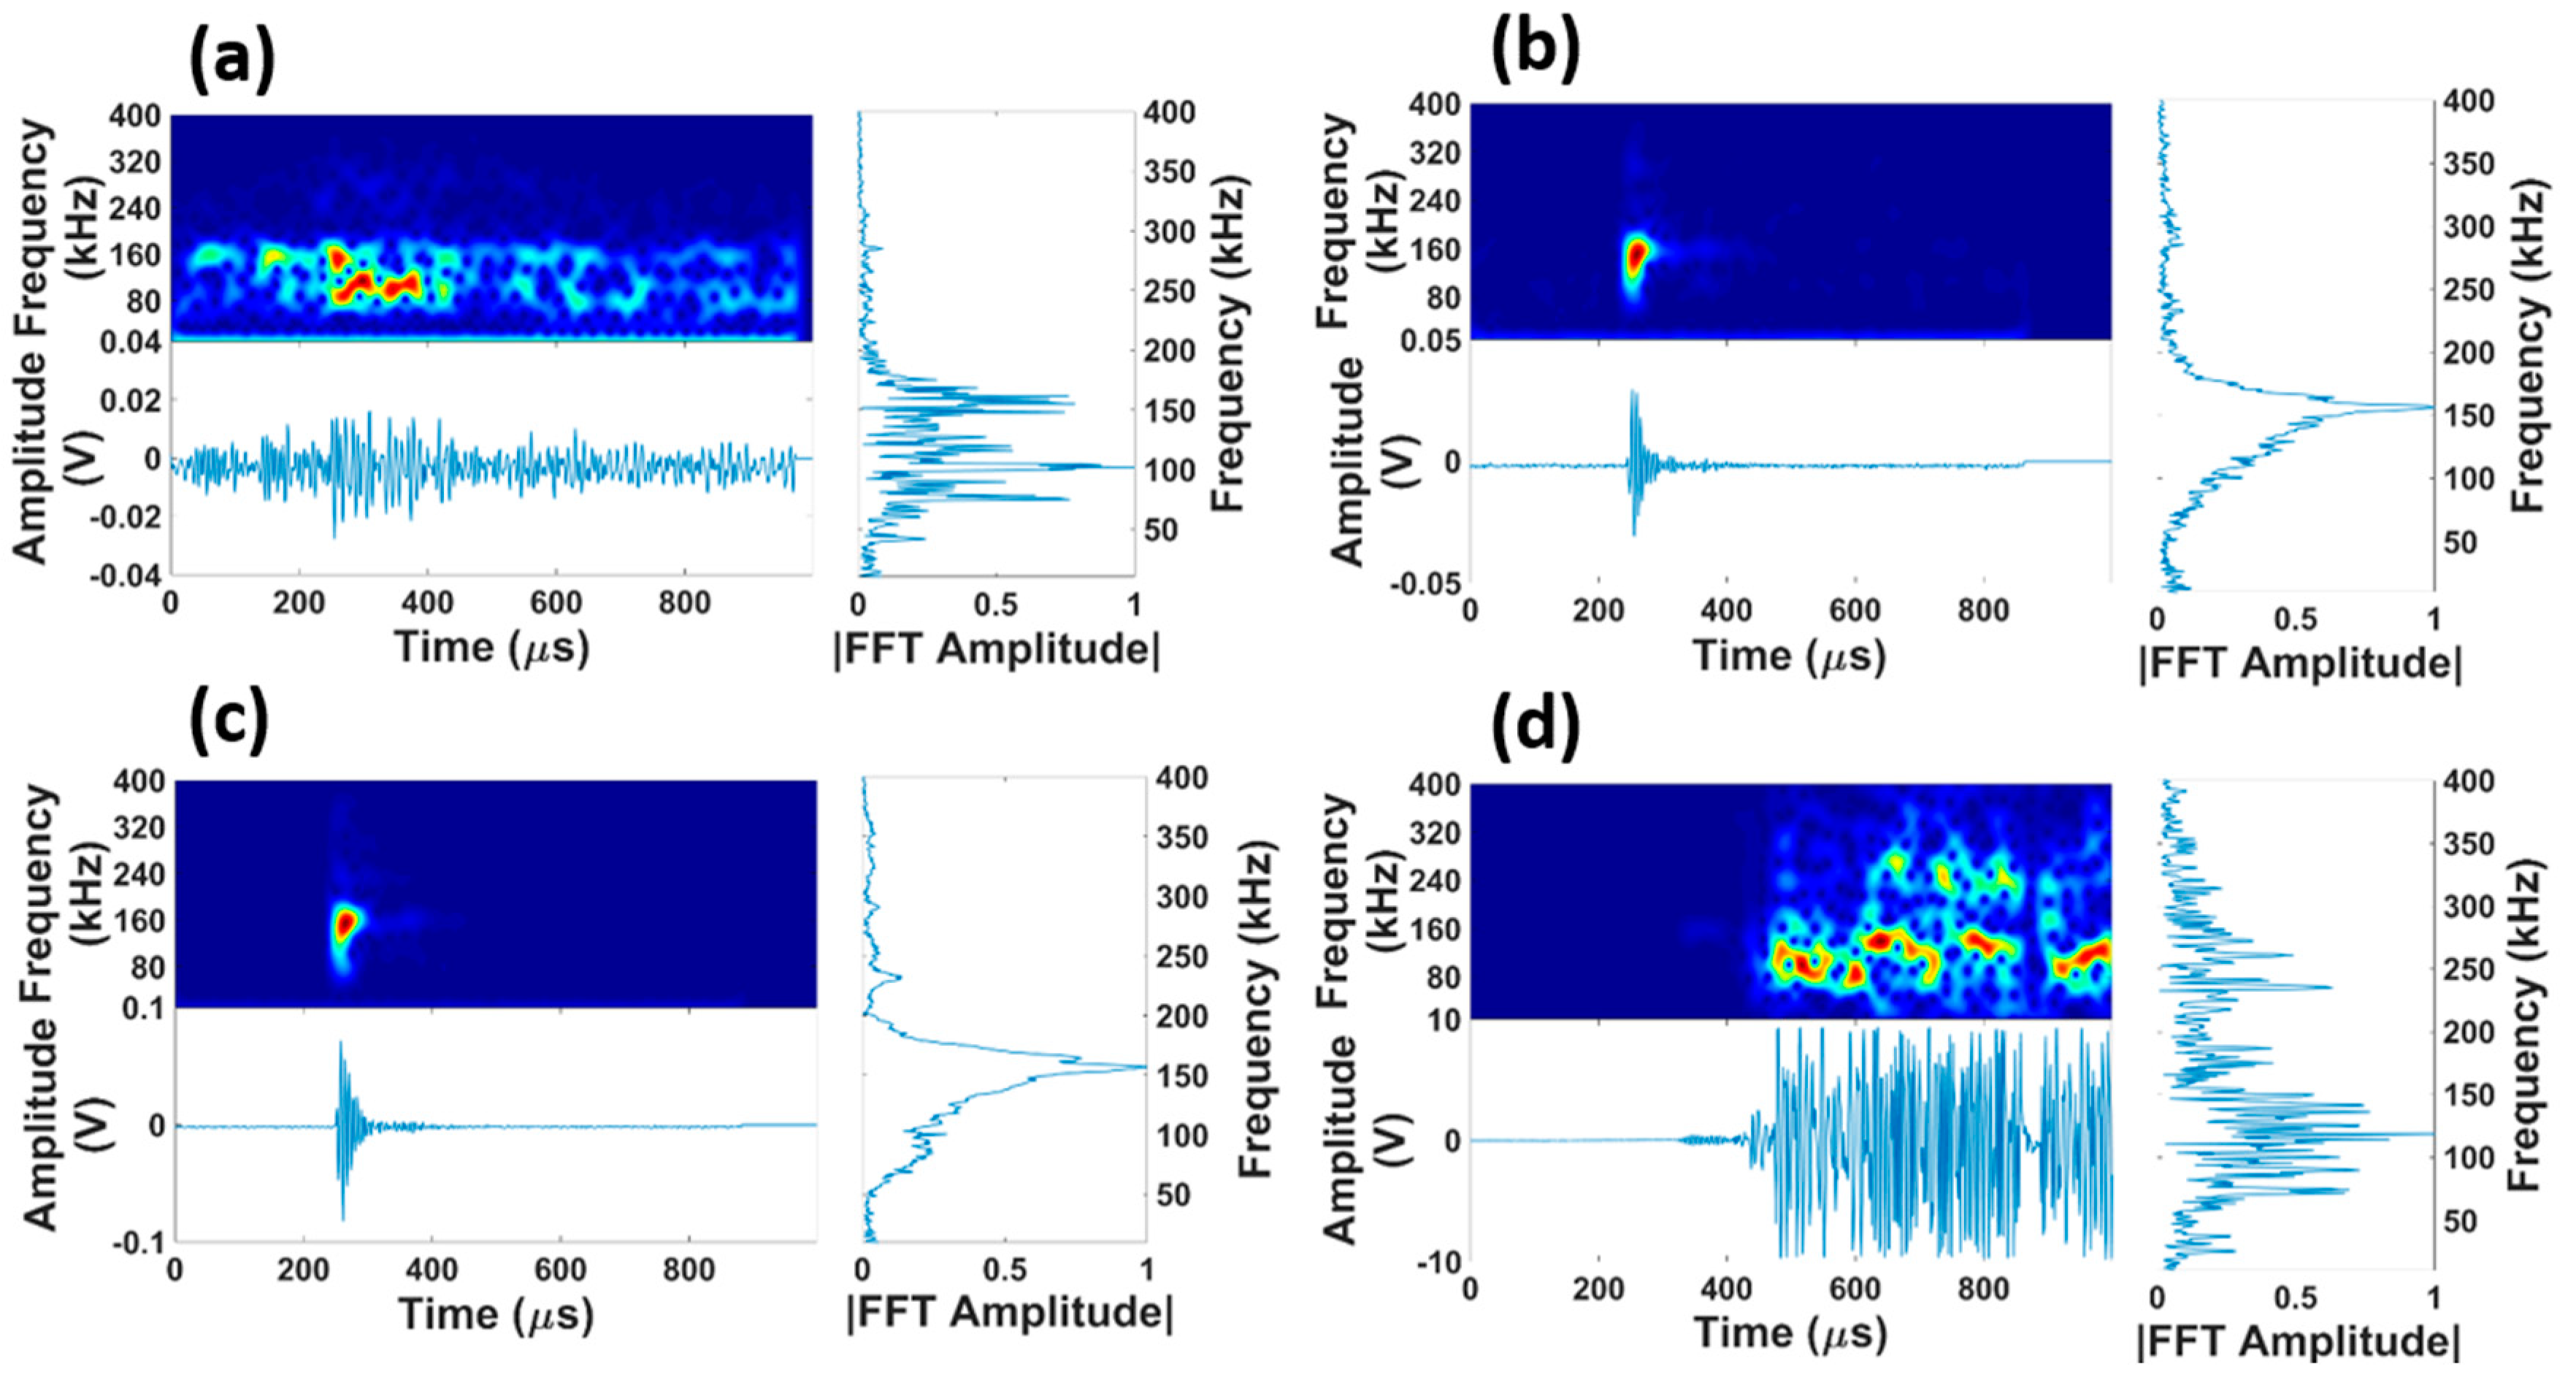
2.2. Data Acquisition and Processesing

AE signals were monitored and recorded using a Physical Acoustics PCI8-Express data acquisition board. Prior to testing for record, pre-tests were conducted to calibrate the AE sensors, determine sensor placement, rehearse the test procedure, and collect noise data. Ambient noise levels and the effect of the loading fixture (e.g., friction) were tested and adequately controlled via test procedures (e.g., slow and steady load application, lubricated connections, etc.). In addition to the procedural controls, the data acquisition amplitude threshold was set above the noise floor and AE hit (i.e., wave packet) record timing parameters were set to minimize typical noise waveforms recorded during pre-testing. AE signals were uniformly pre-amplified across all sensor frequencies using 40 dB sensor-internal pre-amplification. Crane load-cell data was synchronously collected and correlated with AE signal data to aid in AE activity trend observation.
As an example of the collected AE activity, Figure 2 showed representative waveforms collected from Test 8. Specifically, Figure 2a shows a low amplitude continuous AE signal, which is representative of noise recorded under zero load and demonstrably different compared to the burst-type signals typically associated with damage observed in Figure 2b,c. Figure 2b is an example of the type of AE signal recorded during the loading step, while Figure 2c shows an example of the type of waveforms recorded during unloading. In addition, Figure 2d shows the highest amplitude signal that was recorded at the time of final failure. Figure 2b,c both show similar wave characteristics including a burst of energy that occurs at 150 kHz while the signal obtained under no load showed that its energy was distributed across many frequency values, similar to the final fracture signal, which however, had significantly higher amplitude and broader frequency content.
As mentioned in the introduction, in general, there were two main AE data analysis approaches. The first leveraged the full recorded waveforms and the second relied on post-processing extracted features from such waveforms. For the analysis presented herein, raw AE signals similar to the ones shown in Figure 2 were parameterized via MISTRAS Group Inc. Noesis software (version 5.3, MISTRAS Group Inc., Princeton Junction, NJ, USA). The authors examined extracted AE features correlated with load data, including amplitude and absolute energy, to analyze AE activity trends and draw conclusions. AE signal energy was conceptually represented by the area under the rectified waveform, and was practically computed for discrete signal data by summing the square of the voltage amplitude over the signal length. To arrive at absolute energy with appropriate units (aJ), the squared voltage amplitude was further divided by the reference impedance over the signal duration. The cumulative absolute energy was the sum of the absolute energy for each AE hit, across all recorded hits during a test. The authors used this feature to characterize the test item performance, as it related to damage accumulation and ultimate failure. Additionally, the authors calculated the FR by identifying the load at which AE activity re-initiates during a loading cycle, divided by the previous maximum load reached. As discussed in the introduction, FR values less than one have been correlated with damage, and hence the authors used this parameter to further assess spar behavior.

3. Results and Discussion

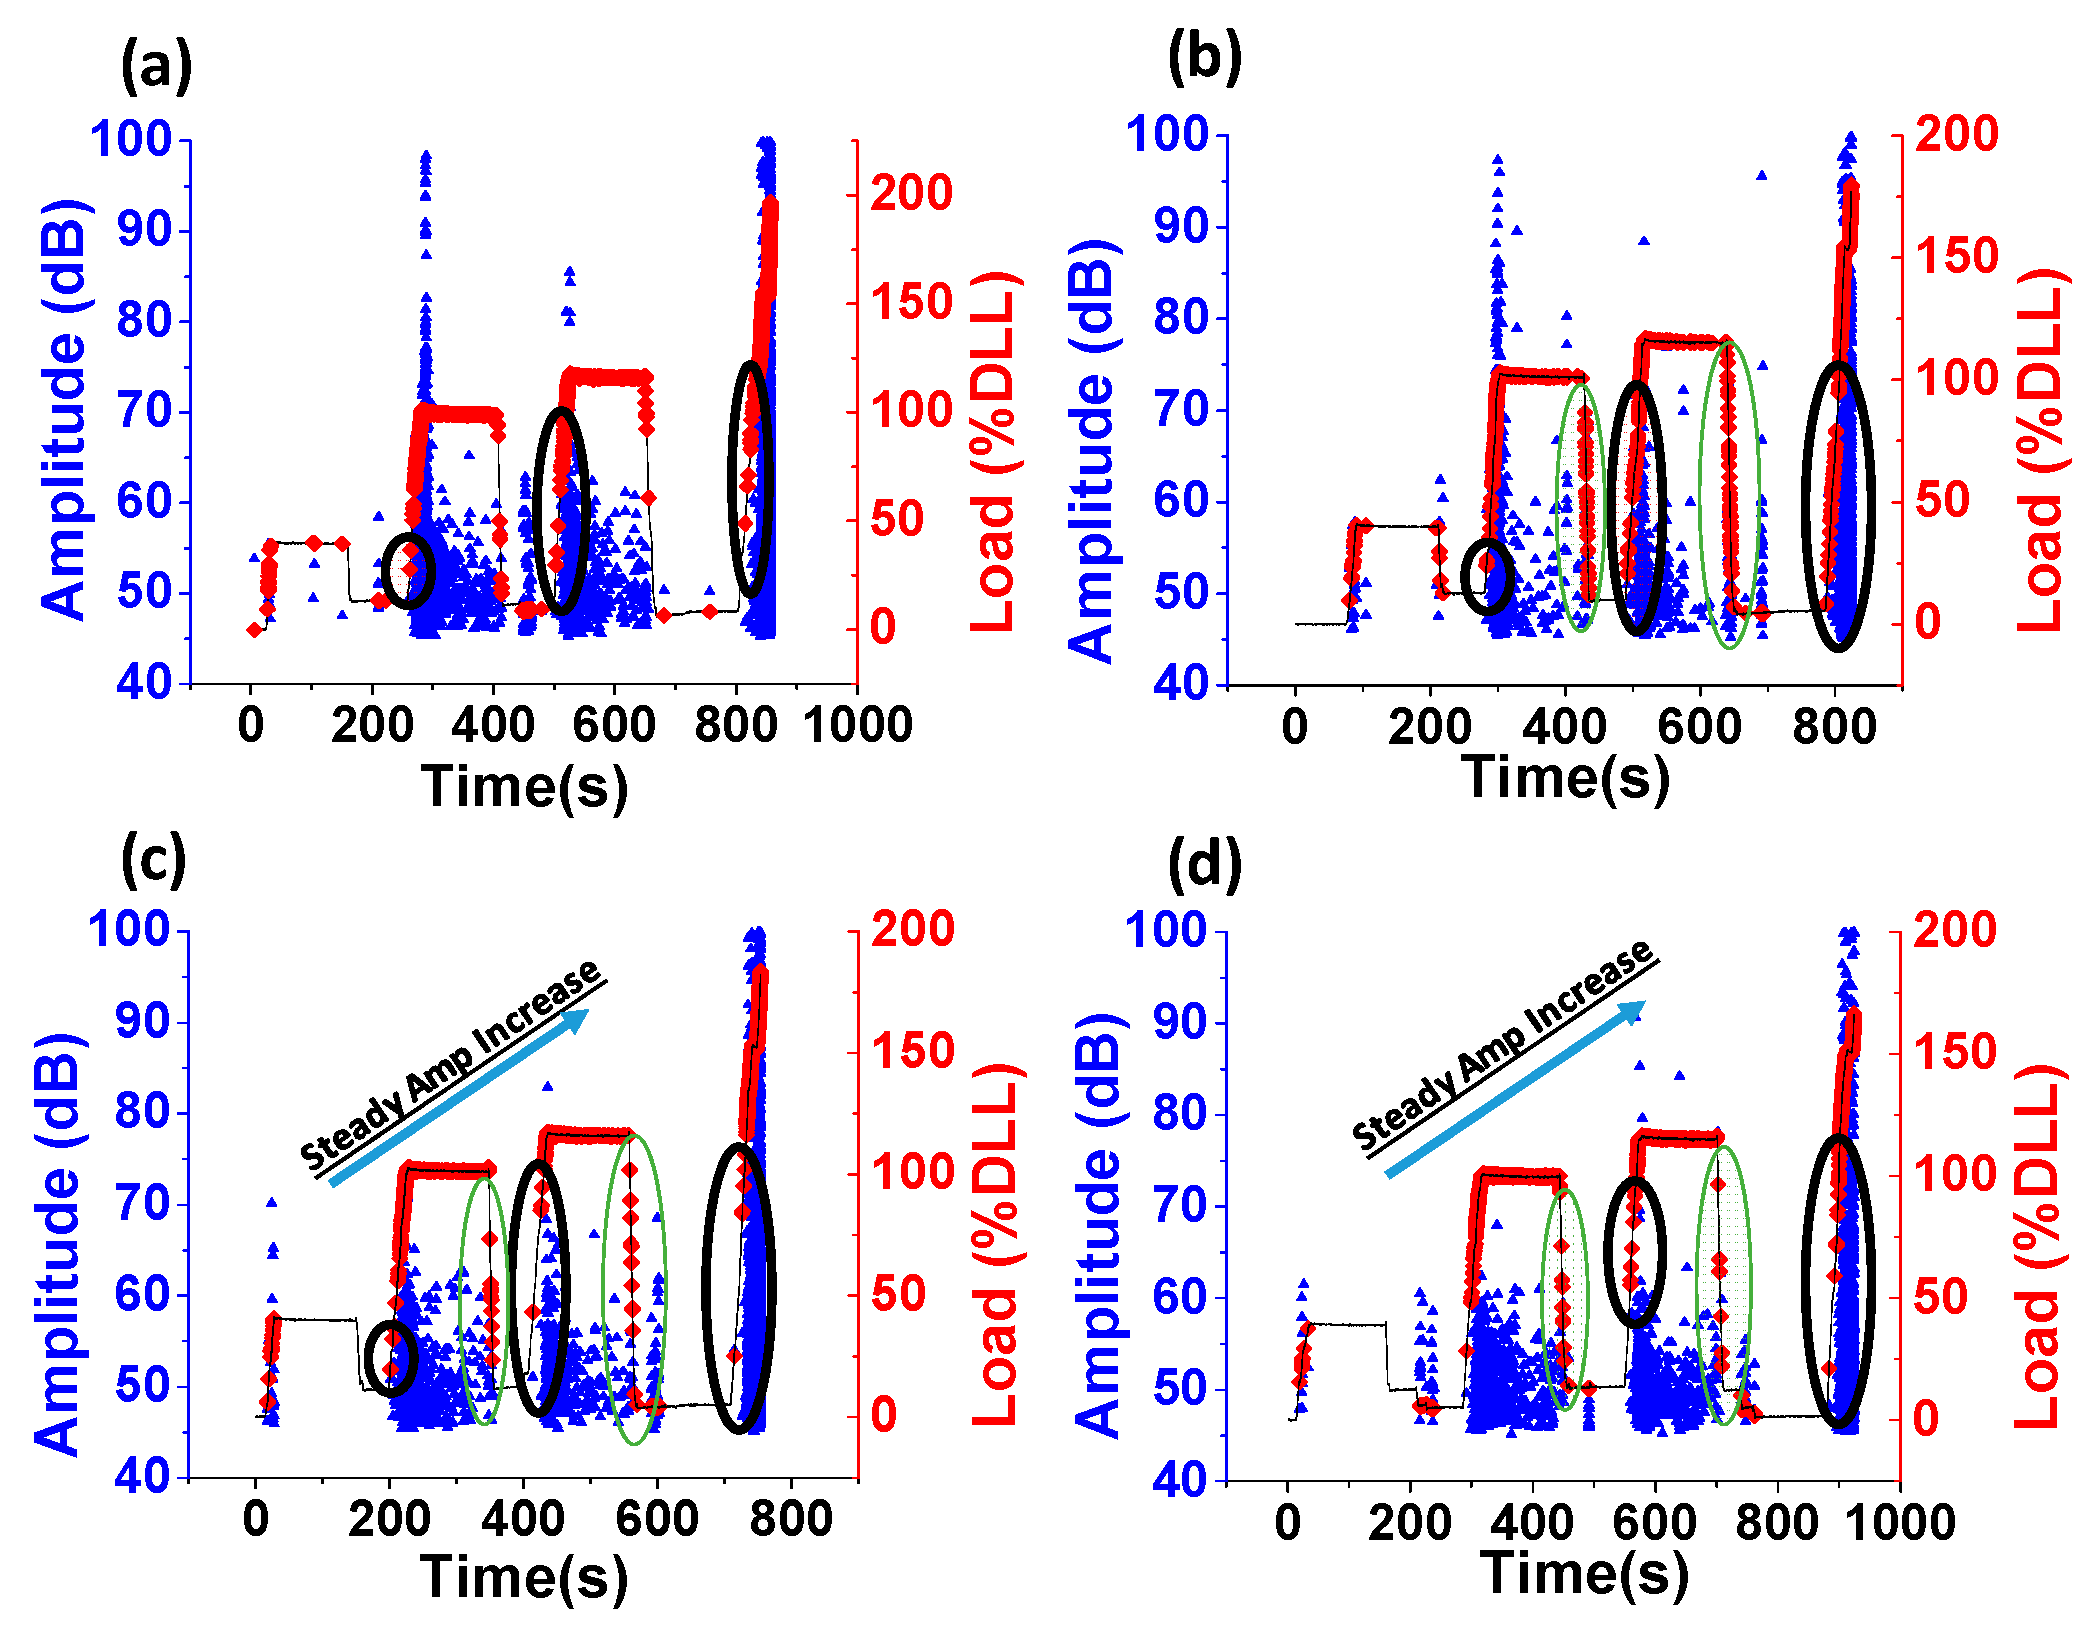
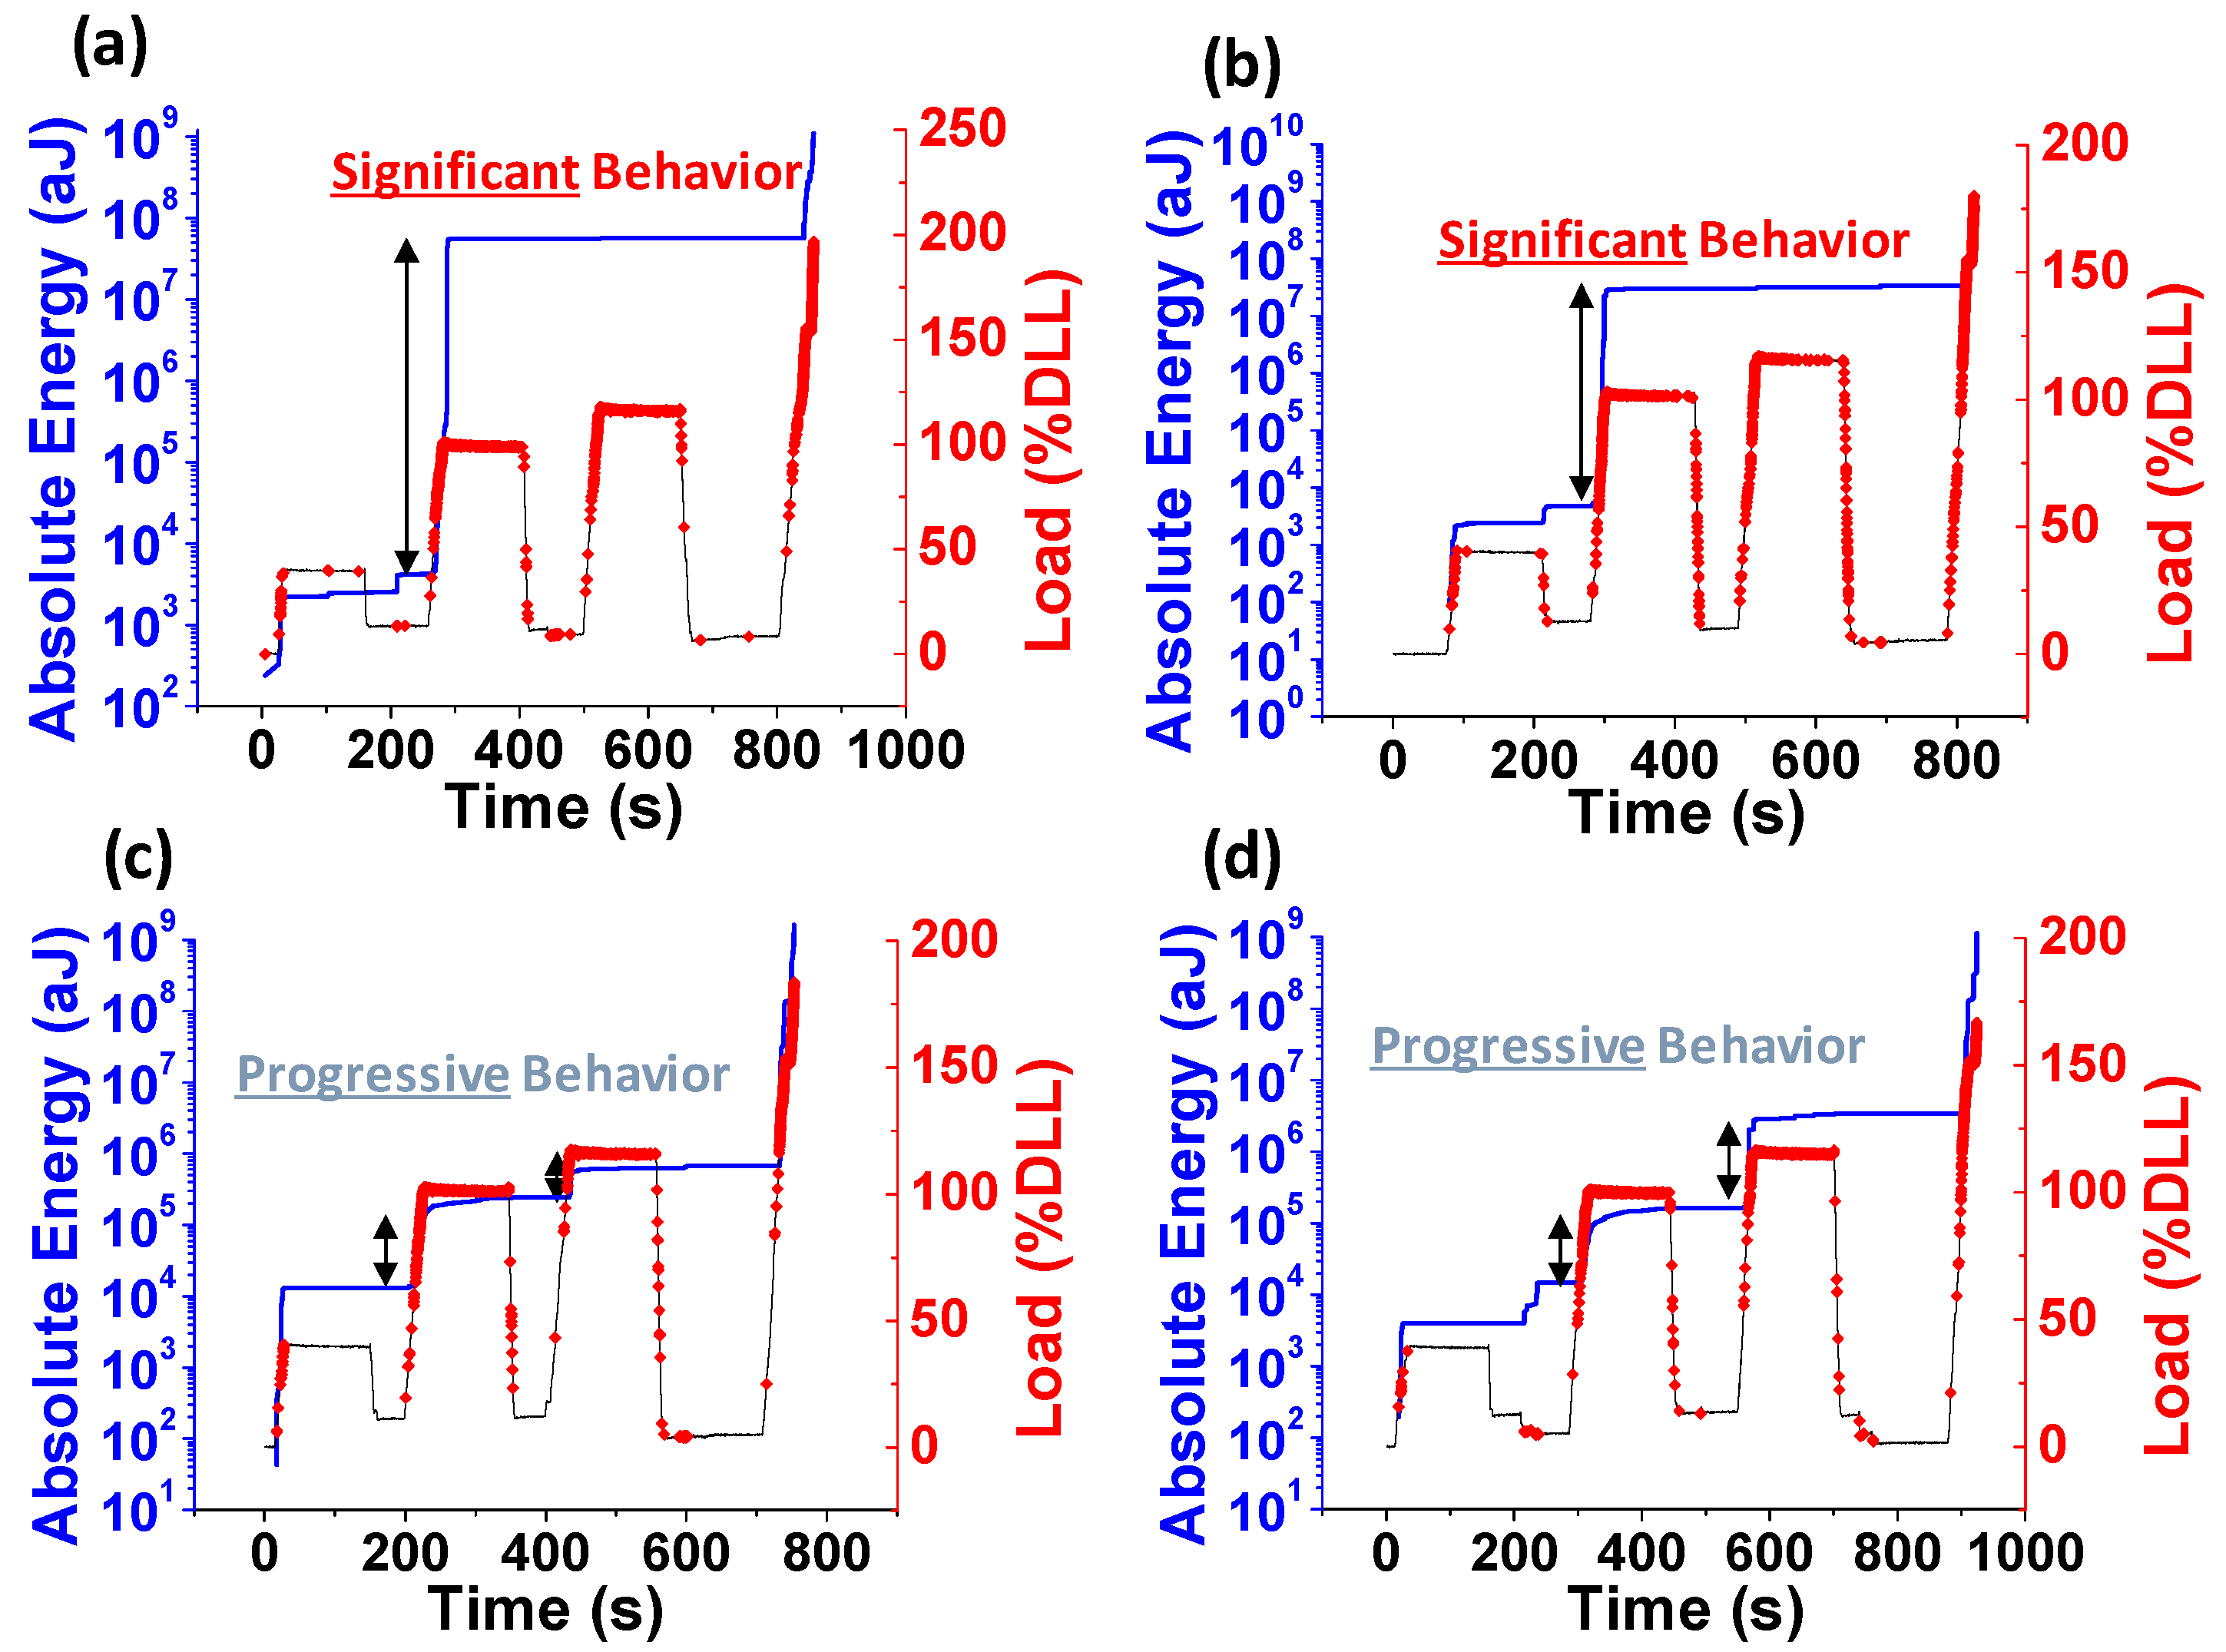
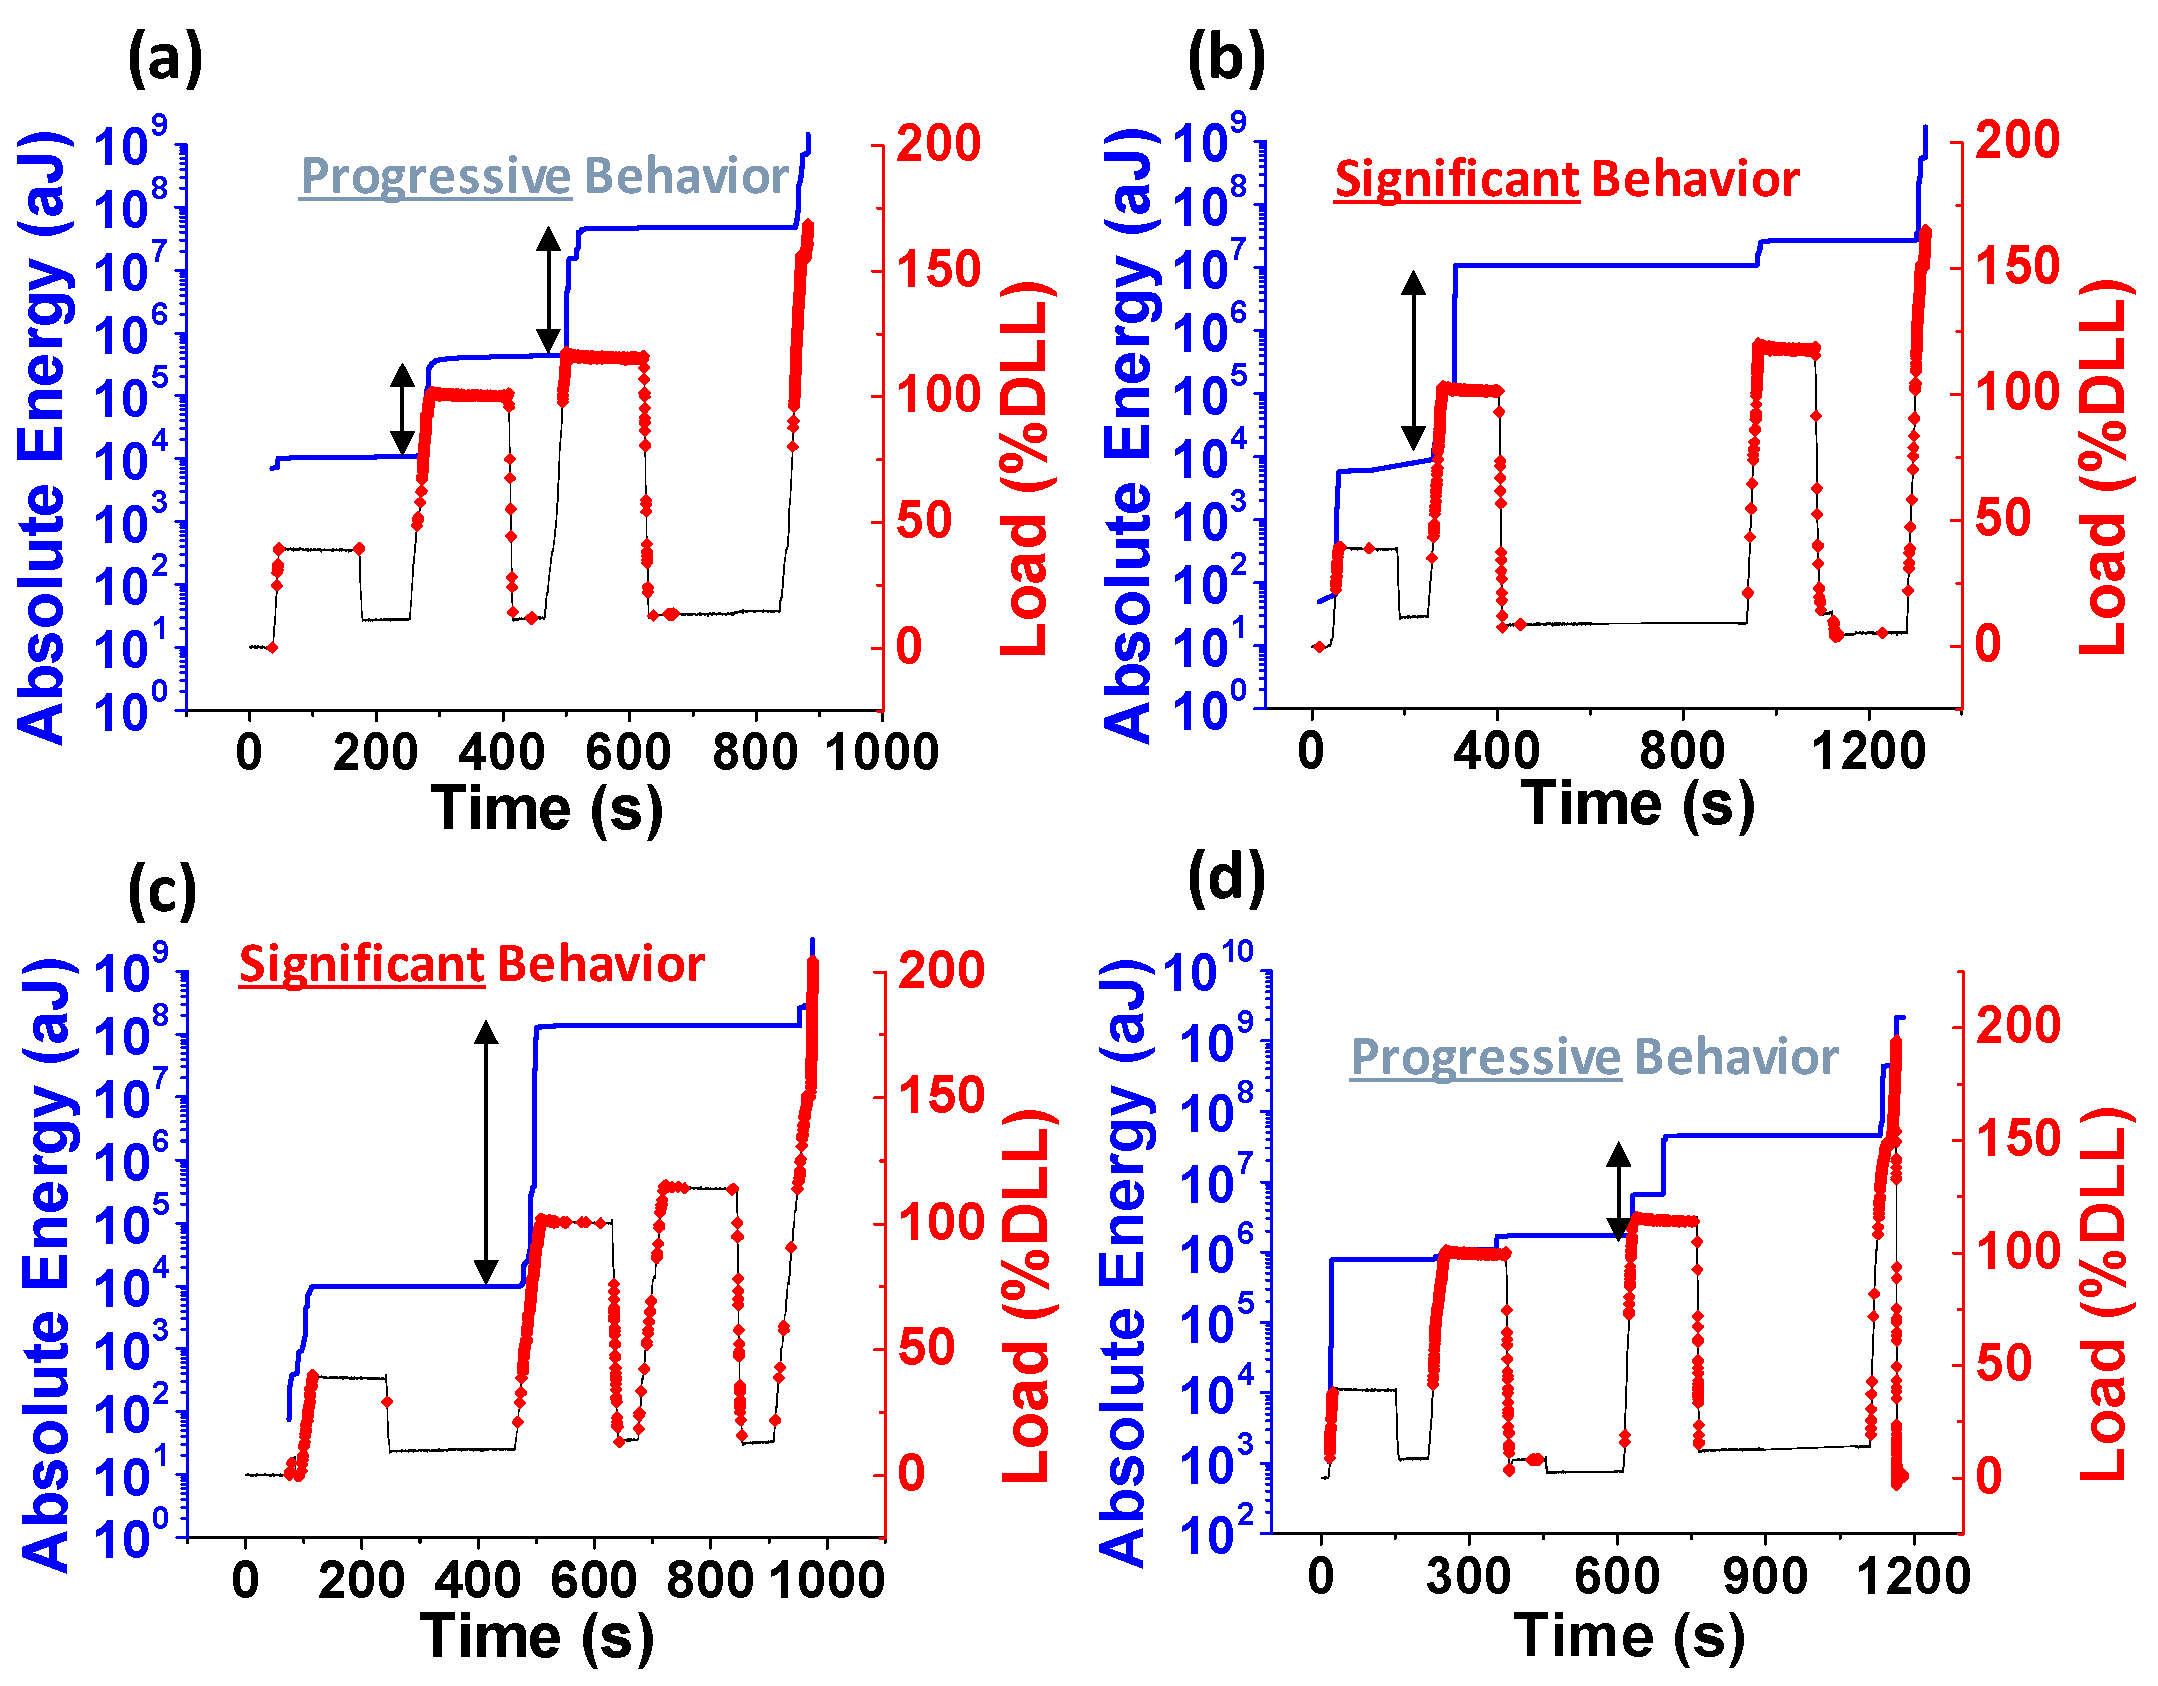
3.1. Progressive Damage Characterization

Acoustic emission activity trends were used to infer progressive damage during pseudo-cyclic loading of the composite spar test specimens. Representative AE data is provided in Figure 3 for four different spar tests; the grey line provides the applied loading, while the red diamonds represent the recorded AE events correlated with the corresponding load values at which they occur. In addition, the blue markers indicate the AE activity amplitude distribution. To complement the graphical AE data trends, FR values were calculated and are reported in Table 2. All reported cases showed some AE activity prior to achieving the previous peak load, in accordance with the Felicity effect. However, Figure 3a,b shows AE events at comparatively lower loads, marked by black ellipses, compared to the test cases in Figure 3c,d. Additionally, in Figure 3b–d, it is noticeable that AE events occurred during the unloading portion of the second loading sequence. AE events during unloading can indicate the presence of damage [13,33,47,54,56], and are highlighted by green ellipses in Figure 3. Furthermore, the amplitude distributions in Figure 3a,b show relatively large spikes during the second cycle with values greater than 95 dB, while all other activity is below 70 dB for both Test 14 (Figure 3a) and Test 8 (Figure 3b). Sudden spikes of high-amplitude AE activity can correspond to material damage initiation or progression. In contrast, Tests 10 and 4 (Figure 3c,d) show a gradual increase in amplitude with each loading sequence. Based on the information presented in Figure 3 and Table 2, it can be concluded that the presented AE data visualization as a function of applied loading, in combination with the FR analysis, can provide some preliminary assessment of test item damage progression. Specifically, damage appears to initiate after the second target load (LL2) for most tests, as indicated by both the FR values, as well as the appearance of significant AE activity in the unloading portion of the applied cyclic loading. Furthermore, two distinct AE dataset classes existed among the 16 tests, including those that showed some abrupt and high-amplitude activity starting early in the loading sequence (e.g., Figure 3a,b) and those that demonstrated a more gradual AE activity, which was expected, as the loading increased with time.
Supplemental to the AE activity trends shown in Figure 3, cumulative absolute AE energy is plotted against crane load in Figure 4. In all loading cases observed in Figure 4, the cumulative AE energy increases during loading, while remaining relatively constant during load holds and unloading. Similar to the AE amplitude spikes shown in Figure 3a,b during the second loading sequence, Figure 4a,b show corresponding jumps in AE energy. Such AE energy accumulations are observed in subsequent loading cycles, but they are orders of magnitude lower. Note that the observed pattern in Figure 4a,b is strikingly different from the results shown in Figure 4c,d. Accordingly, the recorded datasets were classified as significant vs. progressive in terms of the corresponding spar behavior. Specifically, Figure 4a,b is characterized by a sudden, dominant, discontinuous jump in AE energy, while Figure 4c,d is characterized by a gradual AE energy accumulation that appeared to be proportional to the load increase. Hence, the gradual cumulative AE energy profile observed in Figure 4c,d was classified as “progressive” (damage) behavior, in contrast to the large spikes (>103) displayed in Figure 4a,b, which were classified as “significant” behavior. Note that composite materials are known to exhibit progressive damage behavior and, therefore, test items that depart from this expected behavior (e.g., high intensity AE activity early in the loading cycle) may indicate design, production, or loading conditions that could lead to an early onset of catastrophic failure (i.e., lower ultimate load) when compared with similar parts.
Similar trends were observed in all tested spars, and the behavior was classified as progressive or significant based on the cumulative absolute energy patterns noted in Figure 4. For example, Figure 5 shows four additional spar tests to further demonstrate the identified data trends using the same 103 aJ energy increase to denote the behavior as significant.
Felicity ratio values for all spars at each loading step are given in Table 2. Most test specimens resulted in FR values below 1.0 and above 0.9. Noted exceptions are Test 8 and Test 9, both of which displayed the lowest FR values and further exhibited significant behavior during LL2. Interestingly, the spars that had the lowest FR values still resulted in near-average ultimate load. It should be also noted that some high FR spars failed at lower loads than those with lower FR values, potentially suggesting that these spars may enable damage distribution that leads to higher ultimate loads. In contrast, spars with higher FR values may potentially have less damage (which could not have been confirmed during testing as tests were not interrupted for post mortem inspection), however given that some of these spars failed at lower loads, damage in them is expected to be more localized and near the actual failure zone.
It can be inferred from the parametric AE data trends presented herein that, generally, appreciable damage initiates once the design-limit-load (LL2) is reached, which further progresses until ultimate failure. In conclusion, the AE parametric analysis presented provided additional insight into damage progression and sample-to-sample variation that may otherwise be undiscernible using traditional test methodologies. For example, note the AE energy profile in Figure 4d, Test 4. This particular spar showed progressive damage, with a higher comparable FR value averaging 1.00 over all three loads. It may appear that something about this spar e.g., its design, production, or loading parameters, provided an advantage in controlling damage progression that resulted in achieving a higher ultimate load. By correlating spar-to-spar differences in damage behavior as indicated by AE data with structural testing, production or design data, additional value can be mined from such nondestructive evaluation, which may support design or process improvements.

3.2. Identification of Probable Damage Regions

As determined during pre-testing, AE wave propagation velocity fluctuated across the length and among the different spar faces due to structural and material variations; therefore, a zonal technique based on AE hit amplitude was used to identify regions along the spars related to onset of damage. The AE sensors were distributed along the length of the spar, on the top surface, in order to achieve sufficient “zonal” coverage from root to tip (recall Table 1). The authors examined high amplitude AE hits recorded by certain sensors for which the locations are known. If a sensor had a relatively high concentration of high amplitude AE hits, the sensor “zone” was considered the “critical region” as a first order approximation to damage location. For the preponderance of the test cases, high AE amplitude behavior was observed in sensors near the spar root. As noted in Table 3, the most commonly identified was Sensor 2 (S2), which was located approximately 6–13 inches from the closest root pin. Failure near the root was anticipated, due to the loading and design of the spar. Prior testing experience indicated that common failures may be in the form of cracking or buckling of the shear web, and/or bending of the cap near the spar root. These types of damage matched the failure modes observed in similar cantilevered wind turbine blade tests [39,41].

3.3. Ultimate Failure Load Prognosis

In an effort to perform ultimate failure load prognosis, the ultimate failure crane-load for each spar was correlated with AE activity. Extracted features from the recorded AE signals were used to compare the progressive failure of the composite spars, and to infer similarities and differences among them. The results for all spars were tabulated in Table 3 and ranked according to the ultimate load value. The target crane-load for the first damage signal, the estimated load at first AE damage signal, the AE energy behavior (classified as either progressive or significant behavior based on the cumulative AE energy profile), and the critical region defined by AE sensor locations with high-amplitude AE hit concentrations are given for each spar. All load values are defined as a percentage of the design-limit-load (DLL). Significant AE energy behavior was defined as a jump in the cumulative absolute AE energy distribution of at least 103 aJ.
Although variability is observed in all listed parameters, some patterns emerged in the information presented in Table 3. As mentioned previously and supported by the analysis of multiple AE parameters, the majority (10 out of 16) of the first damage signals occurred during the second target load of 100% DLL. It appeared reasonable to observe the damage initiation and progression once the spar limit load was reached. Notably, three of the spars did not show the first damage signal until the final loading sequence reached the target load of 150% DLL. All three of these spars displayed progressive damage behavior based on their cumulative AE energy profiles. Despite the apparently controlled damage progression, this did not result in the three highest ultimate loads. The highest recorded ultimate load resulted from delayed damage initiation and progressive damage behavior, but the next two highest showed earlier damage initiation and significant damage behavior. This uncertainty suggests that there are other factors that may additionally influence the ultimate load prediction.
The estimated crane load applied at the time of the first AE damage signal and the target crane load value were given for comparison, showing that initial damage was often observed prior to reaching the maximum load for that cycle. Moreover, 11 out of the 16 spars tested exhibited significant AE energy behavior, rather than a progressive behavior, making the appearance of the first damage signal more critical than is the case for the progressive energy accumulation. Critical region examination by AE zonal location revealed that 12 out of 16 spars experienced the majority of high-amplitude damage signals near Sensor 2, which was located approximately 6–13 inches from the spar root—as expected given the cantilever load profile. Only a few spars (four out of 16) showed a critical region other than Sensor 2, and one case (Test 2) recorded multiple critical regions, indicating widespread damage, which led to the lowest recorded ultimate load.

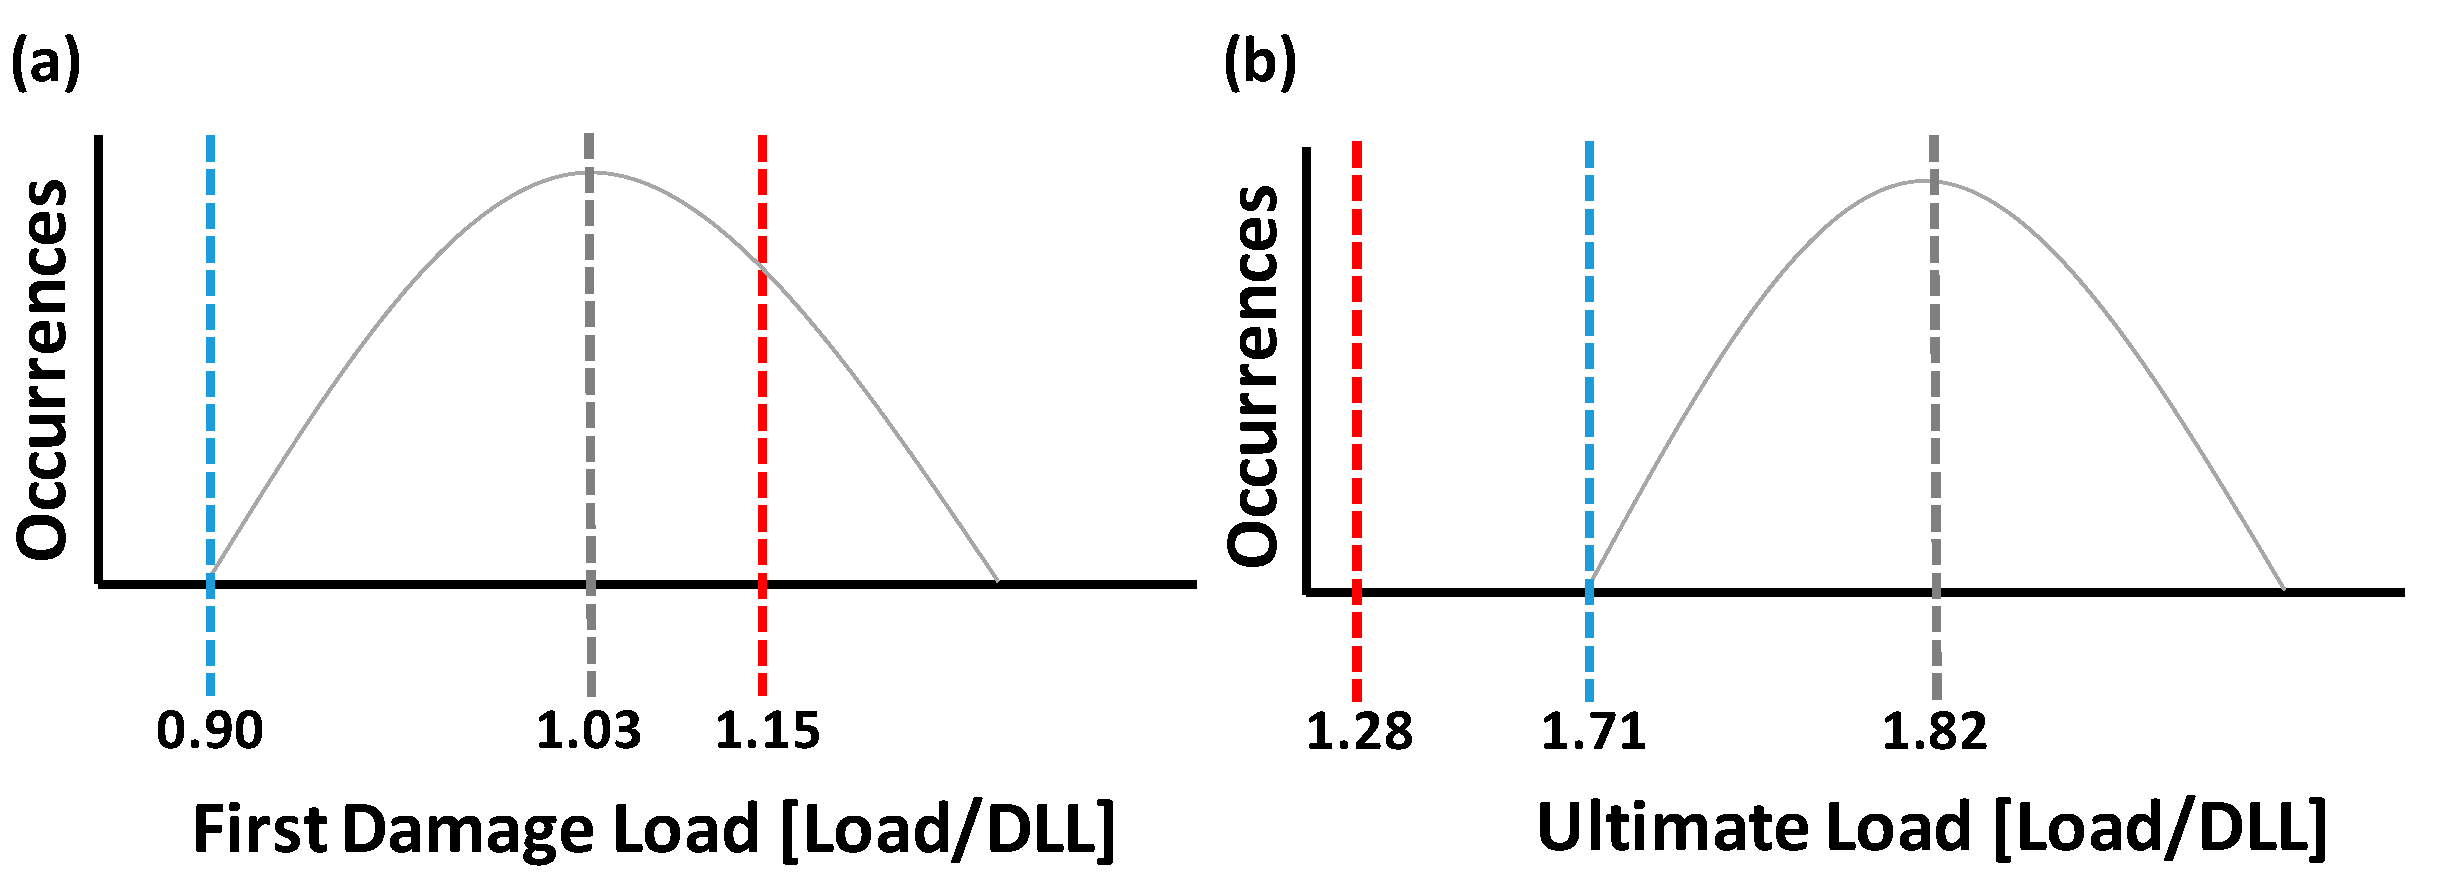
3.4. Statistical Static Strength Assessment

To qualify for use on specific aircraft, spars were required to support 115% of the DLL with no permanent deformation, while being capable of supporting 150% of the DLL with no failure. For this test, failure was defined as a 30% drop from the maximum load. Assessing a strength criteria beyond this unidimensional pass/fail condition may provide additional feedback that can be used to evaluate spar behavior across a sample set. For example, the traditional pass/fail test only indicates that a group of spars meets or does not meet a threshold. In this case, the pass/fail classification may not allow for sufficient discretization to determine that one of those spars may have exceeded the criteria significantly. Hypothetically, that spar may have displayed certain favorable progressive damage characteristics that would predict its higher strength. Knowing that extra information could allow for the part production parameters to be studied, and lessons learned to be applied to the next production lot, thus continuously improving part quality.
In order to use the proposed statistical tests, the AE data distribution was examined and verified to follow a normal distribution using the Lilliefors test, a method employed when the population mean and standard deviation is unknown [61]. The Lilliefors analysis was executed using MATLAB R2017a (The MathWorks, Natick, MA, USA), and the results of the normality plot are shown in Figure 6. Both the first damage signal load and spar ultimate load followed a normal distribution (failed to reject the null hypothesis at a 1% significance level).
Probabilistic assessment (e.g., hypothesis testing) can give additional part performance insight, and the multi-dimensional AE datasets used in this research enable the use of statistical analysis methods. As an example of how AE data could be used to evaluate composite test article performance, a one-sided hypothesis test and lower confidence limit (LCL) was applied to assess both spar strength requirements. Summary statistics for both datasets are listed in Table 4, and are representatively displayed in Figure 7 for comparison.
The lower confidence limits serve as average predictions for the lowest probable load where damage may initiate and the lowest probable ultimate load, respectively. They could potentially be used as a bound in statistical process control, or as quick indications of part lot performance from a “weakest link” perspective. Alternatively, upper confidence limits (not shown) could also be used to identify spars that perform exceptionally well during testing.
To evaluate spar strength requirements explicitly, the hypothesized population mean was first determined based on the requirement descriptions. Estimated crane-loads at the first AE damage signal were used as an interpretation of the “support 115% design limit load (DLL) with no permanent deformation” requirement, and ultimate loads were used to evaluate “support 150% DLL with no failure”. Therefore, the null hypothesis for the first strength requirement was that the first damage signal population mean is equal to 1.15 DLL, and the alternative was that the first damage signal population mean is less than 1.15 DLL. In other words, the analysis was run to examine whether if on average, the first damage signals occurred at or below 1.15 DLL for the total population of spars, given the tested sample population. Figure 7a shows the requirement distance from the sample mean and the sample LCL, schematically. The analysis was run in MATLAB, and the null hypothesis was rejected at a 5% significance level (p = 0.0174). According to the results, the probability of the average first damage signal occurring below a crane-load of 115% DLL (the third test load increment and the first strength requirement) was 98%. This suggests that most spars will exhibit observable damage signals at or below the second loading level (100% DLL), a conclusion confirmed by the analysis of multiple AE parameters discussed earlier in this work.
Similarly, the ultimate load distribution can be examined (Figure 7b). The null hypothesis for the second strength requirement was that ultimate crane load population mean is equal to 1.28 DLL (a 30% reduction from the sample population average ultimate load) and the alternative was that the ultimate crane load population mean is less than 1.28 DLL. The analysis was run to examine whether on average, the average ultimate crane load could occur below a “30% drop from the maximum load” in accordance with the requirement. The MATLAB analysis failed to reject the null hypothesis at a 5% significance level (p = 1); there was not enough data to support the alternative hypothesis. Based on the results presented, the probability that the average spar ultimate crane-load was less than 128% DLL (30% less than the average ultimate load) was less than 1%. Therefore, almost all spars can withstand the maximum load without failure. Again, this was confirmed by the summary of results presented in Table 3, to which the probabilistic assessment presented herein adds confidence; the lowest recorded individual spar ultimate load was 151% DLL.

4. Conclusions

Acoustic emission (AE) was successfully applied to full-scale, composite, fixed-wing aircraft spars during structural strength qualification testing. Correlations between AE activity and applied load were made that allow for the in-depth structural integrity assessment beyond the data available from pass/fail, legacy aircraft component testing. In addition to examining spar progressive failure, a criterion based on cumulative AE energy was introduced to characterize the recorded AE profile as indicating either significant or progressive behavior. Moreover, the criterion agreed well with particular instances during loading, and has potential for use during real-time AE data assessment, as there appears to be a link between AE data trends and ultimate failure loads. Using the knowledge of sensor placement and recorded AE activity at each sensor, damage critical regions were identified and determined to be generally concentrated at the spar root. Finally, statistical calculation methodologies for evaluating test performance using AE data were proposed, and feasibility was demonstrated. In summary, the presented investigation demonstrates that AE monitoring may assist in quantifying the effect of manufacturing or design differences on structural component performance parameters, which could lead to refined assessment criteria that are over and above the available legacy test methodologies.

Author Contributions

The authors contributed to the following tasks. Conceptualization, A.K. and J.G.; Methodology, A.K., P.A.V. and S.E.; Validation, S.E., B.J.W. and A.K.; Formal Analysis, P.A.V., S.E., B.J.W. and A.K.; Investigation, P.A.V., S.E. and A.K.; Resources, A.K. and J.G.; Data Curation, S.E., B.J.W. and A.K.; Writing-Original Draft Preparation, B.J.W., S.E. and A.K.; Writing-Review & Editing, B.J.W., S.E. and A.K.; Visualization, B.J.W. and S.E.; Supervision, A.K. and J.G.; Project Administration, A.K.

Funding

This investigation was supported financially by General Atomics Aeronautical Systems.

Acknowledgments

The authors acknowledge and thank Trilion Quality Systems, King of Prussia, PA, USA, MISTRAS Group Inc., Princeton Junction, NJ, USA, and General Atomics Aeronautical Systems, Adelanto, CA, USA for collaborating on this investigation.

Conflicts of Interest

The authors declare no conflict of interest.

References

  1. U.S. Naval Air Systems Command. Airplane Strength and Rigidity: Ground Tests. In MIL-A-8867C(AS); U.S. Department of Defense: Washington, DC, USA, 1987. [Google Scholar]
  2. U.S. Federal Aviation Administration. Subchapter C—AIRCRAFT. In U.S. Code of Federal Regulation; Volume 14—Aeronautics and Space; Office of the Federal Register: Washington, DC, USA, 2018. [Google Scholar]
  3. SAE International. Polymer Matrix Composites: Materials, Usage, Design, and Analysis. In Composite Materials Handbook; Volume 3 Revision G R-424; SAE International: Warrendale, PA, USA, 2012. [Google Scholar]
  4. SAE International. Polymer Matrix Composites: Guidelines for Characterization of Structural Materials. In Composite Materials Handbook; Volume 1 Revision G R-422; SAE International: Warrendale, PA, USA, 2012. [Google Scholar]
  5. U.S. Fire Administration. Airframe Guide for Certification of Part 23 Airplanes; U.S. Fire Administration: Frederick County, MD, USA, 2007.
  6. U.S. Fire Administration. Damage Tolerance and Fatigue Evaluation of Structure; U.S. Fire Administration: Frederick County, MD, USA, 2011.
  7. U.S. Fire Administration. Proof of Structure; U.S. Fire Administration: Frederick County, MD, USA, 2014.
  8. U.S. Fire Administration. Quality System for the Manufacture of Composite Structures; U.S. Fire Administration: Frederick County, MD, USA, 2010.
  9. U.S. Fire Administration. Acceptance Guidance on Material Procurement and Process Specifications for Polymer Matrix Composite Systems; U.S. Fire Administration: Frederick County, MD, USA, 2003.
  10. Hamstad, M. Acceptance Testing Of Graphite/Epoxy Composite Parts Using An Acoustic Emission Monitoring Technique. NDT Int. 1982, 15, 307–314. [Google Scholar] [CrossRef]
  11. Oster, R. Non-Destructive Testing Methodologies on Helicopter Fiber Composite Components Challenges Today and in the Future. In Proceedings of the 18th World Conference on Nondestructive Testing, Durban, South Africa, 16–20 April 2012; pp. 16–20. [Google Scholar]
  12. Swindell, P.; Doyle, J.; Roach, D. Integration Of Structural Health Monitoring Solutions Onto Commercial Aircraft via The Federal Aviation Administration Structural Health Monitoring Research Program. In Proceedings of the AIP Conference, Atlanta, GA, USA, 17–22 July 2016; Volume 1806, p. 070001. [Google Scholar]
  13. Shull, P.J. Nondestructive Evaluation: Theory, Techniques, and Applications; CRC Press: Boca Raton, FL, USA, 2016. [Google Scholar]
  14. Pollock, A.A. Acoustic Emission from Solids Undergoing Deformation. Ph.D. Thesis, University of London, London, UK, 1970. [Google Scholar]
  15. Ono, K. Acoustic Emission in Materials Research—A Review. J. Acoust. Emiss. 2011, 29, 284–308. [Google Scholar]
  16. Moore, P.O. (Ed.) Fundamentals of Acoustic Emission Testing. In Nondestructive Testing Handbook, 3rd ed.; Volume 6 Acoustic Emission Testing; American Society for Nondestructive Testing: Columbus, OH, USA, 2005. [Google Scholar]
  17. Mo, C.; Wisner, B.; Cabal, M.; Hazeli, K.; Ramesh, K.; El Kadiri, H.; Al-Samman, T.; Molodov, K.D.; Molodov, D.A.; Kontsos, A. Acoustic emission of deformation twinning in magnesium. Materials 2016, 9, 662. [Google Scholar] [CrossRef] [PubMed]
  18. Wisner, B.; Cabal, M.; Vanniamparambil, P.; Hochhalter, J.; Leser, W.; Kontsos, A. In situ microscopic investigation to validate acoustic emission monitoring. Exp. Mech. 2015, 55, 1705–1715. [Google Scholar] [CrossRef]
  19. Wisner, B.; Kontsos, A. In situ monitoring of particle fracture in aluminium alloys. Fatigue Fract. Eng. Mater. Struct. 2017, 41, 581–596. [Google Scholar] [CrossRef]
  20. Wisner, B.; Kontsos, A. Investigation of particle fracture during fatigue of aluminum 2024. Int. J. Fatigue 2018, 111, 33–43. [Google Scholar] [CrossRef]
  21. Castaneda, N.; Wisner, B.; Cuadra, J.; Amini, S.; Kontsos, A. Investigation of the Z-binder role in progressive damage of 3D woven composites. Compos. Part A Appl. Sci. Manuf. 2017, 98, 76–89. [Google Scholar] [CrossRef]
  22. Cuadra, J.; Vanniamparambil, P.A.; Hazeli, K.; Bartoli, I.; Kontsos, A. Damage quantification in polymer composites using a hybrid NDT approach. Compos. Sci. Technol. 2013, 83, 11–21. [Google Scholar] [CrossRef]
  23. Vanniamparambil, P.A.; Bartoli, I.; Hazeli, K.; Cuadra, J.; Schwartz, E.; Saralaya, R.; Kontsos, A. An integrated structural health monitoring approach for crack growth monitoring. J. Intell. Mater. Syst. Struct. 2012, 23, 1563–1573. [Google Scholar] [CrossRef]
  24. Vanniamparambil, P.A.; Khan, F.; Hazeli, K.; Cuadra, J.; Schwartz, E.; Kontsos, A.; Bartoli, I. Novel optico-acoustic nondestructive testing for wire break detection in cables. Struct. Control. Health Monit. 2013, 20, 1339–1350. [Google Scholar] [CrossRef]
  25. Khan, F.; Rajaram, S.; Vanniamparambil, P.A.; Bolhassani, M.; Hamid, A.; Kontsos, A.; Bartoli, I. Multi-sensing NDT for damage assessment of concrete masonry walls. Struct. Control. Health Monit. 2015, 22, 449–462. [Google Scholar] [CrossRef]
  26. Salamone, S.; Bartoli, I.; Phillips, R.; Nucera, C.; di Scalea, F. Health monitoring of prestressing tendons in posttensioned concrete bridges. Transp. Res. Rec. J. Transp. Res. Board 2011, 2220, 21–27. [Google Scholar] [CrossRef]
  27. Vanniamparambil, P.A.; Bolhassani, M.; Carmi, R.; Khan, F.; Bartoli, I.; Moon, F.L.; Hamid, A.; Kontsos, A. A data fusion approach for progressive damage quantification in reinforced concrete masonry walls. Smart Mater. Struct. 2013, 23, 015007. [Google Scholar] [CrossRef]
  28. Baxevanakis, K.P.; Wisner, B.; Schlenker, S.; Baid, H.; Kontsos, A. Data-Driven Damage Model Based on Nondestructive Evaluation. J. Nondestruct. Eval. Diagn. Progn. Eng. Syst. 2018, 1, 031007. [Google Scholar] [CrossRef]
  29. Cuadra, J.; Vanniamparambil, P.; Servansky, D.; Bartoli, I.; Kontsos, A. Acoustic emission source modeling using a data-driven approach. J. Sound Vib. 2015, 341, 222–236. [Google Scholar] [CrossRef]
  30. Mazur, K.; Wisner, B.; Kontsos, A. Fatigue Damage Assessment Leveraging Nondestructive Evaluation Data. JOM 2018, 70, 1182–1189. [Google Scholar] [CrossRef]
  31. Wisner, B.; Mazur, K.; Perumal, V.; Baxevanakis, K.; An, L.; Feng, G.; Kontsos, A. Acoustic emission signal processing framework to identify fracture in aluminum alloys. Eng. Fract. Mech. 2018, in press. [Google Scholar] [CrossRef]
  32. Zárate, B.A.; Caicedo, J.M.; Yu, J.; Ziehl, P. Probabilistic prognosis of fatigue crack growth using acoustic emission data. J. Eng. Mech. 2012, 138, 1101–1111. [Google Scholar] [CrossRef]
  33. Ono, K. Application of acoustic emission for structure diagnosis. Diagnostyka 2011, 2, 3–18. [Google Scholar]
  34. Anay, R.; Cortez, T.M.; Jáuregui, D.V.; ElBatanouny, M.K.; Ziehl, P. On-site acoustic-emission monitoring for assessment of a prestressed concrete double-tee-beam bridge without plans. J. Perform. Constr. Facil. 2015, 30, 04015062. [Google Scholar] [CrossRef]
  35. De Santis, S.; Tomor, A.K. Laboratory and field studies on the use of acoustic emission for masonry bridges. NDT E Int. 2013, 55, 64–74. [Google Scholar] [CrossRef]
  36. Golaski, L.; Gebski, P.; Ono, K. Diagnostics of reinforced concrete bridges by acoustic emission. J. Acoust. Emiss. 2002, 20, 83–89. [Google Scholar]
  37. Pollock, A.; Smith, B. Stress-wave-emission monitoring of a military bridge. Non-Destr. Test. 1972, 5, 348–353. [Google Scholar] [CrossRef]
  38. Blanch, M.; Dutton, A. Acoustic emission monitoring of field tests of an operating wind turbine. In Key Engineering Materials; Trans Tech Publ: Princeton, NJ, USA, 2003; pp. 475–482. [Google Scholar]
  39. Han, B.-H.; Yoon, D.-J.; Huh, Y.-H.; Lee, Y.-S. Damage assessment of wind turbine blade under static loading test using acoustic emission. J. Intell. Mater. Syst. Struct. 2014, 25, 621–630. [Google Scholar] [CrossRef]
  40. Paquette, J.; Van Dam, J.; Hughes, S. Structural testing of 9m carbon fiber wind turbine research blades. In Proceedings of the 45th AIAA Aerospace Sciences Meeting and Exhibit, Reno, NV, USA, 8–11 January 2007; p. 816. [Google Scholar]
  41. Sutherland, H.; Beattie, A.; Hansche, B.; Musial, W.; Allread, J.; Johnson, J.; Summers, M. The Application of Non-Destructive Techniques to the Testing of a Wind Turbine Blade; Sandia National Labs.: Albuquerque, NM, USA, 1994. [Google Scholar]
  42. Moore, P.O. (Ed.) Aerospace Applications of Acoustic Emission Testing. In Nondestructive Testing Handbook, 3rd ed.; Volume 6 Acoustic Emission Testing; American Society for Nondestructive Testing: Columbus, OH, USA, 2005. [Google Scholar]
  43. Holford, K.M.; Pullin, R.; Evans, S.L.; Eaton, M.J.; Hensman, J.; Worden, K. Acoustic emission for monitoring aircraft structures. Proc. Inst. Mech. Eng. Part G J. Aerosp. Eng. 2009, 223, 525–532. [Google Scholar] [CrossRef] [Green Version]
  44. Vanniamparambil, P.A.; Carmi, R.; Khan, F.; Cuadra, J.; Bartoli, I.; Kontsos, A. An active–passive acoustics approach for bond-line condition monitoring in aerospace skin stiffener panels. Aerosp. Sci. Technol. 2015, 43, 289–300. [Google Scholar] [CrossRef]
  45. Prosser, W.H.; Gorman, M.R.; Madaras, E.I. Acoustic Emission Detection of Impact Damage on Space Shuttle Structures; NASA: Washington, DC, USA, 2004. [Google Scholar]
  46. Staszewski, W.; Mahzan, S.; Traynor, R. Health monitoring of aerospace composite structures—Active and passive approach. Compos. Sci. Technol. 2009, 69, 1678–1685. [Google Scholar] [CrossRef]
  47. Awerbuch, J.; Leone, F.A., Jr.; Ozevin, D.; Tan, T.-M. On the applicability of acoustic emission to identify modes of damage in full-scale composite fuselage structures. J. Compos. Mater. 2016, 50, 447–469. [Google Scholar] [CrossRef]
  48. Weis, M.; Cejpek, J.; Juračka, J. Acoustic Emission Localization in Testing of Composite Structures. In Applied Mechanics and Materials; Trans Tech Publ: Princeton, NJ, USA, 2016; pp. 405–411. [Google Scholar]
  49. Haile, M.A.; Bordick, N.E.; Riddick, J.C. Distributed acoustic emission sensing for large complex air structures. Struct. Health Monit. 2018, 17, 624–634. [Google Scholar] [CrossRef]
  50. Cawley, P. Structural health monitoring: Closing the gap between research and industrial deployment. Struct. Health Monit. 2018. [Google Scholar] [CrossRef]
  51. Brunner, A.J. Identification of damage mechanisms in fiber-reinforced polymer-matrix composites with Acoustic Emission and the challenge of assessing structural integrity and service-life. Constr. Build. Mater. 2018, 173, 629–637. [Google Scholar] [CrossRef]
  52. Moore, P.O. (Ed.) Acoustic Emission Signal Processing. In Nondestructive Testing Handbook, 3rd ed.; Volume 6 Acoustic Emission Testing; American Society for Nondestructive Testing: Columbus, OH, USA, 2005. [Google Scholar]
  53. Tensi, H.M. The Kaiser-effect and its scientific background. J. Acoust. Emiss. 2004, 22, s1–s16. [Google Scholar]
  54. Waller, J.; Andrade, E.; Saulsberry, R. Use of acoustic emission to monitor progressive damage accumulation in Kevlar® 49 composites. In Proceedings of the AIP Conference, Kingston, RI, USA, 26–31 July 2009; Volume 1211, p. 1111. [Google Scholar]
  55. Fowler, T.J. Acoustic emission of fiber reinforced plastics. J. Tech. Counc. ASCE 1979, 105, 281–289. [Google Scholar]
  56. Behnia, A.; Chai, H.K.; Shiotani, T. Advanced structural health monitoring of concrete structures with the aid of acoustic emission. Constr. Build. Mater. 2014, 65, 282–302. [Google Scholar] [CrossRef]
  57. Ono, K.; Gallego, A. Research and applications of AE on advanced composites. J. Acoust. Emiss 2012, 30, 180–229. [Google Scholar]
  58. Loutas, T.; Kostopoulos, V. Health monitoring of carbon/carbon, woven reinforced composites. Damage assessment by using advanced signal processing techniques. Part I: Acoustic emission monitoring and damage mechanisms evolution. Compos. Sci. Technol. 2009, 69, 265–272. [Google Scholar]
  59. Djabali, A.; Toubal, L.; Zitoune, R.; Rechak, S. An experimental investigation of the mechanical behavior and damage of thick laminated carbon/epoxy composite. Compos. Struct. 2018, 184, 178–190. [Google Scholar] [CrossRef]
  60. Joosse, P.; Blanch, M.; Dutton, A.; Kouroussis, D.; Philippidis, T.; Vionis, P. Acoustic emission monitoring of small wind turbine blades. J. Sol. Energy Eng. 2002, 124, 446–454. [Google Scholar] [CrossRef]
  61. Lilliefors, H.W. On the Kolmogorov-Smirnov test for normality with mean and variance unknown. J. Am. Stat. Assoc. 1967, 62, 399–402. [Google Scholar] [CrossRef]
Figure 1. Schematic of the “whiffle-tree” loading apparatus to simulate distributed loading. Load cell locations are indicated by yellow boxes, while acoustic emission (AE) sensor locations are indicated as red circles.
Applsci 08 01490 g001
Figure 2. Sample AE activity observed during Test 8 at four different load points. (a) Zero load, (b) during the first load step, (c) during the second load step, and (d) at final failure.
Applsci 08 01490 g002
Figure 3. Sample AE activity observed during four separate spar tests. (a) Test 14, (b) Test 8, (c) Test 10, and (d) Test 4.
Applsci 08 01490 g003
Figure 4. AE energy evolutions for the same tests shown in Figure 1. (a) Test 14, (b) Test 8, (c) Test 10, and (d) Test 4.
Applsci 08 01490 g004
Figure 5. Additional examples of AE activity during four tests with some progressive and some significant behavior observed. (a) Test 5, (b) Test 3, (c) Test 15, and (d) Test 13.
Applsci 08 01490 g005
Figure 6. Data normality test for: (a) the load at first damage signal, and (b) the ultimate load datasets.
Applsci 08 01490 g006
Figure 7. A schematic representation of the probabilistic assessment. (a) First damage AE signal distribution, (b) ultimate load distribution.
Applsci 08 01490 g007
Table 1. Sensor locations along the length of each spar.
Test IDAcoustic Emission Sensor ID and Location (in)
S1S2S3S4S5S6S7S8S9S10
1----------
23923.5364866.583.599.5114130
3162541.556.57383.5-112.5-
4262542577493.5-114-
51723.538557086-101-
6172439.5556984-100-
71.5625.540.556.57493-112.5-
826.52641.55672.593-113.5-
9162743617693-113.5-
101.56.524.540.556.573.593.5-113.5-
11162641.5577288-105.5-
1216.525.540.55773.6590.5-112.5-
1316.7523.538557086-101-
1426.525.54156.57991-111.5-
15313.526364866.583.599.5114130
161.57.252540.5567086-101-
Table 2. Felicity ratio values calculated based on the four applied loading cycles.
File NameFelicity Ratio
Load 2Load 3Load 4Average
1N/AN/AN/AN/A
21.080.930.870.96
31.090.730.860.89
41.250.910.831.00
51.460.960.751.06
61.150.910.890.98
71.281.030.991.10
80.590.510.420.51
91.130.610.560.77
101.151.000.720.96
111.060.820.800.94
121.320.990.941.08
131.080.720.930.91
141.270.720.820.94
150.971.020.990.99
160.731.081.000.94
Table 3. Results summary.
File NameUltimate Crane Load [%DLL]Target Load [%DLL] o
First Damage Signal
Estimated Load [lbf] @ 1st Damage SignalCumulative AE BehaviorCritical Region
1N/A115N/ASignificantS1 (N/A)
215110090SignificantS3, S5, S6, S19
(15,23.5,48,66.5 in)
3165100103SignificantS2 (6 in)
4167150133ProgressiveS2 (6 in)
5169115117ProgressiveS2 (7 in)
617010069Significant S2 (7 in)
7178100101SignificantS2 (6 in)
818010085SignificantS2 (6.5 in)
918210097SignificantS2 (6 in)
10184150132ProgressiveS2 (6.5 in)
1118510096SignificantS2 (6 in)
1219210096SignificantS2, S4 (6.5&40.5 in)
13197115115ProgressiveS2 (6.75 in)
14197100100SignificantS2 (6.5 in)
1520510081SignificantS4 (36 in)
16216150134ProgressiveS2 (7.25)
Table 4. Summary statistics for the response variables of interest.
Crane-Load @ 1st Damage SignalUltimate Crane-Load
Mean [Load/DLL]1.031.82
StDev [Load/DLL]0.190.17
Spread [Load/DLL]0.650.65
99% LCL [Load/DLL]0.901.71

