Article

Acetic Acid as an Indirect Sink of CO2 for the Synthesis of Polyhydroxyalkanoates (PHA): Comparison with PHA Production Processes Directly Using CO2 as Feedstock

by
Linsey Garcia-Gonzalez
* and
Heleen De Wever
Flemish Institute for Technological Research (VITO), Boeretang 200, 2400 Mol, Belgium
*
Author to whom correspondence should be addressed.
Appl. Sci. 2018, 8(9), 1416; https://doi.org/10.3390/app8091416
Submission received: 1 August 2018 / Revised: 18 August 2018 / Accepted: 19 August 2018 / Published: 21 August 2018
(This article belongs to the Special Issue Carbon Capture Utilization and Sequestration (CCUS))

Abstract

:

Featured Application

production of bioplastics with tailored composition and properties from the feedstock CO2, in view of maximal CO2 fixation and minimal H2 consumption.

Abstract

White biotechnology is promising to transform CO2 emissions into a valuable commodity chemical such as the biopolymer polyhydroxyalkanaotes (PHA). Our calculations indicated that the indirect conversion of acetic acid from CO2 into PHA is an interesting alternative for the direct production of PHA from CO2 in terms of CO2 fixation, H2 consumption, substrate cost, safety and process performance. An alternative cultivation method using acetic acid as an indirect sink of CO2 was therefore developed and a proof-of-concept provided for the synthesis of both the homopolymer poly(3-hydroxybutyrate) (PHB) and the copolymer poly(3-hydroxybutyrate-co-3-hydroxyvalerate) (PHBV). The aim was to compare key performance parameters with those of existing cultivation methods for direct conversion of CO2 to PHA. Fed-batch cultivations for PHA production were performed using a pH-stat fed-batch feeding strategy in combination with an additional Dissolved Oxygen (DO)-dependent feed. After 118 h of fermentation, 60 g/L cell dry matter (CDM) containing 72% of PHB was obtained, which are the highest result values reported so far. Fed-batch cultivations for PHBV production resulted in 65 g/L CDM and 48 g/L PHBV concentration with a 3HV fraction of 27 mol %. Further research should be oriented towards process optimisation, whole process integration and design, and techno-economic assessment.

1. Introduction

The 2030 framework for climate and energy policies contains a binding target to cut emissions in EU territory by at least 40% with respect to 1990 levels by 2030 [1]. This target enables the EU to take cost-effective steps towards its long-term objective of cutting emissions by 80–95% by 2050, and contributes to the Paris Agreement. As theoretical limits of efficiency are being reached and process-related emissions are unavoidable in some sectors, the utilisation of CO2 for the production of fuels, chemicals and materials, also referred to as Carbon Capture and Utilization (CCU), has emerged as a promising CO2 mitigation tool. In addition, CCU has the potential to address resource efficiency and growth while defining a new landscape and business opportunities for European industry [2]. In particular, CO2-based polymers look promising, as this approach benefits the environment in several ways. Firstly, the use of CO2 for the manufacturing of plastics can substitute petroleum as raw material and does not compete with food production in contrast with corn-based plastics. Secondly, in a circular economy approach, CO2 is the only abundant source of carbon in the long term and the ultimate sustainable resource for the plastic industry.
Polyhydroxyalkanoates (PHA) are biological polyesters synthesised by a variety of organisms as an intracellular storage material from renewable resources. The homopolymer of 3-hydroxybutyrate (3HB), also known as poly(3-hydroxybutyrate) (PHB), is the most common type of PHA and displays several interesting properties comparable to polypropylene [3]. Through the inclusion of other monomers in the polymer, the synthesis of copolymers with improved mechanical properties such as poly(3-hydroxybutyrate-co-3-hydroxyvalerate) (PHBV) in cells is possible, potentially increasing the value of the final product [4]. The most frequently applied cultivation method for PHA production consists of cell growth under favourable growth conditions, followed by PHA synthesis under imbalanced growth conditions. The model organism for this cultivation process is Cupriavidus necator, a metabolically versatile organism capable of shifting between heterotrophic growth (utilising organic compounds as a carbon and energy source) and autotrophic growth (utilising CO2 as carbon source, H2 as energy source and O2 as electron acceptor). While most work was carried out using organic substrates as carbon source, attempts to produce PHB from CO2 have also been undertaken.
Two cultivation methods exist to directly utilise CO2 for PHB production by C. necator. The first cultivation method (i.e., autotrophic-autotrophic PHB production process) uses a gas mixture of CO2, H2 and O2 for both cell mass growth (Equation (1)) and PHB accumulation (Equation (2)), while the second method (i.e., heterotrophic-autotrophic PHB production process) consists of heterotrophic growth on an organic substrate such as glucose (Equation (3)), followed by autotrophic PHB production [5,6].
21.36 H2 + 6.21 O2 + 4.09 CO2 + 0.76 NH3 → C4.09H7.13O1.89N0.76 + 18.7 H2O
33 H2 + 12 O2 + 4 CO2 → C4H6O2 + 30 H2O
C6H12O6 + 1.97 O2 + 0.72 NH4+ → 3.79 CH1.74O0.46N0.19 + 2.21 CO2 + 0.72 H+ + 3.78 H2O
Experimental work on PHB production from CO2 has been performed with a view to optimising the production of PHB using either pure synthetic CO2 [7,8,9] or industrial off-gases [5]. In addition, a few studies have investigated mixotrophic PHA copolymer production in which CO2 was supplied in combination with an organic co-substrate [10].
Irrespective of the cultivation method, a high cell-density culture with high PHA content and PHA productivity is a prerequisite for industrial-scale application. An additional requirement for gas fermentation is to avoid gas detonation when using O2 combined with H2. This can be achieved by keeping the O2 concentration in the gas phase below the lower level of explosion. Higher cell mass concentration and lower gas concentration, however, inherently implies an increased risk of mass transfer limitation, causing premature shifting to the PHA production phase in the fully autotrophic cultivation system or incomplete biopolymer accumulation in the heterotrophic–autotrophic process. The latter process has been proven to be more promising for the direct conversion of CO2 to PHA in terms of cell mass concentration and growth rate [7]. In addition, less of the still costly renewable H2 is evidently needed; however, the total amount of CO2 that can theoretically be converted into polymers is significantly reduced. For example, the potential emissions abatement and H2 consumption is theoretically reduced by respectively 44% and 20% for autotrophic PHB production in glucose-grown biomass compared to a fully autotrophic process [5].
PHA can also be produced from CO2 in an indirect manner through the use of acetic acid (i.e., autotrophic-heterotrophic-heterotrophic PHA production process). Acetogenic bacteria, an ancient group of strictly anaerobic microorganisms, are capable of reducing H2 and CO2 as sole energy and carbon sources and mainly produce acetate (Equation (4)) [11]. Acetic acid can be used subsequently by C. necator for both biomass growth (Equation (5)) and PHA production (Equation (6)).
2 CO2 + 4 H2 → C2H4O2 + 2 H2O
C2H4O2 + 0.79 O2 + 0.22 NH4+→ 1.14 CH1.74O0.46N0.19 + 1.33 H2O +0.86 CO2 + 0.22 H+
1.5 C2H4O2 + 0.75 O2 → 0.5 C4H6O2 + 1.5 H2O + CO2
Based on the mass balances, the indirect conversion of CO2 to PHA through acetic acid is an interesting alternative for the direct production of PHA from CO2 in terms of CO2 fixation, H2 consumption, substrate cost and safety. Compared to the autotrophic–autotrophic PHB production process, for example, this cultivation method could theoretically reduce equal amounts of CO2 (2.84 ton CO2/ton PHB), while consuming 50% less H2. On the contrary, commercial PHB (i.e., produced from glucose) emits at least 2.81 ton CO2/ton PHB according to the mass balances [5]. Most reports focused, however, on the use of acetic acid for PHA production by mixed cultures rather than a pure culture. Also, the utilisation of a mixture of short-chain carboxylates such as acetic, propionic, and butyric acid generated by the anaerobic conversion of organic wastes using undefined mixed cultures has been investigated frequently as a carbon source for PHA production by pure and mixed cultures [12]. Although the use of mixed microbial cultures or waste feedstock can improve the economics of PHA, mixed culture fermentation generates mixtures with variable carboxylate composition rather than a single product in high concentration [13]. Because the carboxylate composition determines the PHA monomers, which in turn strongly influence the polymer physical/mechanical properties [12,14], such undefined and fluctuating carboxylate substrates are undesirable, in particular for high-end (such as medical) applications. Furthermore, since the consumption rate of acids for PHA production is dependent of the type of carboxylate, less preferred carboxylates could accumulate in the fermentation medium, resulting in a toxic effect on the microbial catalyst [4]. Data on process performance in terms of biomass and PHA concentration, productivity, etc., is also lacking. Moreover, most of the studies dealing with PHBV production using a pure strain deal with double substrate strategy using glucose or fructose and propionic acid or valeric acid as co-substrate. The targeted production of PHBV from acetic acid as the main carbon source with a co-substrate such as valeric acid by pure cultures has, however, not yet been reported [15]. Although calculations indicate that the indirect conversion of acetic acid from CO2 could be an interesting alternative for the direct production of PHB from CO2, it is clear that a proof-of-concept is currently lacking to substantiate these calculations.
This study is the first to compare the key performance parameters of different PHA production processes using CO2 as a feedstock by C. necator. An alternative cultivation method using acetic acid as an indirect sink of CO2 was first developed for the synthesis of PHB homopolymer and PHBV copolymer using a pure culture. Subsequently, this approach was benchmarked with the existing cultivation methods for direct conversion of CO2 to PHA.

2. Materials and Methods

2.1. Organism and Inoculum Preparation

C. necator DSM 545 was used as the microorganism. Inoculum was prepared as previously reported in Ghysels et al. [10]. The seed culture was used to inoculate baffled flasks (2% v/v inoculum, Section 2.3) or, after centrifugation at 4 °C and 7000× g (SORVALL RC6+ centrifuge, Thermo Scientific, Clintonpark Keppekouter, Belgium) for 10 min and resuspension of the pelleted cells in fermentation media, in the bioreactor (12.5% v/v inoculum, Section 2.4).

2.2. Culture Media

Compositions of the culture media were described previously [16].

2.3. Shake Flask Experiments

To study the effect of acetic acid concentration on the growth of C. necator DSM 545, two mL of the seed culture was inoculated into 100 mL of fermentation medium in 500 mL baffled flasks. Acetic acid, ranging from 1 to 5 g/L, was added as carbon source to the fermentation medium.
The effect of the total acid concentration and the ratio acetic acid to valeric acid on PHBV production of C. necator DSM 545 was investigated by inoculating two mL of the seed culture into 100 mL of fermentation medium in 500 mL baffled flasks containing 2.5 g/L acetic acid. After incubation at 30 °C and 180 rpm for 16 h, the culture was centrifuged for 10 min at 4 °C and 7000× g. Supernatant was discarded, and pelleted cells were suspended in 100 mL ammonium-nitrogen free fermentation medium. Acetic acid and valeric acid at a total acid concentration of 3 or 6 g/L were added in different relative ratios to the fermentation medium.
The pH of all shake flasks was adjusted to 6.8 with 2 M NaOH. The flasks were incubated at 30 °C and 180 rpm for 24 h. Samples were taken at regular time intervals and analyzed as described in Section 2.5. All the shake flask experiments were conducted in duplicate to confirm the accuracy of the results.

2.4. Fed-Batch Experiments

Fed-batch experiments were performed in a 3-L bioreactor (Applikon Biotechnology, Delft, The Netherlands). The setup was detailed previously [16]. The process temperature and stirring speed were kept constant at 30 °C and 1200 rpm respectively. The pH of the fermentation medium was kept at 6.90 ± 0.1 by addition from either the pH-stat feeding solution or 5M NaOH solution whenever the pH deviated from the set value. The Dissolved Oxygen (DO) concentration level was regulated as described in Huschner et al. [4].
A pH-stat culture technique in combination with a DO-stat culture method that enables pH-stat feeding after depletion was used as feeding strategy [4]. Biomass growth on carboxylates leads to a rise in media pH. Coupling of the pH control with a carboxylate feed thus maintains the pH at the desired level while providing the carbon. Carboxylates are weak acids, eventually leading to reduced availability of carbon source in fermentation broth. Carbon depletion is paired with a decreased O2 demand, resulting in an increase of DO. Above a certain threshold value, the DO-dependent feed (DO-stat) will be activated, adding carboxylate salts to the fermentation medium (DO-stat). Consumption of carboxylate salts will in turn trigger pH-stat feeding of carboxylates until carbon depletion occurs again [4].
The composition of the pH-stat feeding solution for PHB and PHBV production is given in Table 1. The DO-feeding solution contained 273 g/L sodium acetate. The DO-feeding pump was activated at DO values > 50%. Triggering the DO-stat control invoked a 6-min cycle: a variable period of active pumping at a certain flow followed by a 5-min inactivity interval.
Samples were collected during this time and analysed as described in Section 2.5.

2.5. Analytical Methods

The concentrations of glucose, acetic acid, valeric acid, ammonium-nitrogen (NH4+-N), cell mass (expressed as cell dry mass, CDM), PHB, PHBV, 3-hydroxybutyrate (3HB) and 3-hydroxyvalerate (3HV) were determined as previously described [10,16].

2.6. Calculations

The residual cell concentration (RCC), PHB content, PHB productivity and fraction of comonomer 3HV (fHV) were determined as previously described [10].

3. Results and Discussion

3.1. Homopolymer PHB Production from Acetic Acid

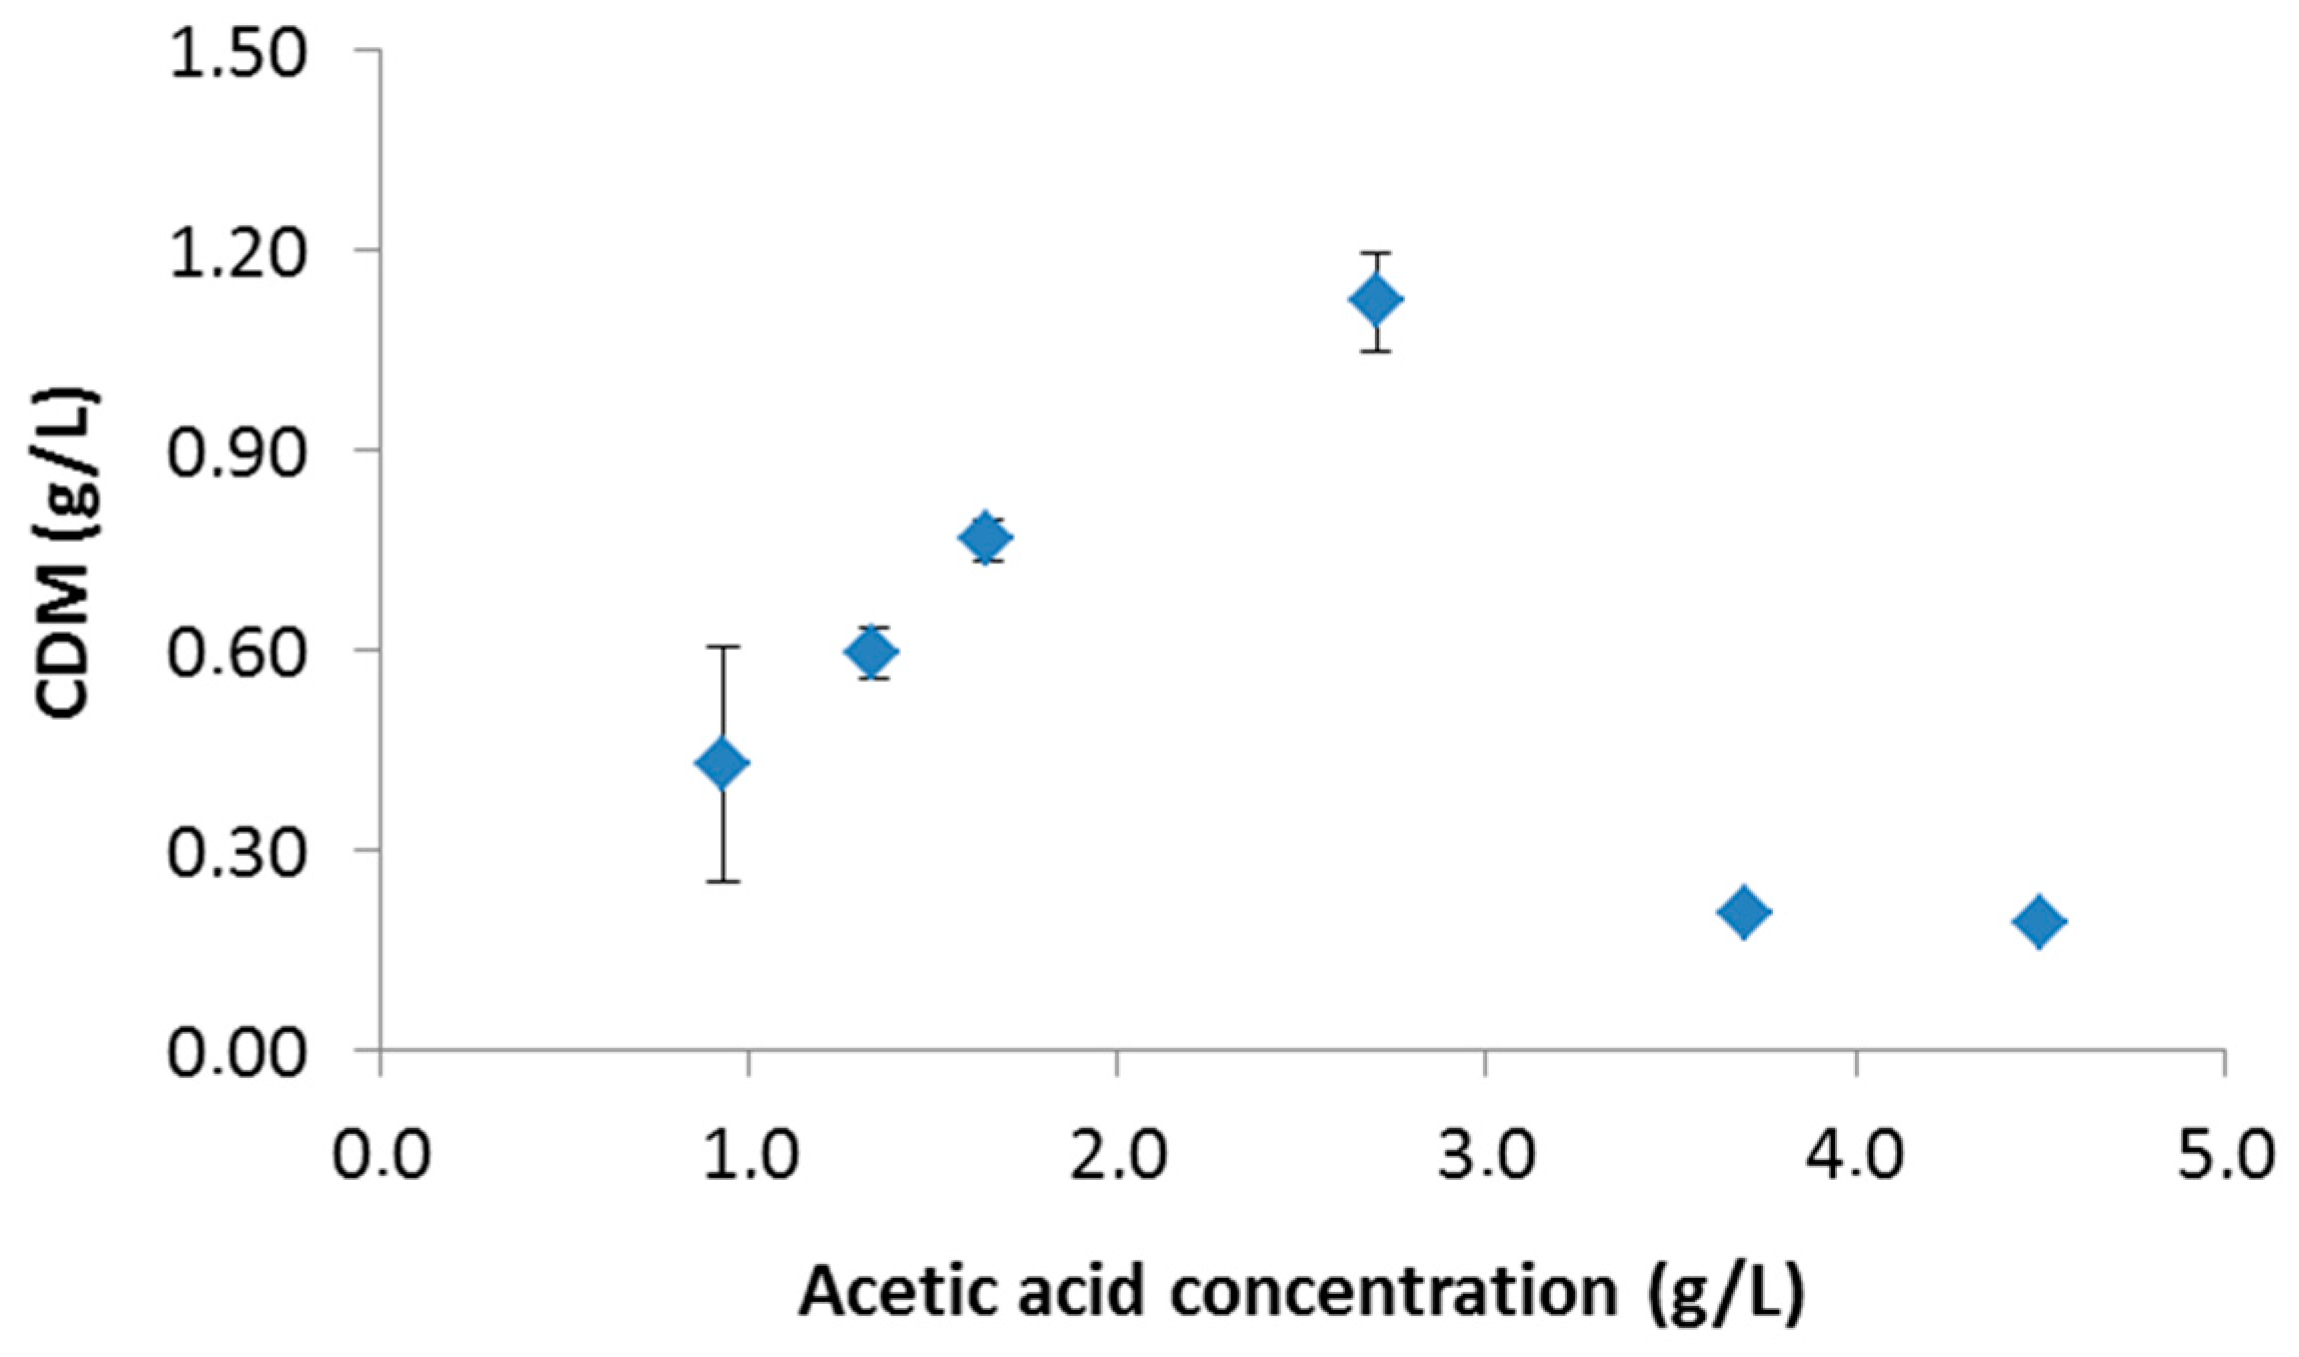
3.1.1. Effect of Initial Acetic Acid Concentration

Organic acids such as acetic acid exhibit a toxic effect on cell physiology when present above a certain concentration threshold. To determine the minimal inhibitory concentration of acetic acid on biomass growth of C. necator, a series of shake flask experiments were conducted which differed in the amount of acetic acid added. Figure 1 shows the effect of the initial acetic acid concentration on the cell growth of C. necator in the shake flasks. The optimum concentration of acetic acid for cell growth was in the range of 3 g/L. The inhibitory effect of acetate on C. necator became significant at a concentration above 3 g/L, as evidenced by the limited biomass growth and acetic acid consumption after 24 h of incubation.
These observations are in accordance with previous studies [17,18]. In these reports, a decline in specific growth rate of C. necator under nutrient-rich conditions was observed with increase in acetate concentration following an exponential function. An inhibitory effect of acetic acid above 3 g/L at lower cellular density was reported and no growth was observed at a concentration of 6 g/L or above. The use of a high cell concentration, however, significantly increased the acetate tolerance of C. necator. Sugimoto et al., however, reported an optimum concentration of acetate for cell growth of 1 g/L and serious inhibition of growth by slight increase in acetate concentration [19]. Compared to Wang and Yu [17,18] and our study, these authors used another C. necator strain.
The toxicity of carboxylates can be attributed to their undissociated lipophilic molecules that freely penetrate the cell membrane, dissociate and acidify the cytoplasm [20]. As a result, the gradient of protons through the membrane cannot be maintained, and the production of energy and the transport system dependent on this gradient are decoupled [21]. The dissociation also induces an anion accumulation, resulting in increased internal osmotic pressure of cells [22]. In response to the accumulation of fatty acids, microorganisms release free energy via ATPase and expel protons out of the cells in order to maintain the proton gradient. This results in an overall decline of microbial activity including reduced acid utilisation rate, growth rate and yield [23,24]. At neutral pH, the acid is present in a dissociated form, and the passage through the cellular membrane is limited. Carboxylic acid anions affect cell growth in a variety of manners. Increased anion concentration has been shown to lead to an increased transport of potassium ions into the cell, which increases turgor pressure. To maintain a constant turgor pressure and cell volume, glutamate is transported out of the cell. This transport activity concomitantly disrupts the osmolarity of the cytoplasm, which in turn lowers the cell’s growth potential and viability. In addition to this general anion effect, there are also effects specific to each carboxylic acid [25].

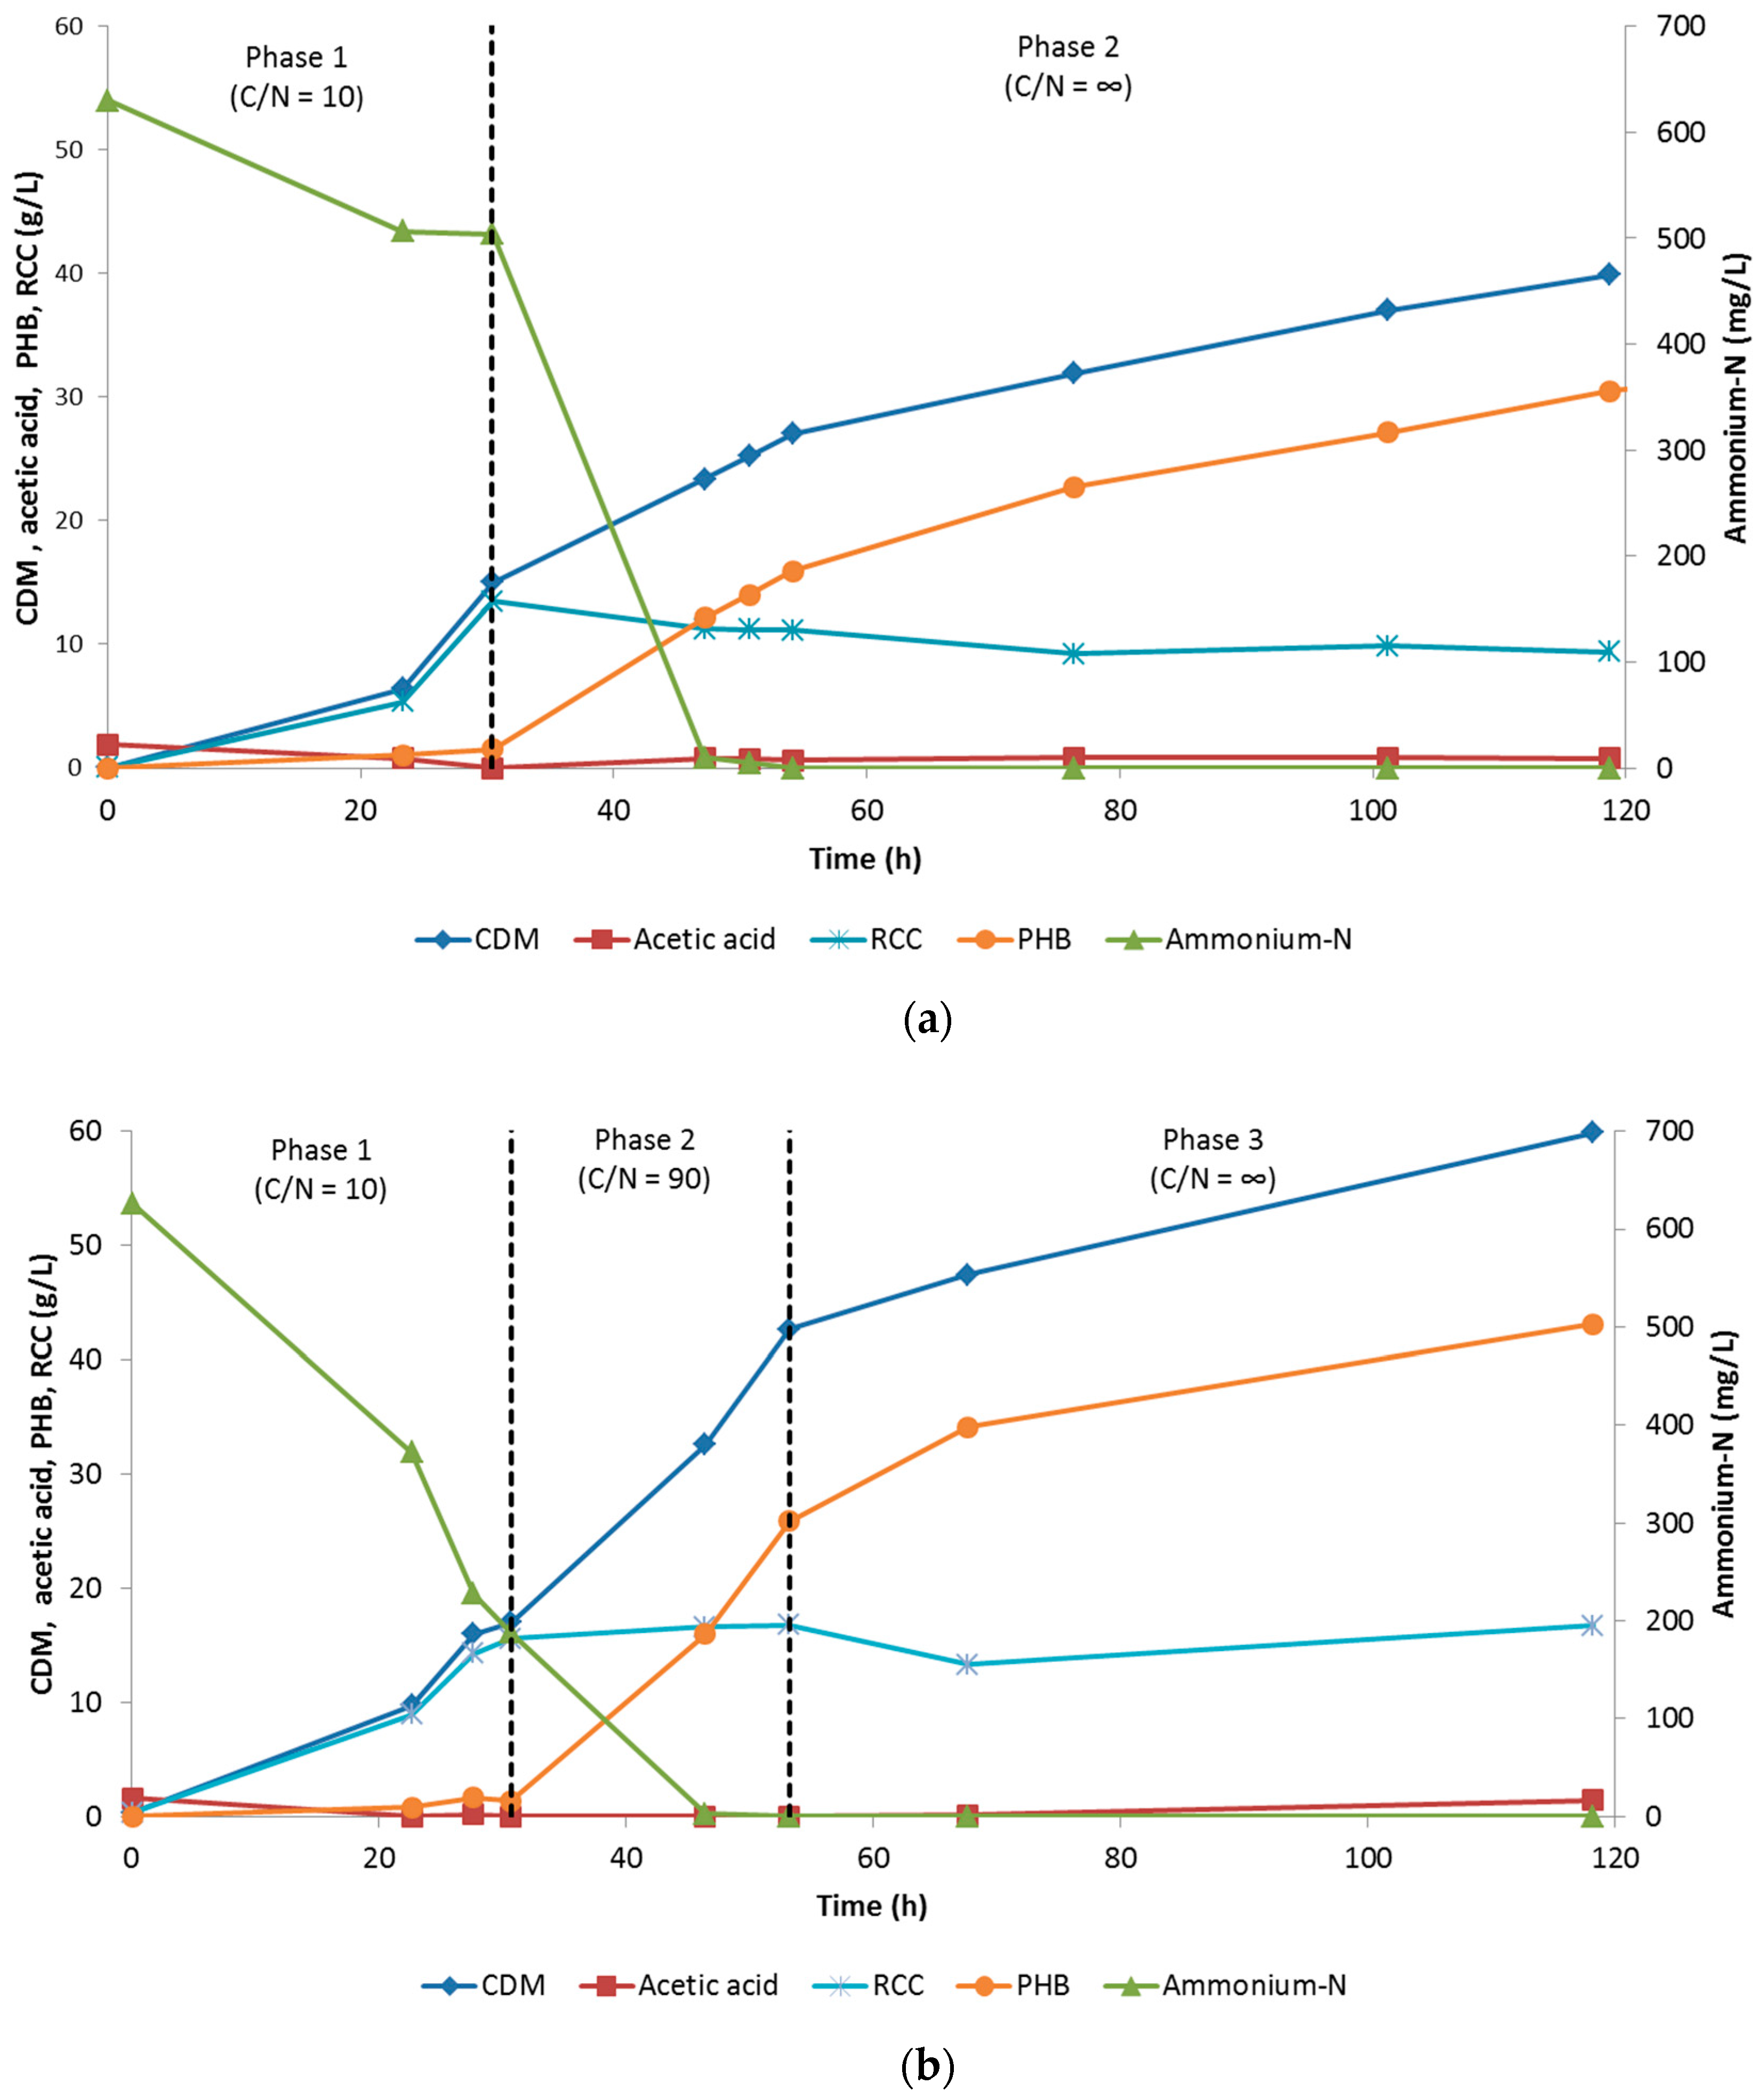
3.1.2. Evaluation of Two-Phase and Three-Phase Fed-Batch Culture

Different feeding strategies have been utilised for the production of PHA, including continuous feeding, exponential feeding, pH stat, DO stat, online measurement of substrate concentration, CO2 evolution rate or alkali-addition monitoring coupled to a controlled feeding of carbon source [16]. Recently, Huschner et al. developed a new feeding strategy for organic acid fermentation by another C. necator strain, using a pH-stat, feeding organic acids to maintain the pH, in combination with a DO-dependent feed (DO-stat) delivering organic acid salts [4]. The latter feeding strategy led to the best process performance for PHA production from a mixture of organic acids. Therefore, this feeding strategy was selected for the current study.
Two production routes were evaluated in terms of process performance using the feeding strategy adopted by Huschner et al. [4]. The first process (i.e., two-phase fed-batch culture) consisted of biomass growth followed by PHB production induced by changing the pH-stat feed with a C/N = 10 to an acid feed solution without nitrogen (C/N = ∞). The second one (i.e., three-phase fed-batch culture) contained an intermediate phase to enable a low residual biomass growth rate for maintaining an active metabolism and increasing PHB productivity. This intermediate phase was induced by substituting the initial pH-stat solution with a solution with a high C/N (C/N = 90).
The results of the two-phase fed-batch culture show that during the biomass growth phase (phase 1), a biomass concentration of 15 g/L was attained after 30 h that contained 10% PHB (Figure 2a). The average specific growth rate µ was calculated as 0.152 L/h. After 30 h, nitrogen limitation was initiated to trigger PHB biosynthesis. After a short time, nitrogen in the culture broth was depleted, thereby triggering PHB synthesis (phase 2). The maximal biomass (DCM) and PHB concentrations were 40 g/L and 30 g/L, respectively, after 119 h, resulting in a PHB content of 75% and a PHB productivity of 0.257 g/L/h.
Figure 2b shows the results of the three-phase fed-batch cultivation process. Since the main objective was the comparison of the key performance parameters of different PHA production processes using CO2 as a feedstock, rather than to fully optimise the fermentation process in terms of PHA productivity, content and concentration, the first phase (from 0 to 30 h) was performed under conditions identical to the first stage of the two-phase fed-batch culture. Biomass was produced (16 g/L) with low PHA biosynthesis levels (8%). During the second phase (from 30 to 53 h), nitrogen availability was limited, and PHB concentration and content increased to 26 g/L and 61%, respectively. Finally, the third phase (from 53 to 118 h) allowed for the further increase of PHB percentage of the cells by stopping growth. The final biomass and PHB concentration were 60 g/L and 43 g/L, respectively. An overall PHB content and productivity of 72% and 0.365 g/L h, respectively, was attained.
In both cases, acetic acid concentration was maintained below its minimal inhibitory value (3 g/L) over the duration of the process, and the applied feeding strategy was highly reproducible for the first phase (i.e., biomass production). Integrating an intermediary phase consisting of both biomass and PHB production outperformed the overall process performance in terms of biomass concentration, PHB concentration and PHB productivity. This finding is in accordance with Huschner et al., in which a fed-batch fermentation strategy was developed to overcome the toxic influence of organic acids as sole carbon source in high cell density cultures of another C. necator strain H16 [4]. The higher anabolic activity of the cells during their exponential growth might lead to faster PHB production rates, since more reducing power (NADPH) is produced and the maximal specific PHB production rate is defined by the maximum specific rate of NADPH produced [26].
To the best of our knowledge, so far, only one report has investigated PHB production from pure culture using acetic acid as the sole feedstock [27]. The aim of this study was to analyse the metabolic flux for PHB production in C. necator using various carbon sources, rather than to optimise the fermentation process. A biomass and PHB concentration of 3 g/L and 1 g/L were obtained in this study. Most reports, however, have focused on the use of acetic acid as the carbon source for PHA production by mixed cultures, whereby the effects of several parameters, such as acetate, ammonia concentration, phosphorus concentration, pH, and feed regime, on the storage capacity of the mixed culture were investigated [28,29,30,31,32,33,34]. Data on PHA content is available; however, biomass and PHA concentration are mostly lacking, making the comparison of results obtained in the present study with these reports unfeasible. In addition, not all reports analyse the monomeric composition of the produced polymer. Furthermore, several studies are available in which a mix of carboxylates including acetic acid is used as carbon source by mostly pure cultures [4] (see Section 3.2) and in some cases by mixed cultures [34,35]. Such fermentations produce PHA polymers with a considerably high diversity of different HA monomers, containing monomers other than 3HB [35].

3.2. Copolymer PHBV Production from Acetic Acid and Valeric Acid

3.2.1. Effect of Initial Acid Concentration and Composition

For the production of copolymers such PHBV, addition of a co-substrate is required. In this study, valeric acid was chosen as a precursor for 3HV units rather than propionic acid as a higher HV fraction can be obtained [36,37,38]. 3HV synthesis from valeric acid does not involve the catabolism of the acid to a shorter alkyl-CoA like this is the case for propionic acid, but rather its direct incorporation into the polymer via valeryl-CoA and its oxidation to 3-hydroxyvaleryl-CoA. Furthermore, decarboxylation of propionyl-CoA and loss of units with an odd number of carbons is reduced, but not totally eliminated, as the intermediary 3-hydroxyvaleryl-CoA can be degraded to propionyl-CoA and acetyl-CoA, which can be used for PHB synthesis [15,36,37,39]. To determine the influence of the total acid concentration and the ratio of acetic acid to valeric acid on PHBV production of C. necator, a series of shake flask experiments were conducted which differed in the relative ratio of acetic and valeric acid added while keeping the total acid concentration constant at 3 and 6 g/L. The fraction of 3HV in the resulting PHBV copolymer was dependent on the ratio of acetic acid to valeric acid and not on the total acid concentration (Figure 3). Indeed, similar 3HB and 3HV fractions were obtained at an acetic acid to valeric acid ratio of 1:1, irrespective of the total acid concentration. Furthermore, C. necator favoured the consumption of valeric acid compared to acetic acid at ratio 1:1, while at higher concentrations of acetic acid, the opposite was observed. PHB production was also affected by total acid concentration (Table 2). As the objective of the study is to valorise CO2 towards biopolymers via the production of acetic acid, it was decided to further proceed with the research using an acetic to valeric acid ratio of 2:1.
In a search for inexpensive waste substrates to decrease PHA production costs, the use of organic acids—with acetic, propionic and butyric acid as the major fermentation products—recovered from anaerobically treated waste streams has been explored for PHA production by pure cultures [4,24,40,41]. These studies acknowledged the toxic effect of short-chain volatile fatty acids. Furthermore, our results are in line with the literature results. Khanna and Srivastava observed a decrease in the amount of biomass formed by C. necator NRRL B 14690 when increasing the initial valeric acid concentration from 2 to 4 g/L in the fermentation broth [38]. Volova and Kalacheva reported valeric acid concentrations above 2 g/L as toxic for C. necator B-5786 [42]. Several authors observed the favoured consumption of longer organic acids over acetic acid for cell growth. However, Huschner et al. and Grousseau et al. recently reported an antagonism in metabolism for acetic, propionic and butyric acid, which led to preferential consumption of butyric acid and propionic acid, depending on carbon fluxes directed to growth, as compared to fluxes going to PHA production [4,26].

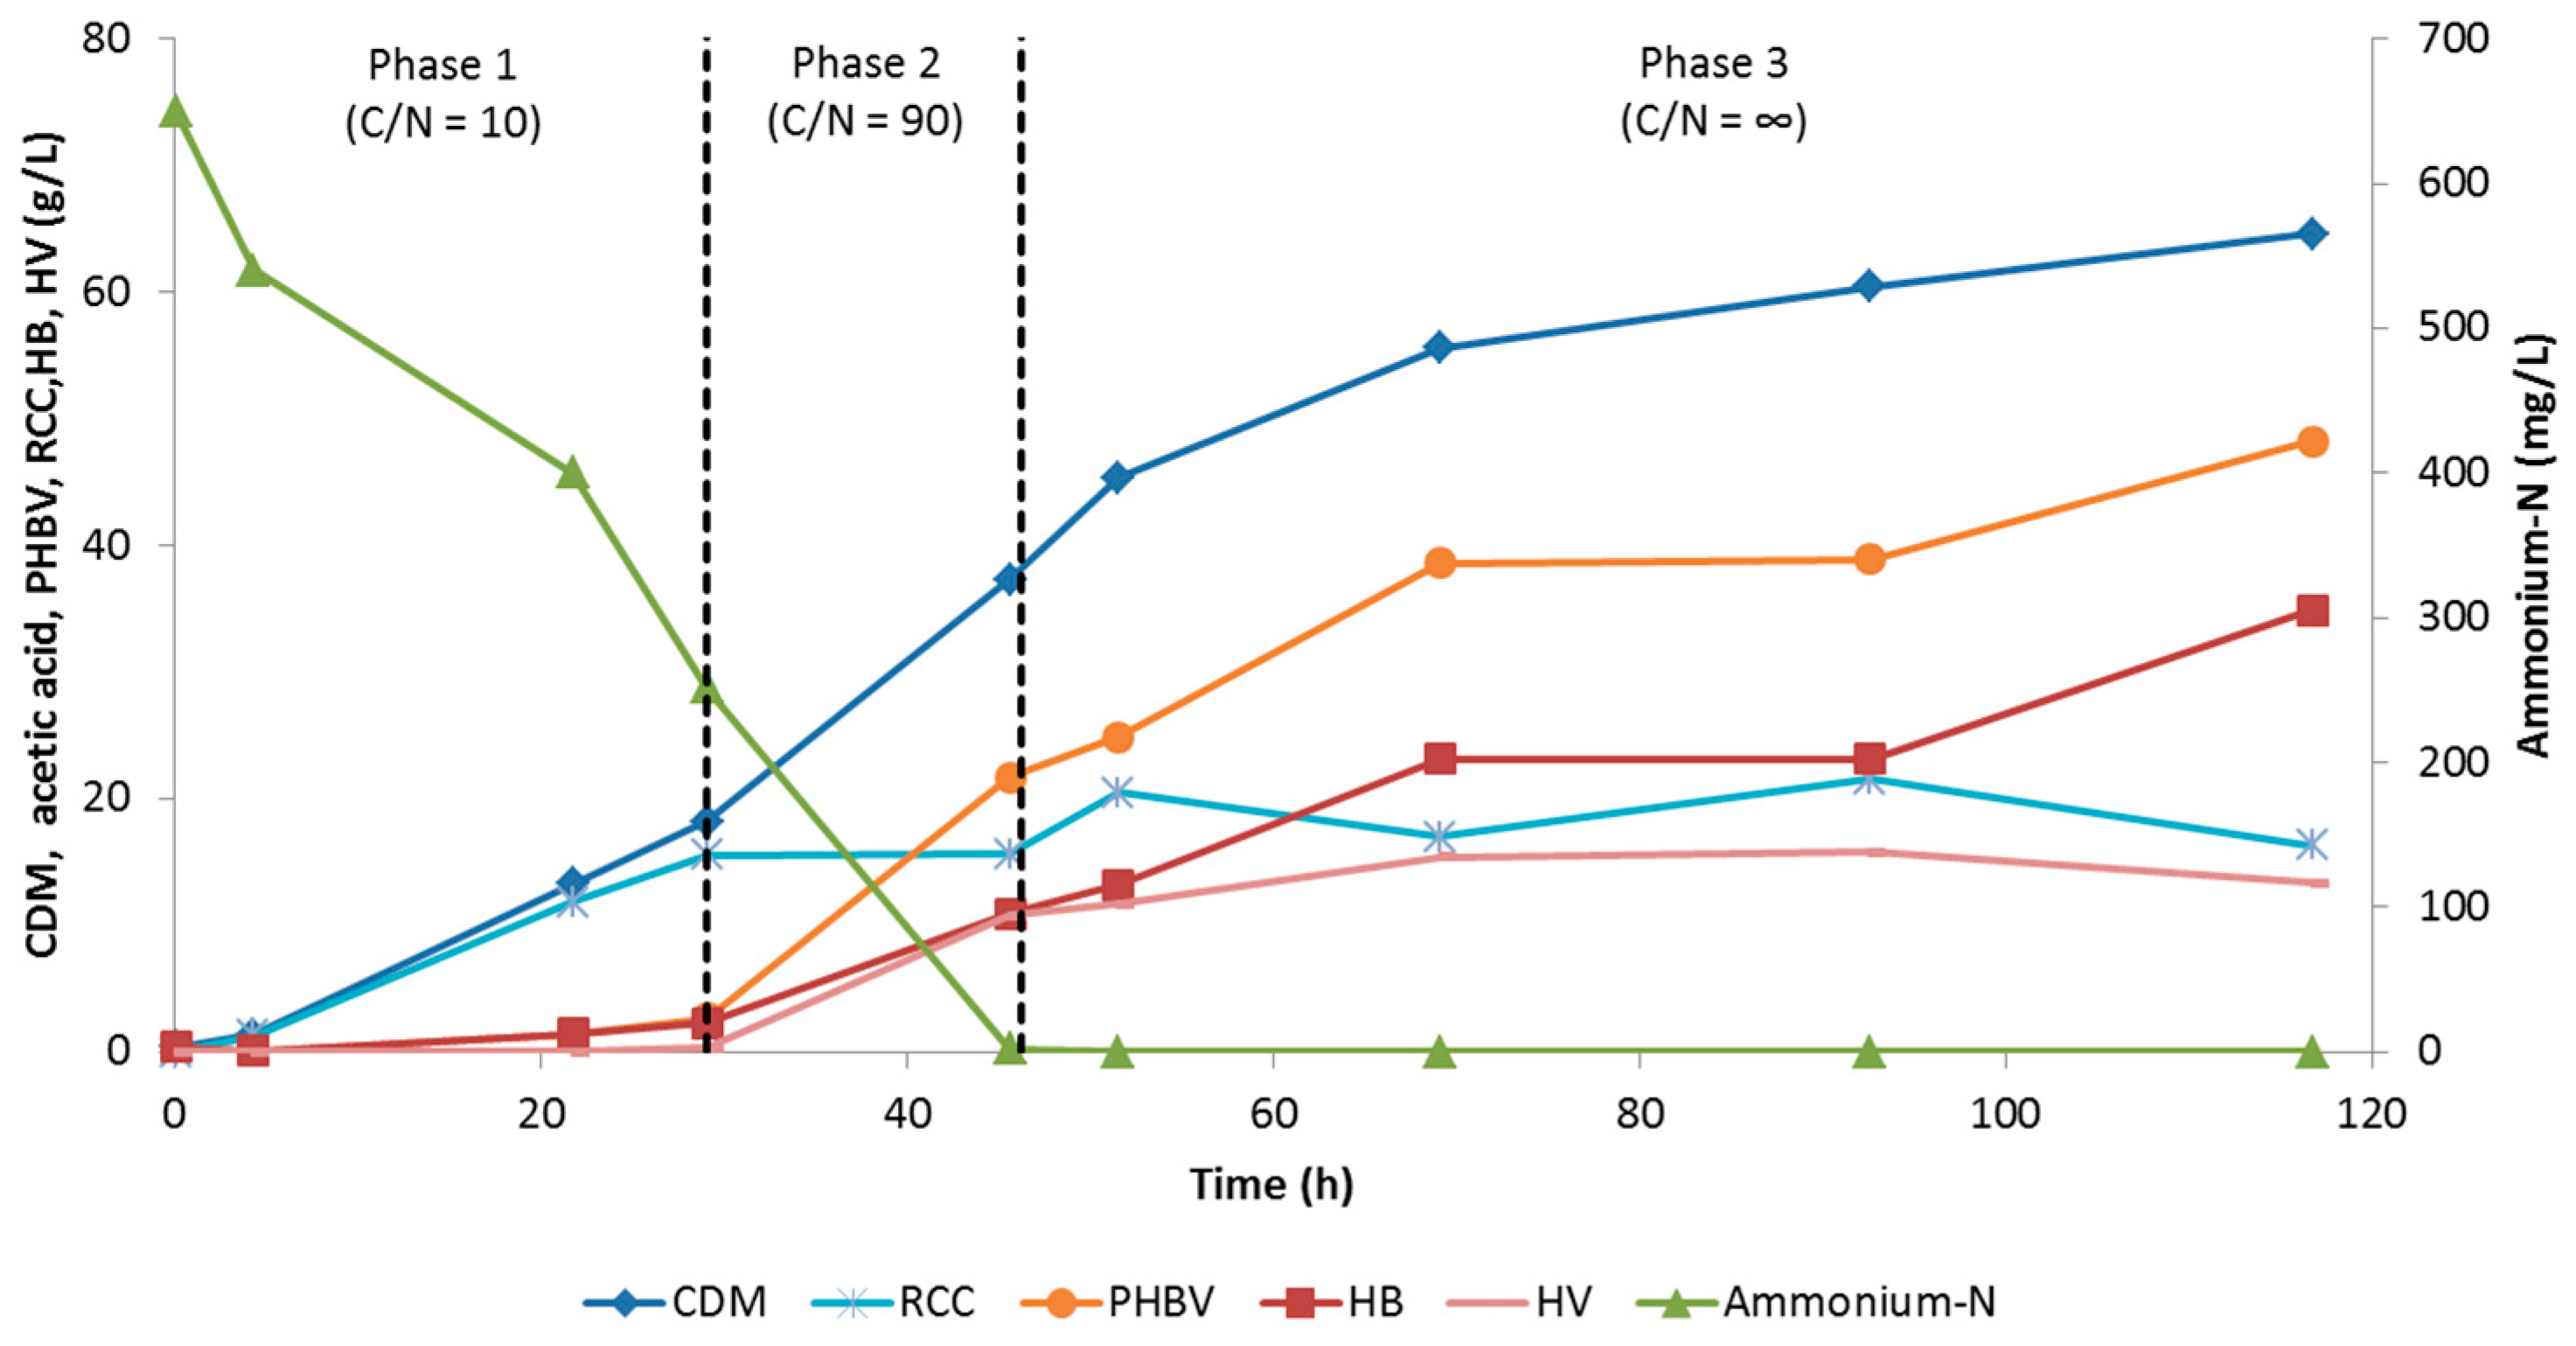
3.2.2. Evaluation of Three-Phase Fed-Batch Culture

Since including an intermediate phase consisting of both biomass and PHB production outperformed the overall process performance for PHB production, the three-phase feeding strategy was also selected for PHBV production. The overall results are shown in Figure 4. During the biomass growth phase (from 0 to 29 h), cell mass concentration increased exponentially to 18 g/L with a PHB content of 10%. In the second phase (from 29 to 46 h), accumulation of 3HV units started in the polymer chain as a result of the valeric acid cofeeding. A PHBV concentration and content of 22 g/L and 58%, respectively, was obtained. Equal amounts of 3HB and 3HV were synthesised, resulting in a 3HV fraction of 50 mol%. During the last phase (from 46 to 119 h), PHBV percentage increased up to 78%. Although both acetic and valeric acid were fed as carbon source, biopolymer production was almost fully attributed to 3HB synthesis. Indeed, as observed during the shake flask experiments, C. necator favoured consumption of acetic acid over valeric acid during PHA production. A total 3HB concentration of 35 g/L was obtained, while the 3HV concentration amounted to 13 g/L, corresponding to a 3HV fraction of 27 mol%. The final biomass and PHBV concentration were 65 g/L and 48 g/L, respectively. The PHBV productivity was 0.413 g/L/h. Acetic and valeric acid were maintained at low concentrations over the duration of the process (results not shown).
Fed-batch cultivation for the production of PHBV by C. necator has been investigated previously. Most studies have focused on propionic acid as a co-substrate due to its lower cost compared to valeric acid. However, in most of the cultivations, the 3HV fraction in the copolymer was in the range of 5–30%. The superior convertibility of valeric acid to 3HV units has been demonstrated in a few reports with carbohydrates as the main carbon source. Lee et al. obtained, after 50 h, a high cell density culture of 120 g/L with glucose and valeric acid containing 75% of PHBV with a maximum 3HV fraction of 20 mol% [36]. In another study, batch cultivation from fructose with one pulse feeding of 6 g/L valeric acid after 20 h resulted in the production of PHA containing a maximum of 54% HV units after 40 h [38]. However, at the end of the fermentation, 15 g/L CDM was obtained consisting of 50% PHBV with a 3HV fraction of 33 mol%. Comparable maximum and final HV fraction were obtained in this study.
Furthermore, the type of carbon source in the presence of valeric acid seems to affect PHBV monomer distribution. In the study by Khanna and Srivastava, a slight decrease of 3HB concentration was observed with the initiation of the valeric acid pulse in the presence of fructose. The incorporation of 3HB units in the polymeric chain started increasing again after the exhaustion of valeric acid, indicating the preferential consumption of valeric acid over fructose for C. necator. As a result, a block copolymer was most likely produced, consisting of 3HB (from acetic acid) and 3HV (from valeric acid) blocks of repeating units. In this study, simultaneous production of the monomers occurred during phase 2, which is indicative for the production of random PHBV [10]. Moreover, results showed that C. necator favoured consumption of valeric acid over acetic acid during growth, while during PHA production, consumption of acetic acid was preferential. The aforementioned antagonism in metabolism (see Section 3.2.1) [4,26] could thus be extended to acetic and valeric acid. By optimising the ratio of acetic to valeric acid in the feed during the last phase, the 3HV fraction can probably be increased.

3.3. Evaluation of PHA Production Processes Using CO2 as Feedstock

With the results of this study, three production processes using CO2 as feedstock can now be assessed:
  • the autotrophic–autotrophic process
  • the heterotrophic–autotrophic process
  • autotrophic–heterotrophic–heterotrophic process
Our calculations indicated that the indirect conversion of acetic acid from CO2 is an interesting alternative for the direct production of PHB from CO2 in terms of CO2 fixation, H2 consumption and substrate cost (Table 3). Furthermore, the bioconversion of CO2 to acetic acid is not paired with the use of potentially explosive gas mixtures, as is the case for H2 and O2. Also, in terms of process performance, the indirect production of PHB from CO2 via acetic acid is promising, as shown in Table 4. In this table, a summary of the literature results for PHB production obtained in fed-batch fermentations using C. necator from CO2 at CDM between 10 and 20 g/L at the onset of nitrogen limitation (phase 2) is given. The best process performance in terms of PHB concentration and content was obtained in this study. Tanaka et al. obtained a higher productivity in their process, but the gas composition during the autotrophic stage lies within the gas-explosion range [43]. With respect to PHBV production, a trade-off between PHBV concentration and 3HV fraction exists (Table 5). The highest concentration of PHBV was obtained in this study, while the highest 3HV fraction was generated using the heterotrophic–autotrophic cultivation system in the study of Ghysels et al. [9]. For both systems, biopolymer content and productivities were comparable (Table 5). By introducing an intermediate phase to enable a low residual biomass growth rate for maintaining an active metabolism, PHBV concentration and productivity could probably be increased further for the heterotrophic-autotrophic cultivation process. However, at higher biomass concentrations, mass transfer limitations could occur [8].
The indirect conversion of acetic acid from CO2 towards biopolymers looks promising. The production process should be optimised further by delaying nitrogen limitation to reach a higher residual biomass concentration and providing the nitrogen separately from the carbon feed via an additional pump. The latter would make it possible to use more concentrated carbon feeding solutions. PHA production from acetic acid also requires a highly concentrated feedstock to avoid dilution effects. Dedicated research should focus on the integrated process and its design. Furthermore, a techno-economic assessment should be performed to elucidate the viability of the process.

4. Conclusions

  • Acetic acid exhibits a toxic effect on cell growth when present above 3 g/L.
  • A three-phase fed-batch culture consisting of biomass growth, biomass growth and PHA production, and PHA production outperformed a conventional two-phase cultivation system.
  • PHB production by C. necator from acetic acid resulted in the highest PHB concentration reported so far.
  • C. necator favoured consumption of valeric acid over acetic acid during growth, while during PHA production, consumption of acetic acid was preferential.
  • Production of PHBV by C. necator from acetic acid and valeric acid is promising for attaining a high 3HV fraction in the polymeric chain.
  • The indirect conversion of acetic acid from CO2 is an interesting alternative for the direct production of PHA from CO2 in terms of CO2 fixation, H2 consumption, substrate cost, safety and process performance.

Author Contributions

L.G.-G. and H.D.W. conceived and designed the experiments; L.G.-G. performed the experiments, analysed the data and wrote the paper; H.D.W. supervised the research and revised the manuscript.

Funding

This research was funded by the Environmental and Energy Technology Innovation Platform (MIP).

Acknowledgments

The authors acknowledge Staf Wouters, Silvia Vangeel, Helmut Elslander and Filip Vanhoof for their technical support.

Conflicts of Interest

The authors declare no conflict of interest.

References

  1. 2030 Climate & Energy Framework. Available online: https://ec.europa.eu/clima/policies/strategies/2030_en (accessed on 1 May 2018).
  2. Carbon Capture Utilisation and Storage. Available online: https://setis.ec.europa.eu/setis-reports/setis-magazine/carbon-capture-utilisation-and-storage/chemical-valorisation-of-co2 (accessed on 1 May 2018).
  3. Bugnicourt, E.; Cinelli, P.; Lazzeri, A.; Alvarez, V. Polyhydroxyalkanoate (PHA): Review of synthesis, characteristics, processing and potential applications in packaging. Express Polym. Lett. 2014, 8, 791–808. [Google Scholar] [CrossRef] [Green Version]
  4. Huschner, F.; Grousseau, E.; Brigham, C.J.; Plassmeier, J.; Popovic, M.; Rha, C.; Sinskey, A.J. Development of a feeding strategy for high cell and PHA density fed-batch fermentation of Ralstonia eutropha H16 from organic acids and their salts. Process Biochem. 2015, 50, 165–172. [Google Scholar] [CrossRef]
  5. Garcia-Gonzalez, L.; De Wever, H. Valorisation of CO2-rich off-gases to biopolymers through biotechnological process. FEMS Microbiol. Lett. 2017, 364, 1–8. [Google Scholar] [CrossRef] [PubMed]
  6. Ishizaki, A.; Tanaka, K.; Taga, N. Microbial production of poly-D-3-hydroxybutyrate from CO2. Appl. Microbiol. Biotechnol. 2001, 57, 6–12. [Google Scholar] [CrossRef] [PubMed]
  7. Mozumder, M.S.I.; Garcia-Gonzalez, L.; De Wever, H.; Volcke, E.I.P. Poly(3-hydroxybutyrate) (PHB) production from CO2: Model development and process optimization. Biochem. Eng. J. 2015, 98, 107–116. [Google Scholar] [CrossRef]
  8. Garcia-Gonzalez, L.; Mozumder, M.S.I.; Dubreuil, M.; Volcke, E.I.P.; De Wever, H. Sustainable autotrophic production of polyhydroxybutyrate (PHB) from CO2 using a two-stage cultivation system. Catal. Today 2015, 257, 237–245. [Google Scholar] [CrossRef]
  9. Ishizaki, A.; Tanaka, K. Production of poly-β-hydroxybutyric acid from carbon dioxide by Alcaligenes eutrophus ATCC 17697T. J. Ferment. Bioeng. 1991, 71, 254–257. [Google Scholar] [CrossRef]
  10. Ghysels, S.; Mozumder, M.S.I.; De Wever, H.; Volcke, E.I.P.; Garcia-Gonzalez, L. Targeted poly(3-hydroxybutyrate-co-3-hydroxyvalerate) bioplastic production from carbon dioxide. Bioresour. Technol. 2018, 249, 858–868. [Google Scholar] [CrossRef] [PubMed]
  11. Ragsdale, S.W. Enzymology of the Wood-Ljungdahl pathway of acetogenesis. Ann. N. Y. Acad. Sci. 2008, 1125, 129–136. [Google Scholar] [CrossRef] [PubMed]
  12. Valentino, F.; Morgan-Sagastume, F.; Campanari, S.; Villano, M.; Werker, A.; Majone, M. Carbon recovery from wastewater through bioconversion into biodegradable polymers. New Biotechnol. 2017, 37, 9–23. [Google Scholar] [CrossRef] [PubMed]
  13. Arslan, D.; Steinbusch, K.J.J.; Diels, L.; Hamelers, H.V.M.; Strik, D.P.B.T.B.; Buisman, C.J.N.; De Wever, H. Selective short-chain carboxylates production: A review of control mechanisms to direct mixed culture fermentations. Crit. Rev. Environ. Sci. Technol. 2016, 46, 592–634. [Google Scholar] [CrossRef]
  14. Wang, J.; Yue, Z.B.; Sheng, G.P.; Yu, H.Q. Kinetic analysis on the production of polyhydroxyalkanoates from volatile fatty acids by Cupriavidus necator with a consideration of substrate inhibition, cell growth, maintenance, and product formation. Biochem. Eng. J. 2010, 49, 422–428. [Google Scholar] [CrossRef]
  15. Grousseau, E.; Blanchet, E.; Déléris, S.; Albuquerque, M.G.E.; Paul, E.; Uribelarrea, J.L. Phosphorus limitation strategy to increase propionic acid flux towards 3-hydroxyvaleric acid monomers in Cupriavidus necator. Bioresour. Technol. 2014, 153, 206–215. [Google Scholar] [CrossRef] [PubMed]
  16. Mozumder, M.S.I.; De Wever, H.; Volcke, E.I.P.; Garcia-Gonzalez, L. A robust fed-batch feeding strategy independent of the carbon source for optimal polyhydroxybutyrate production. Process Biochem. 2014, 49, 365–373. [Google Scholar] [CrossRef]
  17. Wang, J.; Yu, J. Kinetic analysis on inhibited growth and poly(3-hydroxybutyrate) formation of Alcaligenes eutrophus on acetate under nutrient-rich conditions. Process Biochem. 2000, 36, 201–207. [Google Scholar] [CrossRef]
  18. Wang, J.; Yu, J. Kinetic analysis on formation of poly(3-hydroxybutyrate) from acetic acid by Ralstonia eutropha under chemically defined conditions. J. Ind. Microbiol. Biotechnol. 2001, 26, 121–126. [Google Scholar] [CrossRef] [PubMed]
  19. Sugimoto, T.; Tsuge, T.; Tanaka, K.; Ishizaki, A. Control of acetic acid concentration by pH-stat continuous substrate feeding in heterotrophic culture phase of two-stage cultivation of Alcaligenes eutrophus for production of P(3HB) from CO2, H2, and O2 under non-explosive conditions. Biotechnol. Bioeng. 1999, 62, 625–631. [Google Scholar] [CrossRef]
  20. Salmond, C.V.; Kroll, R.G.; Booth, I.R. The effect of food preservatives on pH homeostasis in Escherichia coli. J. Gen. Microbiol. 1984, 130, 2845–2850. [Google Scholar] [CrossRef] [PubMed]
  21. Lawford, H.G.; Rousseau, J.D. Effects of pH and acetic acid on glucose and xylose metabolism by a genetically engineered ethanologenic Escherichia coli. Appl. Biochem. Biotechnol. 1993, 39, 301–322. [Google Scholar] [CrossRef] [PubMed]
  22. Roe, A.J.; McLaggan, D.; Davidson, I.; O’Byrne, C.; Booth, I.R. Perturbation of anion balance during inhibition of growth of Escherichia coli by week acids. J. Bacteriol. 1998, 180, 767–772. [Google Scholar] [PubMed]
  23. Axe, D.D.; Bailey, J.E. Transport of lactate and acetate through the energized cytoplasmic membrane of Escherichia coli. Biotechnol. Bioeng. 1995, 47, 8–19. [Google Scholar] [CrossRef] [PubMed]
  24. Yu, J.; Si, Y.; Wong, W.K.R. Kinetics modeling of inhibition and utilization of mixed volatile fatty acids in the formation of polyhydroxyalkanoates by Ralstonia eutropha. Process Biochem. 2002, 37, 731–738. [Google Scholar] [CrossRef]
  25. Warnecke, T.; Gill, R.T. Organic acid toxicity, tolerance, and production in Escherichia coli biorefining applications. Microb. Cell Factories 2005, 4. [Google Scholar] [CrossRef] [PubMed]
  26. Grousseau, E.; Blanchet, E.; Déléris, S.; Albuquerque, M.G.; Paul, E.; Uribelarrea, J.L. Impact of sustaining a controlled residual growth on polyhydroxybutyrate yield and production kinetics in Cupriavidus necator. Bioresour. Technol. 2013, 148, 30–38. [Google Scholar] [CrossRef] [PubMed]
  27. Shi, H.; Shiraishi, M.; Shimizu, K. Metabolic flux analysis for biosynthesis of poly(ß-hydroxybutyric acid) in Alcaligenes eutrophus from various carbon sources. J. Ferment. Bioeng. 1997, 84, 579–587. [Google Scholar] [CrossRef]
  28. Serafim, L.S.; Lemos, P.C.; Oliveira, R.; Reis, M.A.M. Optimization of polyhydroxybutyrate production by mixed cultures submitted to aerobic dynamic feeding conditions. Biotechnol. Bioeng. 2004, 87, 145–160. [Google Scholar] [CrossRef] [PubMed]
  29. Jian, Y.; Marang, L.; Kleerebezem, R.; Muyzer, G.; van Loosdrecht, M.C.M. Effect of temperature and cycle length on microbial competition in PHB-producing sequencing batch reactor. ISME J. 2011, 5, 896–907. [Google Scholar] [CrossRef] [PubMed]
  30. Johnson, K.; Jian, Y.; Kleerebezem, R.; Muyzer, G.; van Loosdrecht, M.C.M. Enrichment of a mixed bacterial culture with a high polyhydroxyalkanoate storage capacity. Biomacromolecules 2009, 10, 670–676. [Google Scholar] [CrossRef] [PubMed]
  31. Johnson, K.; Kleerebezem, R.; van Loosdrecht, M.C.M. Influence of the C/N ratio on the performance of polyhydroxybutyrate (PHB) producing sequencing batch reactors at short SRTs. Water Res. 2010, 7, 2141–2152. [Google Scholar] [CrossRef] [PubMed]
  32. Wen, Q.; Chen, Z.; Tian, T.; Chen, W. Effects of phosphorus and nitrogen limitation on PHA production in activated sludge. J. Environ. Sci. 2010, 22, 1602–1607. [Google Scholar] [CrossRef]
  33. Valentino, F.; Karabegovic, L.; Majone, M.; Morgan-Sagastume, F.; Werker, A. Polyhydroxyalkanoate (PHA) storage within a mixed-culture biomass with simultaneous growth as a function of accumulation substrate nitrogen and phosphorus levels. Water Res. 2015, 77, 49–63. [Google Scholar] [CrossRef] [PubMed]
  34. Salehizadeh, H.; Van Loosdrecht, M.C.M. Production of polyhydroxyalkanoates by mixed culture: Recent trends and biotechnological importance. Biotechnol. Adv. 2004, 22, 261–279. [Google Scholar] [CrossRef] [PubMed]
  35. Albuquerque, M.G.E.; Martino, V.; Pollet, E.; Avérous, L.; Reis, M.A.M. Mixed culture polyhydroxyalkanoate (PHA) production from volatile fatty acid (VFA)-rich streams: Effect of substrate composition and feeding regime on PHA productivity, composition and properties. J. Biotechnol. 2011, 151, 66–76. [Google Scholar] [CrossRef] [PubMed]
  36. Lee, I.Y.; Kim, M.K.; Kim, G.J.; Chang, H.N.; Park, Y.H.; Park, Y.H. Production of poly(ß-hydroxybutyrate-co-ß-hydroxyvalerate) from glucose and valerate in Alcaligenes eutrophus. Biotechnol. Lett. 1995, 17, 571–574. [Google Scholar] [CrossRef]
  37. Braunegg, G.; Lefebvre, G.; Genser, K.F. Polyhydroxyalkanoates, biopolyesters from renewable resources: Physiological and engineering aspects. J. Biotechnol. 1998, 65, 127–161. [Google Scholar] [CrossRef]
  38. Khanna, S.; Srivastava, A.K. Production of poly(3-hydroxybutyric-co-3-hydroxyvaleric acid) having a high hydroxyvalerate content with valeric acid feeding. J. Ind. Microbiol. Biotechnol. 2007, 34, 457–461. [Google Scholar] [CrossRef] [PubMed]
  39. Doi, Y.; Tamaki, A.; Kunioka, M.; Soga, K. Production of copolyesters of 3-hydroxybutyrate and 3-hydroxyvalerate by Alcaligenes eutrophus from butyric and pentanoic acids. Appl. Microbiol. Biotechnol. 1988, 28, 330–334. [Google Scholar] [CrossRef]
  40. Yang, Y.H.; Brigham, C.J.; Budde, C.F.; Boccazzi, P.; Willis, L.B.; Hassan, M.A.; Yusof, Z.A.M.; Rha, C.; Sinskey, A.J. Optimization of growth media components for polyhydroxyalkanoate (PHA) production from organic acids by Ralstonia eutropha. Appl. Microbiol. Biotechnol. 2010, 87, 2037–2045. [Google Scholar] [CrossRef] [PubMed] [Green Version]
  41. Chakraborty, P.; Gibbons, W.; Muthukumarappan, K. Conversion of volatile fatty acids into polyhydroxyalkanoate by Ralstonia eutropha. J. Appl. Microbiol. 2009, 106, 1996–2005. [Google Scholar] [CrossRef] [PubMed]
  42. Volova, T.G.; Kalacheva, G.S. The synthesis of hydroxybutyrate and hydroxyvalerate copolymers by the bacterium Ralstonia eutropha. Microbiology 2005, 74, 54–59. [Google Scholar] [CrossRef]
  43. Tanaka, K.; Ishizaki, A. Production of poly-d-3-hydroxybutyric acid from carbon dioxide by a two-stage culture method employing Alcaligenes eutrophus ATCC 17697T. J. Ferment. Bioeng. 1994, 77, 425–427. [Google Scholar] [CrossRef]
  44. Volova, T.G.; Voinov, N.A. Kinetic parameters of a culture of the hydrogen-oxidizing bacterium Ralstonia eutropha grown under conditions favoring polyhydroxybutyrate biosynthesis. Appl. Biochem. Microbiol. 2003, 39, 166–170. [Google Scholar] [CrossRef]
  45. Volova, T.G.; Kalacheva, G.S.; Gorbunova, O.V.; Zhila, N.O. Dynamics of activity of the key enzymes of polyhydroxyalkanoate metabolism in Ralstonia eutropha B5786. Appl. Biochem. Microbiol. 2004, 40, 170–177. [Google Scholar] [CrossRef]
  46. Darani, K.K.; Vasheghani-Farahani, E.; Tanaka, K. Hydrogen oxidizing bacteria as poly(hydroxybutyrate) producers. Iran. J. Biotechnol. 2006, 4, 193–196. [Google Scholar]
  47. Volova, T.G.; Kalacheva, G.S.; Steinbüchel, A. Biosynthesis of multi-component polyhydroxyalkanoates by the bacterium Wautersia eutropha. Macromol. Symp. 2008, 269, 1–7. [Google Scholar] [CrossRef]
  48. Park, I.; Jho, E.H.; Nam, K. Optimization of carbon dioxide and valeric acid utilization for polyhydroxyalkanoates synthesis by Cupriavidus necator. J. Polym. Environ. 2014, 22, 244–251. [Google Scholar] [CrossRef]
  49. Volova, T.G.; Kiselev, E.G.; Shishatskaya, E.I.; Zhila, N.O.; Boyandin, A.N.; Syrvacheva, D.A.; Vinogradova, O.N.; Kalacheva, G.S.; Vasiliev, A.D.; Peterson, I.V. Cell growth and accumulation of polyhydroxyalkanoates from CO2 and H2 of a hydrogen-oxidizing bacterium, Cupriavidus eutrophus B-10646. Bioresour. Technol. 2013, 146, 215–222. [Google Scholar] [CrossRef] [PubMed]
Figure 1. Effect of the initial acetic acid concentration on the cell growth of C. necator in shake flask after 24 h of incubation. Results are shown as average ± standard deviation.
Applsci 08 01416 g001
Figure 2. Fed-batch fermentation of C. necator for PHB production using acetic acid as carbon source. The accumulation of biomass (CDM), PHB, residual cell concentration (RCC) and acetic acid concentration over time of fermentation are shown. (a) Two-phase feeding strategy; (b) Three-phase feeding strategy.
Applsci 08 01416 g002
Figure 3. Effect of ratio acetic to valeric acid on PHBV content of C. necator in shake flask after 24 h of incubation. Results are shown as average of two independent experiments. Standard deviation (not shown) was smaller than 2.5%.
Applsci 08 01416 g003
Figure 4. Fed-batch fermentation of C. necator for PHBV production using acetic acid and valeric acid as carbon source. The accumulation of biomass (CDM), PHB, residual cell concentration (RCC), acetic acid and valeric acid concentration over time of fermentation are shown. A three-phase feeding strategy was applied.
Applsci 08 01416 g004
Table 1. Composition of pH-stat feeding solution for PHB and PHBV production.
Cmole/NmolePHB ProductionPHBV Production
Acetic Acid (g/L)(NH4)2SO4 (g/L)Acetic Acid (g/L)Valeric Acid (g/L)(NH4)2SO4 (g/L)
10330 72.6330072.6
906601670035059.4
66007003500
Table 2. Consumption rate of acetic and valeric acid during PHB production of C. necator in shake flask.
Total Acid Concentration (g/L)C2:C5 RatioAcetic Acid (g/L/h)Valeric Acid (g/L/h)
31:10.0470.108
32:10.1560.129
34:10.2430.074
31:20.0480.158
61:10.0950.151
Table 3. Comparison of processes in terms of CO2 and H2 consumption based on mass balances (Equations (1)–(6)).
Cultivation ProcessFeedstockkg CO2/kg PHBkg H2/kg PHB
Autotrophic-autotrophicCO22.840.96
Heterotrophic-autotrophicGlucose/CO21.580.77
Autotrophic-heterotrophic-heterotrophicCO2/acetic acid2.840.42
Heterotrophic-heterotrophicGlucose0 (emits 2.81)0
Table 4. Summary of PHB production in fed-batch fermentations of C. necator at CDM between 10 and 20 g/L at the onset of nutrient limitation using CO2 or acetic acid as carbon source and continuous stirred-tank reactor (CSTR) in decreasing order of final PHB concentration. Gas composition ratios that lie within the gas-explosion range (using lower explosion limit of 5.0 vol % O2) are indicated in bold.
Carbon Source Phase 1 Phase 2 Phase 3H2:O2:CO2 (vol %)CDM at Onset of Phase 2 (g/L)CDM (g/L)PHB (g/L)PHB Content (%)PHB Productivity (g/L/h)Reference
Acetic acidAcetic acidAcetic acid-176043720.365This study
Acetic acidAcetic acid--154030750.257This study
GlycerolCO2-84.0:2.8:13.2194628610.168[8]
FructoseCO2-84.1:6.7:10.3154324560.632[43]
GlucoseCO2-84.0:2.8:13.2133824630.108[5]
CO2CO2-60:20:10103022750.314[44]
FructoseCO2-83.0:5.3:10.6102715560.237[43]
GlycerolCO2-84.0:2.8:13.2101813720.187[8]
CO2CO2-60:20:1010128630.105[45]
CO2CO2-70:20:1010166380.150[46]
Table 5. Summary of PHBV production in fed-batch fermentations of C. necator using CO2 or acetic acid as carbon source and continuous stirred-tank reactor (CSTR) in decreasing order of final PHBV concentration. Gas composition ratios that lie within the gas-explosion range (using lower explosion limit of 5.0 vol % O2) are indicated in bold.
Carbon Source Phase 1 Phase 2 Phase 3H2:O2:CO2 (vol %)CDM at Onset of Phase 2 (g/L)CDM (g/L)PHBV (g/L)fHV (mol %)PHBV Content (%)PHBV Productivity (g/L/h)Reference
Acetic acidAcetic-valeric acidAcetic-valeric acid-19654827740.413This study
GlucoseCO2-valeric acid-84:2.8:13.215322572780.480[10]
CO2CO2-valeric acid-60:20:1011181528800.188[42]
CO2CO2-valeric acid-NS 1NS7.36.542900.135[47]
CO2CO2-valeric acid-77.78:11.11:11.11NSNS1.232NS0.005[48]
CO2CO2-valeric acid-70:20:10NSNSNS64NSNS[49]
1 NS, not specified.

