2.2. Long-Term Cycling
For the ageing study presented in this research work, accelerated ageing tests have been performed by cycling of a high energy lithium-ion battery cell at 35 °C. The cycling conditions are defined by the following specifications:
The State-of-Charge (SoC) (in %) which is defined by the ratio between the battery cell actual capacity and its nominal capacity, as expressed in Equation (
1):
The Depth-of-Discharge (DoD) (in %) which reflects the percentage of battery capacity that has been discharged expressed as a percentage of its actual maximum discharge capacity and is linked to the SoC in Equation (
2):
The middle State-of-Charge (mid-SoC) which is the SoC around which the battery cell is cycled.
Nominal Capacity which is the capacity expressed in Ampere-hours (Ah), specified by the manufacturer at specific conditions. In this research work, the nominal capacity of the studied battery cells is equal to 20 Ah.
The Charge/Discharge current rates expressed in terms of C-rate where the C-rate defines the rate at which a battery is discharged or charged relatively to its nominal capacity.
The Full Equivalent Cycles (FEC) (in case the cycling is performed with a DoD inferior to 100%), defines the amount of cycles needed to equal the same amount of Charge/Discharge capacity observed in case the cell would have been cycled with 100% DoD.
The Capacity Fade (
) (in %) indicates the loss of capacity of the battery observed in time by comparison of its actual capacity with its measured initial capacity, as expressed in Equation (
3):
The State of Health (SoH) (in %) translates the ageing of the battery cell and is defined with the Equation (
4):
In this research work, the cycling conditions were defined by 80% Depth of Discharge (DoD), which is defined as 50% mid-State of Charge (SoC) and 1C/1C (i.e., 20 A/20 A) current for the constant charge and discharge currents.
The reference amount of cycles is equal to 100 FEC where each cycle is defined by a repetition of one charge and one discharge sequences. The research work presented in this paper is based on one uncycled (or fresh) cell (i.e., cell 1) and one cycled (or aged) cell (i.e., cell 2) that was cycled up to 900 FEC.
Table 2 summarizes the testing of the studied cells and their purpose. Cells 1 and 2 were aimed for thermal characterisations of fresh and aged battery cells, respectively.
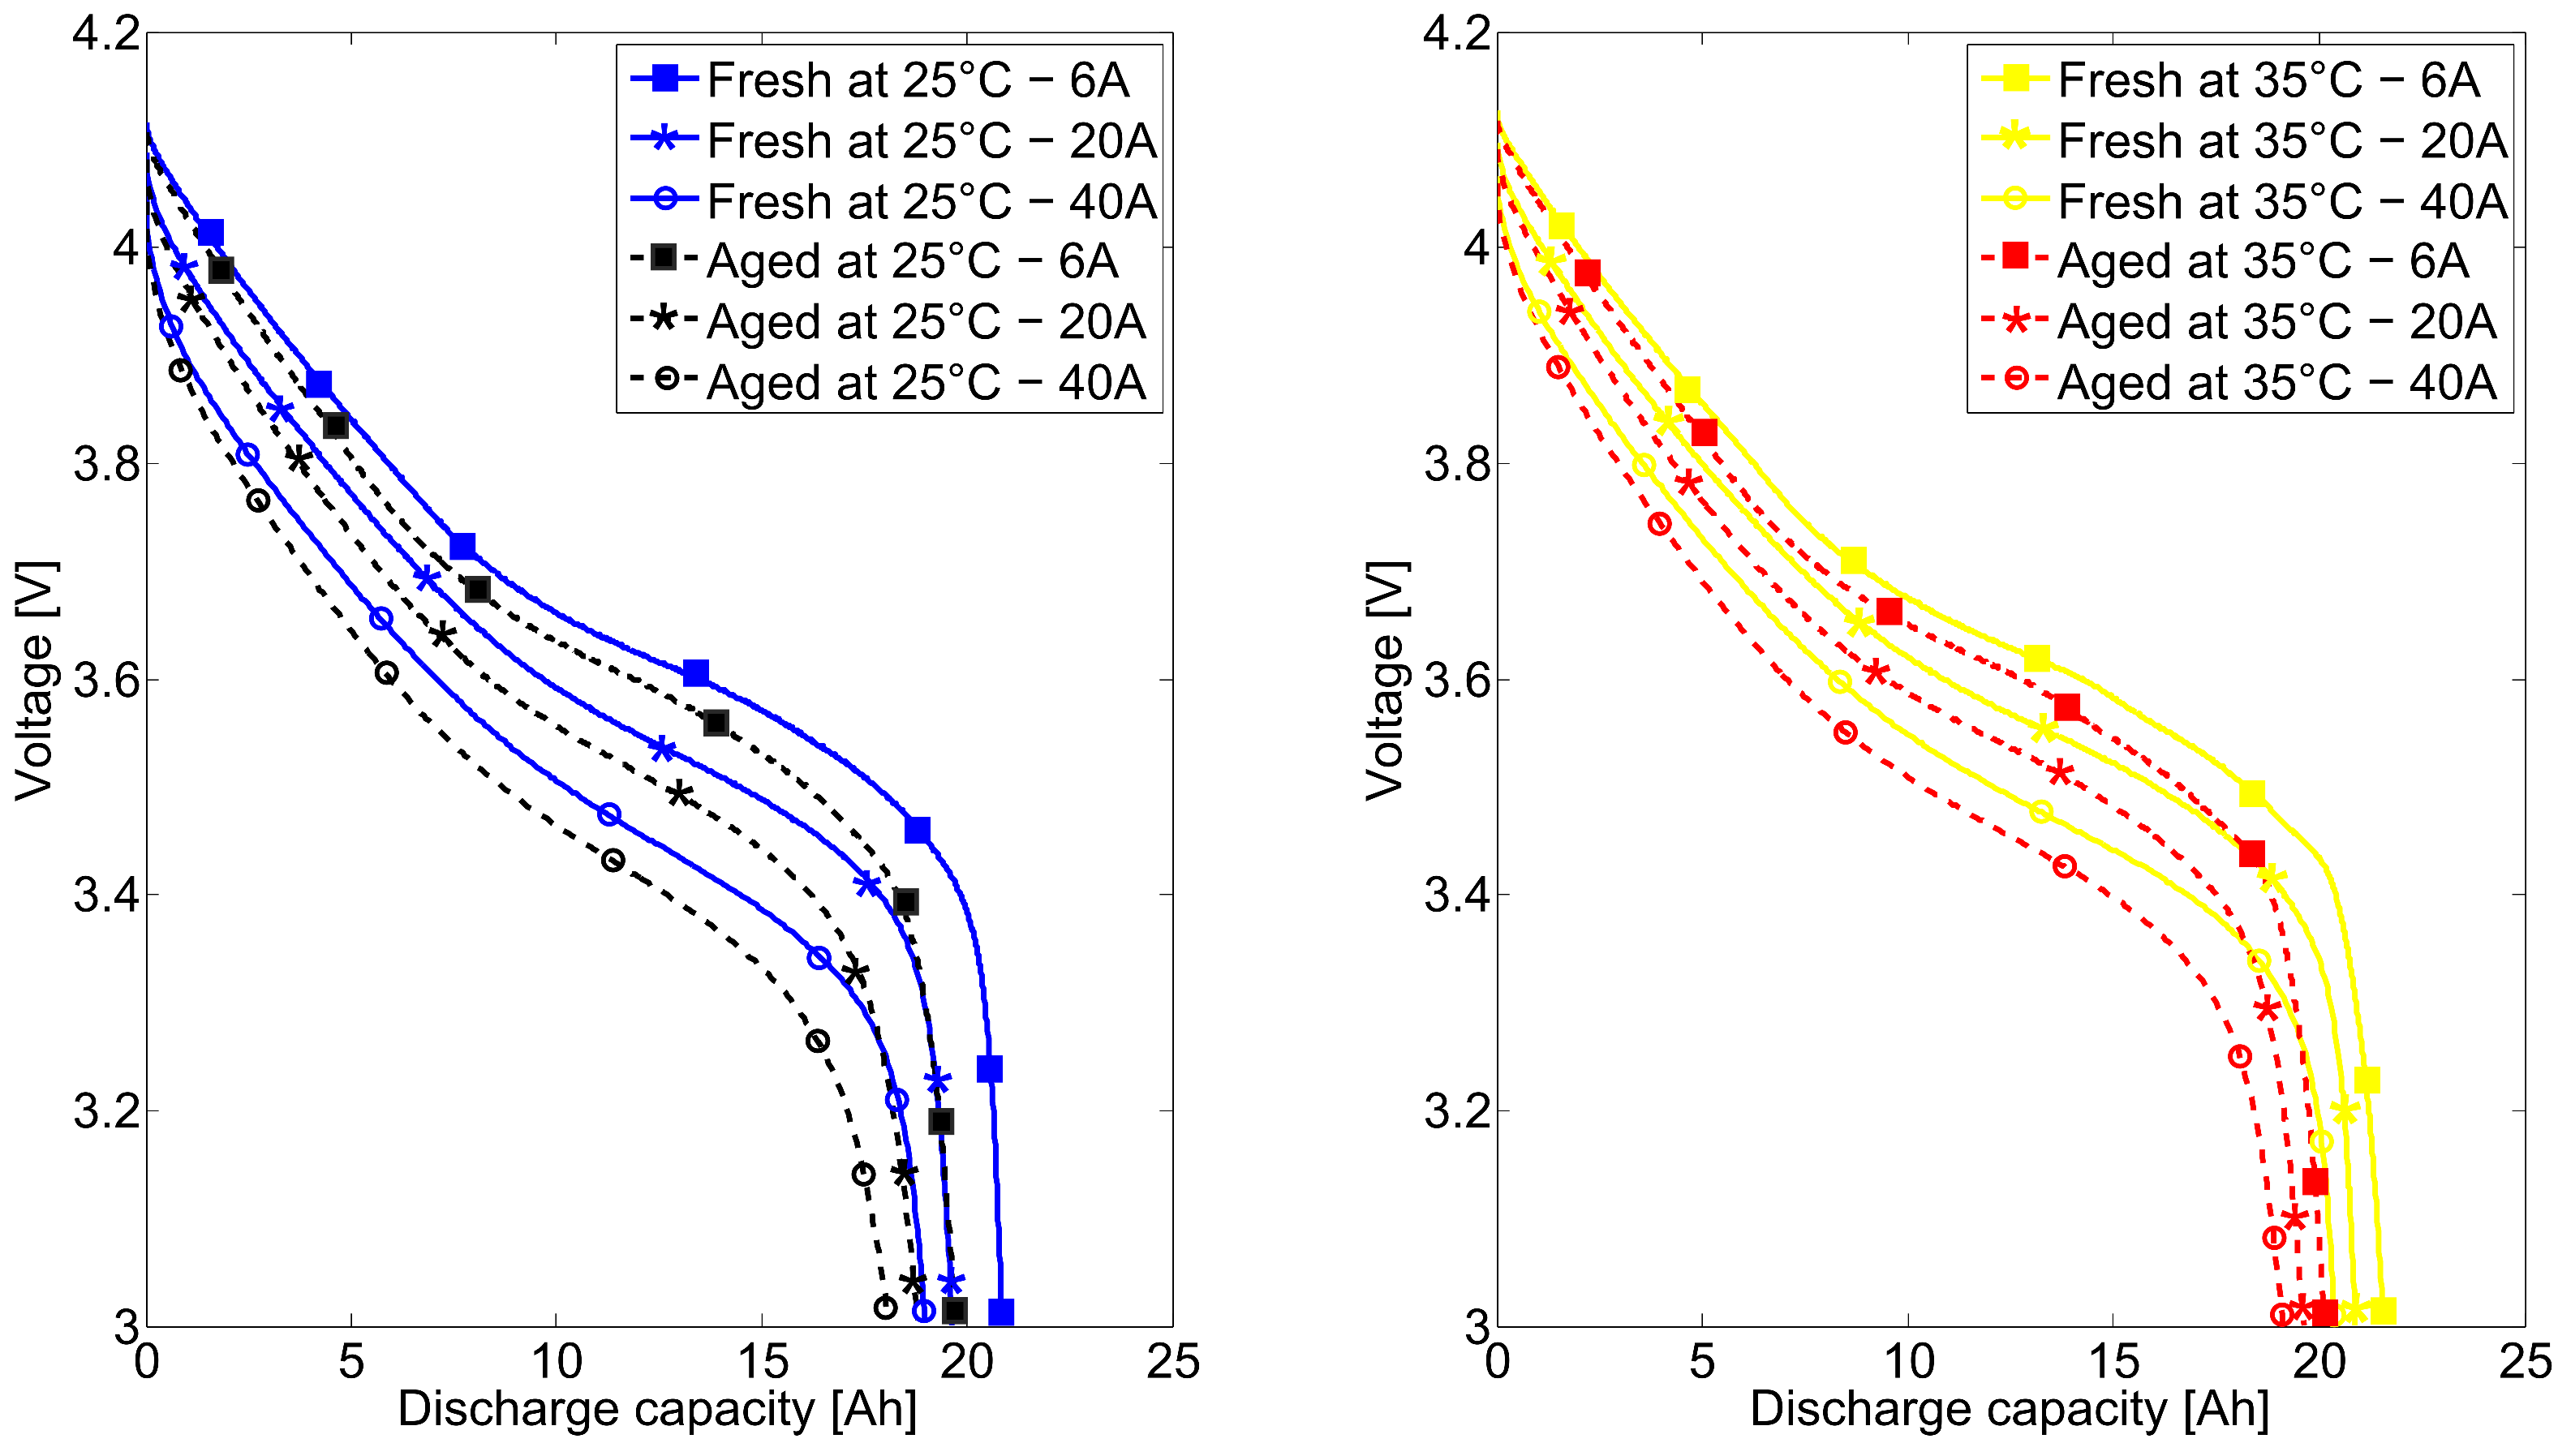
Capacity tests have been performed on both battery cells at the Begin Of Life (BoL) and as part of the Check-Ups (CUs) every 100 FEC on the cycled cell to monitor its SoH evolution and its capacity fade due to the accelerated ageing. This test is defined by a 3 times repetition of charge and discharge sequences at C/3 (6.666 A) current rate. In this paper, this test is presented at room temperature.
The evolution of the discharge capacity and the State-of-Health (SoH) of the cell 2 with the number of cycles is illustrated in
Figure 1. The capacity loss observed in
Figure 1 translates for the ageing of the cells caused by their cycling. The SoH evolution of the cells is based on the recording of their capacity at 25 °C every 100 FEC.
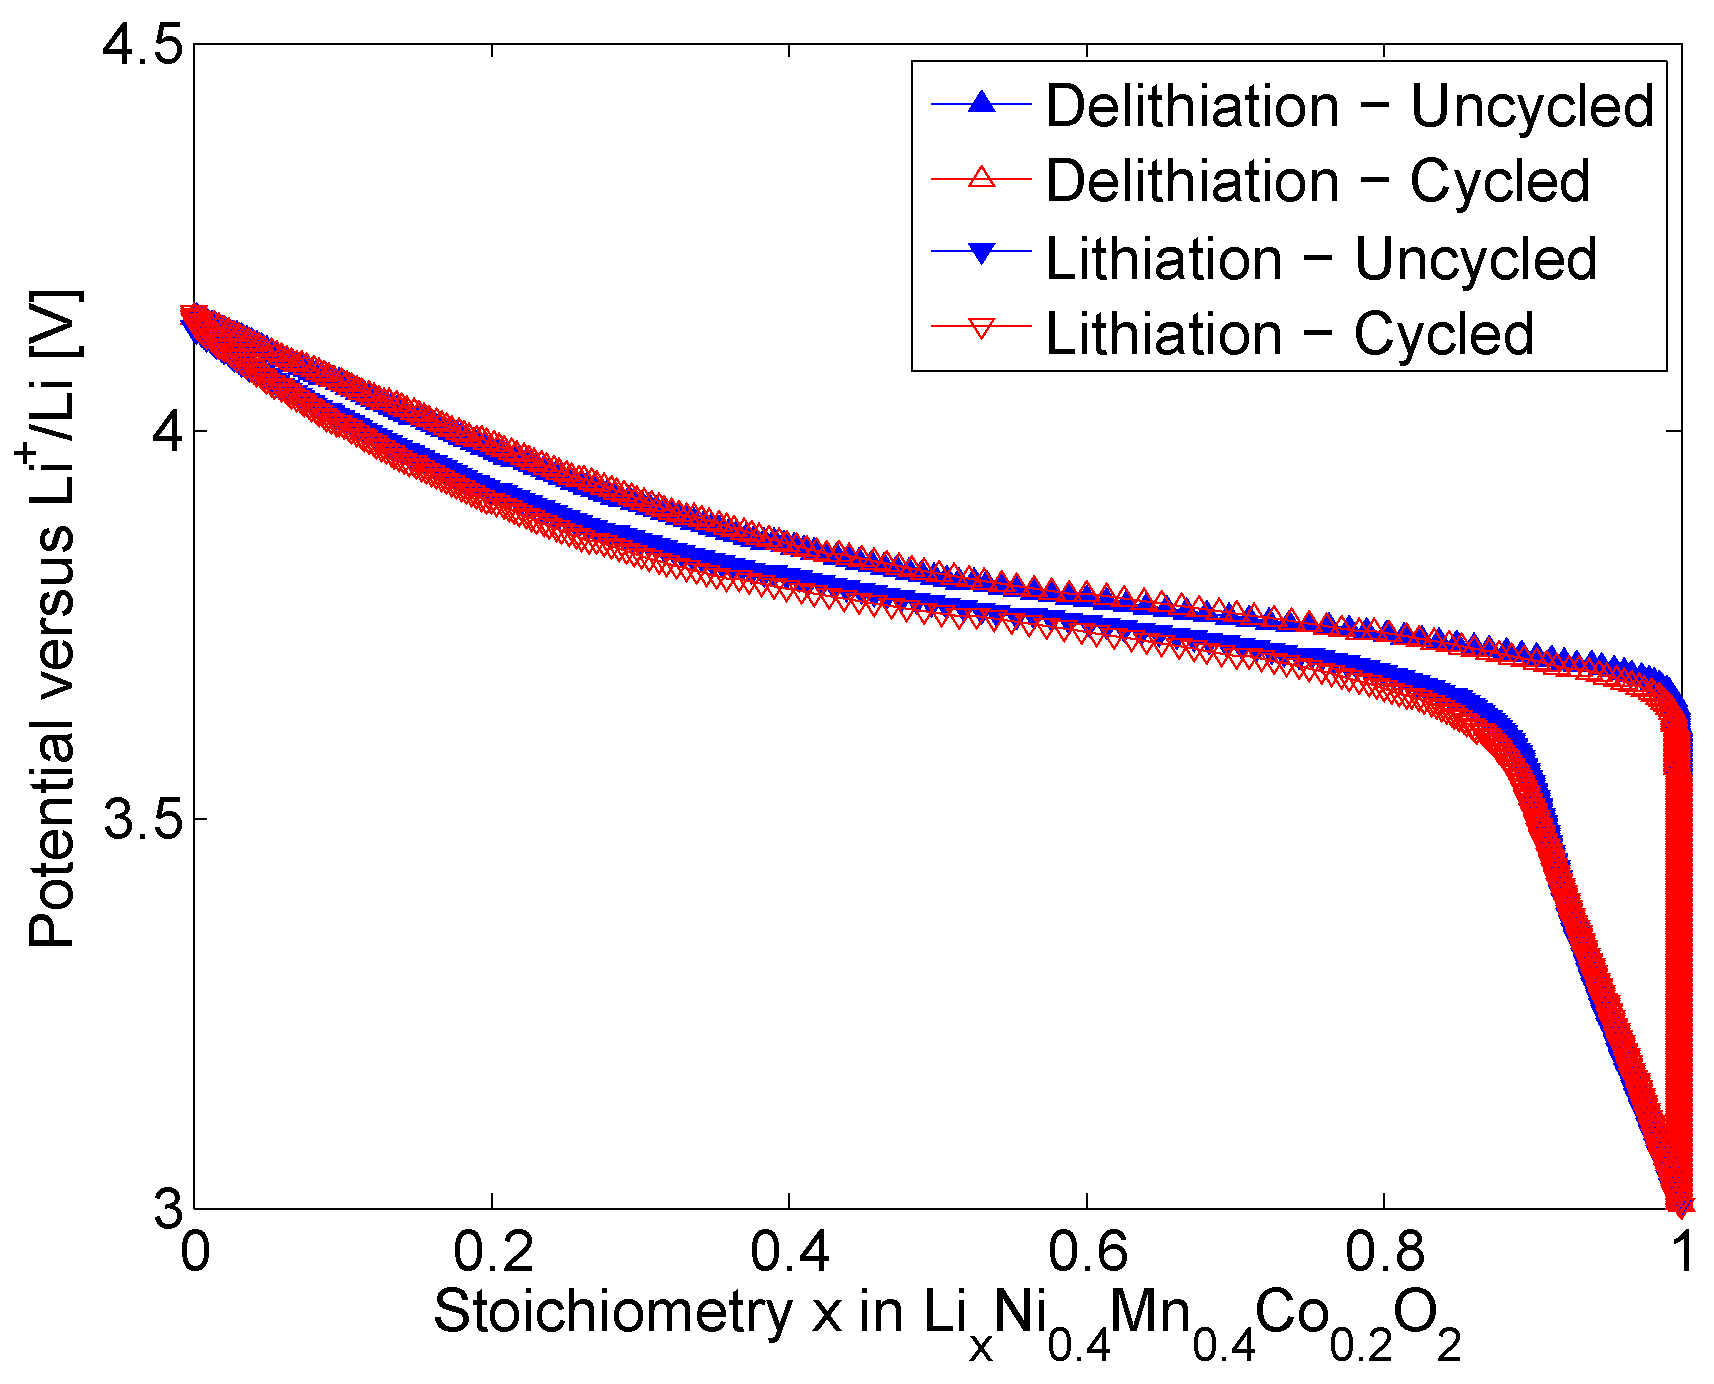
At the level of the electrodes, the measured Equilibrium Potential of the uncycled and cycled NMC positive electrodes are shown in in
Figure 2. The Equilibrium Potential of the electrodes dependent on the stoichiometry are in agreement with [
22,
32,
33]. Stoichiometry is defined by the amount of
intercalated in an electrode over the maximum amount of
that can be stored that electrode. As in
Figure 2, the stoichiometry varies between 0 and 1 representing the x in
. The highest Equilibrium Potential value corresponds to the lowest stoichiometry (0) of the electrode. With increasing stoichiometry, the Equilibrium Potential of the uncycled and cycled electrodes are decreasing down to 3 V during the lithiation of the electrodes. Reversely, as the delithiation of the electrodes proceeds the Equilibrium Potential of the electrodes are increasing up to 4.15 V. After long-term cycling, both loss of active material and loss of cyclable lithium are affecting the stoichiometries in the battery cells electrodes [
34]. NMC electrodes exhibit lower potential near the maximum stoichiometry in the end of the lithiation process in accordance with [
22,
32,
33]. This reflects for a faster lithiation process of cycled electrodes due to ageing. Reversely, higher potential near the minimum stoichiometry is observed for cycled electrodes due to their faster delithiation process. This behaviour leads to an increase in the hysteresis (difference between the Equilibrium Potential associated to the lithiation and the delithiation processes) of the cycled electrodes compared to uncycled electrodes.
In
Figure 3 (left), the measured discharge capacity of the uncycled and cycled NMC electrodes are illustrated. The cycled electrode exhibit a discharge capacity equal to 5.67 mAh when the initially uncycled electrode show a capacity equal to 5.87 mAh. Conformingly to what expected, the cycled NMC electrode is discharging faster, leading to a lower discharge capacity than prior long-term cycling. The analysis of the incremental discharge capacity (
) of both electrodes in
Figure 3 (right) confirms the impact of the long-term cycling on the performances of the initially uncycled electrodes. Indeed, a decrease in the intensity of the peak in the
curve is observed for the cycled electrode as observed in [
22,
32].
At the level of the negative electrodes, in
Figure 4, the measured Equilibrium Potential of the uncycled and cycled Graphite electrodes are presented. As previously observed for the positive electrode and in agreement with the literature [
33,
35,
36,
37,
38], the Equilibrium Potential of both uncycled and cycled electrodes are dependent on their stoichiometry. After long-term cycling, Graphite electrodes exhibit lower potential near the maximum stoichiometry in the end of the delithiation process. This reflects for a faster lithiation process of cycled electrodes due to ageing. Reversely, higher potential near the minimum stoichiometry is observed for cycled electrodes due to their faster delithiation process. These observations are in line with the behaviour of NMC electrodes measured after long-term cycling. Although, the hysteresis associated to the uncycled and cycled electrodes during their lithiation and delithiation processes is more marked for Graphite electrodes compared to NMC electrodes. This indicates for more significant ageing shown by the Graphite electrodes.
In
Figure 5 (left), the measured discharge capacity of the uncycled and cycled Graphite electrodes are illustrated. The cycled electrode exhibit a discharge capacity equal to 7.07 mAh when the initially uncycled electrode show a capacity equal to 7.34 mAh. Similarly to what observed for the NMC electrodes, the cycled Graphite electrode is discharging faster, leading to a lower discharge capacity than prior long-term cycling. Although, the difference in the discharge capacity of the uncycled and cycled electrodes is more strong for Graphite electrodes compared to NMC electrodes. This also indicates for more significant ageing shown by the Graphite electrodes. The incremental discharge capacity (
/
) curves of both electrodes, as shown in
Figure 5 (right), are exhibiting three peaks (two majors and one minor) in accordance with the literature [
35,
36,
37]. The analysis of the incremental discharge capacity (
/
) of both electrodes in
Figure 5 (right) confirms the impact of the long-term cycling on the performances of the initially uncycled electrodes. Indeed, the peaks in the
/
curve of the cycled electrode exhibit lower intensity than observed for the uncycled electrode. In addition, the incremental capacity curve is seen to shift towards lower potentials. This might be explained by the faster lithiation process of the cycled compared to the uncycled electrodes as a consequence of the long-term cycling (in agreement with what suggested by
Figure 4).
2.4. Numerical Simulation
In this work, numerical simulations are carried out according to an ageing and temperature dependent electrochemical-thermal modelling of the battery cells. The electrochemical simulations are performed with a pseudo two dimensional (P2D) modelling [
39,
40]. Wherein the electrodes are assumed to be porous materials composed of spherical particles immersed in the electrolyte. As part of physico-chemical models, electrochemical models are well documented in the literature [
41,
42,
43]. These models are capable of accurately predicting the performance of lithium-ion batteries, which allows the battery manufacturers to optimise and improve the cell design and materials properties chosen for their products. With its wide set of physical parameters, porous electrochemical models are useful tools for design purposes of battery cells since they allow predicting and understanding the physical processes occurring inside the battery during its lifetime.
For the electrochemical modelling the internal structure of the battery is considered to be composed of multiple layers (electrodes, separator, current collectors) which is reduced (using a superposition approach) to a single unit layer made of negative current collector, negative electrode, separator, positive electrode and positive current collector.
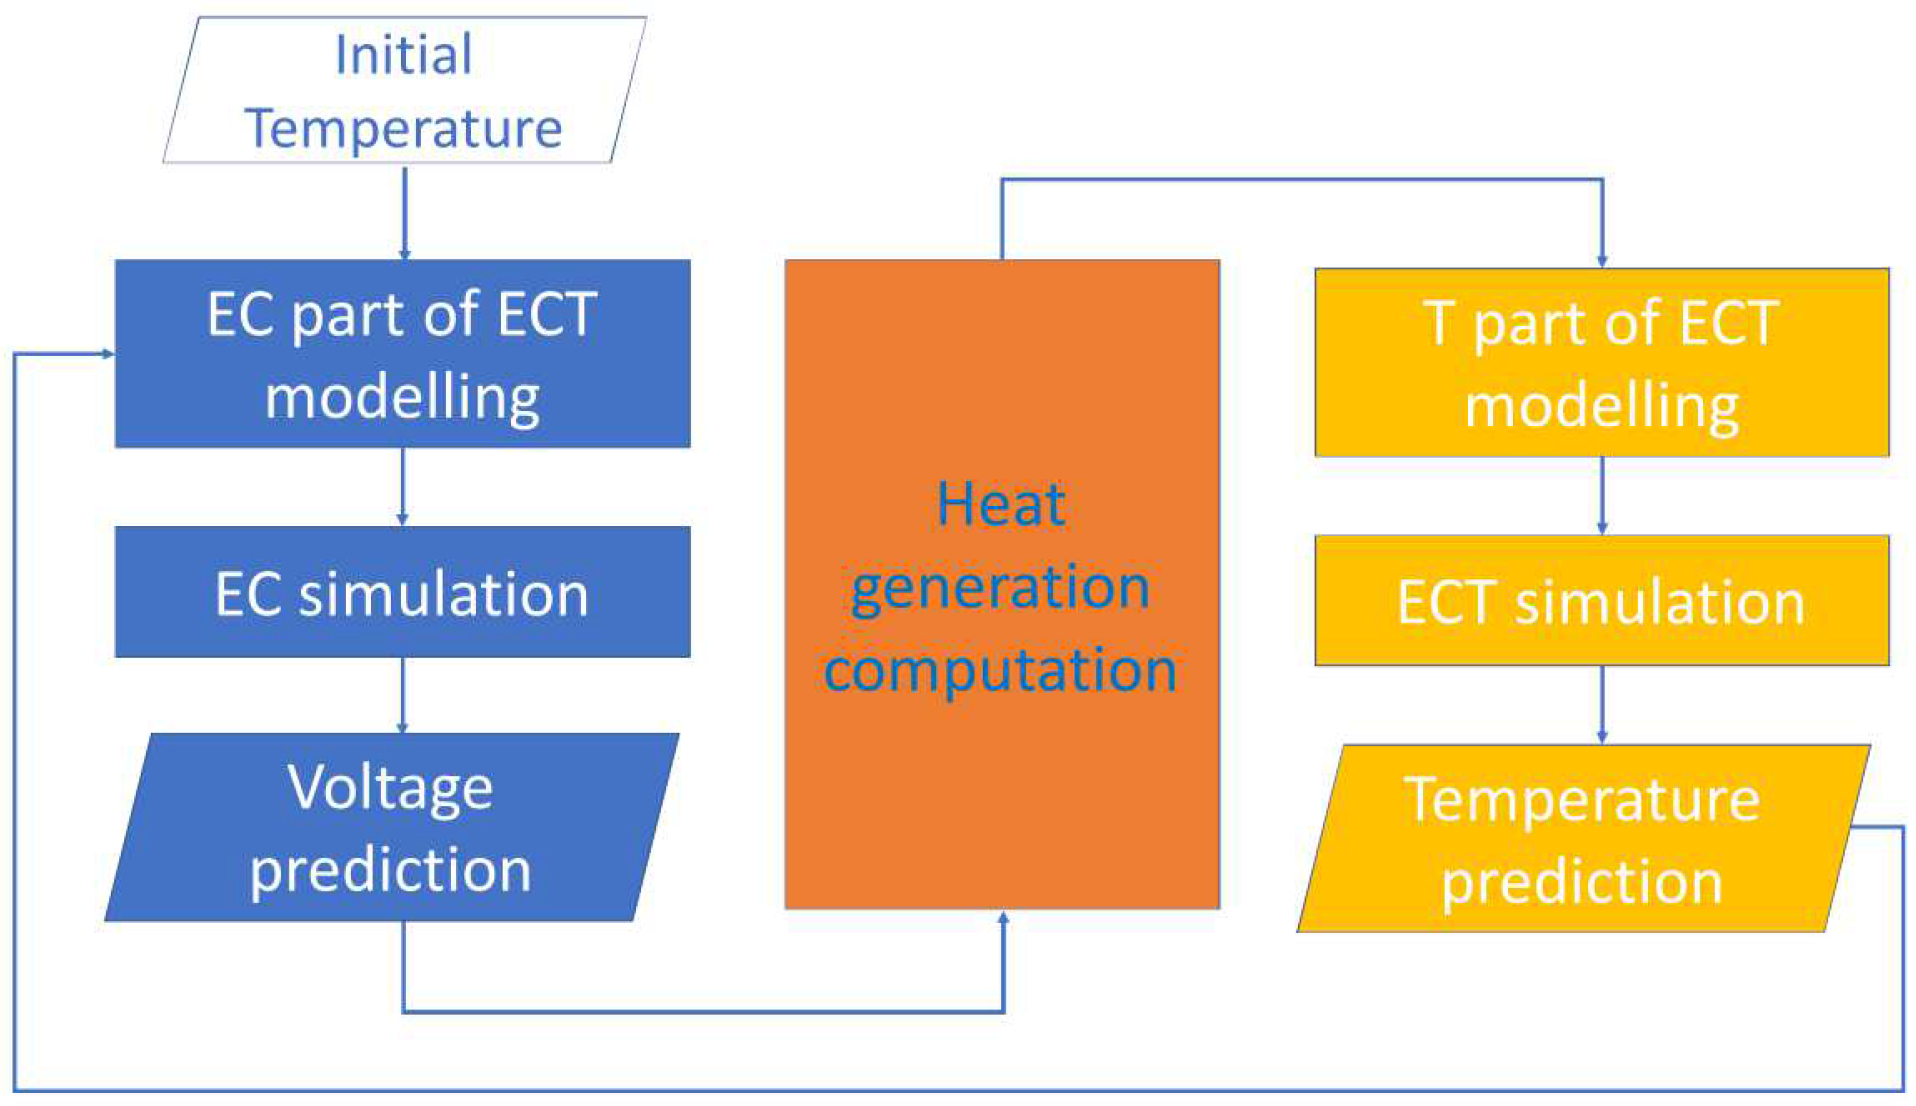
The coupling between the electrochemical (EC) and the thermal (T) parts of the developed temperature and ageing dependent electrochemical-thermal (ECT) modelling of the studied battery cells, is illustrated in
Figure 7.
The heat equation which describes the heat transfer phenomenon occurring between the cell and its environment, for the coupling between both electrochemical and thermal modelling parts, is given in Equation (
5):
where
represents the density,
the heat capacity,
T the temperature,
k the thermal conductivity, and
Q represents the heat generation.
The heat generation
Q inside the cell is derived from Equation (
6):
where
is the transfer current due to the intercalation or deintercalation of lithium ions,
is the potential of the solid phase,
is the potential of the electrolyte phase,
U is the open circuit voltage,
T is the temperature,
is the effective value of the electrical conductivity of the solid phase,
is the effective value of the electrical conductivity of the electrolyte phase and
represents the concentration of the electrolyte [
44]. The first term in Equation (
6) defines the reaction heat or the irreversible heat generation, the second term defines the reversible heat generation or active heat generation, while the third one (in brackets) defines the ohmic heat generation [
45,
46]. By definition, the reaction and the reversible heat generations are caused by the negative and the positive electrodes, while the ohmic heat generation comes from the electrolyte and both negative and positive electrodes.
The resulting thermo-physical properties of the whole battery cell after computation, according to Equations (
A1,
A2,
A3 and
A4) and
Table A4, are summarised in
Table 3.
Table A1 and
Table A2 list the electrochemical parameters values associated to the uncycled and cycled porous electrodes, respectively, while
Table A3 lists the electrochemical parameters values associated to the electrolyte and the separator of the studied battery cells.
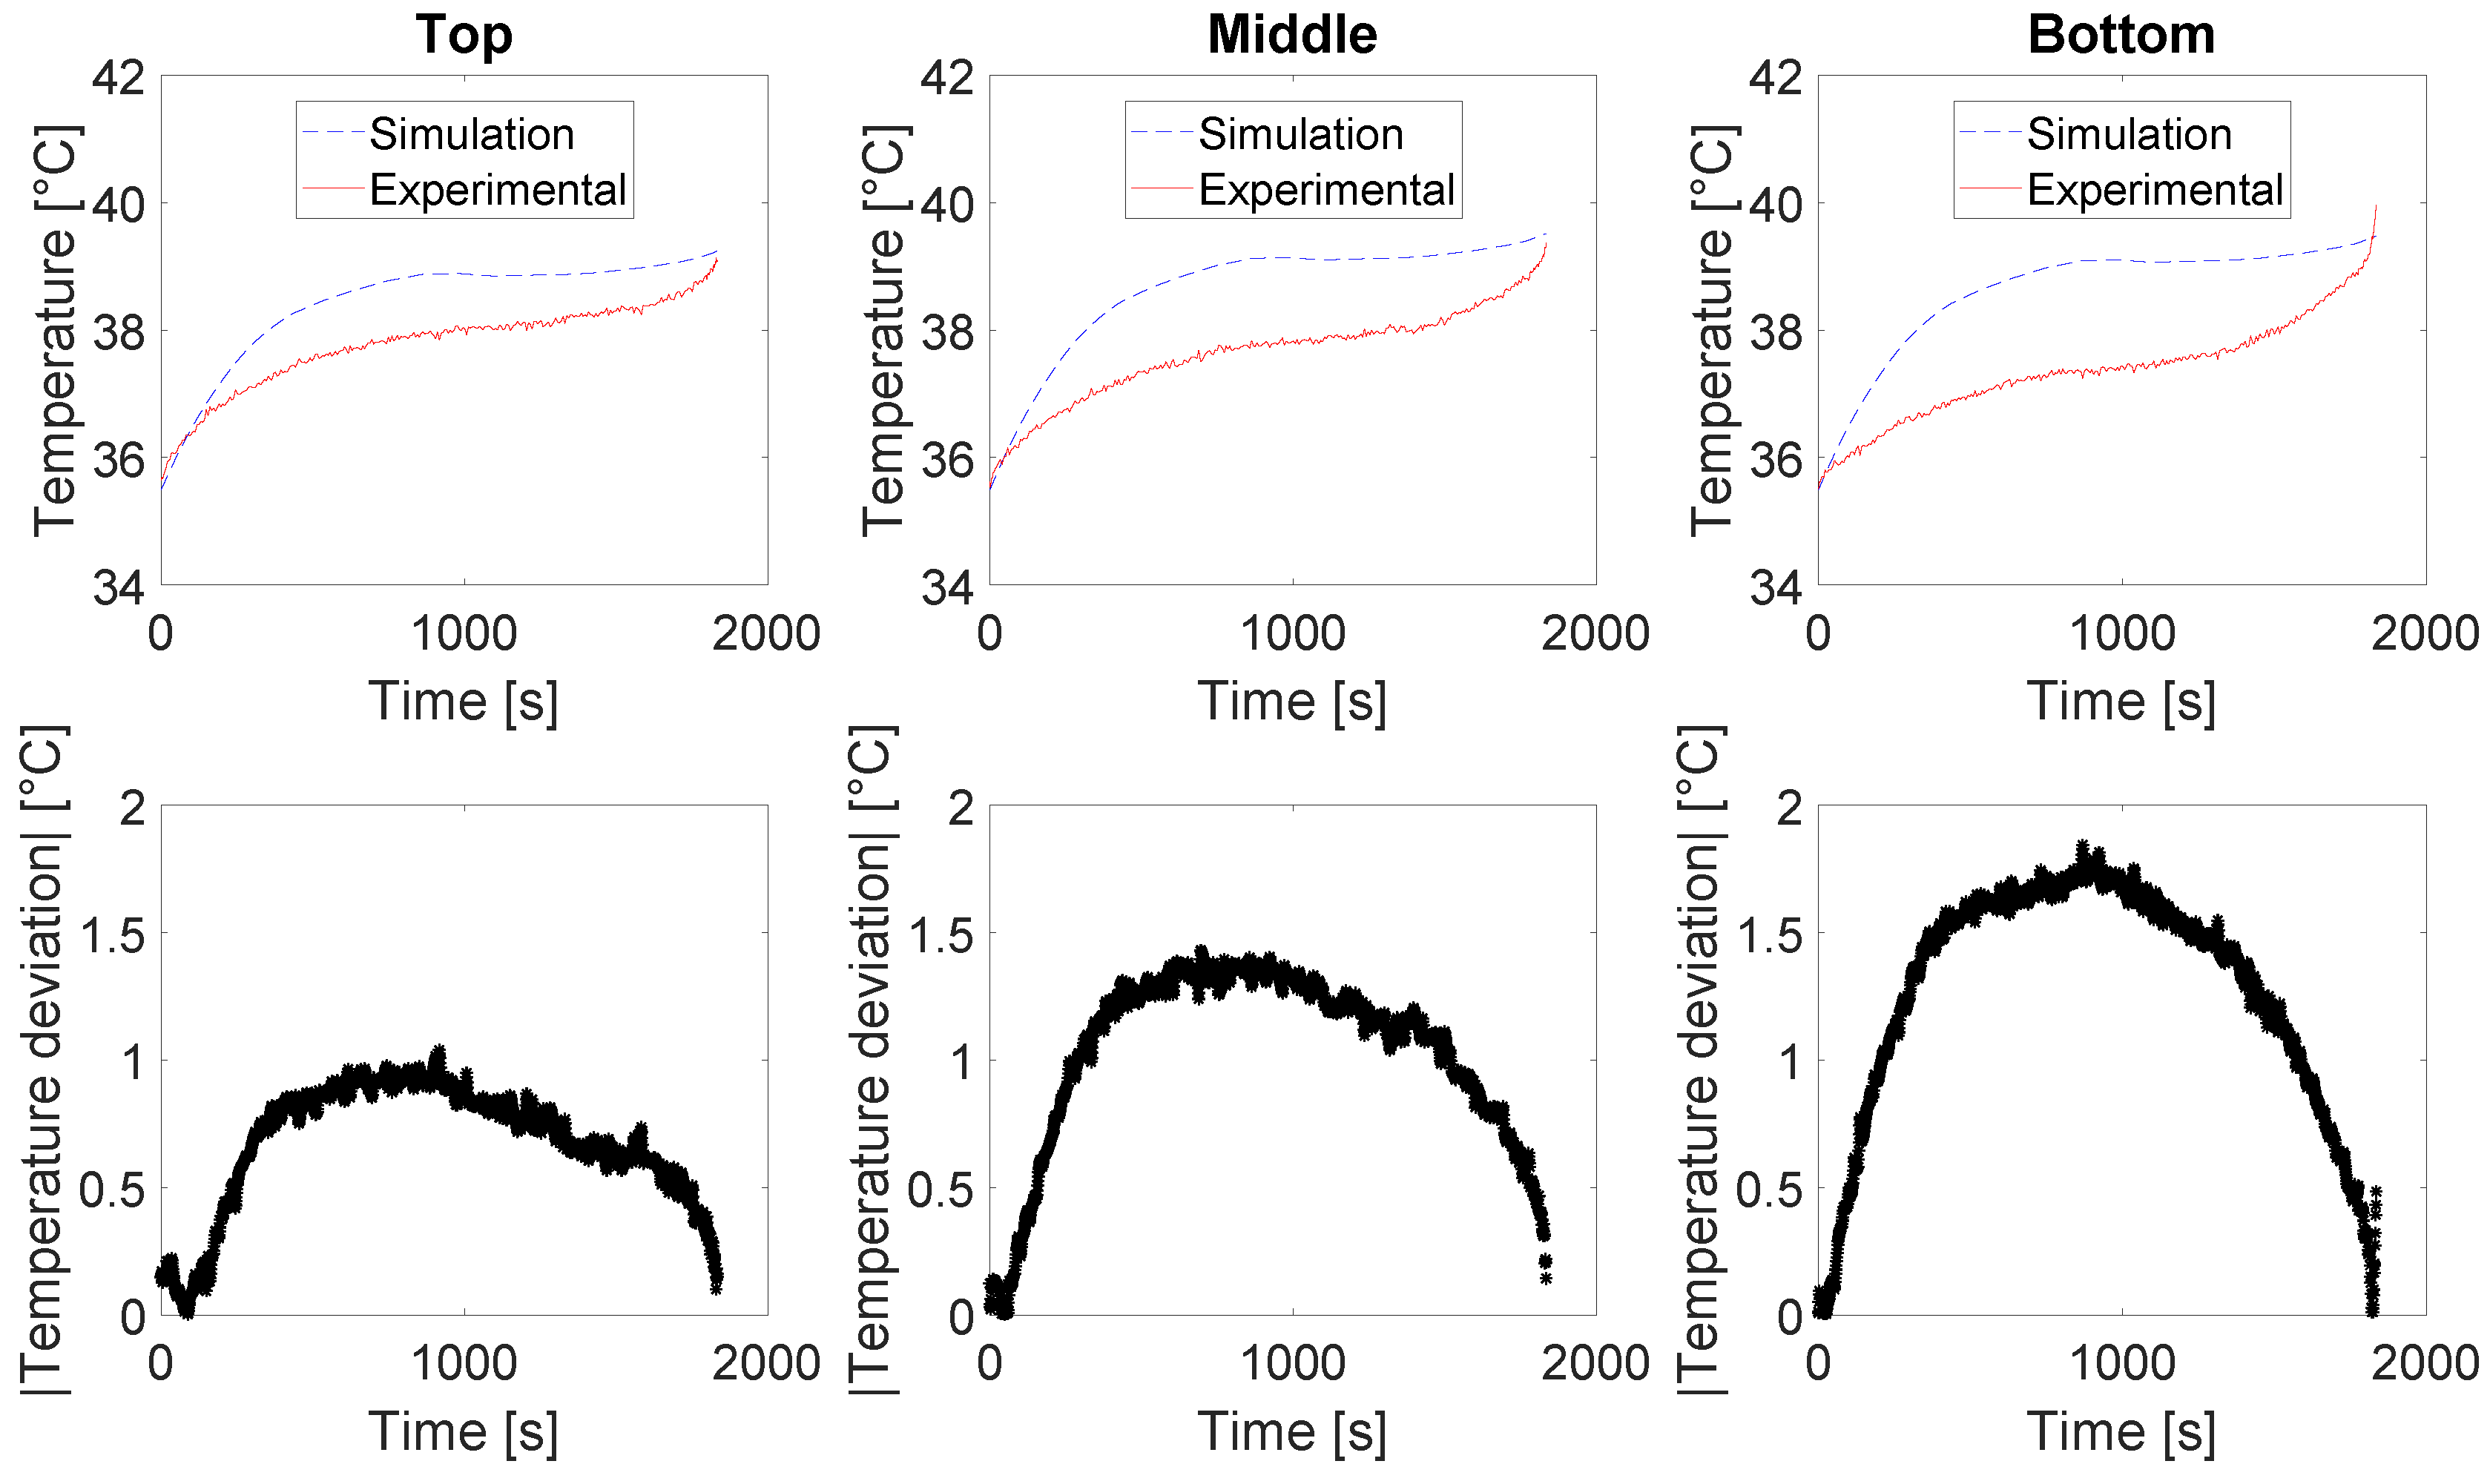
Figure 8 illustrates the different steps carried out in this research work as part of the electrochemical-thermal modelling of the fresh and aged battery cells at both room and cycling temperature. First, the domains and the geometry related to the battery cells are defined, and further associated to their respective materials properties. After discretisation by meshing of the domains, the physics and the boundary conditions associated to each domain are defined for the numerical solving of the governing equations. Last, as output of the numerical simulations, the predicted voltage and temperature of the battery cells are compared against experimental data for validation of the electrochemical-thermal modelling.
The commercial finite element software COMSOL Multiphysics® 4.3b was used for solving of the governing electrochemical and thermal differential equations. The temperature and ageing dependent modelling of the studied battery cells was achieved via the COMSOL® (Stockholm, Sweden) LiveLinkTM for MATLAB® interface. A fully coupled MUMPS direct solver was opted as linear solver with a minimum step tolerance equal to . The mesh resolution for the discretisation of the 3D battery cells and the 1D equivalent electrochemical layer domains, consist of a total of 2163 tetrahedral elements of minimum size equal to and 158 elements of minimum size, respectively.

 ,
, 


