Featured Application
In this study, a new Lactobacillus was isolated and identified. It is found that it has a certain inhibitory effect on diabetes and has a good potential for probiotics. It has a good value for development and utilization.
Abstract
This study aimed to evaluate and compare the effects of heat-killed and live Lactobacillus on mice with diabetes induced by high-fat diet with streptozotocin (STZ). Results based on body weight and liver pathological changes, oral glucose tolerance test, and related serum index (AST (aspartate aminotransferase), ALT (alanine aminotransferase), MDA (malondialdehyde), TNF-α (tumor necrosis factor α), INS (insulin), and GC (glucagon) and gene expression of IL-1β (Interleukin 1β), IRS-1(Insulin receptor substrate 1), GLUT-4 (glucose transporter type 4), PPARγ (peroxisome proliferators-activated receptor γ), and SREBP-1c (sterol-regulatory element-binding protein-1c) levels indicated that Lactobacillus fermentum (LF) and Lactobacillus plantarum (LP) could increase the average weight, alleviate the degree of damage in the liver, and improve the glucose tolerance of mice with diabetes. LF and LP also participated in the downregulation of AST, ALT, MDA, TNF-α, INS, and GC in serum, as well as the inhibition of IL-1β, TNF-α, IRS-1, GLUT-4, PPARγ, and SREBP-1c expression. These regulating effects were remarkable, and the regulating effect of the live group was significantly better than that of the heat-killed group. This study suggested that LF and LP can significantly alleviate liver damage and hepatic insulin resistance in mice with diabetes and that the acting mechanisms of LF and LP were related to cellular components and their activities.
1. Introduction
Probiotics, defined as live microorganisms that (when ingested) provide health benefits to the host, are used when people eat fermented foods []. Many microorganisms have currently been used or considered for use as probiotics. Several studies have proven the functional features of Lactobacillus. Lactobacillus fermentum LF31 and Lactobacillus coryniformis were found to exert antioxidative effects [,]. Lactobacillus plantarum NCU116 could enhance the mucosal immunity of the intestine and regulate Th17/Treg balance []. Lactobacillus GG was shown to exert an antidiabetic effect [], and Lactobacillus paracasei Jlus66 could effectively protect the liver []. Bifidobacterium and Streptococcus have also been used as probiotics [,]. However, most studies have limited their focus to the beneficial effects of live microorganisms, and a number of experts have recently investigated whether the cellular components of live microorganisms also played any role. Thus, the beneficial effects of live and dead microorganisms should be compared to determine which microorganisms are effective. Considering the advantages of dead microorganisms has also been useful in industrial production and consumer usage, such as increased convenience in storage and transport, lengthened shelf-life extension, and improved safety. Thus, evaluating the effects of dead microorganisms has practical significance [].
Diabetes, a metabolic disease group with high blood glucose as the main feature, is associated with numerous genetic and environmental factors. With changes in diet and lifestyle, the incidence of diabetes has increased year by year []. Type 2 diabetes is the foremost type of diabetes worldwide []. A number of mechanisms underlying type 2 diabetes have been identified, including glycogenesis, glycolysis, fatty acid biosynthesis, glucose uptake, lipogenesis, lipolysis, and the insulin signaling pathway. However, the definite etiology and pathogenesis of the disease remain unclear [].
The liver is the main organ of metabolism, detoxification, and immunity; it is also the center of glucose metabolism []. Thus, the liver plays an important role in keeping the body healthy. In previous studies on diabetes, the role of the liver was self-evident. One study demonstrated that fatty liver and insulin resistance were involved in metabolic syndrome. Among patients with type 2 diabetes, 50% to 70% of the patients suffered from fatty liver, and the percentage increased to 95% in patients with obesity [,]. Persistent high blood glucose was associated with excessive generation of reactive oxygen species in the body with diabetes, and this could induce oxidative tissue damage particularly in the liver, pancreas, and kidney []. Thus, the effects of research targets (e.g., probiotics, polysaccharides and polypeptides) on the liver of mice with diabetes need to be evaluated. These finding could provide a theoretical basis for its hypoglycemic activity.
Numerous methods for modeling diabetes have been developed. Among these techniques, the construction of a diabetic model with streptozotocin (STZ) combined with high-fat diet has been widely used. STZ, a monofunctional nitrosourea derivative, was first isolated from Streptomyces achromogenes [,]. It is also an alkylating agent and can lead to cell death. When cytotoxicity acts on β-cells, insulin release decreases, and blood glucose in the body rises []. In addition, a high-fat diet can lead to obesity and insulin resistance []. Therefore, diabetes induced by a high-fat diet combined with STZ can better simulate the pathogenesis of human type 2 diabetes and can be used widely in studies on hypoglycemic activity.
In the current study, Lactobacillus fermentum (LF) and Lactobacillus plantarum (LP) were isolated from Chinese pickles by using traditional pure culture techniques and then deposited in the China General Microbiological Culture Collection Center (CGMCC). Previous research also proved that LF and LP exhibited excellent resistance to pH 3.0 simulated gastric juice and bile salt. The present study aimed to evaluate and compare the effects of heat-killed and live LF and LP on the liver of murine models with diabetes induced by a high-fat diet with STZ.
2. Materials and Methods
2.1. Strains
LF and LP were isolated from Chinese pickles at a local farmer’s home (Nan’an District, Chongqing, China). Experiments showed that they exhibited high tolerance in vitro to simulated gastric juice and bile salt (evaluated as previously described) []. LF and LP were deposited at the CGMCC (Beijing, China), with preservation numbers 14491 for LP and 14493 for LF. During activation and enrichment, LF and LP were grown in de Man, Rogosa, and Sharpe (MRS) broth (Difco Laboratories, Detroit, MI, USA) at 37 °C for 18 h or in MRS plate (with 1.5% agarose, Solarbio, Beijing, China) at 37 °C for 48 h. The LF and LP were collected by centrifugation at 1760× g for 10 min at 4 °C and then washed and resuspended with sterile saline. The cells were counted by plate counting. In addition, cell morphology was observed by gram staining as described in a previous study [].
2.2. Mice
Male C57BL/6 mice (20 ± 2 g) were obtained from the Experimental Animal Center of Chongqing Medical University (Chongqing, China). They were housed in a 12 h light/dark cycle at 25 °C ± 2 °C and allowed free access to food and water. The experimental procedures in this study were approved by the Animal Ethics Committee of Chongqing Medical University, with animal permit number SYXK (Yu) 2017-0001.
2.3. Experimental Model and Groups
To prepare the STZ (V900890, Sigma, St. Louis, MO, USA) solution, STZ powder was dissolved into a pH 4.5 phosphoric acid buffer in an ice bath. Heat-killed Lactobacillus was heated in a boiling water bath for 30 min.
After acclimation for 1 week, the animals were randomly divided into 6 groups, each consisting of 10 mice. The 6 groups were as follows: the normal group (Normal), model group (Model), live LF group (L-LF), heat-killed LF group (HK-LF), live LP group (L-LP), and heat-killed LP group (HK-LP). The normal group received a standard diet and water and was injected with pH 4.5 phosphoric acid buffer on the last day of Week 3, followed by administration of sterile saline daily from Week 4 to Week 8. The remaining groups, which received a high-fat diet and water in the first 3 weeks, were given a standard diet and injected with STZ (100 mg/kg·BW) on the last day of Week 3. In addition, the model group was administered sterile 0.9% NaCl daily from Week 4 to Week 8. The heat-killed and live LF or LP groups were given corresponding bacterial suspension (109 CFU/kg·BW) daily. We performed an oral glucose tolerance test on the last day of Week 7 and measured the body weight of each mouse. On the last day of Week 8, the mice were fasted overnight before they were sacrificed. The schematic of the experimental procedure is presented in Figure 1.
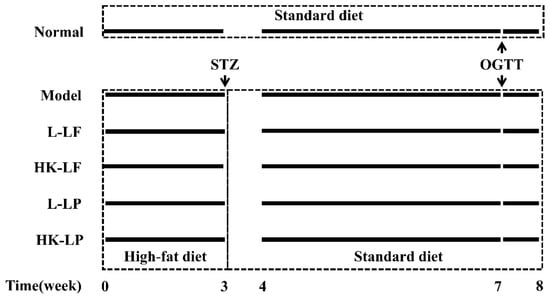
Figure 1.
Schematic of the experimental procedure. L-LF: live LF group; HK-LF: heat-killed LF group; L-LP: live LP group; HK-LP: heat-killed LP group; LF: Lactobacillus fermentum; LP: Lactobacillus plantarum.
2.4. Oral Glucose Tolerance Test (OGTT)
All mice were fasted overnight and orally administered with 2 g/kg·BW glucose. Blood samples were extracted from the tail vein at 0, 15, 30, 60, 90, and 120 min after glucose loading. The blood glucose contents were determined using a glucometer (Roche Accucheck, Mannheim, Germany). The total glucose areas under the curve (AUC) between 0 min and 120 min represent the magnitude of glucose response and were calculated as described in a previous study [,].
2.5. Colleciton of Blood Serum and Tissue Sample
Blood serum was obtained by centrifugation at 1760× g for 10 min at 4 °C and then stored at −80 °C. Liver tissues were washed with ice-cold sterile saline, and a portion of the liver of each mouse was used to prepare H&E slice. The remaining part of the liver was stored at −80 °C until use.
2.6. Histological Observation
Liver tissues were fixed with 10% (v/v) buffered formalin, paraffin-embedded, and sectioned (with a thickness of 4 μm), then sections were stained with hematoxylin and eosin following the standard protocol. The sections were examined under a light microscope (Olympus BX43, Olympus Co., Tokyo, Japan). A representative image of each group was taken.
2.7. Measurement of Serum Indexes
Aspartate aminotransferase (AST, C010-2), alanine aminotransferase (ALT, C009-2), malondialdehyde (MAL, A003-1), and glycosylated serum protein (GSP, A037-2) in serum were measured by spectrophotometry using commercial diagnostic kits (Nanjing Jiancheng Biotechnology Co., Ltd., Nanjing, Jiangsu, China). TNF-α (AD2726Mo), insulin (INS, AD3184Mo), and glucagon (GC, AD2450Mo) were measured using enzyme-linked immunosorbent assay kits (Beijing Chenglin Biological Technology Co., Ltd., Beijing, China).
2.8. Reverse Transcription Quantitative Polymerase Chain Reaction (RT-qPCR)
Moderate amounts of liver tissue were homogenized using a Bioprep-24 homogenizer, and RNA was extracted with Trizol Reagent (Thermo Fisher Scientific; Waltham, MA, USA). The concentration and purity of RNA were determined using a micro-spectrophotometer (Nano-300, Hangzhou Allsheng Instruments Co., Ltd., Hangzhou, Zhejiang, China). RNA was reverse-transcribed to cDNA using RevertAid First Stand cDNA Synthesis Kit with oligo d(T) primer (Applied Biosystems, Foster City, CA, USA). Target gene expression levels (IRS-1, GLUT-4, PPARγ, SREBP-1c, TNF-α, and IL-1β) were measured using SYBR® Select Master Mix with Step One Plus Real-Time PCR System (Thermo Fisher Scientific, New York, NY, USA). The target gene expression was normalized with β-actin and calculated using the 2−ΔΔCt method. The primers used for RT-qPCR are listed in Table 1. RT-qPCR was performed by the following cycle conditions: an initial holding at 95 °C for 10 min, followed by 40 cycles of denaturation at 95 °C for 15 s and annealing/extension at 60 °C for 1 min. IL-1β (),

Table 1.
Primer sequences of genes; IRS-1: Insulin receptor substrate; GLUT-4: Glucose transporter type 4; PPARγ: Peroxisome proliferators-activated receptor γ; SREBP-1c: Sterol-regulatory element-binding protein-1c; TNF-α: tumor necrosis factor α; IL-1β: Interleukin 1β.
2.9. Statistical Analysis
Data from different groups are presented as mean ± standard deviation (SD). Student’s t-test was used to determine significant differences between two groups. For a comparison of more than two groups, ANOVA (Analysis of variance) with the Dunnett’s test for post hoc analysis was conducted, and analyses were performed with GraphPad 7.0 (GraphPad Software Inc., La Jolla, CA, USA).
3. Results
3.1. Morphological Characteristics
After activation, the colonies of LF and LP were of the same size, had a smooth surface and a convex shape with a concentric structure at the center, and appeared white and opaque on the MRS plate (Figure 2A). After gram staining, both LF and LP were gram-positive and rod-shaped, and the cells were uniform in size (Figure 2B). These results indicated that LF and LP remained pure and could be used for follow-up experiments.
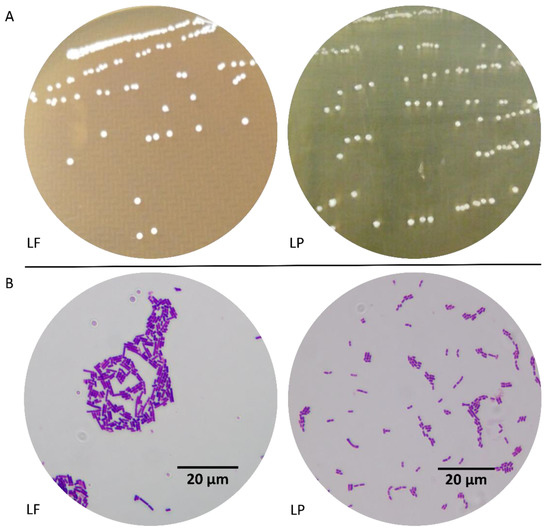
Figure 2.
Morphological characteristics. (A) Colony morphology, (B) Cell morphology (×1000). LF: Lactobacillus fermentum; LP: Lactobacillus plantarum.
3.2. In Vitro Tolerance to Stimulated Gastric Juice and Bile Salt
Gastric juice and bile salt in the gastrointestinal tract could inhibit and end microbial growth. To obtain probiotics with good tolerance, strain tolerance had to be evaluated. In this experiment, after treatment with simulated gastric juice and 0.3% bile salt, LF and LP showed good tolerance, exhibiting the ability to maintain physiologic activity and develop beneficial functions in the body (Figure 3).
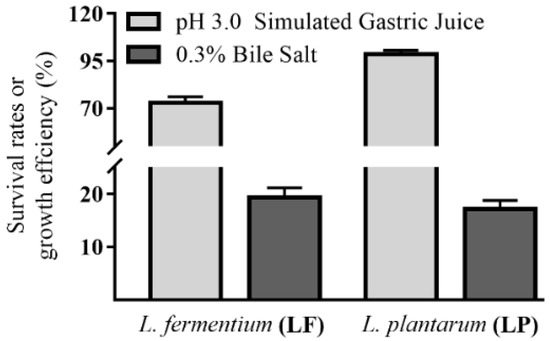
Figure 3.
In vitro tolerance levels of LF and LP.
3.3. Body Weight
As shown in Figure 4, no significant difference in body weight is indicated among different groups after the mice were fed with a high-fat diet for 3 weeks. However, the body weights of Model, L-LF, HK-LF, L-LP, and HK-LP were markedly lower than those of Normal after injection with STZ (Week 4). The body weights of Model, L-LF, HK-LF, L-LP, and HK-LP were also clearly below that of Normal at Week 8. However, after treatment, L-LF, HK-LF, L-LP, and HK-LP showed significantly increased body weights relative to that of Model.
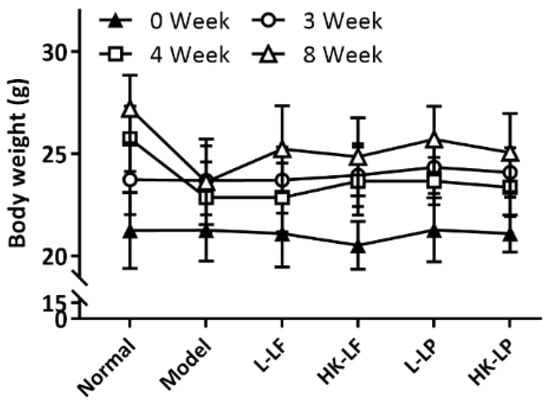
Figure 4.
Change sin body weight. L-LF: live LF group; HK-LF: heat-killed LF group; L-LP: live LP group; HK-LP: heat-killed LP group.
3.4. OGTT
The OGTT results are shown in Figure 5A. After glucose loading, the blood glucose levels markedly varied at 0, 15, 30, 60, 90, and 120 min among the 6 groups; however, the groups exhibited a similar change trend in OGTT. The blood glucose levels were increased sharply from 0 min to 15 min, and the blood glucose concentrations were maximized at 30 min. The blood glucose levels of the 6 groups were then reduced gradually. On the basis of the analysis and comparison of the areas under the OGTT curve, the AUC (the total glucose areas under the curve) values for each group are presented in Figure 5B. The ACU of Model was markedly higher than that of Normal. The AUCs of L-LF, HK-LF, L-LP, and HK-LP were significantly lower than that of Model. These results clearly reflected the inhibitory effects of L-LF, HK-LF, L-LP, and HK-LP on the increase in blood glucose in mice with diabetes. In addition, the AUCs of the live groups (L-LF or L-LP) were significantly lower than those of the corresponding heat-killed group (HK-LF or HK-LP). Thus, the inhibitory effect of the live group on the increase in blood glucose were better than that of the corresponding heat-killed group.
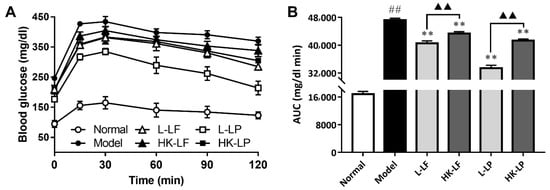
Figure 5.
Differences in oral glucose tolerance. (A) The levels of oral glucose tolerance, (B) AUC (the total glucose areas under the curve) value which represented the area under the curve of glucose level .L-LF: live LF group; HK-LF: heat-killed LF group; L-LP: live LP group; HK-LP: heat-killed LP group. ## P < 0.01 compared with Normal, ** P < 0.01 compared with Model, and ▲▲ P < 0.01.
3.5. Pathological Observation
Under the microscope, the liver cells exhibited an integral structure and were uniformly distributed in Normal. However, hepatocellular necrosis, inflammatory cell infiltration, no regular arrangement of liver cells, and fatty degeneration were observed around the central veins of Model. However, after treatment, L-LF, HK-LF, L-LP, and HK-LP exhibited markedly reduced damage in liver cells relative to that of Model (Figure 6).
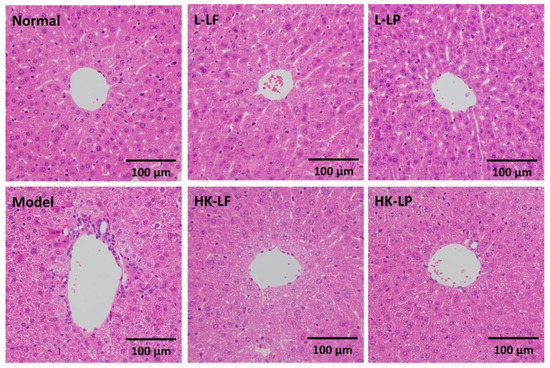
Figure 6.
Histopathological observation of the liver (×200). L-LF: live LF group; HK-LF: heat-killed LF group; L-LP: live LP group; HK-LP: heat-killed LP group.
3.6. Measurement of ALT and AST in Serum
ALT (A specific marker for hepatic parenchymal injury) and AST (a nonspecific marker for hepatic injury) were important indexes for the evaluation of hepatic disorders []. The increase in these enzymatic activities generally indicated liver dysfunction []. As shown in Figure 7, compared with those of Normal, the ALT and AST levels of Model significantly increased. After treatment, L-LF, HK-LF, L-LP, and HK-LP showed markedly decreased ALT and AST levels relative to those of Model. The ALT and AST levels of the live group (L-LF or L-LP) were significantly lower than those of the corresponding heat-killed group (HK-LF or HK-LP). Beside, compared with the ratio of ALT and AST in Model, the ratio were reduced significantly after L-LF and L-LP treatment.
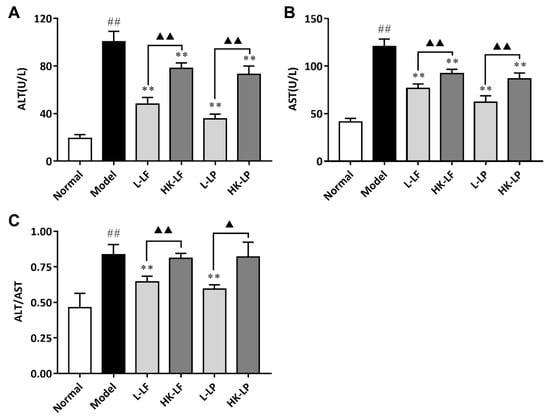
Figure 7.
Liver enzyme levels in serum. (A) The level of ALT, (B) The level of AST, (C) The ratio of ALT and AST. L-LF: live LF group; HK-LF: heat-killed LF group; L-LP: live LP group; HK-LP: heat-killed LP group. ## P < 0.01 compared with Normal, ** P < 0.01 compared with Model, and ▲▲ P < 0.01; ALT: Alanine aminotransferase; AST: Aspartate aminotransferase.
3.7. Measurement of MDA, TNF-α, GSP, INS, and GC in Serum
The MDA, TNF-α, GSP, INS, and GC levels were also evaluated by spectrophotometry using commercial diagnostic kits and the ELISA (Enzyme linked immunosorbent assay) kit. The results are shown in Figure 8. The MDA, TNF-α, GSP, INS, and GC levels of Model were significantly increased relative to those of Normal. After treatment, L-LF, HK-LF, L-LP, and HK-LP showed significantly decreased indexes at varying degrees relative to those of Model. Comparison of the live group (L-LF or L-LP) with the corresponding heat-killed group (HK-LF or HK-LP) indicated that the live group showed significantly lower indexes relative to those of the corresponding heat-killed group, except for the MDA levels of L-LF and HK-LF.
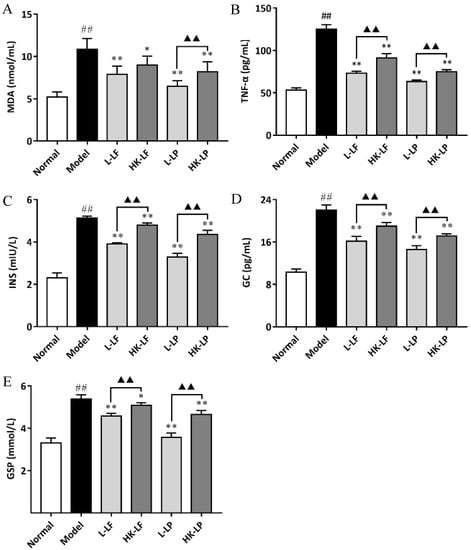
Figure 8.
MDA (malondialdehyde) (A), TNF-α (tumor necrosis factor α) (B), GSP (glycosylated serum protein ) (C), INS (insulin) (D), and GC (glucagon) (E) levels in serum. ## P < 0.01 compared with Normal, * P < 0.05 compared with Mode, ** P < 0.01 compared with Model, and ▲▲ P < 0.01.
3.8. RT-qPCR
We primarily measured the expression levels of IL-1β, TNF-α, IRS-1, GLUT-4, SREBP-1c, and PPARγ in the present study. As shown in Figure 9, the expression levels of IL-1β and TNF-α were significantly increased, whereas the IRS-1, GLUT-4, SREBP-1c, and PPARγ levels of Model were significantly decreased relative to those of Normal. After treatment, L-LF, HK-LF, L-LP, and HK-LP showed significantly decreased IL-1β and TNF-α levels and significantly increased IRS-1, GLUT-4, SREBP-1c, and PPARγ levels relative to those of Normal. In addition, the expression levels of IL-1β and TNF-α were significantly decreased, whereas the expression levels of IRS-1, GLUT-4, SREBP-1c, and PPARγ of the live group (L-LF or L-LP) were significantly increased relative to those of the corresponding heat-killed group.
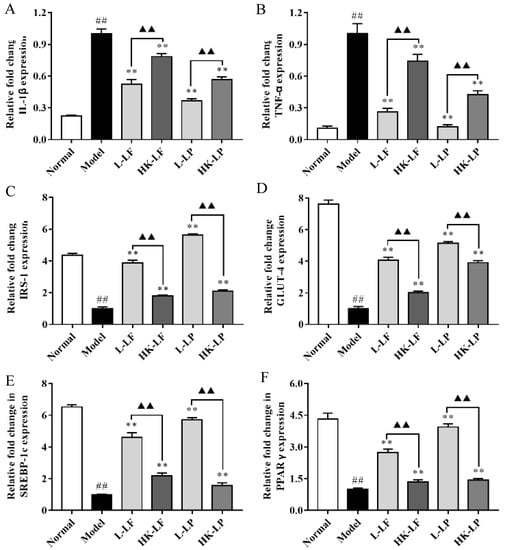
Figure 9.
IL-1β (A), TNF-α (B), IRS-1 (C), GLUT-4 (D), SREBP-1c (E), and PPARγ (F) gene expression levels in the liver. L-LF: live LF group; HK-LF: heat-killed LF group; L-LP: live LP group; HK-LP: heat-killed LP group. ## P < 0.01 compared with Normal, ** P < 0.01 compared with Model, and ▲▲ P < 0.01.
4. Discussion
With the improvement of living standards, concern over health has increased. Lactobacillus species, which are widely present in the intestinal tract, have important physiologic functions and are key components of the human body. Local and international studies have increasingly shown that Lactobacillus is closely associated with health and can thus help people improve their health. However, to exhibit positive health effects in the body, Lactobacillus should meet a group of requirements. Major requirements include resistance to stress caused by gastric juice and bile salt in the gastrointestinal tract []. In the current study, the experiment using pH 3.0 simulated gastric juice and 0.3% bile salt in vitro indicated that LF and LP, which were isolated from Chinese pickles, showed good tolerance. Therefore, both were able to maintain their cell viability and provide health benefits to the body, and the advantages might correlate with its adaptive ability in Chinese pickles.
Diabetes is a global disease that seriously harms human health and severely affects the quality of life of patients. The incidence rate of diabetes has gradually increased worldwide. Thus, its mechanism has to be studied, and new therapeutic approaches have to be explored. Meanwhile, various animal models of diabetes have been developed, among which are murine models with diabetes induced by a high-fat diet combined with STZ to better simulate the pathogenesis of human type 2 diabetes and clinical manifestations. Diabetes can generally lead to body weight loss and a significant rise in blood glucose. On the basis of the animal model in this study, we found that the body weight was significantly lower, whereas the OGTT and AUC of Model were significantly higher than those of Normal. The result was consistent with the findings in previous studies. After treatment, L-LF, HK-LF, L-LP, and HK-LP showed markedly increased body weight and significantly decreased OGTT and AUC relative to those of Model. Notably, the blood glucose levels of L-LF (or L-LP) were significantly decreased relative to those of HK-LF (or HK-LP). These results implied that LF and LP could increase body weight and glucose tolerance in mice with diabetes and that these effects were related to cellular components and their activities.
The liver is an important site for glucose metabolism. Thus, the liver plays an important role in the body. Research indicates that diabetes is subject to a considerable variety of complications, one of which is liver dysfunction. In this study, a view of a pathological section of the liver under a microscope revealed serious hepatocellular necrosis, inflammatory cell infiltration, and irregular arrangement of the liver cells of Model. After treatment, L-LF, HK-LF, L-LP, and HK-LP exhibited markedly improved pathological characteristics. In addition, Model showed significantly higher ALT and AST levels in serum relative to those of Normal; after treatment, L-LF, HK-LF, L-LP, and HK-LP showed significantly lower ALT and AST levels than those of Model. The ALT and AST levels of L-LF (or L-LP) were also significantly decreased relative to those of HK-LF (or HK-LP). These results showed that liver function was damaged in mice with diabetes, and L-LF, HK-LF, L-LP, and HK-LP exhibited significant protective effects against liver damage in mice with diabetes.
Previous studies have shown that MDA was linked to oxidative stress, TNF-α was associated with inflammation, and GSP, INS, and GC in serum could reflect the severity of diabetes. These findings indicated their important role in diabetes. Specifically, the organic substance MDA is a by-product of polyunsaturated fatty acids that are present in free radicals. It is closely related to oxidative damage to organisms. MDA is typically used as a biomarker of oxidative stress []. TNF-α can gather inflammatory cells and lead to inflammatory cell infiltration, which is the earliest and most important inflammatory mediator []. GSP, a glycated albumin (albumin in high glucose environment occurring non-enzymatic glycosylation), is one of the key links in diabetes complications and can lead to a series of pathological changes []. INS is produced by beta cells in pancreatic islets, which can regulate the metabolism of carbohydrates by promoting the absorption of, particularly, glucose from the blood into the liver. Glucose production and secretion by the liver is strongly inhibited by high concentrations of insulin in the blood []. GC, which is produced by alpha cells in the pancreas, increases the glucose concentration by promoting gluconeogenesis and glycogenolysis []. In the present study, Model showed significantly higher indexes than those of Normal; after treatment, L-LF, HK-LF, L-LP, and HK-LP showed significantly lower indexes than those of Model. L-LF (or L-LP) also exhibited significantly decreased indexes relative to those of HK-LF (or HK-LP). Thus, these results showed that LF and LP treatment positively affected the inflammation of the liver and insulin resistance in mice with diabetes and that the live group exerted effects better than those of the heat-killed group.
In addition, mice with diabetes were accompanied by insulin resistance and insulin target tissue damage. Thus, we measured the related gene expression level of the liver to further research the mechanism underlying their anti-diabetic effects. IL-1β and TNF-α are typical pro-inflammatory cytokines. IRS-1 plays a key role in the insulin signaling pathway. GLUT-4, an insulin-regulated glucose transporter, is mainly regulated by the insulin signaling pathway and is the rate-limiting step in glucose metabolism. Thus, evaluating the expression levels of GLUT-4 is important in the study of diabetes []. Previous studies indicated that inflammatory factors can affect insulin sensitivity by active insulin signaling, and they can enhance IRS-1 serine phosphorylation and inhabit tyrosine phosphorylation of insulin receptor, then the insulin physiological function and the expression of GLUT-4 were reduced. Finally, the insulin stimulation and glucose transport function were weakened []. PPARγ mainly mediates inflammation, lipid metabolism, and the maintenance of metabolic homeostasis []. SREBP-1c is associated with glucose metabolism as well as fatty acid and lipid production, and its expression is regulated by insulin []. In the current study, we demonstrated that the expression levels of IL-1β and TNF-α were significantly decreased and that the expression levels of IRS-1, GLUT-4, SREBP-1c, and PPARγ were significantly increased in treated LF and LP. The regulating effects of the live group were more apparent than those of the heat-killed group. Therefore, LF and LP play an important role in preventing inflammation of the liver and hepatic insulin resistance in mice with diabetes induced by a high-fat diet combined with STZ. The preventive effects of the corresponding live group were better than those of the heat-killed group.
However, other problems have yet to be addressed. First, the regulating mechanisms of LF and LP to diabetes remain unclear, so that their mechanisms need to be further defined. This study can provide basic theories for their functional application. Second, the live and heat-killed LF and LP can play an efficient role in preventing diabetes; however, a difference still exists. The reason for this difference needs to be identified, and the cellular components of LF and LP exhibiting these special properties need to be determined. Besides, in order to further define the regulating mechanisms of LF and LP to diabetes, it is also important to evaluate related protein levels by Western Blot analysis and pancreatic damage by immunohistochemical analysis.
5. Conclusions
This research on mice with diabetes induced by a high-fat diet combined with STZ leads to the conclusion that live and heat-killed LF and LP, isolated from Chinese pickles from a farmer’s home, played an effective role in protecting the liver of mice with diabetes. They could effectively alleviate liver damage and prevent inflammation of the liver and hepatic insulin resistance. Therefore, LF and LP showed potential application to promote the health of mice with diabetes. In addition, the protective effects of heat-killed LF and LP suggest that the regulatory mechanisms of LF and LP in diabetes are closely related to the cellular components and activities of live microorganisms.
Author Contributions
X.C. and F.T. performed the majority of the experiments and wrote the manuscript; R.Y. and J.M. contributed to the data analysis; X.Z. and Z.Y. designed and supervised the study and checked the final manuscript.
Funding
This research was funded by the Open Fund of Beijing Advanced Innovation Center for Food Nutrition and Human Health under grant number 20161001, Construction project of Chongqing Collaborative Innovation Center for Functional Food in Chongqing University of Education under grant number 167001, China and the Chongqing Social Undertakings And Livelihood Guarantee Technology Innovation Special Project under grant number cstc2017shms-xdny80031, China.
Conflicts of Interest
The authors declare no conflict of interest.
References
- Rolfe, R.D. The role of probiotic cultures in the control of gastrointestinal health. J. Nutr. 2000, 130, 396S–402S. [Google Scholar] [CrossRef] [PubMed]
- Toral, M.; Gómez-Guzmán, M.; Jiménez, R.; Romero, M.; Sánchez, M.; Utrilla, M.P.; Garrido-Mesa, N.; Rodríguez-Cabezas, M.E.; Olivares, M.; Gálvez, J.; et al. The probiotic Lactobacillus coryniformis CECT5711 reduces the vascular pro-oxidant and pro-inflammatory status in obese mice. Clin. Sci. 2014, 127, 33–45. [Google Scholar] [CrossRef] [PubMed]
- Persichetti, E.; De Michele, A.; Codini, M.; Traina, G. Antioxidative capacity of Lactobacillus fermentum LF31 evaluated in vitro by oxygen radical absorbance capacity assay. Nutrition 2014, 30, 936–938. [Google Scholar] [CrossRef] [PubMed]
- Xie, J.; Nie, S.; Yu, Q.; Yin, J.; Xiong, T.; Gong, D.; Xie, M. Lactobacillus plantarum NCU116 attenuates cyclophosphamide-induced immunosuppression and regulates Th17/Treg cell immune responses in mice. J. Agric. Food Chem. 2016, 64, 1291–1297. [Google Scholar] [CrossRef] [PubMed]
- Tabuchi, M.; Ozaki, M.; Tamura, A.; Yamada, N.; Ishida, T.; Hosoda, M.; Hosono, A. Antidiabetic effect of Lactobacillus GG in streptozotocin-induced diabetic rats. Biosci. Biotechnol. Biochem. 2003, 67, 1421–1424. [Google Scholar] [CrossRef] [PubMed]
- Ye, H.; Li, Q.; Zhang, Z.; Sun, M.; Zhao, C.; Zhang, T. Effect of a novel potential probiotic Lactobacillus paracasei Jlus66 isolated from fermented milk on nonalcoholic fatty liver in rats. Food Funct. 2017, 8, 4539–4546. [Google Scholar] [CrossRef] [PubMed]
- Vandeputte, D.; Falony, G.; Vieira-Silva, S.; Wang, J.; Sailer, M.; Theis, S.; Verbeke, K.; Raes, J. Prebiotic inulin-type fructans induce specific changes in the human gut microbiota. Gut 2017, 66, 1968–1974. [Google Scholar] [CrossRef] [PubMed]
- Saavedra, J.M.; Bauman, N.A.; Oung, I.; Perman, J.A.; Yolken, R.H. Feeding of Bifidobacterium bifidum and Streptococcus thermophilus to infants in hospital for prevention of diarrhoea and shedding of rotavirus. Lancet 1994, 344, 1046–1049. [Google Scholar] [CrossRef]
- Adams, C.A. The probiotic paradox: Live and dead cells are biological response modifiers. Nutr. Res. Rev. 2010, 23, 37–46. [Google Scholar] [CrossRef] [PubMed]
- Pantalone, K.M.; Hobbs, T.M.; Wells, B.J.; Kong, S.X.; Kattan, M.W.; Bouchard, J.; Yu, C.; Sakurada, B.; Milinovich, A.; Weng, W.; et al. Clinical characteristics, complications, comorbidities and treatment patterns among patients with type 2 diabetes mellitus in a large integrated health system. BMJ Open Diabetes Res. Care 2015, 3, e93. [Google Scholar] [CrossRef] [PubMed]
- Jiao, Y.; Wang, X.; Jiang, X.; Kong, F.; Wang, S.; Yan, C. Antidiabetic effects of Morus alba fruit polysaccharides on high-fat diet- and streptozotocin-induced type 2 diabetes in rats. J. Ethnopharmacol. 2017, 199, 119–127. [Google Scholar] [CrossRef] [PubMed]
- Lu, J.; Wang, Y.; Yan, H.; Lin, P.; Gu, W.; Yu, J. Antidiabetic effect of total saponins from Polygonatum kingianum in streptozotocin-induced daibetic rats. J. Ethnopharmacol. 2016, 179, 291–300. [Google Scholar] [CrossRef] [PubMed]
- Duarte, S.; Baber, J.; Fujii, T.; Coito, A.J. Matrix metalloproteinases in liver injury, repair and fibrosis. Matrix Biol. 2015, 44–46, 147–156. [Google Scholar] [CrossRef] [PubMed]
- Xia, Y.; Li, Q.; Zhong, W.; Dong, J.; Wang, Z.; Wang, C. l-carnitine ameliorated fatty liver in high-calorie diet/STZ-induced type 2 diabetic mice by improving mitochondrial function. Diabetol. Metab. Syndr. 2011, 3, 31. [Google Scholar] [CrossRef] [PubMed]
- Bloomgarden, Z.T. Second World Congress on the Insulin Resistance Syndrome: Hypertension, cardiovascular disease, and treatment approaches. Diabetes Care 2005, 28, 2073–2080. [Google Scholar] [CrossRef] [PubMed]
- Kim, M.J.; Kim, H.K. Anti-diabetic effects of electrolyzed reduced water in streptozotocin-induced and genetic diabetic mice. Life Sci. 2006, 79, 2288–2292. [Google Scholar] [CrossRef] [PubMed]
- Bolzán, A.D.; Bianchi, M.S. Genotoxicity of Streptozotocin. Mutat. Res. 2002, 512, 121–134. [Google Scholar] [CrossRef]
- Lenzen, S. The mechanisms of alloxan- and streptozotocin-induced diabetes. Diabetologia 2008, 51, 216–226. [Google Scholar] [CrossRef] [PubMed]
- Malekifard, F.; Delirezh, N.; Hobbenaghi, R.; Malekinejad, H. Immunotherapeutic effects of pentoxifylline in type 1 diabetic mice and its role in the response of T-helper lymphocytes. Iran J. Basic Med. Sci. 2015, 18, 247–252. [Google Scholar] [PubMed]
- Cani, P.D.; Delzenne, N.M.; Amar, J.; Burcelin, R. Role of gut microflora in the development of obesity and insulin resistance following high-fat diet feeding. Pathol. Biol. 2008, 56, 305–309. [Google Scholar] [CrossRef] [PubMed]
- Chen, X.; Zhao, X.; Wang, H.; Yang, Z.; Li, J.; Suo, H. Prevent effects of Lactobacillus Fermentum HY01 on dextran sulfate sodium-induced colitis in mice. Nutrients 2017, 9, 545. [Google Scholar] [CrossRef] [PubMed]
- Bensalah, F.; Delorme, C.; Renault, P. Characterisation of thermotolerant cocci from indigenous flora of ‘leben’ in algerian arid area and DNA identification of atypical Lactococcus lactis strains. Curr. Microbiol. 2009, 59, 139–146. [Google Scholar] [CrossRef] [PubMed]
- Hsieh, F.C.; Lee, C.L.; Chai, C.Y.; Chen, W.T.; Lu, Y.C.; Wu, C.S. Oral administration of Lactobacillus reuteri GMNL-263 improves insulin resistance and ameliorates hepatic steatosis in high fructose-fed rats. Nutr. Metab. 2013, 10, 35. [Google Scholar] [CrossRef] [PubMed]
- Hsieh, F.; Lan, C.E.; Huang, T.; Chen, K.; Chai, C.; Chen, W.; Fang, A.; Chen, Y.; Wu, C. Heat-killed and live Lactobacillus reuteri GMNL-263 exhibit similar effects on improving metabolic functions in high-fat diet-induced obese rats. Food Funct. 2016, 7, 2374–2388. [Google Scholar] [CrossRef] [PubMed]
- Sepodes, B.; Maio, R.; Pinto, R.; Marques, C.; Mendes-do-Vale, J.; McDonald, M.C.; Thiemermann, C.; Mota-Filipe, H. Tempol, an intracelullar free radical scavenger, reduces liver injury in hepatic ischemia-reperfusion in the rat. Transpl. Proc. 2004, 36, 849–853. [Google Scholar] [CrossRef] [PubMed]
- Eliza, J.; Daisy, P.; Ignacimuthu, S.; Duraipandiyan, V. Antidiabetic and antilipidemic effect of eremanthin from Costus speciosus (Koen.)Sm., in STZ-induced diabetic rats. Chem. Biol. Interact. 2009, 182, 67–72. [Google Scholar] [CrossRef] [PubMed]
- Chou, L.S.; Weimer, B. Isolation and characterization of acid- and bile-tolerant isolates from strains of Lactobacillus acidophilus. J. Dairy Sci. 1999, 82, 23–31. [Google Scholar] [CrossRef]
- Jadoon, S.; Malik, A. A review article on the formation, mechanism and biochemistry of MDA and MDA as a biomarker of oxidative stress. Int. J. Adv. Res. 2017, 5, 811–818. [Google Scholar] [CrossRef]
- Zingoni, A.; Sornasse, T.; Cocks, B.G.; Tanaka, Y.; Santoni, A.; Lanier, L.L. Cross-talk between activated human NK cells and CD4+ T cells via OX40-OX40 ligand interactions. J. Immunol. 2004, 173, 3716–3724. [Google Scholar] [CrossRef] [PubMed]
- Miao, M.; Guo, L.; Tian, S.; Wang, T. Effects of curcumin on antioxidation in diabetic rats. Pak. J. Pharm. Sci. 2015, 28, 371–373. [Google Scholar] [PubMed]
- Sonksen, P.; Sonksen, J. Insulin: Understanding its action in health and disease. Br. J. Anaesth. 2000, 85, 69–79. [Google Scholar] [CrossRef] [PubMed]
- Qureshi, S.A.; Rios Candelore, M.; Xie, D.; Yang, X.; Tota, L.M.; Ding, V.D.; Li, Z.; Bansal, A.; Miller, C.; Cohen, S.M.; et al. A novel glucagon receptor antagonist inhibits glucagon-mediated biological effects. Diabetes 2004, 53, 3267–3273. [Google Scholar] [CrossRef] [PubMed]
- Rotter, V.; Nagaev, I.; Smith, U. Interleukin-6 (il-6) reduces gene and protein expression of IRS-1 and GLUT 4 and is overexpressed in human fat cells from insulin-resistant subjects. Diabetes 2002, 51, A303. [Google Scholar]
- Dussault, I.; Forman, B.M. Prostaglandins and fatty acids regulate transcriptional signaling via the peroxisome proliferator activated receptor nuclear receptors. Prostaglandins Other Lipid Mediat. 2000, 62, 1–13. [Google Scholar] [CrossRef]
- Ferre, P.; Foufelle, F. Hepatic steatosis: A role for de novo lipogenesis and the transcription factor SREBP-1c. Diabetes Obes. Metab. 2010, 12 (Suppl. 2), 83–92. [Google Scholar] [CrossRef] [PubMed]
© 2018 by the authors. Licensee MDPI, Basel, Switzerland. This article is an open access article distributed under the terms and conditions of the Creative Commons Attribution (CC BY) license (http://creativecommons.org/licenses/by/4.0/).