Modeling of the Temperature Profiles and Thermoelectric Effects in Phase Change Memory Cells

Abstract
:Featured Application
Abstract
1. Introduction
2. Model and Materials
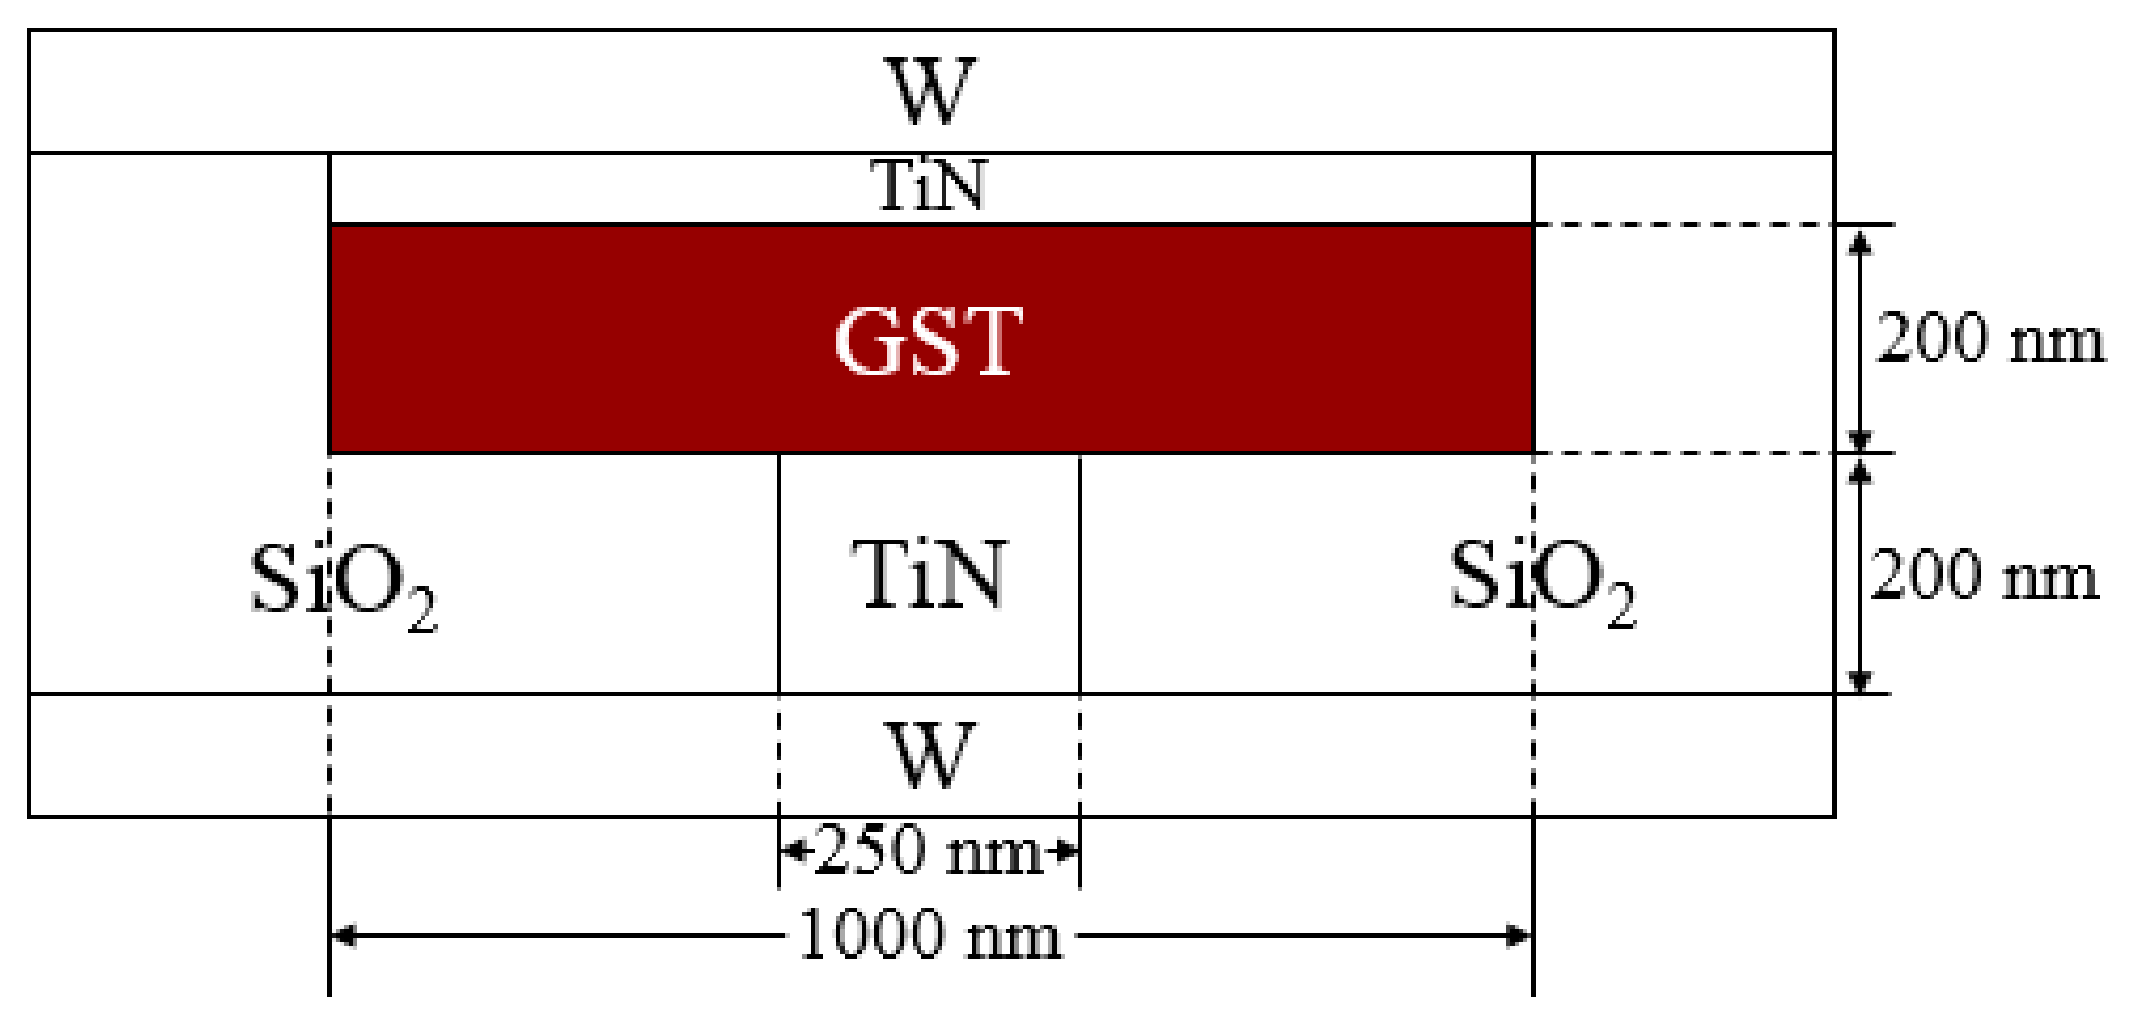
2.1. Model
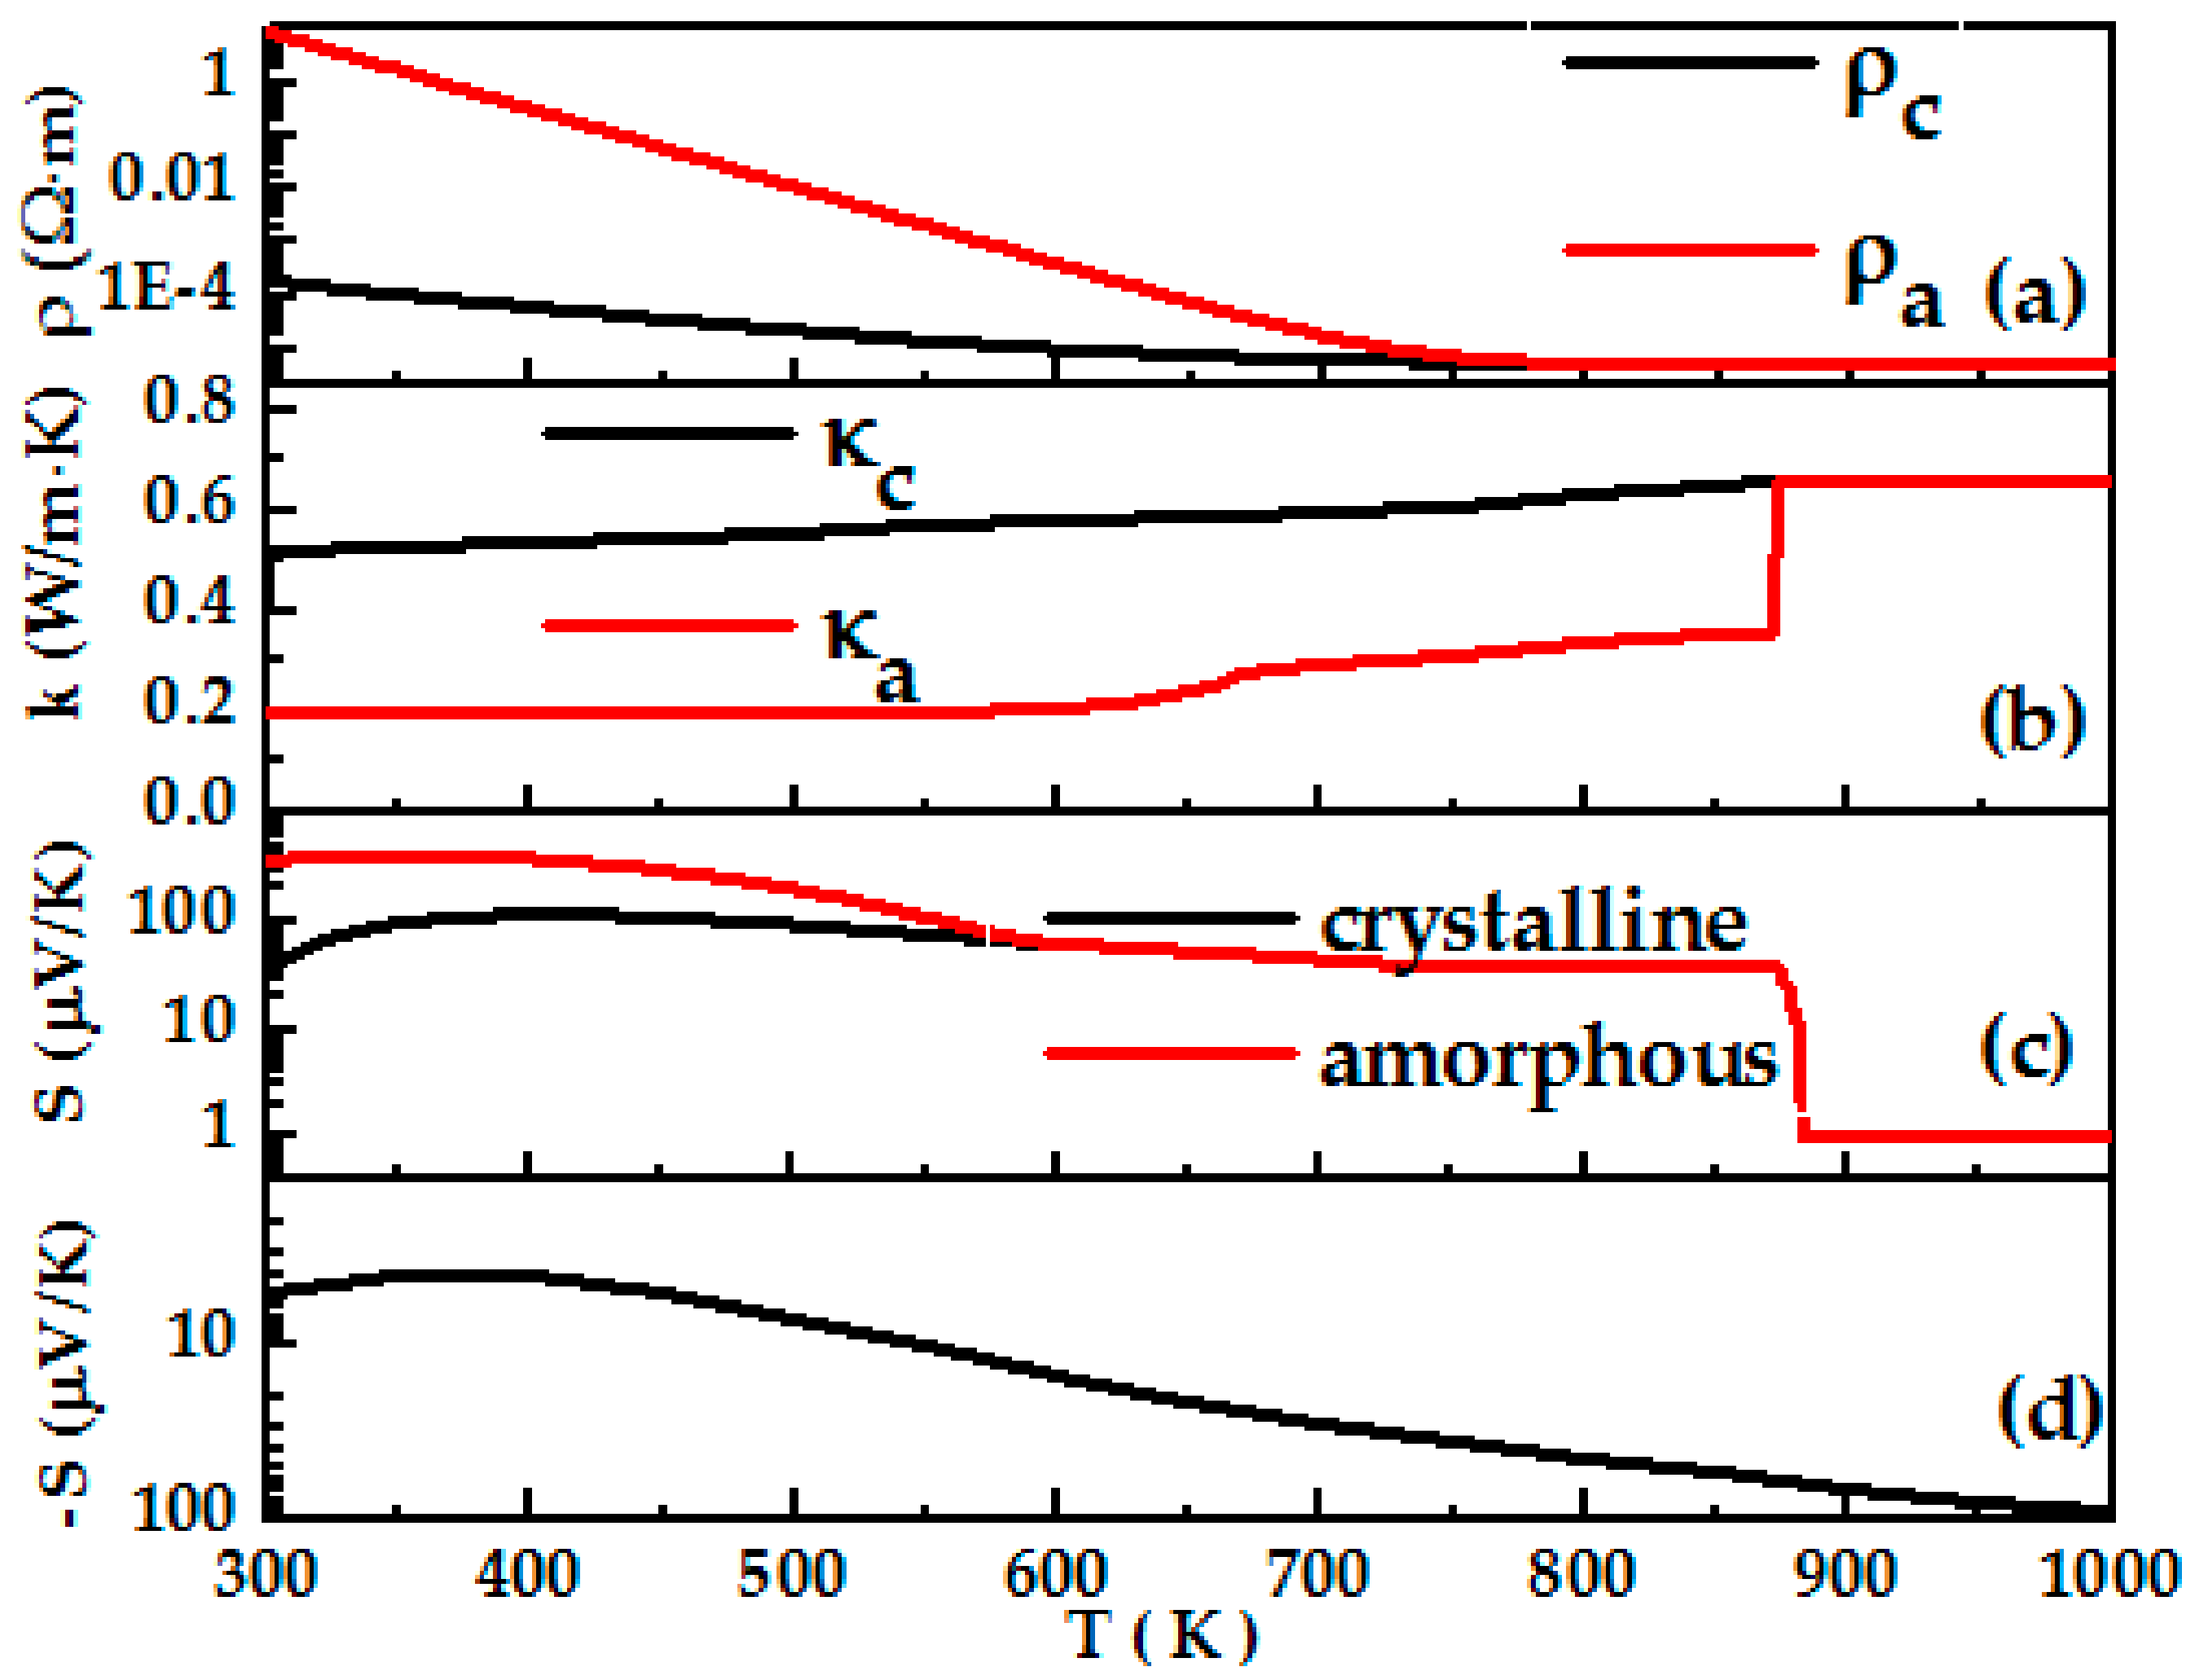
2.2. Materials
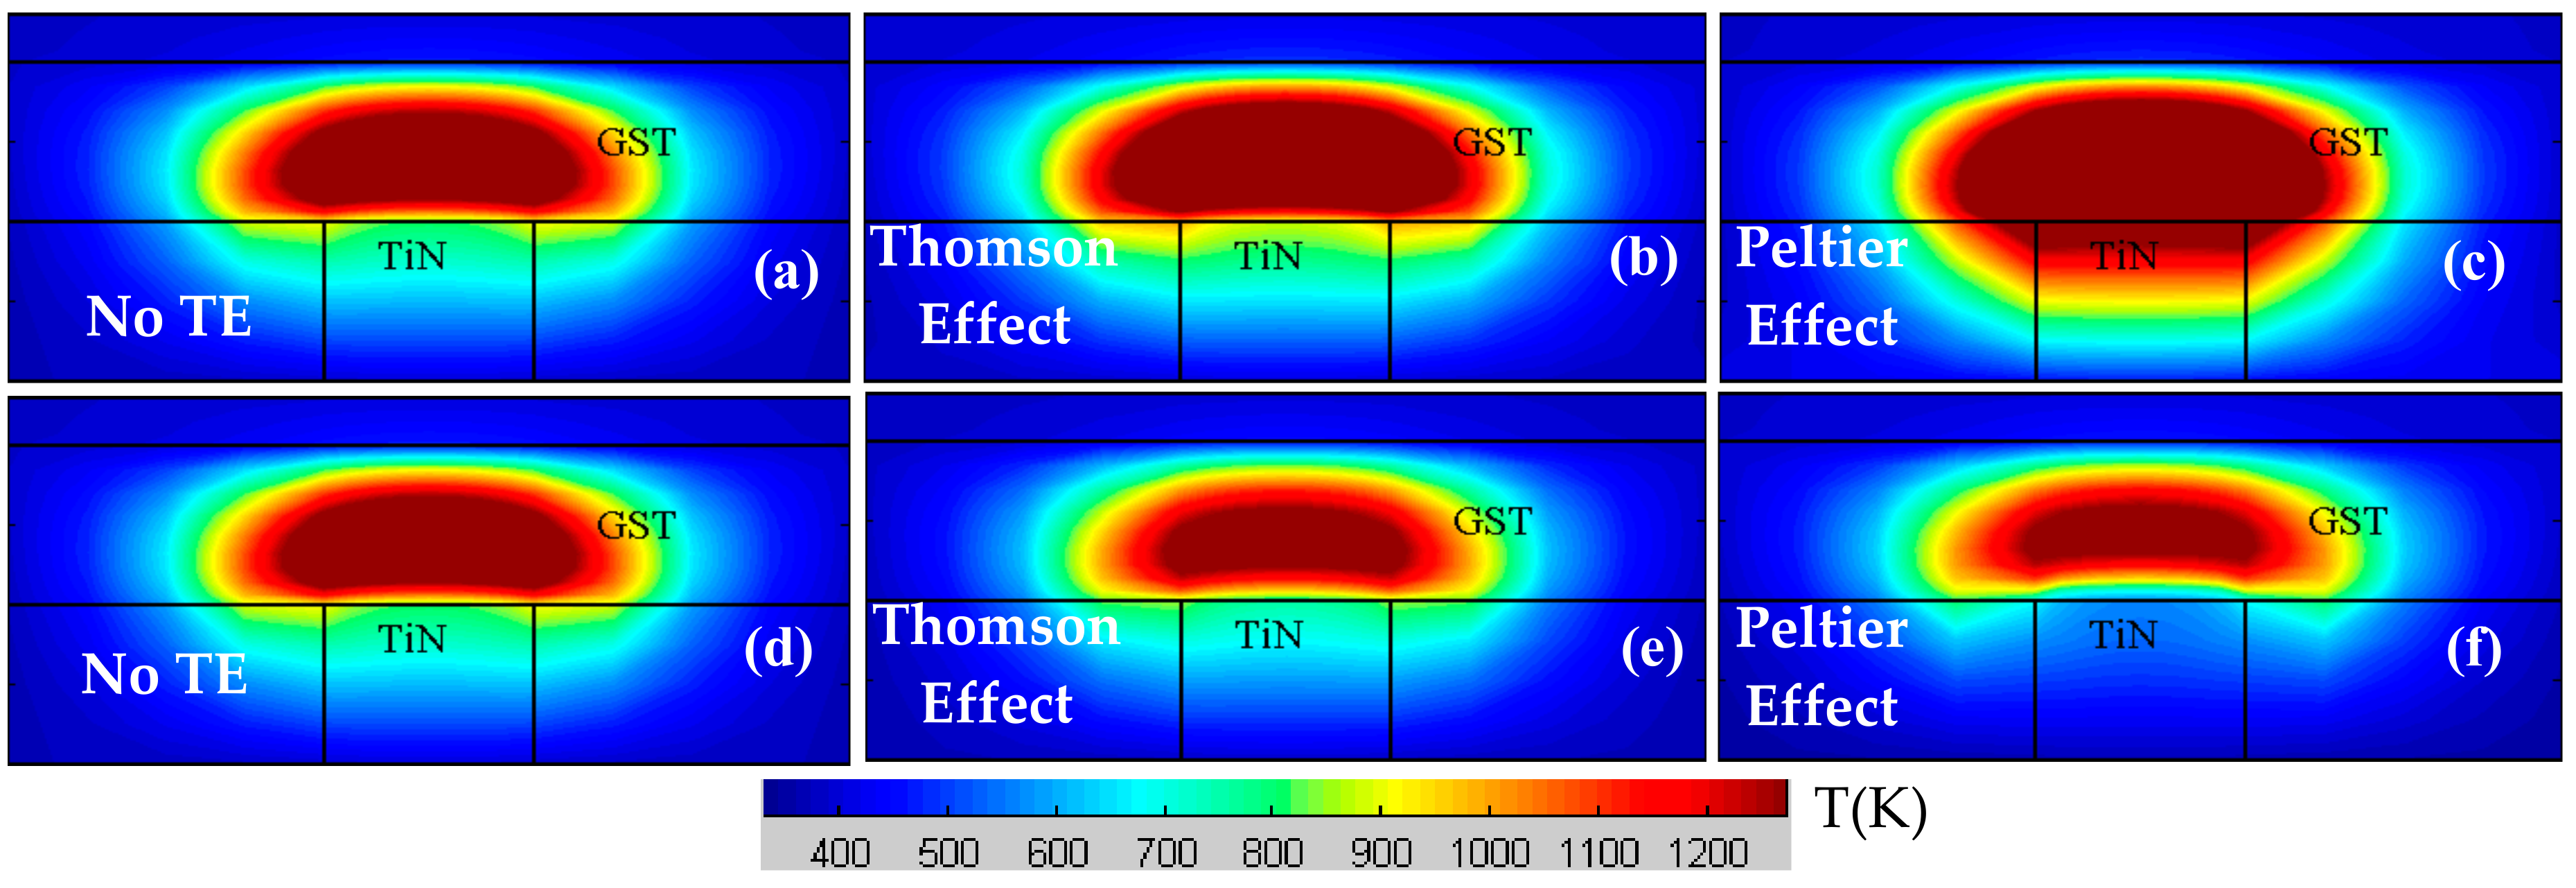
3. Results and Discussion
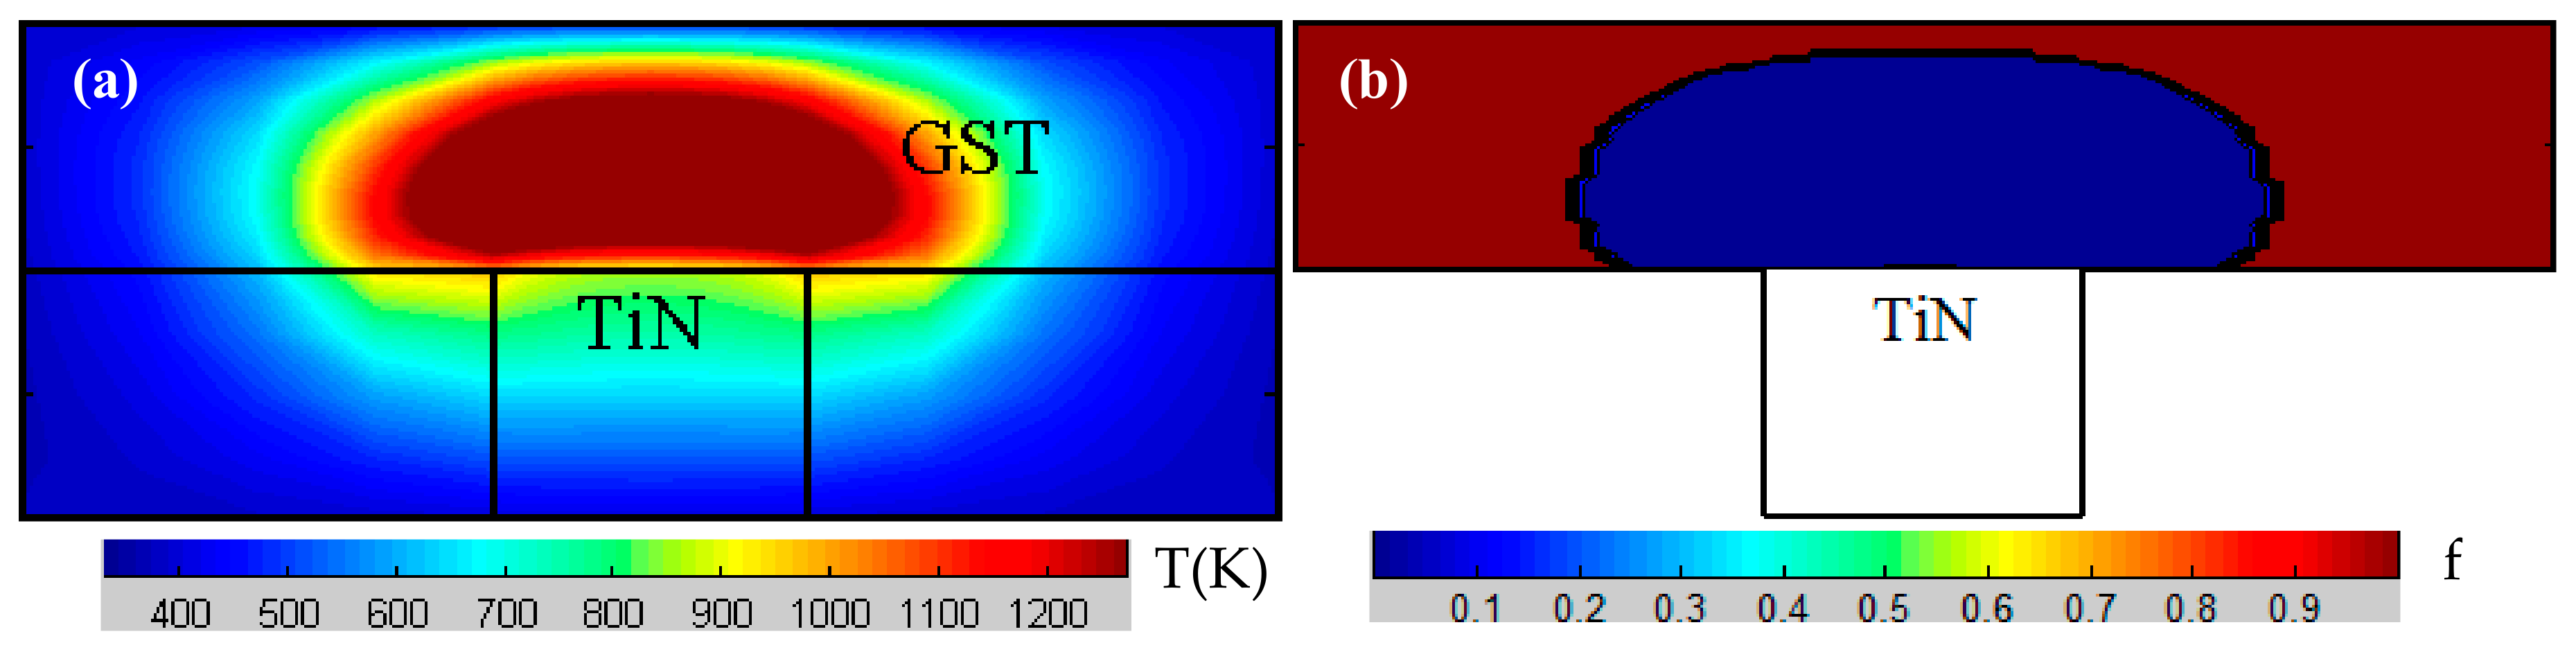
3.1. RESET Operation
3.2. SET Operation
4. Conclusions
Author Contributions
Funding
Conflicts of Interest
References
- Ciocchini, N.; Ielmini, D. Pulse-induced crystallization in phase-change memories under set and disturb conditions. IEEE. Trans. Electron Dev. 2015, 62, 847–854. [Google Scholar] [CrossRef]
- Simpson, R.E.; Krbal, M.; Fons, P.; Kolobov, A.V.; Tominaga, J.; Uruga, T. Toward the ultimate limit of phase-change in Ge2Sb2Te5. Nano Lett. 2010, 10, 414–419. [Google Scholar] [CrossRef] [PubMed]
- Loke, D.; Lee, T.H.; Wang, W.J.; Shi, L.P.; Zhao, R.; Yeo, Y.C.; Elliott, S.R. Breaking the speed limits of phase-change memory. Science 2012, 336, 1566–1569. [Google Scholar] [CrossRef] [PubMed]
- Wong, H.S.P.; Raoux, S.; Kim, S.; Liang, J.; Reifenberg, J.P.; Rajendran, B. Phase change memory. Proc. IEEE 2010, 98, 2201–2227. [Google Scholar] [CrossRef]
- Russo, U.; Ielmini, D.; Redaelli, A.; Lacaita, A.L. Modeling of programming and read performance in phase-change memories-Part I: Cell optimization and scaling. IEEE. Trans. Electron Dev. 2008, 55, 506–514. [Google Scholar] [CrossRef]
- Wright, C.D.; Hosseini, P.; Diosdado, J.A.V. Beyond von-Neumann computing with nanoscale phase-change memory devices. Adv. Funct. Mater. 2013, 23, 2248–2254. [Google Scholar] [CrossRef] [Green Version]
- Fallica, R.; Battaglia, J.L.; Cocco, S.; Monguzzi, C.; Teren, A.; Wiemer, C.; Varesi, E.; Cecchini, R.; Gotti, A.; Fanciulli, M. Thermal and electrical characterization of materials for phase-change memory cells. J. Chem. Eng. Data 2009, 54, 1698–1701. [Google Scholar] [CrossRef]
- Faraclas, A.; Bakan, G.; Adnane, L.; Dirisaglik, F.; Williams, N.E.; Gokirmak, A.; Silva, H. Modeling of thermoelectric effects in phase change memory cells. IEEE. Trans. Electron Dev. 2014, 61, 372–378. [Google Scholar] [CrossRef]
- Bakan, G.; Khan, N.; Silva, H.; Gokirmak, A. High-temperature thermoelectric transport at small scales: Thermal generation, transport and recombination of minority carriers. Sci. Rep. 2013, 32, 2724. [Google Scholar] [CrossRef] [PubMed]
- Lee, J.; Asheghi, M.; Goodson, K.E. Impact of thermoelectric phenomena on phase-change memory performance metrics and scaling. Nanotechnology 2012, 23, 205201. [Google Scholar] [CrossRef] [PubMed]
- Kim, D.H.; Merget, F.; Först, M.; Kurz, H. Three-dimensional simulation model of switching dynamics in phase change random access memory cells. J. Appl. Phys. 2007, 101, 064512. [Google Scholar] [CrossRef]
- Li, Z.; Jeyasingh, R.G.D.; Lee, J.; Asheghi, M.; Wong, H.S.P.; Goodson, K.E. Electrothermal modeling and design strategies for multibit phase-change memory. IEEE. Trans. Electron Dev. 2012, 59, 3561–3567. [Google Scholar] [CrossRef]
- Bruggeman, V.D. Berechnung verschiedener physikalischer Konstanten von heterogenen Substanzen. I. Dielektrizitätskonstanten und Leitfähigkeiten der Mischkörper aus isotropen Substanzen. Ann. Phys. 1935, 416, 636–664. [Google Scholar] [CrossRef]
- Endo, R.; Maeda, S.; Jinnai, Y.; Lan, R.; Kuwahara, M.; Kobayashi, Y.; Susa, M. Electric resistivity measurements of Sb2Te3 and Ge2Sb2Te5 melts using four-terminal method. Jpn. J. Appl. Phys. 2010, 49, 065802. [Google Scholar] [CrossRef]
- Cil, K.; Dirisaglik, F.; Adnane, L.; Wennberg, M.; King, A.; Faraclas, A.; Silva, H. Electrical Resistivity of Liquid Ge2Sb2Te5 Based on Thin-Film and Nanoscale Device Measurements. IEEE. Trans. Electron Dev. 2013, 60, 433–437. [Google Scholar] [CrossRef]
- Khulbe, P.K.; Wright, E.M.; Mansuripur, M. Crystallization behavior of as-deposited, melt quenched, and primed amorphous states of Ge2Sb2.3Te5 films. J. Appl. Phys. 2000, 88, 3926–3933. [Google Scholar] [CrossRef]
- Graf, M.J.; Yip, S.K.; Sauls, J.A.; Rainer, D. Electronic thermal conductivity and the Wiedemann-Franz law for unconventional superconductors. Phys. Rev. B 1996, 53, 15147. [Google Scholar] [CrossRef]
- Yan, F.; Zhu, T.J.; Zhao, X.B.; Dong, S.R. Microstructures and thermoelectric properties of GeSbTe based layered compounds. Appl. Phys. A 2007, 88, 425–428. [Google Scholar] [CrossRef]
- Hyot, B.; Gehanno, V.; Rolland, B.; Fargeix, A.; Vannufel, C.; Charlet, F.; Béchevet, B.; Bruneau, J.M.; Desre, P.J. Amorphization and crystallization mechanisms in GeSbTe-based phase change optical disks. J. Magn. Soc. Jpn. 2001, 25, 414–419. [Google Scholar] [CrossRef]
- Suh, D.S.; Kim, C.; Kim, K.H.; Kang, Y.S.; Lee, T.Y.; Khang, Y.; Park, T.S.; Yoon, Y.G.; Im, J.; Ihm, J. Thermoelectric heating of Ge2Sb2Te5 in phase change memory devices. Appl. Phys. Lett. 2010, 96, 123115. [Google Scholar] [CrossRef]
- Choi, Y.; Jung, M.; Lee, Y.K. Effect of heating rate on the activation energy for crystallization of amorphous Ge2Sb2Te5 thin film. Electrochem. Solid State Lett. 2009, 12, F17–F19. [Google Scholar] [CrossRef]
- Friedrich, I.; Weidenhof, V.; Njoroge, W.; Franz, P.; Wuttig, M. Structural transformations of Ge2Sb2Te5 films studied by electrical resistance measurements. J. Appl. Phys. 2000, 87, 4130–4134. [Google Scholar] [CrossRef]


| ρelec (Ω m) | κ (W/m K) | C (J/Kg K) | |
|---|---|---|---|
| SiO2 | 1014 | 1.3 | 1050 |
| TiN | 10−6 | 14 | 784 |
| W | 5.4 × 10⁻⁸ | 175 | 132 |
© 2018 by the authors. Licensee MDPI, Basel, Switzerland. This article is an open access article distributed under the terms and conditions of the Creative Commons Attribution (CC BY) license (http://creativecommons.org/licenses/by/4.0/).
Share and Cite
Ma, C.; He, J.; Lu, J.; Zhu, J.; Hu, Z. Modeling of the Temperature Profiles and Thermoelectric Effects in Phase Change Memory Cells. Appl. Sci. 2018, 8, 1238. https://doi.org/10.3390/app8081238
Ma C, He J, Lu J, Zhu J, Hu Z. Modeling of the Temperature Profiles and Thermoelectric Effects in Phase Change Memory Cells. Applied Sciences. 2018; 8(8):1238. https://doi.org/10.3390/app8081238
Chicago/Turabian StyleMa, Changcheng, Jing He, Jingjing Lu, Jie Zhu, and Zuoqi Hu. 2018. "Modeling of the Temperature Profiles and Thermoelectric Effects in Phase Change Memory Cells" Applied Sciences 8, no. 8: 1238. https://doi.org/10.3390/app8081238
APA StyleMa, C., He, J., Lu, J., Zhu, J., & Hu, Z. (2018). Modeling of the Temperature Profiles and Thermoelectric Effects in Phase Change Memory Cells. Applied Sciences, 8(8), 1238. https://doi.org/10.3390/app8081238