The Determination of Dendrite Coherency Point Characteristics Using Three New Methods for Aluminum Alloys

 , ,
, ,
Abstract
:Featured Application
Abstract
1. Introduction
- the mechanical (rheological) method,
- the two thermocouples method using the minimum temperature difference,
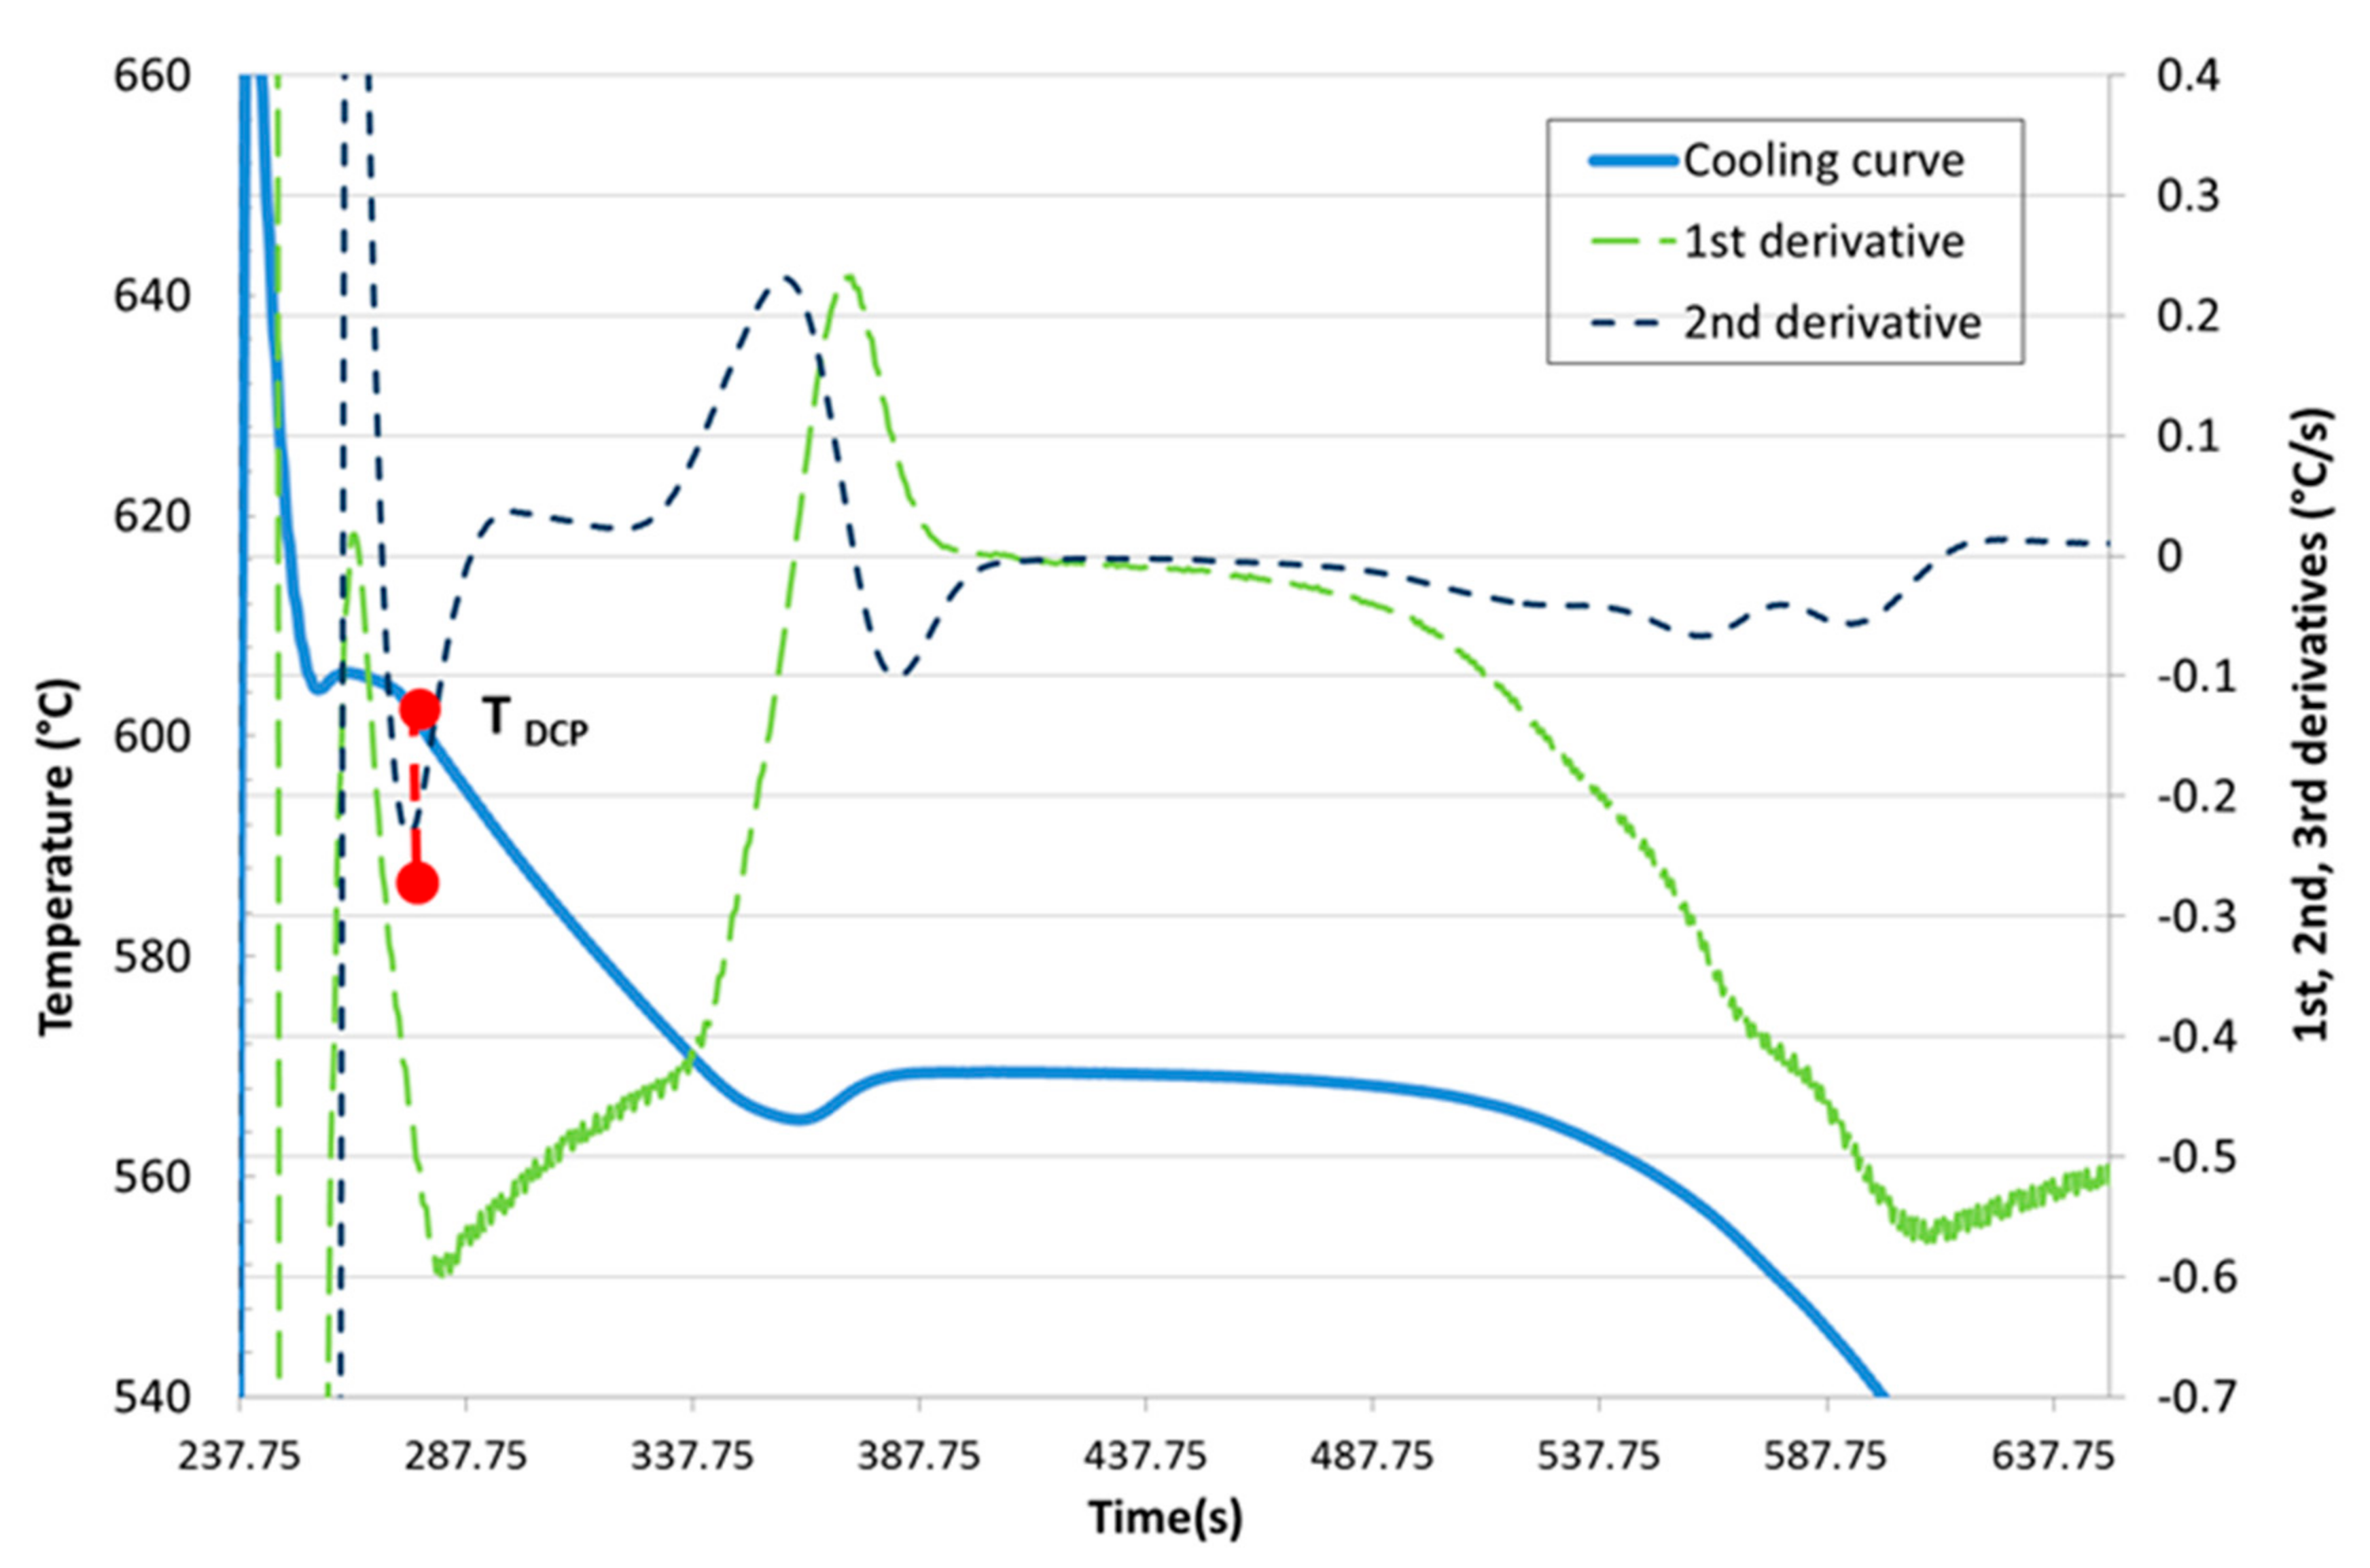
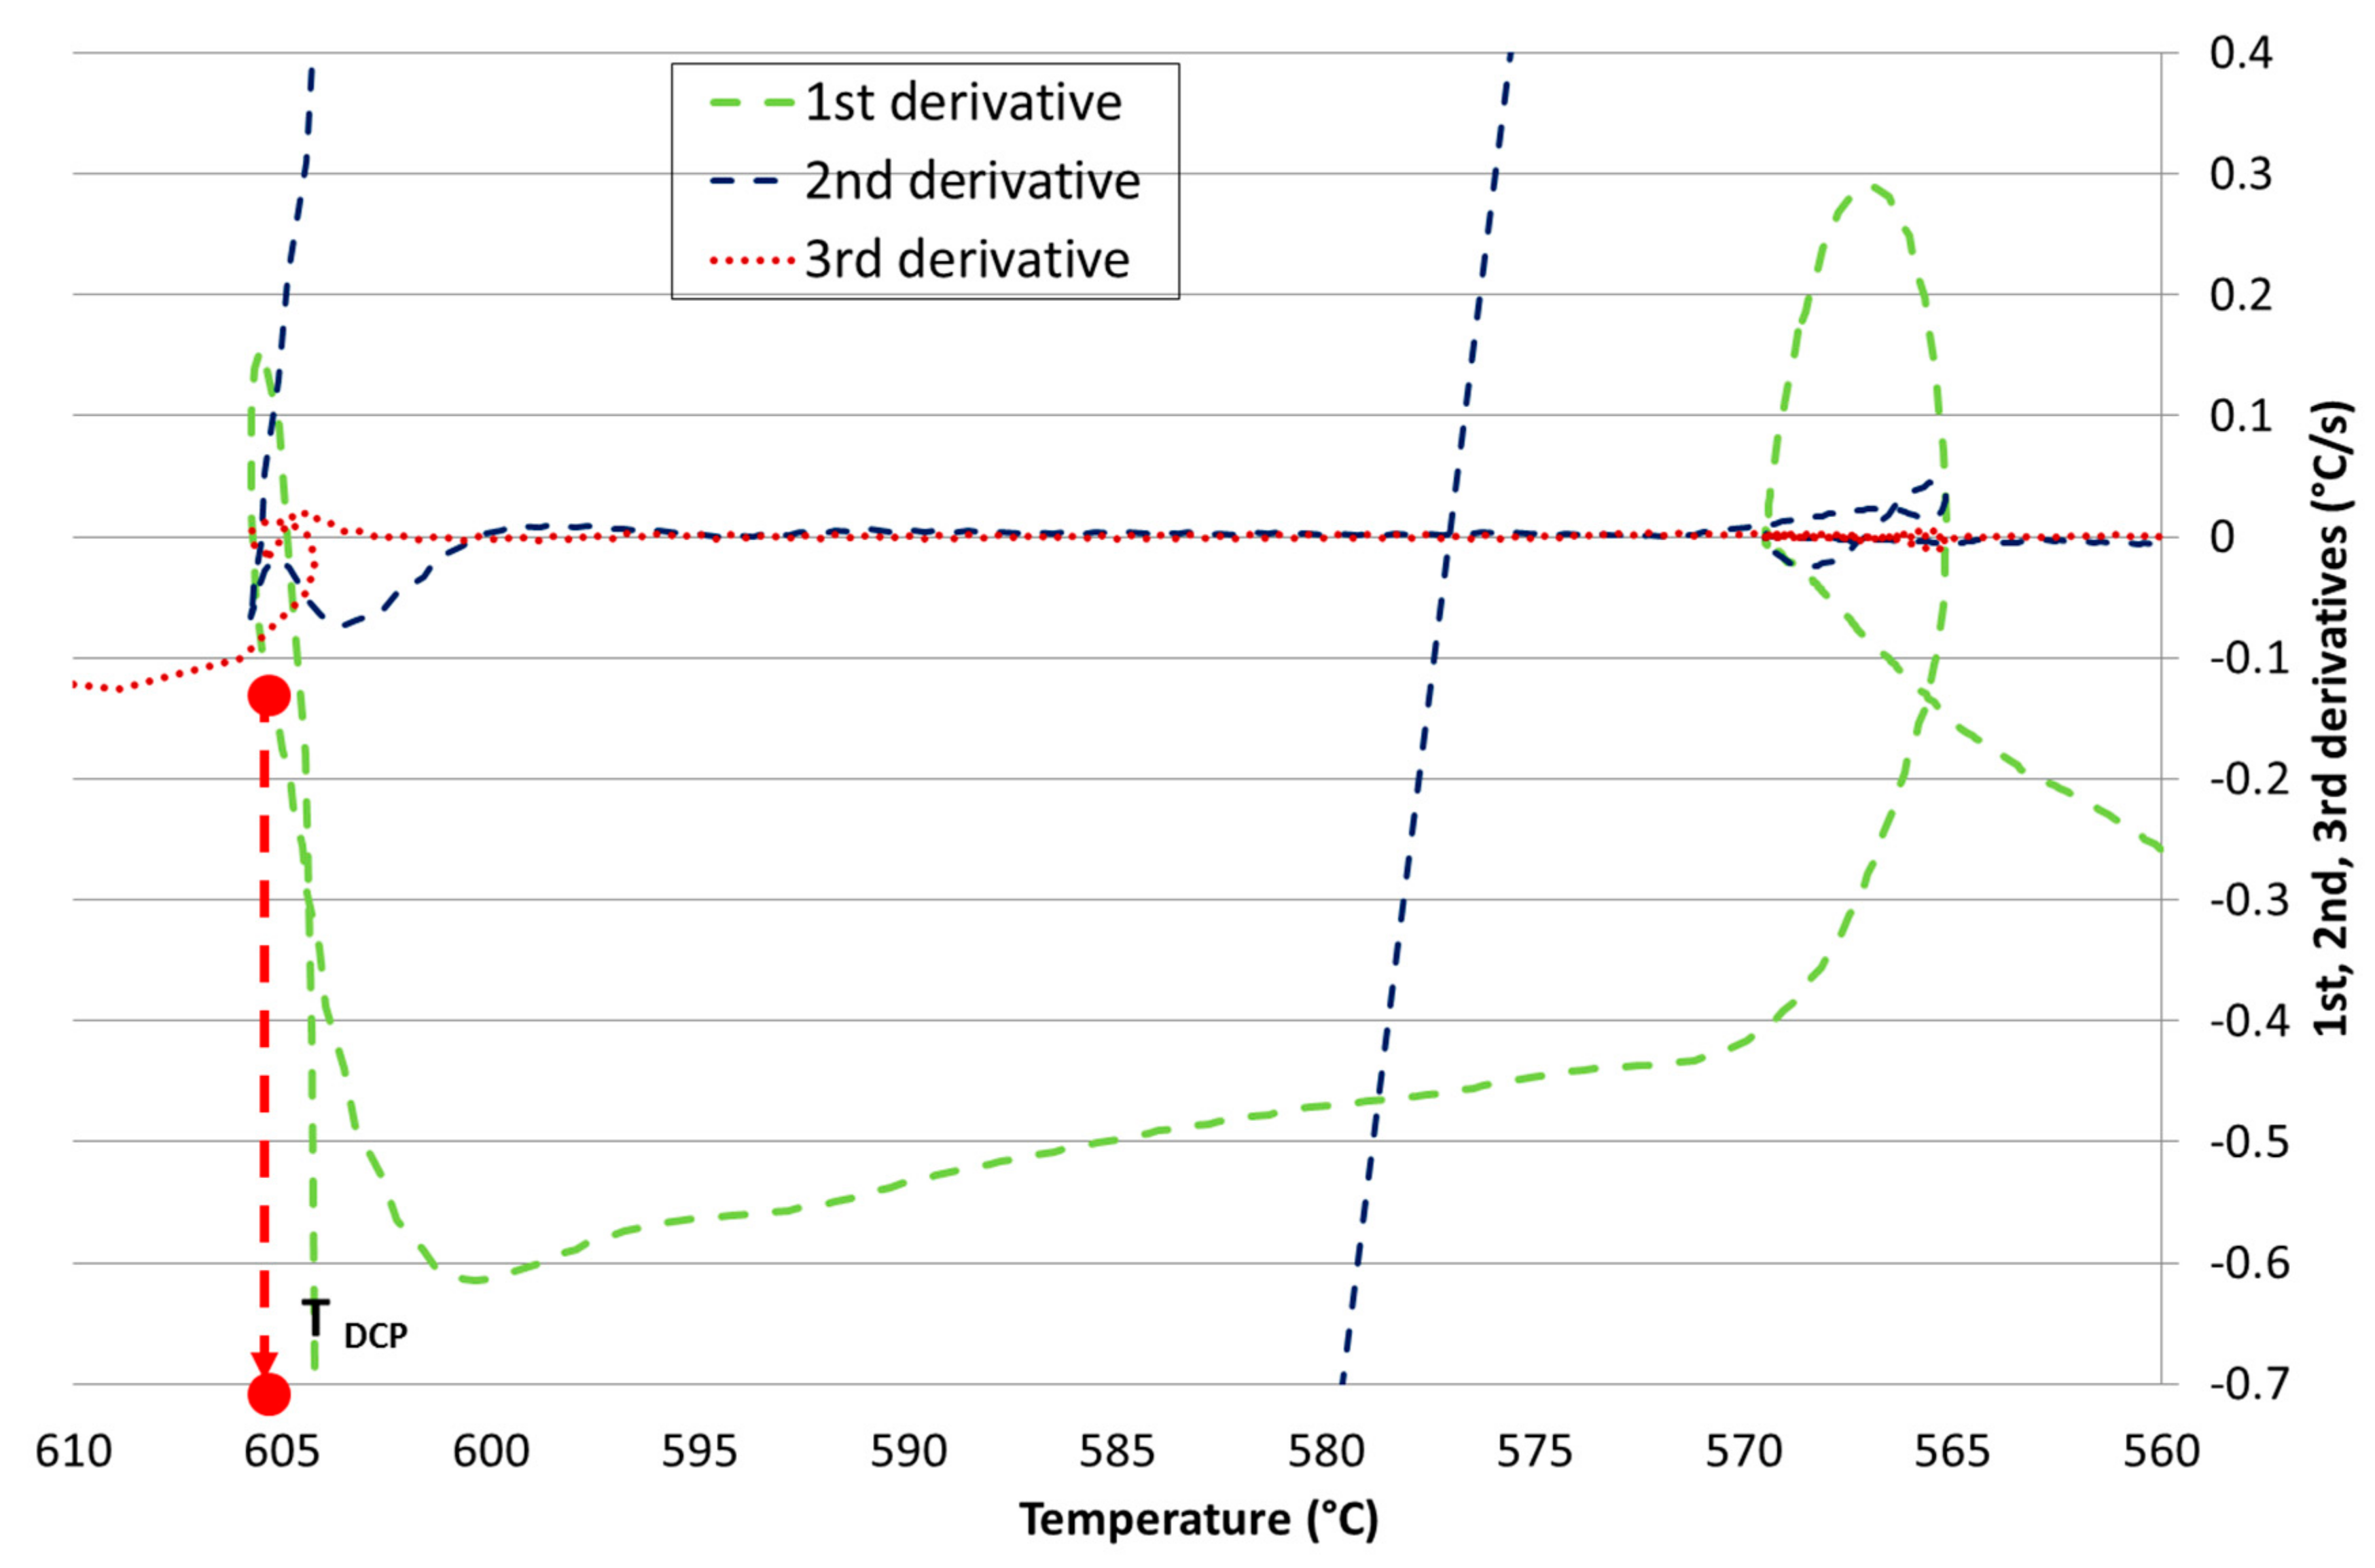
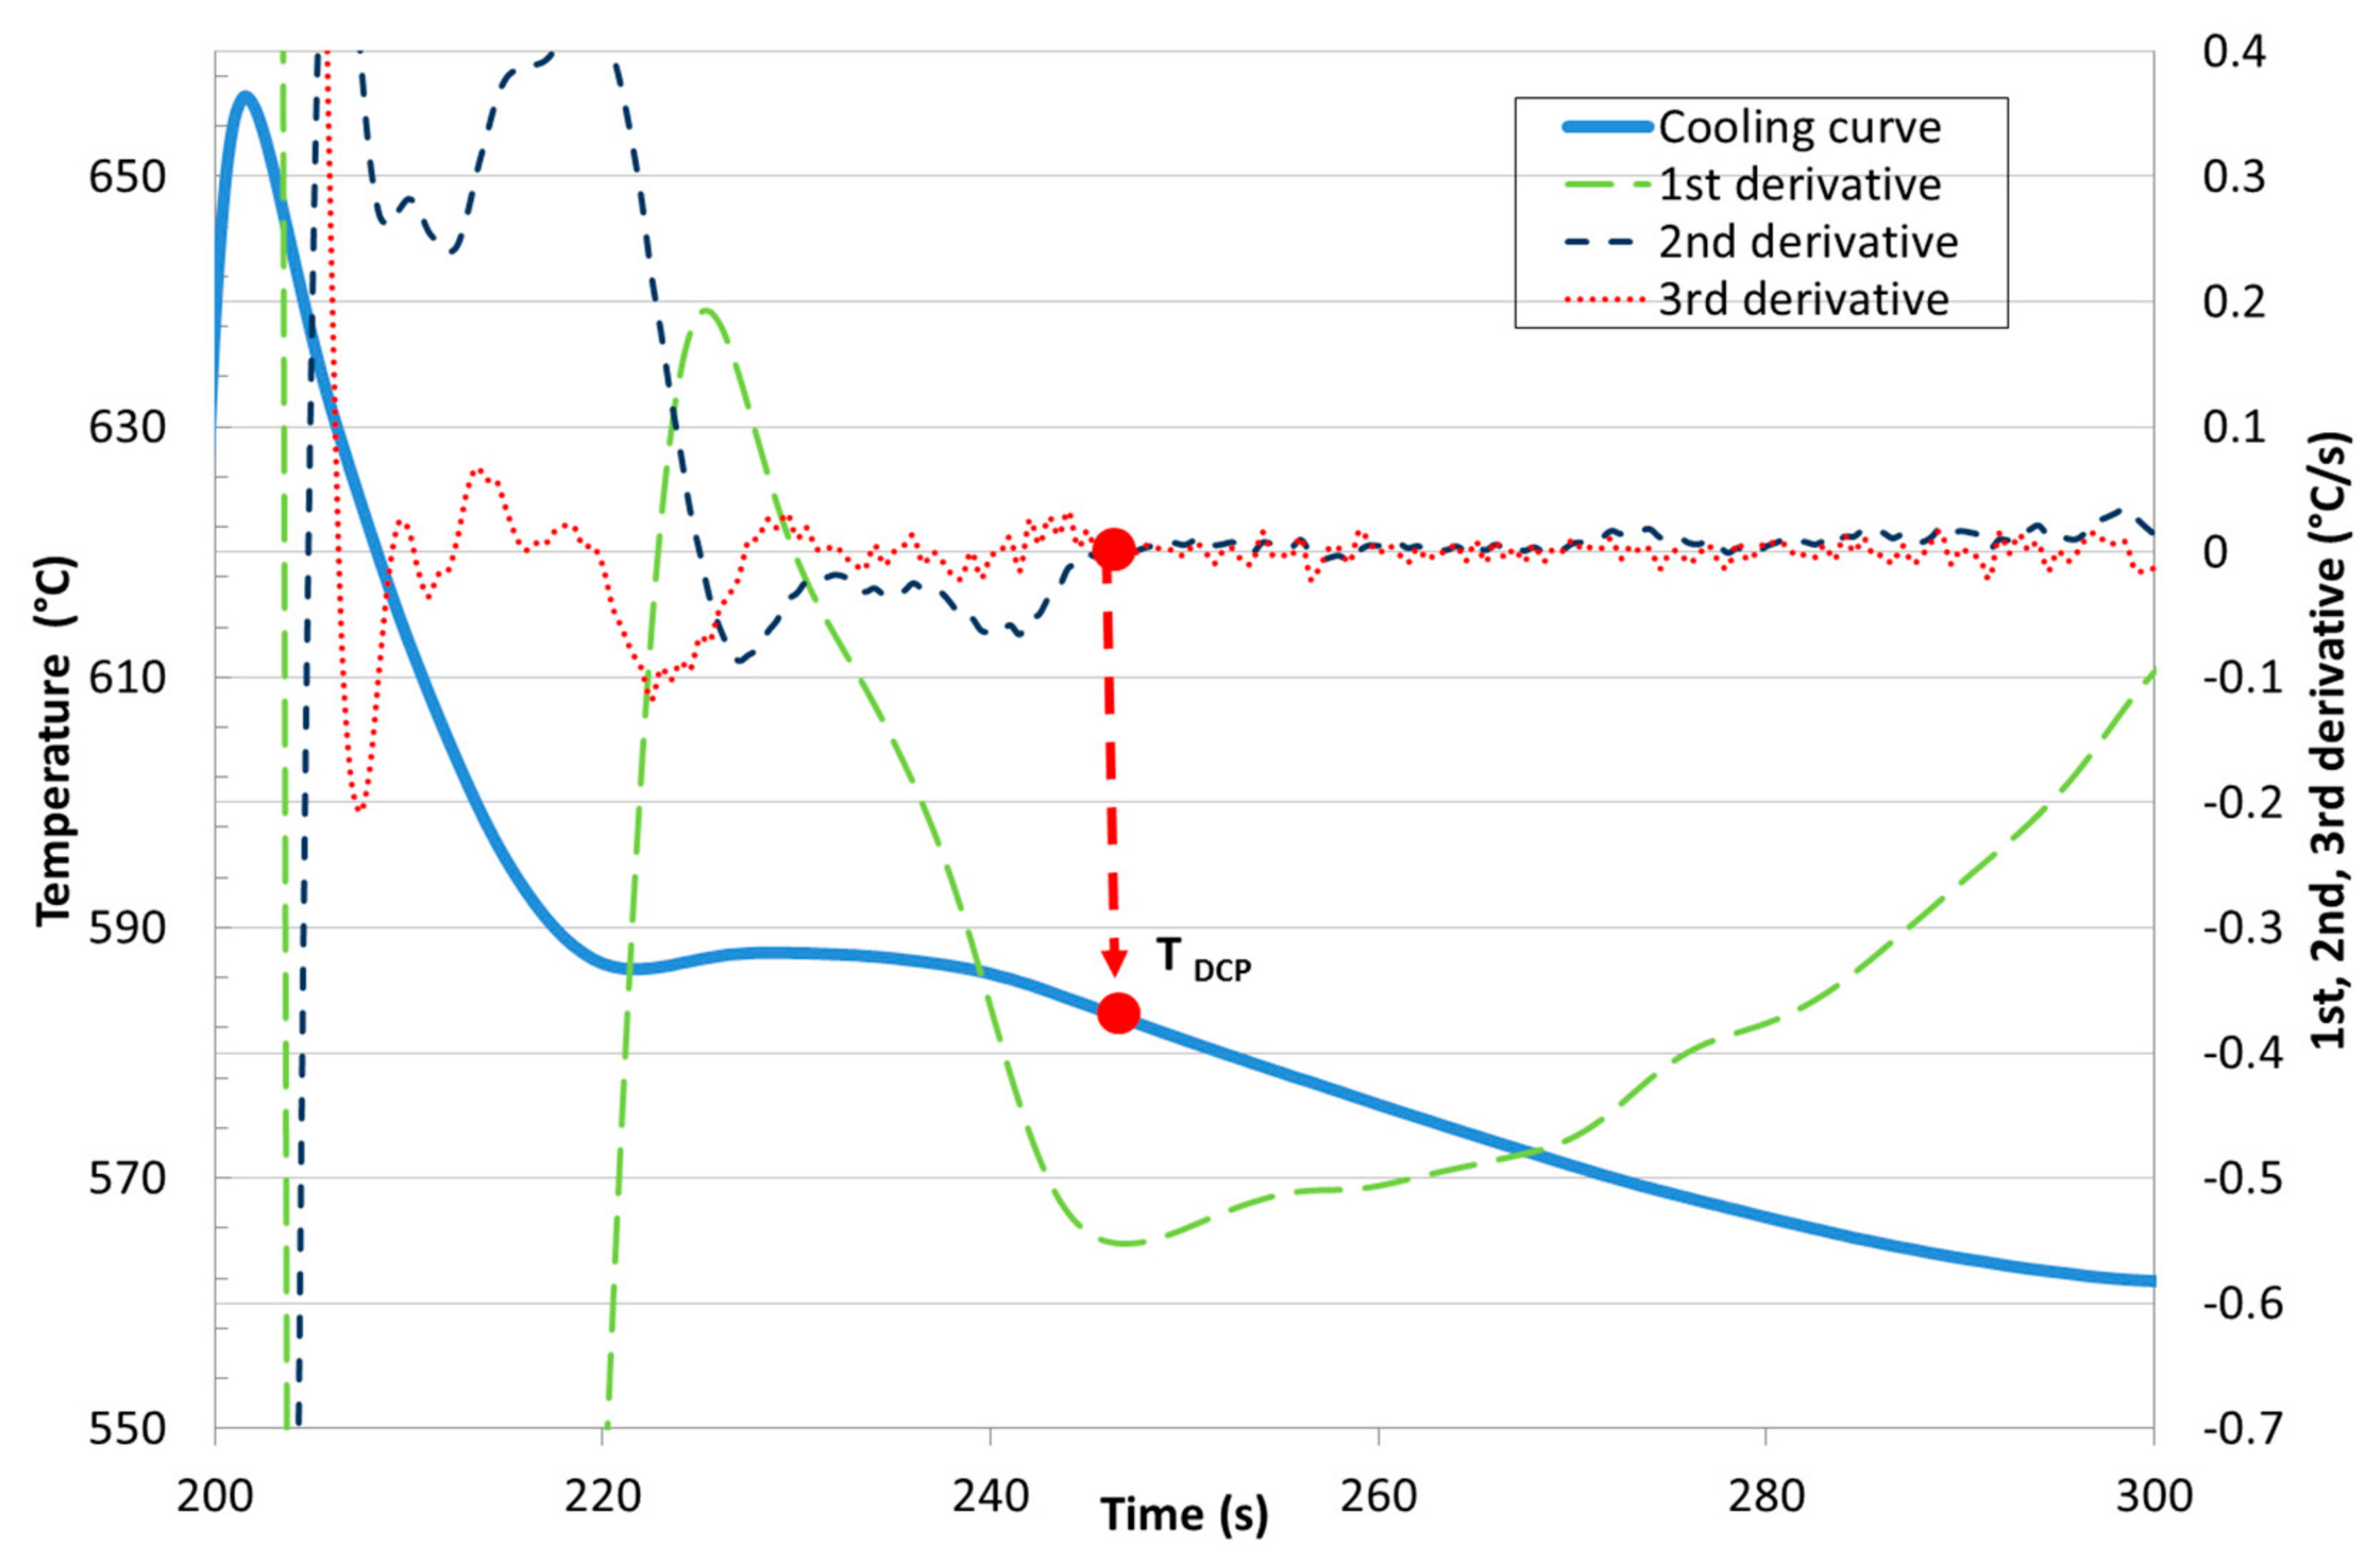
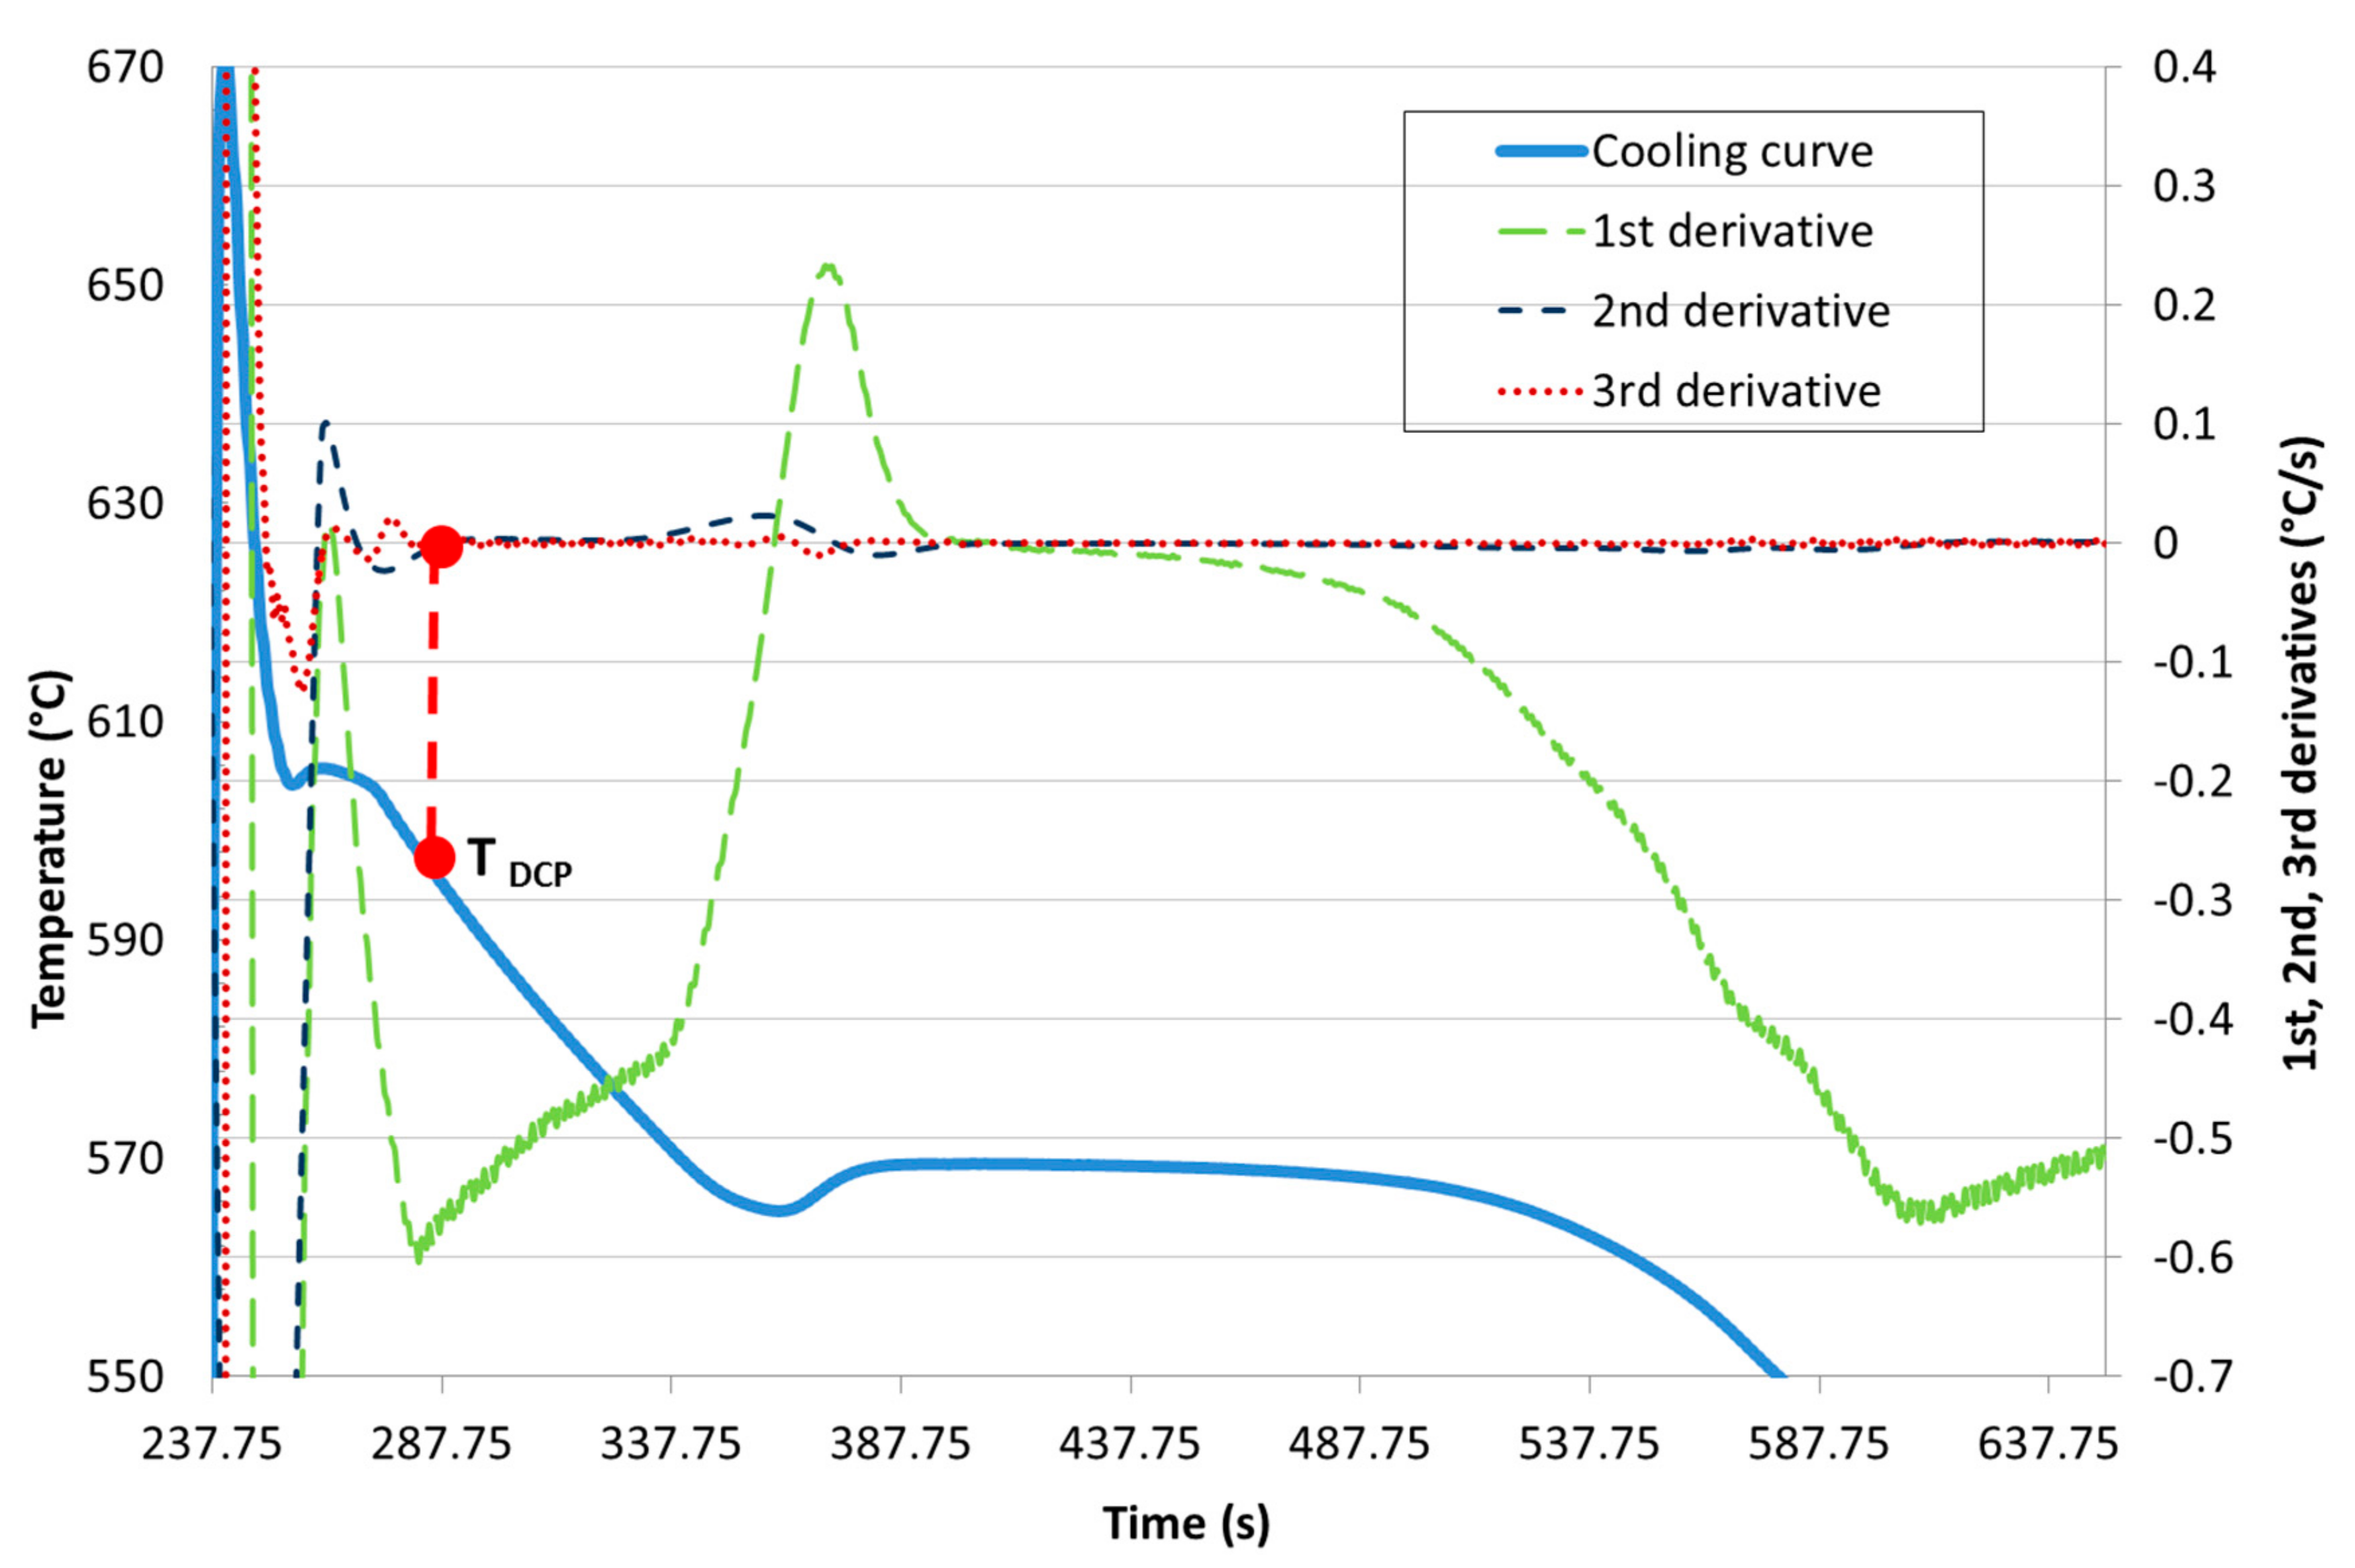
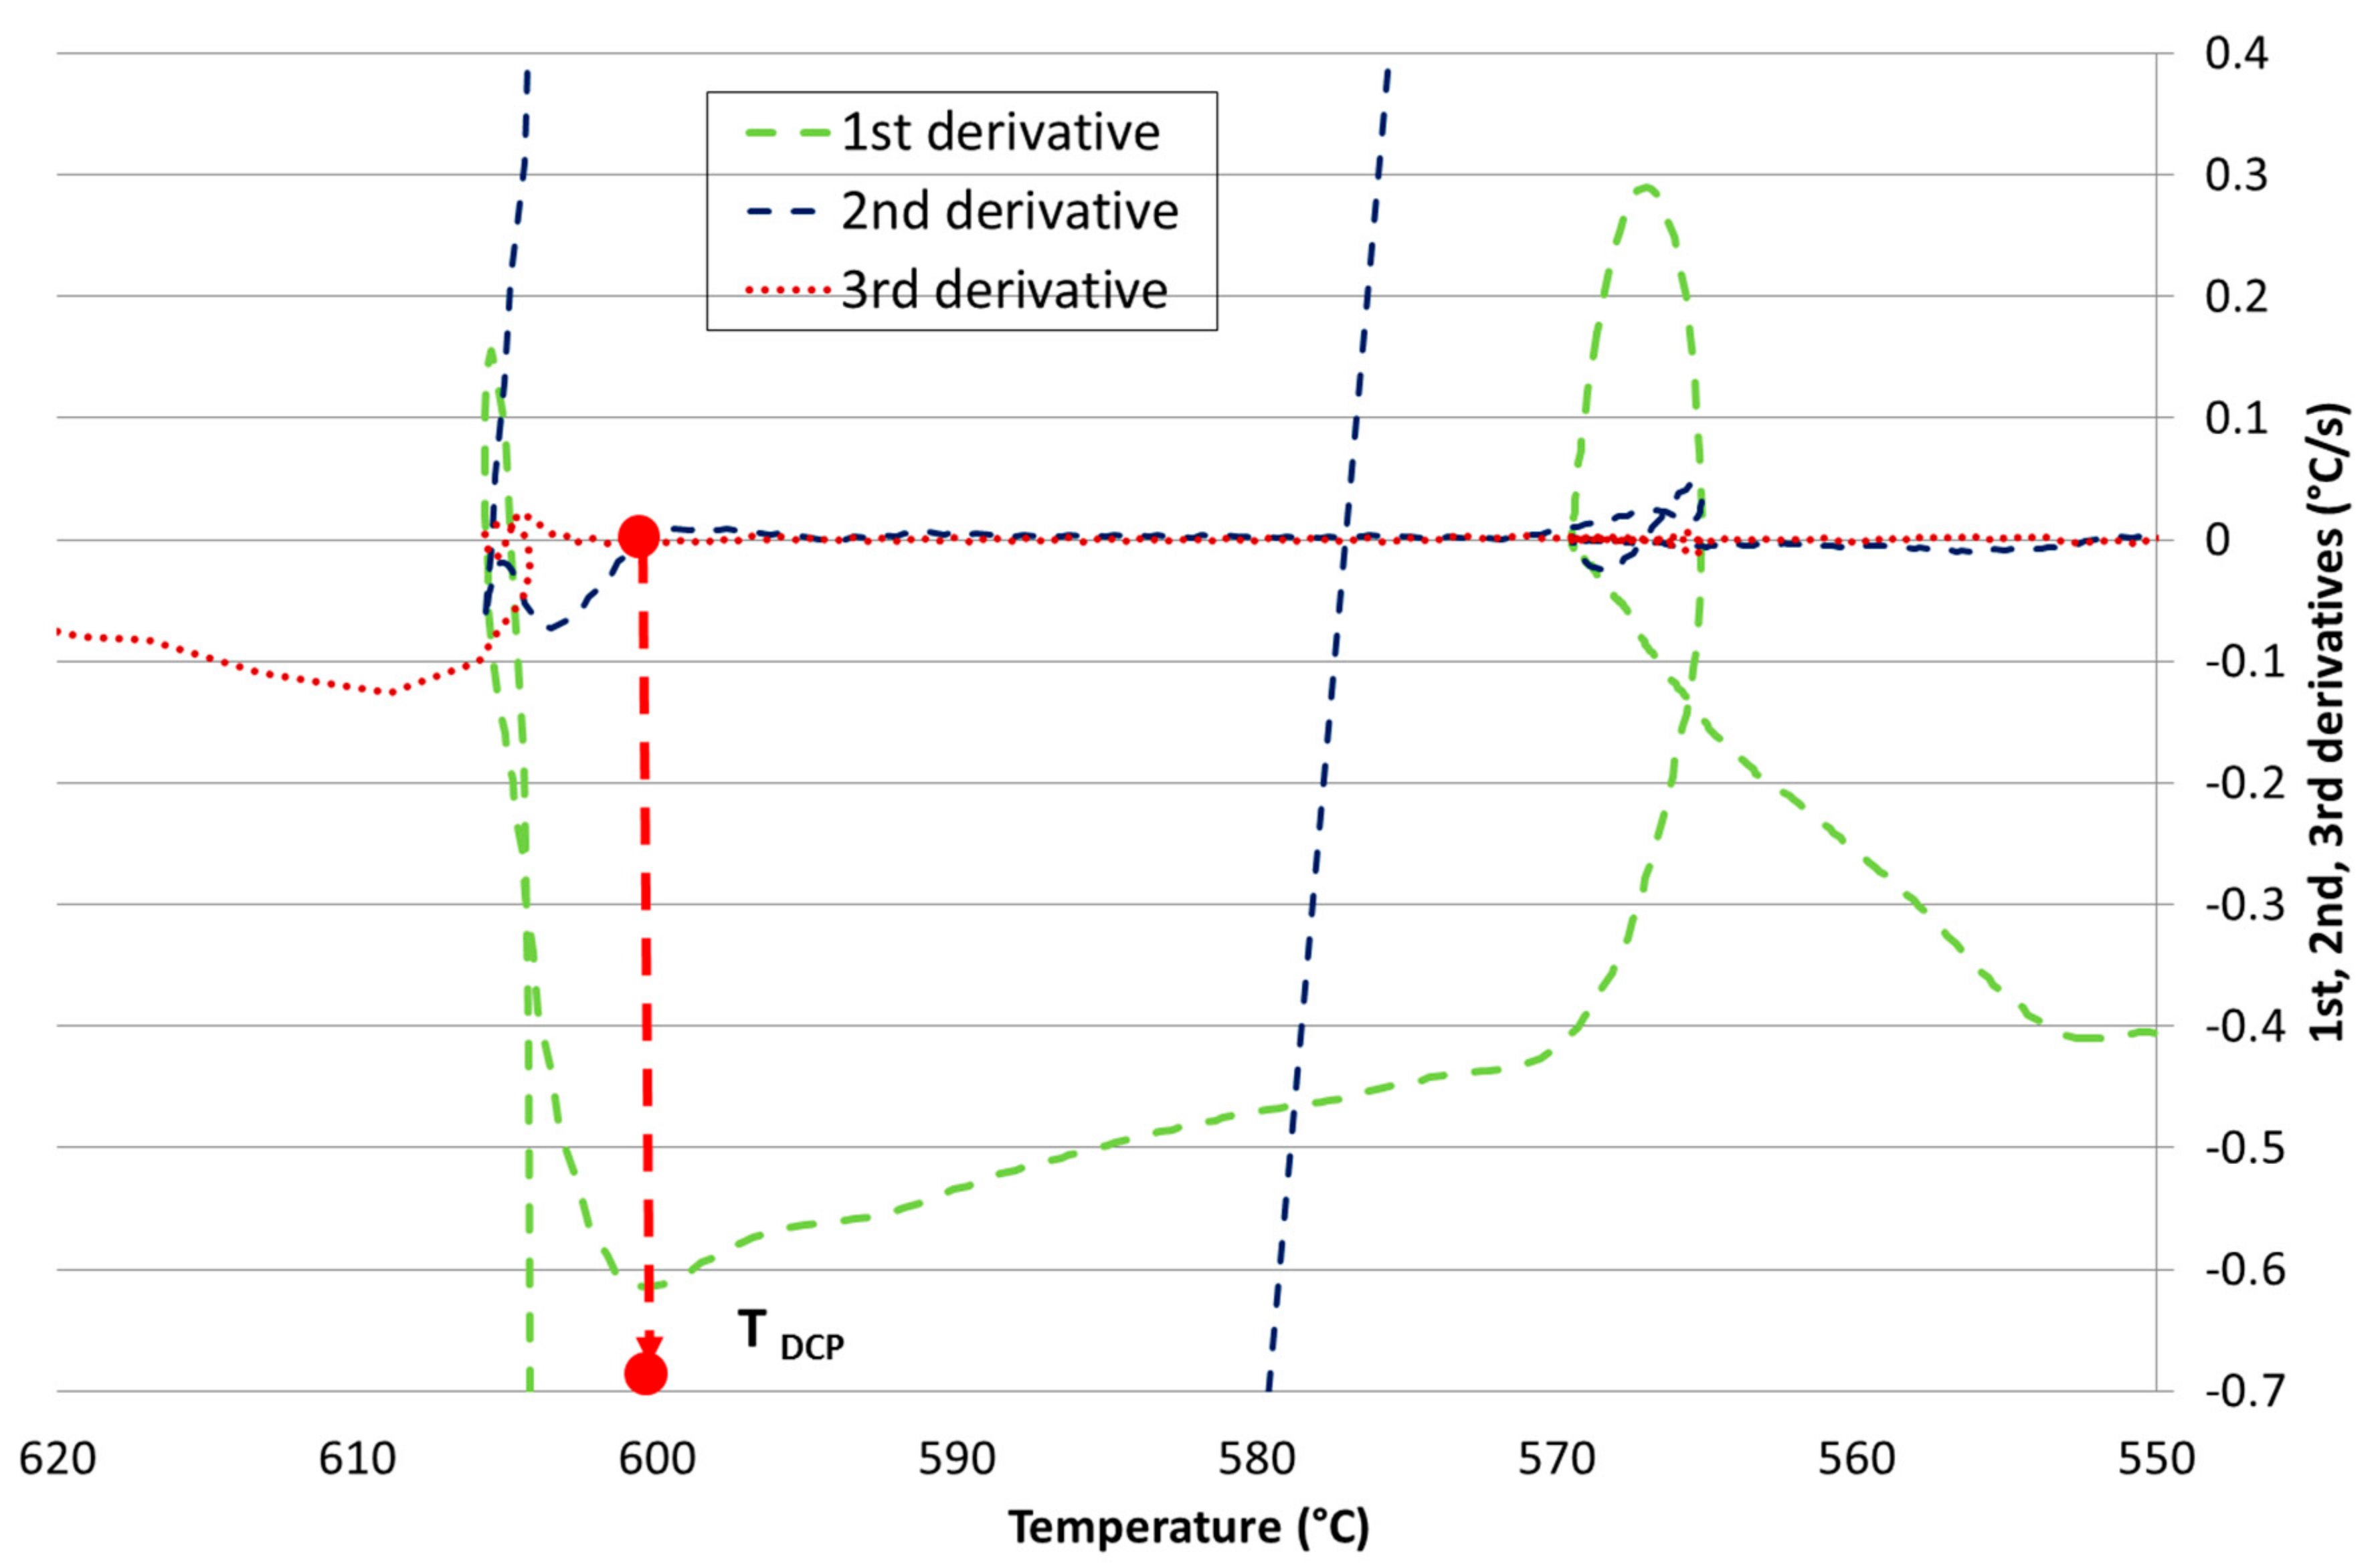
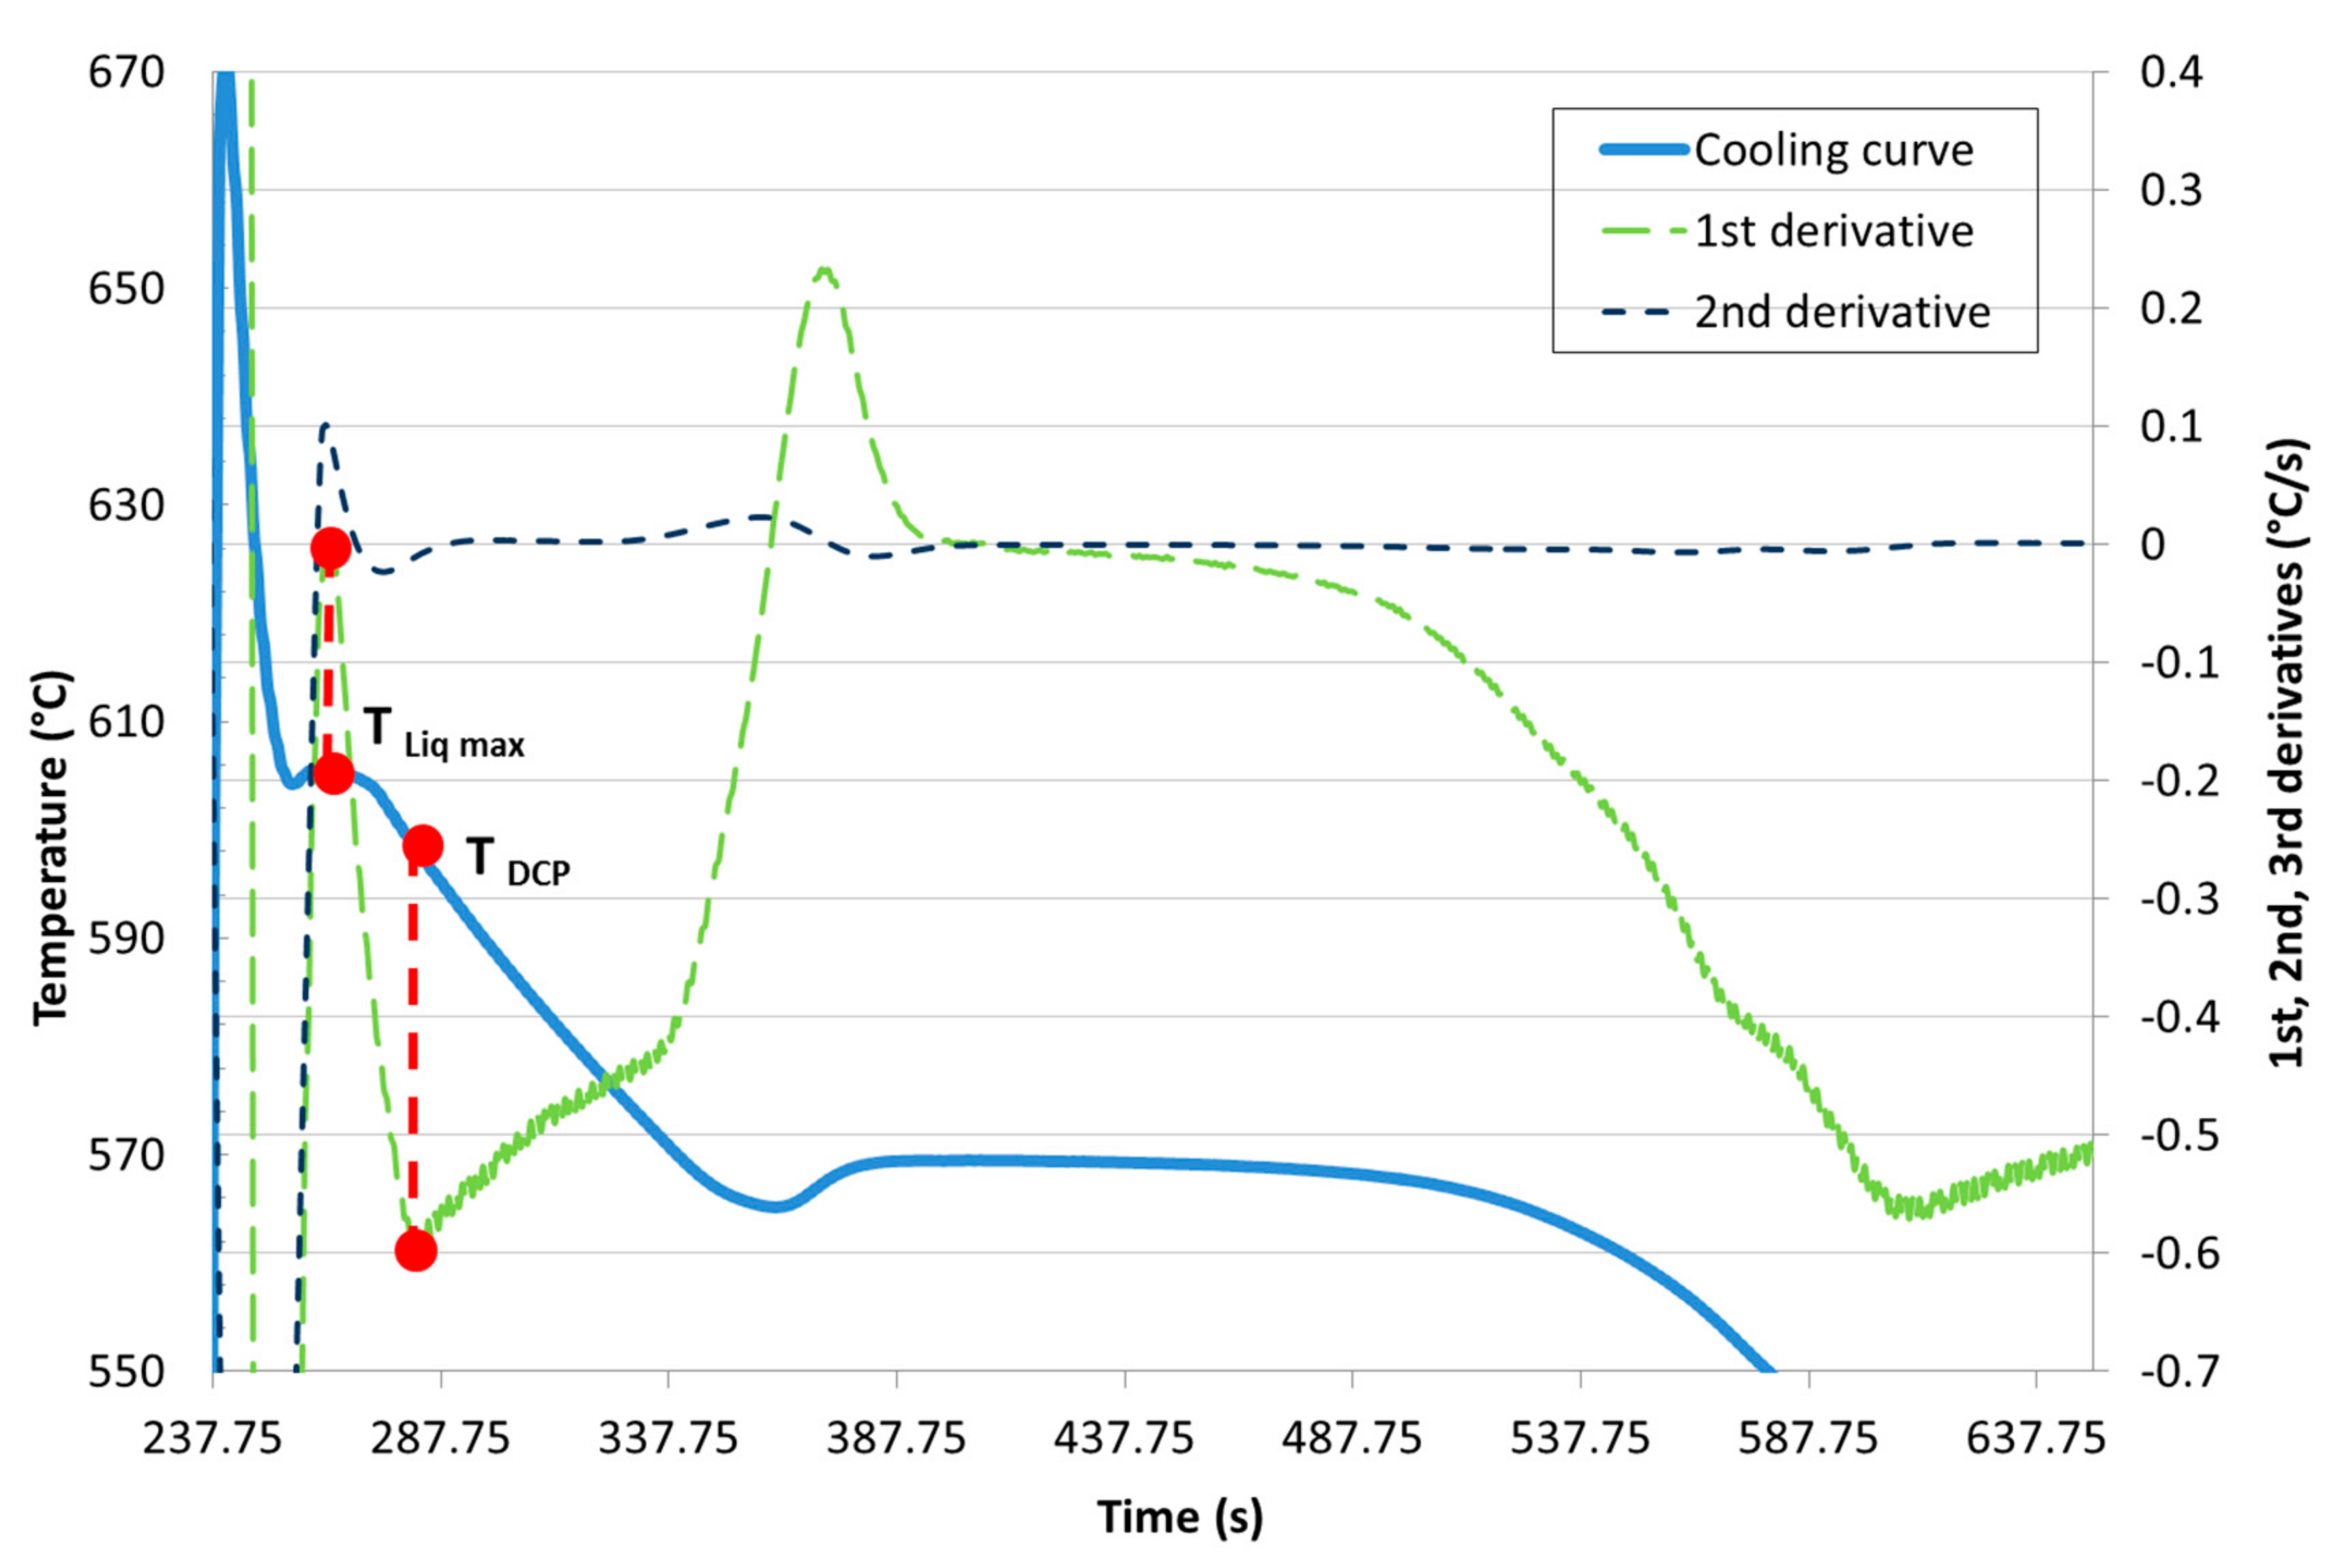
- the single thermocouple method using the minimum of the second derivative of the cooling curve and/or the common point of the second and third derivative in the zero axis,
- the three thermocouples method determining the thermal diffusivity during solidification.
2. Materials and Methods
Development of New Methodologies for the Determination of DCP Temperature
3. Results
4. Discussion
5. Conclusions
Author Contributions
Acknowledgments
Conflicts of Interest
References
- Voncina, M.; Mrvar, P.; Medved, J. Thermodynamic analysis of AlSi10Mg alloy. RMZ M&G 2006, 52, 621–633. [Google Scholar]
- Djurdjevic, M.B.; Huber, G. Determination of rigidity point/temperature using thermal analysis method and mechanical technique. J. Alloys Compd. 2014, 590, 500–506. [Google Scholar] [CrossRef]
- Djurdjevic, M.B.; Stockwell, T.; Sokolowski, J. The effect of Strontium on the. microstructure of the Aluminium-silicon and Aluminium-copper eutectics in the 319 Aluminium alloy. Int. J. Cast Met. Res. 1999, 12, 67–73. [Google Scholar] [CrossRef]
- Arnberg, L.; Chai, G.; Bäckerud, L. Determination of dendritic coherency in solidification melts by rheological measurements. Mater. Sci. Eng. A 1993, 173, 101–103. [Google Scholar] [CrossRef]
- Chai, G.; Backerud, L.; Avnberg, L. Study of dendrite coherency in Al-Si alloys during equiaxed dendritic solidification. Z. Metalk. 1995, 86, 54–59. [Google Scholar]
- Chai, G.; Bäckerud, L.; Rolland, T.; Arnberg, L. Dendrite coherency during equiaxed solidification in binary aluminum alloys. Met. Mater. Trans. A 1995, 26, 965–970. [Google Scholar] [CrossRef]
- Veldman, N.; Dahle, A.; St. John, D. Determination of dendrite coherency point. In Proceedings of the Die Casting & Tooling Technology Conference, Melbourne, Australia, 22–25 June 1997; pp. 22–25. [Google Scholar]
- Bäckerud, L.; Chai, G.; Tamminen, J. Solidification Characteristics of Aluminum Alloys. Vol. 2. Foundry Alloys; American Foundrymen’s Society. Inc.: Oslo, Norway, 1990; p. 266. [Google Scholar]
- Claxton, R. Aluminum alloy coherency. J. Miner. Met. Mater. Soc. 1975, 27, 14–16. [Google Scholar] [CrossRef]
- Bäckerud, L.; Chalmers, B. Some aspects of dendritic growth in binary alloys: study of the Aluminum–Copper system. Trans. Met. Soc. AIME 1969, 245, 309–318. [Google Scholar]
- Tamminen, J. Thermal Analysis for Investigation of Solidification Mechanisms in Metals and Alloys. Ph.D. Thesis, Stockholm University, Stockholm, Sweden, January 1988. [Google Scholar]
- Jiang, H.; Kierkus, W.T.; Sokolowski, J.H. Dendrite coherency point determination using thermal analysis and rheological measurements. In Proceedings of the International Conference on Thermophysical Properties of Materials (TPPM), Singapore, 17–19 November 1999. [Google Scholar]
- Djurdjevic, M.B.; Kierkus, W.T.; Sokolowski, J.H. Detection of the dendrite coherency point of Al 3XX series of alloys using a single sensor thermal analysis technique. In Proceedings of the 40th Annual Conference of Metallurgists of CIM, Toronto, ON, Canada; 2001. [Google Scholar]
- Djurdjevic, M.B.; Kierkus, W.T.; Liliac, R.E.; Sokolowski, J.H. Extended analysis of cooling curves. In Proceedings of the 41st Annual Conference of Metallurgists of CIM, Montreal, QC, Canada, 11–14 August 2002. [Google Scholar]
- Pelayo, G.; Sokolowski, J.H.; Lashkari, R.A. Case based reasoning aluminium thermal analysis platform for the prediction of W319 Al cast component characteristics. J. Achiev. Mater. Manuf. Eng. 2009, 36, 7–17. [Google Scholar]
- Pavlovic-Krstic, J. Impact of Casting Parameters and Chemical Composition on the Solidification Behaviour of Al-Si-Cu Hypoeutectic Alloy. Ph.D. Thesis, Universität Magdeburg, Magdeburg, Germany, 2010. [Google Scholar]
- Djurdjevic, M.B.; Sokolowski, J.H.; Odanovic, Z. Determination of dendrite coherency point characteristics using first dericative curve versus temperature. J. Therm. Anal. Calorim. 2012, 109, 875–882. [Google Scholar] [CrossRef]
- Jiang, H.; Kierkus, W.T.; Sokolowski, J.H. Determining dendrite coherency point characteristics of Al alloys using single-thermocouple technique. Trans. Am. Foundrymen’s Soc. 1999, 68, 169–172. [Google Scholar]
- Djurdjevic, M.B.; Vicario, I. Description of hypoeutectic Al-Si-Cu Alloys based on their known chemical compositions. Rev. Metal. 2013, 49, 161–171. [Google Scholar]
- Hosseini, V.A.; Shabestari, S.G. Study on the eutectic and post-eutectic reactions in LM13 aluminum alloy using cooling curve thermal analysis technique. J. Therm. Anal. Calorim. 2016, 124, 611–617. [Google Scholar] [CrossRef]
- Marchwica, P.; Sokolowski, J.H.; Kierkus, W.T. Fraction solid evolution characteristics of AlSiCu alloys - Dynamic Baseline Approach. J. Achiev. Mater. Manuf. Eng. 2011, 47, 115–136. [Google Scholar]
- Anjosa, V.; Deike, R.; Silva Ribeiro, C. The use of thermal analysis to predict the dendritic coherency point on nodular cast iron melts. Ciênc. Tecnol. Mater. 2017, 29, 27–33. [Google Scholar] [CrossRef]
- Zamarripa, R.C.; Ramos-Salas, J.A.; Talamantes-Silva, J.; Valtierra, S.; Colas, R. Determination of the dendrite coherency point during solidification by means of thermal diffusivity analysis. Met. Mater. Trans. A 2007, 38, 1875–1879. [Google Scholar] [CrossRef]
- Rana, R.S; Purohit, S.; Das, S. Reviews on the influences of alloying elements on the microstructure and mechanical properties of aluminum alloy composites. IJSRP 2012, 2, 1–7. [Google Scholar]
- Makhlouf, M.; Apelian, D.; Wang, L. Microstructures and Properties of Aluminum die Casting Alloys. 1998. Available online: http://www.osti.gov/biblio/751030 (accessed on 23 July 2018).
- Rakhmonov, J.; Timelli, G.; Bonollo, F. Characterization of the solidification path and microstructure of secondary Al-7Si-3Cu-0.3Mg alloy with Zr, V and Ni additions. Mater. Charact. 2017, 128, 100–108. [Google Scholar] [CrossRef]
- Hernandez, F.C.R.; Djurdjevic, M.B.; Kierkus, W.T.; Sokolowski, J.H. Calculation of the liquidus temperature for hypo and hypereutectic aluminum silicon alloys. Mater. Sci. Eng. A 2005, 396, 271–276. [Google Scholar] [CrossRef]
- Djurdjevic, M.B.; Francis, R.; Sokolowski, J.H.; Emadi, D.; Sahoo, M. Comparison of different analytical methods for the calculation of latent heat of solidification of 3XX aluminum alloys. Mater. Sci. Eng. A 2004, 386, 277–283. [Google Scholar] [CrossRef]
- Djurdjevic, M.B.; Tekfak, J.; Odanovic, Z. Applications de l’analysis thermique dans les fonderies d’aluminium. Fonderie 2012, 26, 31–37. [Google Scholar]


| Ref. | Si | Mg | Fe | Cu | Ni | Cr | Mn | Ti | Zn | Pb | Sn | Sr |
|---|---|---|---|---|---|---|---|---|---|---|---|---|
| [1] | 9.00 | 0.30 | 0.38 | 0.03 | 0.00 | 0.01 | 0.34 | 0.02 | 0.01 | 0.00 | 0.002 | 0.021 |
| [2] | 8.02 | 0.19 | 0.29 | 0.02 | 0.00 | 0.01 | 0.21 | 0.01 | 0.00 | 0.00 | 0.003 | 0.003 |
| [3] | 8.66 | 0.14 | 0.30 | 0.02 | 0.00 | 0.01 | 0.21 | 0.20 | 0.29 | 0.27 | 0.039 | 0.014 |
| [4] | 10.01 | 0.69 | 0.34 | 0.02 | 0.23 | 0.15 | 0.67 | 0.02 | 0.01 | 0.00 | 0.002 | 0.06 |
| [5] | 9.75 | 0.68 | 0.34 | 0.023 | 0.226 | 0.145 | 0.72 | 0.121 | 0.347 | 0.138 | 0.064 | 0.055 |
| [6] | 8.77 | 0.15 | 0.85 | 0.19 | 0.21 | 0.16 | 0.21 | 0.12 | 0.16 | 0.21 | 0.073 | 0.006 |
| [7] | 8.43 | 0.11 | 0.91 | 0.19 | 0.19 | 0.14 | 0.18 | 0.19 | 0.18 | 0.19 | 0.066 | 0.047 |
| [8] | 9.02 | 0.38 | 1.05 | 0.29 | 0.21 | 0.07 | 0.81 | 0.17 | 0.06 | 0.21 | 0.019 | 0.048 |
| [9] | 9.26 | 0.56 | 0.73 | 0.09 | 0.001 | 0.069 | 0.53 | 0.024 | 0.212 | 0.01 | 0.002 | 0.007 |
| [10] | 11.65 | 0.58 | 0.34 | 0.199 | 0.196 | 0.017 | 0.302 | 0.239 | 0.028 | 0.073 | 0.032 | 0.021 |
| [11] | 10.54 | 0.52 | 0.34 | 0.16 | 0.15 | 0.02 | 0.31 | 0.17 | 0.23 | 0.26 | 0.026 | 0.053 |
| [12] | 11.49 | 0.40 | 0.91 | 0.42 | 0.00 | 0.14 | 0.67 | 0.23 | 0.15 | 0.18 | 0.04 | 0.046 |
| [13] | 11.60 | 0.46 | 0.83 | 0.18 | 0.00 | 0.18 | 0.74 | 0.02 | 0.19 | 0.23 | 0.003 | 0.007 |
| [14] | 11.64 | 0.53 | 0.96 | 0.08 | 0.08 | 0.16 | 0.08 | 0.27 | 0.13 | 0.08 | 0.033 | 0.01 |
| [15] | 11.82 | 0.52 | 0.96 | 0.11 | 0.11 | 0.14 | 0.11 | 0.11 | 0.18 | 0.11 | 0.046 | 0.023 |
| [16] | 11.41 | 0.35 | 0.95 | 0.27 | 0.30 | 0.09 | 0.69 | 0.25 | 0.09 | 0.25 | 0.026 | 0.038 |
| [17] | 12.07 | 0.28 | 0.83 | 0.13 | 0.17 | 0.03 | 0.49 | 0.08 | 0.02 | 0.16 | 0.055 | 0.033 |
| [18] | 10.21 | 0.278 | 0.43 | 0.052 | 0.001 | 0.069 | 0.333 | 0.021 | 0.083 | 0.001 | 0.002 | 0.013 |
| [19] | 10.37 | 0.28 | 0.50 | 0.11 | 0.00 | 0.14 | 0.44 | 0.02 | 0.01 | 0.00 | 0.002 | 0.009 |
| [20] | 10.64 | 0.63 | 0.41 | 0.05 | 0.00 | 0.07 | 0.33 | 0.02 | 0.10 | 0.00 | 0.001 | 0.013 |
| [21] | 10.31 | 0.29 | 0.54 | 0.09 | 0.00 | 0.11 | 0.35 | 0.01 | 0.01 | 0.00 | 0.002 | 0.006 |
| [22] | 10.80 | 0.52 | 0.48 | 0.052 | 0.001 | 0.064 | 0.334 | 0.028 | 0.095 | 0.002 | 0.002 | 0.014 |
| [23] | 10.90 | 0.43 | 0.51 | 0.10 | 0.00 | 0.11 | 0.47 | 0.01 | 0.02 | 0.00 | 0.005 | 0.006 |
| [24] | 11.71 | 0.442 | 0.57 | 0.073 | 0.002 | 0.075 | 0.438 | 0.016 | 0.042 | 0.002 | 0.002 | 0.013 |
| [25] | 10.73 | 0.355 | 0.6 | 0.099 | 0.001 | 0.087 | 0.384 | 0.016 | 0.102 | 0.001 | 0.002 | 0.009 |
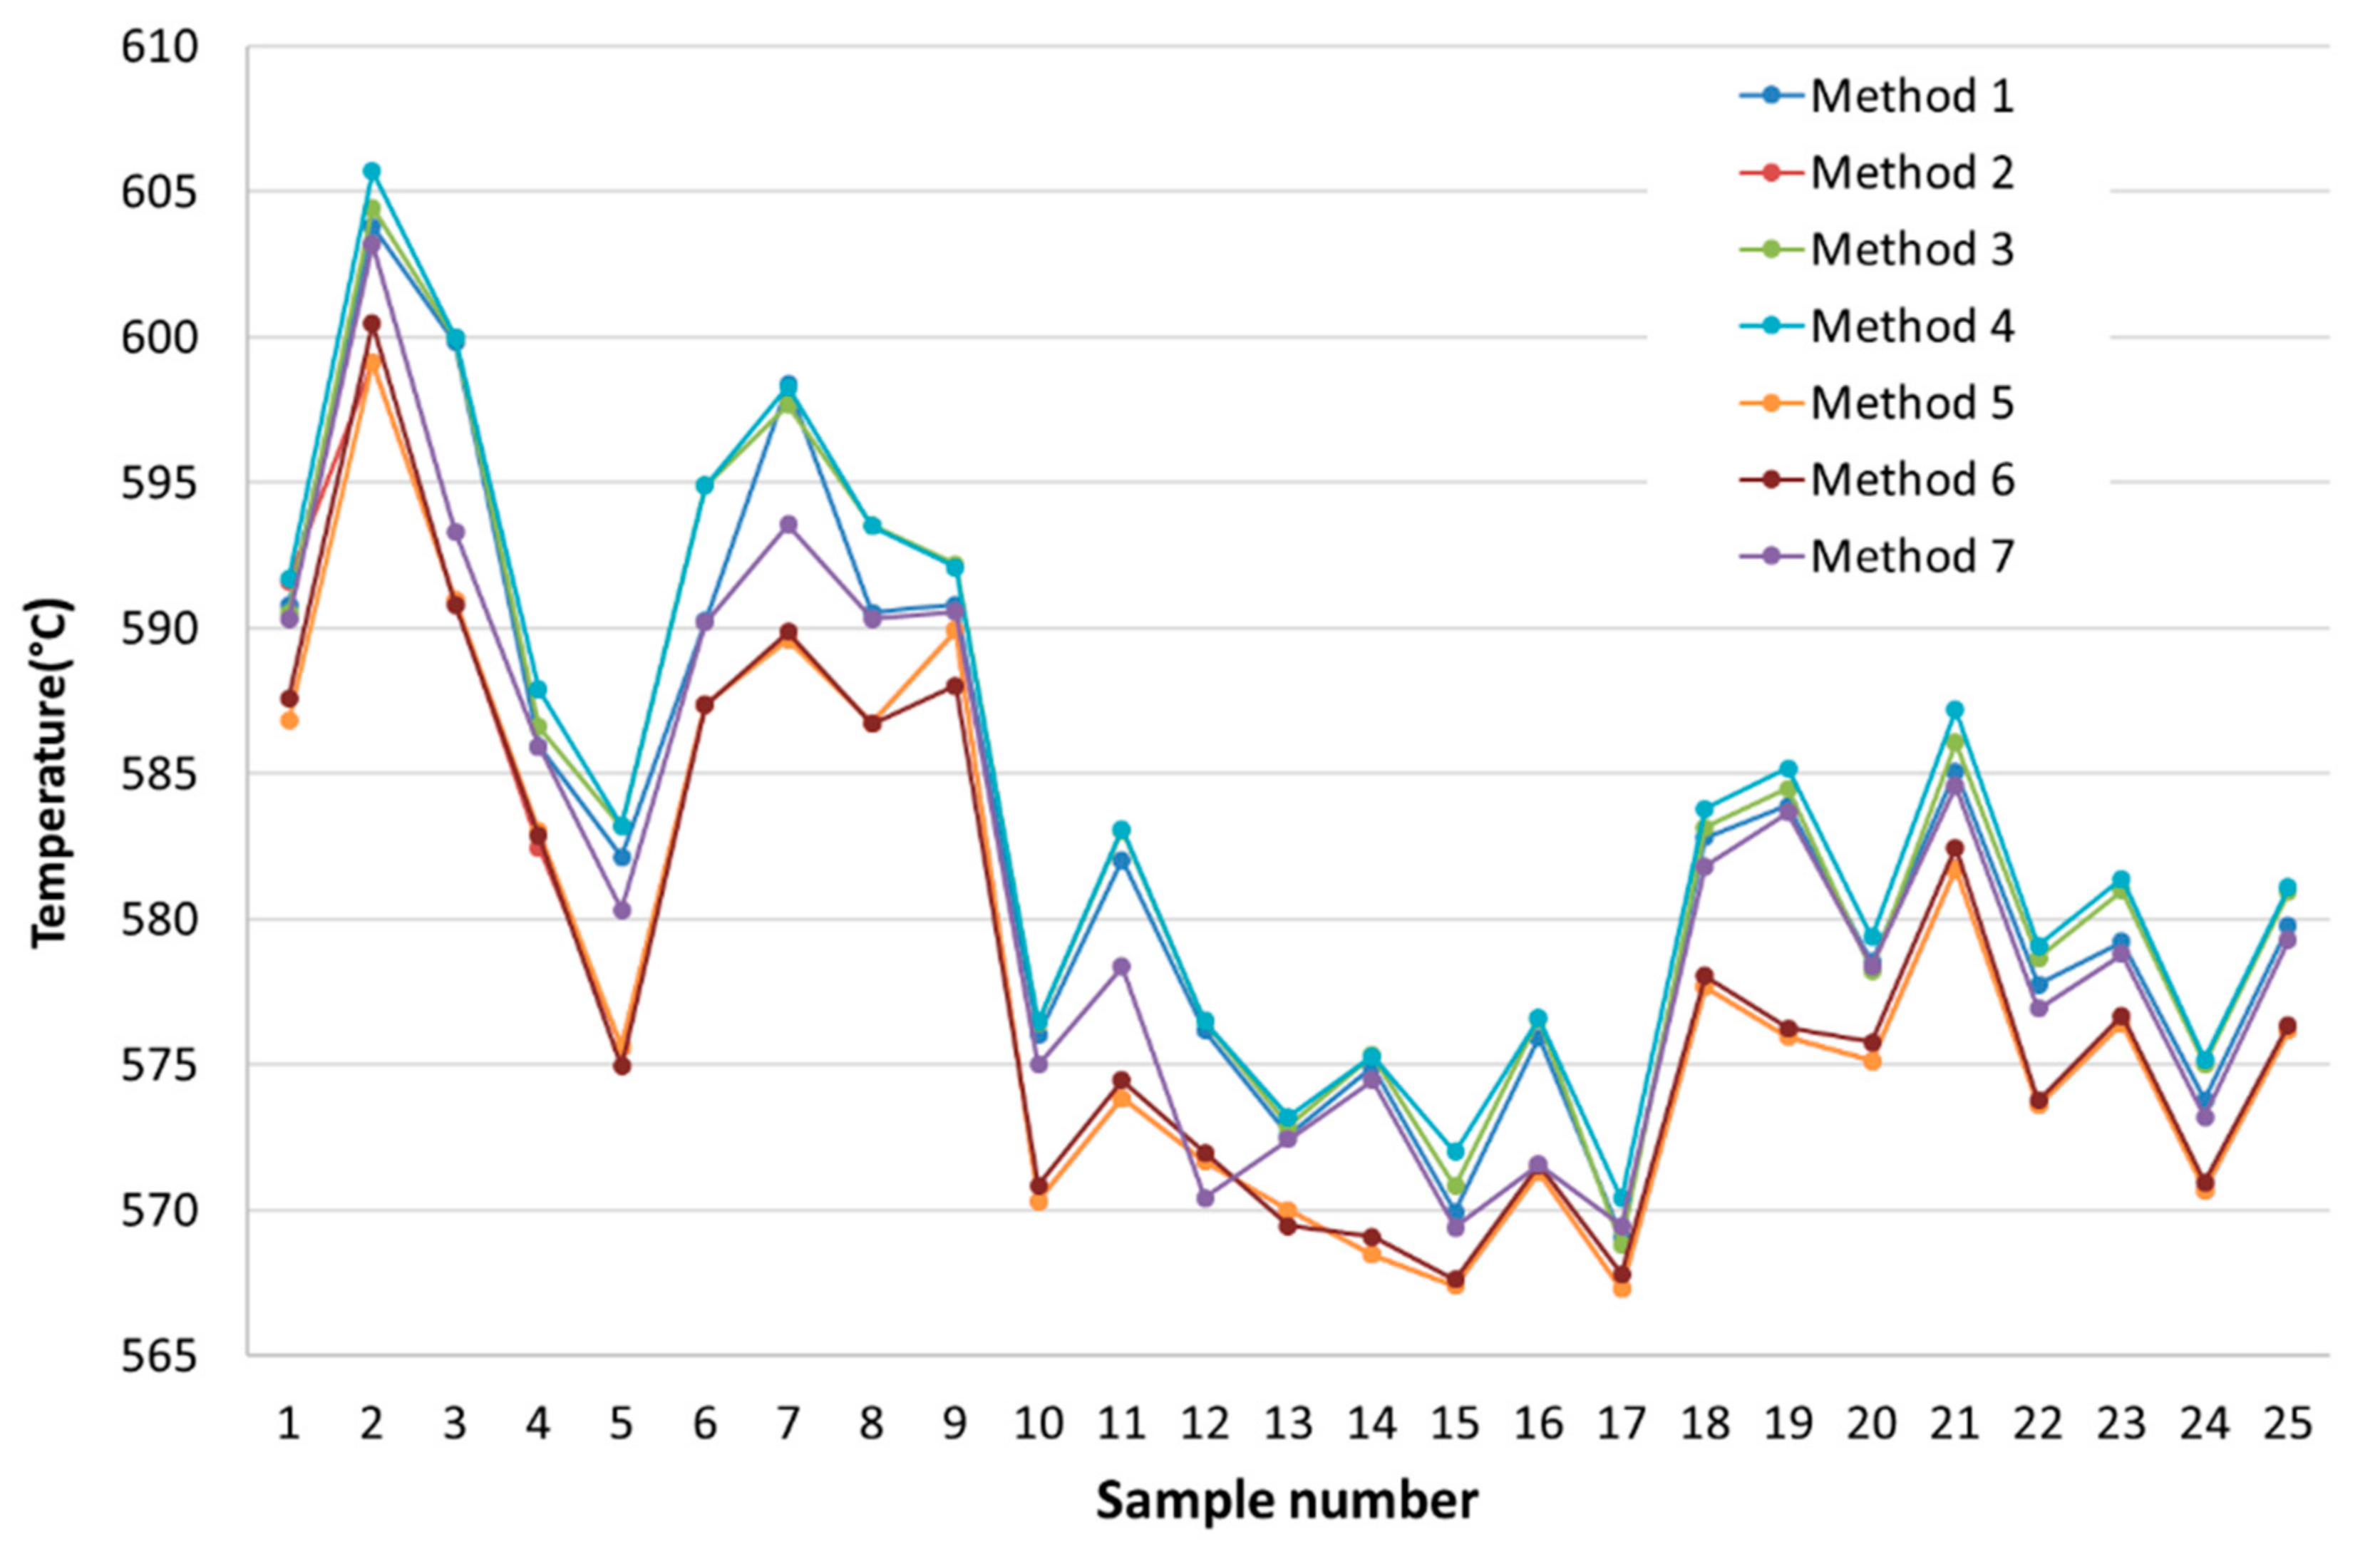
| Ref. | Method 1 | Method 2 | Method 3 | Method 4 | Method 5 | Method 6 | Method 7 |
|---|---|---|---|---|---|---|---|
| [1] | 590.8 | 591.6 | 590.54 | 591.7 | 586.82 | 587.6 | 590.29 |
| [2] | 603.8 | 599.12 | 604.46 | 605.7 | 599.12 | 600.47 | 603.2 |
| [3] | 599.82 | 590.98 | 599.98 | 600.0 | 590.975 | 590.8 | 593.31 |
| [4] | 585.94 | 582.47 | 586.60 | 587.9 | 583.03 | 582.875 | 585.93 |
| [5] | 582.14 | 575.61 | 583.19 | 583.2 | 575.605 | 574.945 | 580.32 |
| [6] | 590.25 | 587.38 | 594.89 | 594.9 | 587.375 | 587.37 | 590.2 |
| [7] | 598.39 | 589.62 | 597.68 | 598.3 | 589.615 | 589.865 | 593.57 |
| [8] | 590.55 | 586.74 | 593.53 | 593.5 | 586.74 | 586.72 | 590.33 |
| [9] | 590.8 | 589.92 | 592.19 | 592.1 | 589.92 | 588.03 | 590.56 |
| [10] | 576.01 | 570.32 | 576.46 | 576.5 | 570.32 | 570.865 | 575.01 |
| [11] | 582.04 | 573.85 | 583.05 | 583.1 | 573.85 | 574.46 | 578.385 |
| [12] | 576.17 | 571.68 | 576.50 | 576.5 | 571.68 | 571.97 | 570.425 |
| [13] | 572.58 | 570.01 | 572.89 | 573.2 | 570.005 | 569.46 | 572.44 |
| [14] | 574.91 | 568.47 | 575.32 | 575.3 | 568.47 | 569.085 | 574.465 |
| [15] | 569.96 | 567.4 | 570.84 | 572.0 | 567.395 | 567.615 | 569.405 |
| [16] | 575.94 | 571.3 | 576.59 | 576.6 | 571.3 | 571.54 | 571.585 |
| [17] | 569.09 | 567.29 | 568.79 | 570.4 | 567.29 | 567.82 | 569.455 |
| [18] | 582.8 | 577.69 | 583.16 | 583.8 | 577.69 | 578.05 | 581.815 |
| [19] | 583.92 | 575.97 | 584.49 | 585.2 | 575.965 | 576.27 | 583.675 |
| [20] | 578.54 | 575.14 | 578.23 | 579.4 | 575.14 | 575.77 | 578.4 |
| [21] | 585.08 | 581.73 | 586.08 | 587.2 | 581.725 | 582.465 | 584.585 |
| [22] | 577.77 | 573.61 | 578.67 | 579.1 | 573.61 | 573.78 | 576.92 |
| [23] | 579.22 | 576.42 | 580.98 | 581.4 | 576.415 | 576.7 | 578.795 |
| [24] | 573.8 | 570.7 | 575.04 | 575.2 | 570.695 | 570.975 | 573.2 |
| [25] | 579.75 | 576.17 | 580.93 | 581.1 | 576.17 | 576.36 | 579.27 |
| Meth. | Si | Mg | Fe | Cu | Ni | Cr | Mn | Ti | Zn | Pb | Sn | Sr |
|---|---|---|---|---|---|---|---|---|---|---|---|---|
| 1 | 13.57 | 1.17 | 1.22 | 0.39 | 0.79 | 0.6 | 0.18 | 2.65 | 0.56 | 0.16 | 1.42 | 0.4 |
| 2 | 11.95 | 0.57 | 0.99 | 0.35 | 1.02 | 1.17 | 0.51 | 0.37 | 1.45 | 0.42 | 0.03 | 0.61 |
| 3 | 14.23 | 0.6 | 1.2 | 0.37 | 0.07 | 0.69 | 0.2 | 1.97 | 0.58 | 0.32 | 1.18 | 0.85 |
| 4 | 14.09 | 0.42 | 1.11 | 0.2 | 0.35 | 0.67 | 0.51 | 1.44 | 1.09 | 0.6 | 0.87 | 0.37 |
| 5 | 10.65 | 0.4 | 0.67 | 0.08 | 0.52 | 0.69 | 0.4 | 0.3 | 1.01 | 0.29 | 0.19 | 0.8 |
| 6 | 11.16 | 0.38 | 0.45 | 0.08 | 0.72 | 0.64 | 0.04 | 0.38 | 1.54 | 0.52 | 0.15 | 0.57 |
| 7 | 15.45 | 0.56 | 0.1 | 0.94 | 0.39 | 0.37 | 0.11 | 1.19 | 2.01 | 0.57 | 0.58 | 1.18 |
© 2018 by the authors. Licensee MDPI, Basel, Switzerland. This article is an open access article distributed under the terms and conditions of the Creative Commons Attribution (CC BY) license (http://creativecommons.org/licenses/by/4.0/).
Share and Cite
Gómez, I.V.; Viteri, E.V.; Montero, J.; Djurdjevic, M.; Huber, G. The Determination of Dendrite Coherency Point Characteristics Using Three New Methods for Aluminum Alloys. Appl. Sci. 2018, 8, 1236. https://doi.org/10.3390/app8081236
Gómez IV, Viteri EV, Montero J, Djurdjevic M, Huber G. The Determination of Dendrite Coherency Point Characteristics Using Three New Methods for Aluminum Alloys. Applied Sciences. 2018; 8(8):1236. https://doi.org/10.3390/app8081236
Chicago/Turabian StyleGómez, Iban Vicario, Ester Villanueva Viteri, Jessica Montero, Mile Djurdjevic, and Gerhard Huber. 2018. "The Determination of Dendrite Coherency Point Characteristics Using Three New Methods for Aluminum Alloys" Applied Sciences 8, no. 8: 1236. https://doi.org/10.3390/app8081236
APA StyleGómez, I. V., Viteri, E. V., Montero, J., Djurdjevic, M., & Huber, G. (2018). The Determination of Dendrite Coherency Point Characteristics Using Three New Methods for Aluminum Alloys. Applied Sciences, 8(8), 1236. https://doi.org/10.3390/app8081236