Effect of Surface Roughness on Ultrasonic Testing of Back-Surface Micro-Cracks


State Key Lab of Digital Manufacturing Equipment and Technology, Huazhong University of Science and Technology, Wuhan 430074, China
*
Author to whom correspondence should be addressed.
Appl. Sci. 2018, 8(8), 1233; https://doi.org/10.3390/app8081233
Submission received: 4 July 2018
/
Revised: 20 July 2018
/
Accepted: 24 July 2018
/
Published: 26 July 2018
(This article belongs to the Section Acoustics and Vibrations)
Abstract
:Featured Application
Effect of surface roughness on ultrasonic detection capacity of microcracks was investigated by simulation and experiment, this evaluated method provided a valuable reference for obtaining detection limits of micro-cracks under different rough surfaces.
Abstract
Surface roughness is one of the main factors that affect the ultrasonic testing of micro-cracks. This article theoretically analyzes the relationship between the changes in the energy intensity of crack echo waves and roughness-modified transmission coefficients. A series of simulations are carried out using two-dimensional sinusoidal curves as rough surface. Then, parallel experiments are performed on sample surfaces with different arithmetic average heights (Ra). The signal amplitude ratio factor (SARF) is defined to assess the ultrasonic detection capacity for micro-cracks. Both finite element analysis and experimental results show that signal amplitude decreases with an increase in Ra, resulting in signal-to-noise ratio loss. Amplitude attenuation caused by the rough back surface is less than that caused by the rough front surface. It is difficult to identify the signal of micro-cracks with a depth less than 400 μm when the Ra of the front surface is larger than 15 μm. Cracks with depths of more than 200 μm can be distinguished when the back-surface roughness is less than 24 μm. Furthermore, the amplitude of the micro-crack signal increases slightly with variation in the horizontal parameter (Rsm). This study provides a valuable reference for the precision evaluation of micro-cracks using ultrasonic inspection.
1. Introduction
The detection of surface corrosion defects and fatigue cracks is important in the petrochemical and infrastructure industries [1,2]. Lack of timely and accurate assessment of these forms of distortion can eventually lead to either leakage or explosion, with potential financial and environmental consequences [3]. Ultrasonic testing is a common nondestructive testing technique carried out to reduce the risk of accidents. Inspections using ultrasound are often carried out in water baths and the pulsed acoustic beams launched by transducer are incident to the liquid-solid interfaces. The crack size is generally considered to be much larger than the geometry of irregular microstructures of the surface. The surfaces of workpieces are assumed to be perfectly smooth in previous theoretical analyses and in practical application [4,5,6]. However, when the size of the micro-crack is of the same order of magnitude as that of the microscopic surface fluctuation, wave scattering on the rough surface dramatically alters the shape of the received signal of the micro-crack [7,8]. Therefore, understanding and accurately predicting the effect of surface roughness on the detection capacity of micro-cracks is the primary concern behind the work presented in this paper.
Elastic wave scattering characteristics on rough surfaces can be scientifically identified and described [9,10]. A variety of analytical models involving reflection and transmission waves such as the phase perturbation approximation [11,12,13] and Kirchhoff theory [14,15,16,17,18], have been developed to understand the scattered fields of different scatterers. Thorsos explored the validity of the perturbation approximation for rough surface scattering using a Gaussian roughness spectrum [19]. Ogilvy discussed Kirchhoff approximation theory to estimate the complicated effects of wave scattering on rough defects [20,21,22]. Fan and Lowe introduced theoretical formulae for diffuse fields of elastic waves on random rough solid-solid interfaces using the Kirchhoff approximation [23]. However, there is a consensus that none of the analytical models—which are based on mathematical assumptions—can describe rough surface scattering with a full solution, especially for some complex defect geometries. The finite element model (FEM) was used to accurately solve the problem of elastic wave scattering [24,25,26,27]. This numerical method was used to measure the thickness distribution of corrosion surfaces [28,29] and to analyze rough crack scattering [30,31]. Many factors must be considered when ultrasonic testing for a crack scatterer is discussed, including incident frequency, transducer location, and the noise induced by backscatter of ultrasound from the microstructure. This investigation focuses primarily on the effects of surface roughness while other factors remain unchanged.
In this work, the relationship between changes in ultrasound wave energy intensity for micro-crack detection and the roughness-modified transmission and reflection coefficients is briefly introduced. An ultrasonic simulation model used for detailed analysis is presented in Section 3. Two-dimensional sinusoidal curves are used to represent rough surface fluctuation. The signal-to-noise ratio loss of crack pulse-echo and signal distortion of micro-crack at different surface roughnesses Ra and Rsm are analyzed significantly. In Section 4, a number of experiments are designed to verify the effect of rough front surface and rough back surface. The results from experimental measurements are compared to theoretical analyses and simulations. An accurate description of the detection capacity of micro-cracks is obtained. Section 5 contains a brief conclusion.
2. Background
2.1. Surface Roughness
Most industrial ultrasonic inspections involve reflection and transmission on coupled interfaces. The states of most surfaces of workpieces are by definition rough while considering the irregular microstructures of macroscopic scale workpiece surfaces. For example, the micro irregular texture characteristics caused by different processing methods normally appear on the surfaces of workpieces during manufacturing, such as convex, groove, and scratches. These characteristics directly affect the performance and life of the machine and instrument. Metal cooling and solidification of cast parts generate rough surfaces. Surface roughness is a comprehensive evaluation parameter for micro-sizes of machined surfaces. It is therefore necessary to characterize the state of a rough surface by a set of common surface statistic parameters. Then, any surface condition can be assigned to a statistical class.
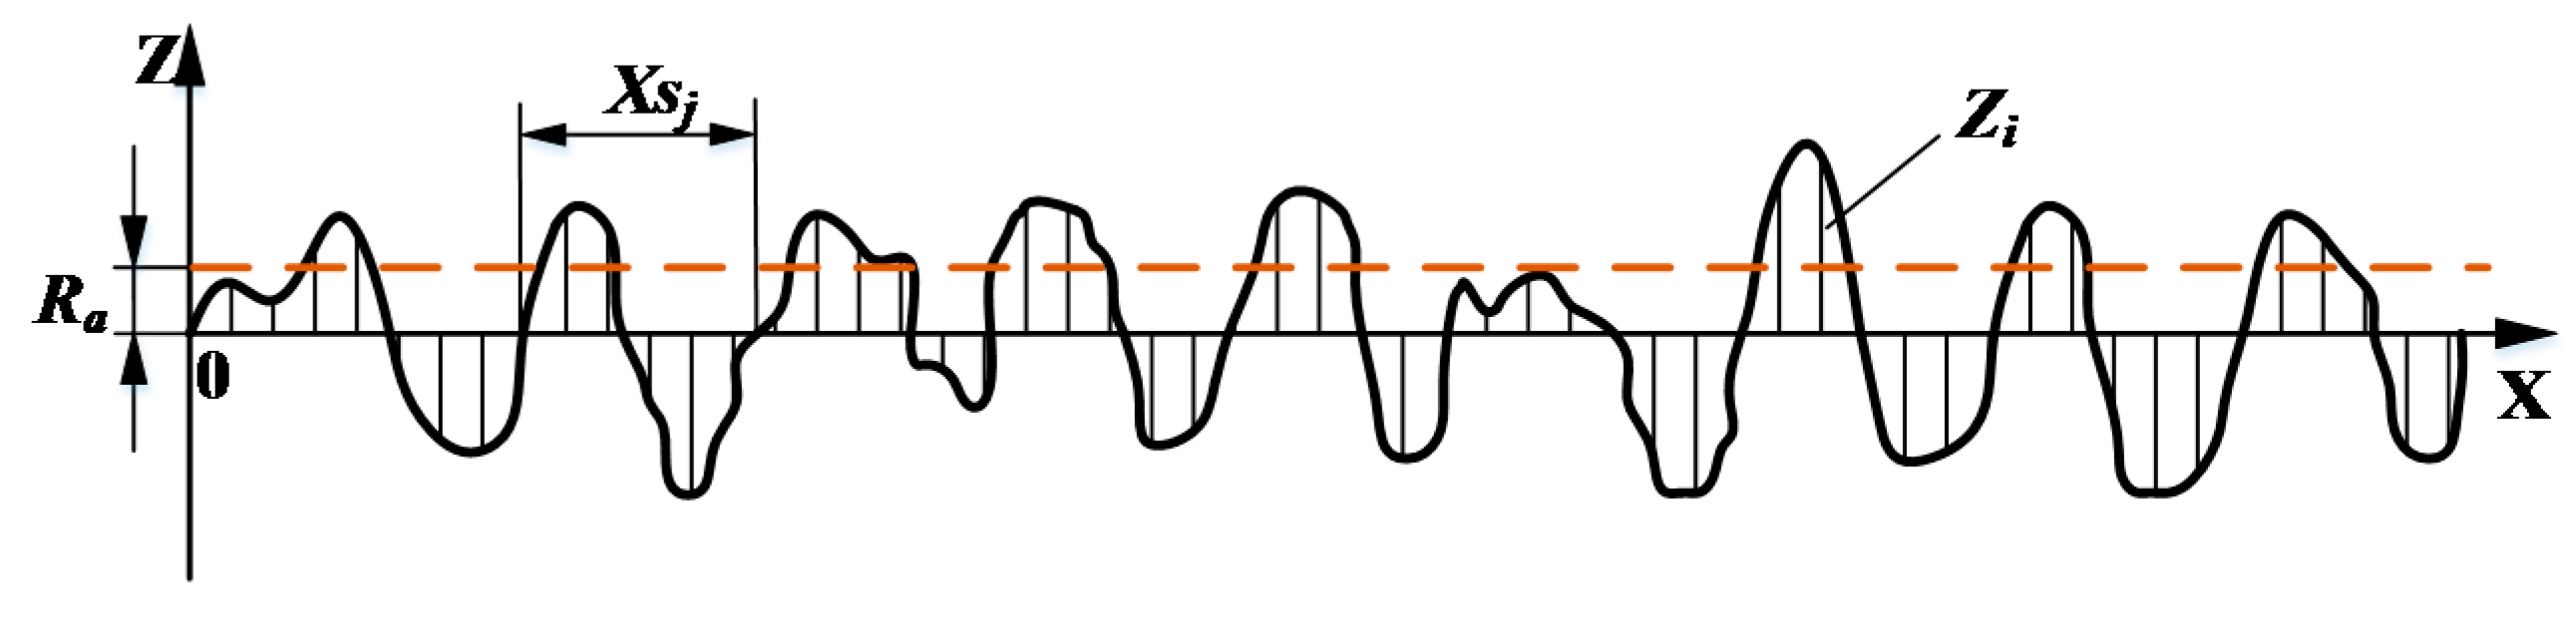
A considerable number of reports deal with different methods of numerically generating rough surface shapes, and a statistical characteristic is adopted here. As can be seen in Figure 1, the variation in height of the two-dimensional surface profile is defined in the z-axis and the shape of rough surface fluctuation is given along the x-axis. Ra corresponds to vertical deviation of the surface from the mean plane and reflects the arithmetic average height parameter [32,33]. The two-dimensional model used to represent the rough surface is spatially discretized and the discretized equivalent is given by:
where m is the number of sampling points, i represents incremental changes along the x-axis, and Zi represents the height of a single discrete point on the surface, as shown in Figure 1. The second parameter, Rsm, is used to describe the characteristics along the surface in the horizontal direction (x-axis). A series of normally distributed discretized intervals is used to define Rsm [34]:
where n represents the number of profile elements and j represents incremental changes along the x-axis. Xsj is the spacing length of a profile element. It can be seen that Rsm represents the spacing length between two points on the mean plane, and it is set as an isotropic correlation length. The parameters Ra and Rsm are widely used in the machining process for general quality control and other fields for surface quality assessment. The statistical characteristics described in this manner can be related to the wave scattering behavior.
2.2. Scattering from Rough Surface
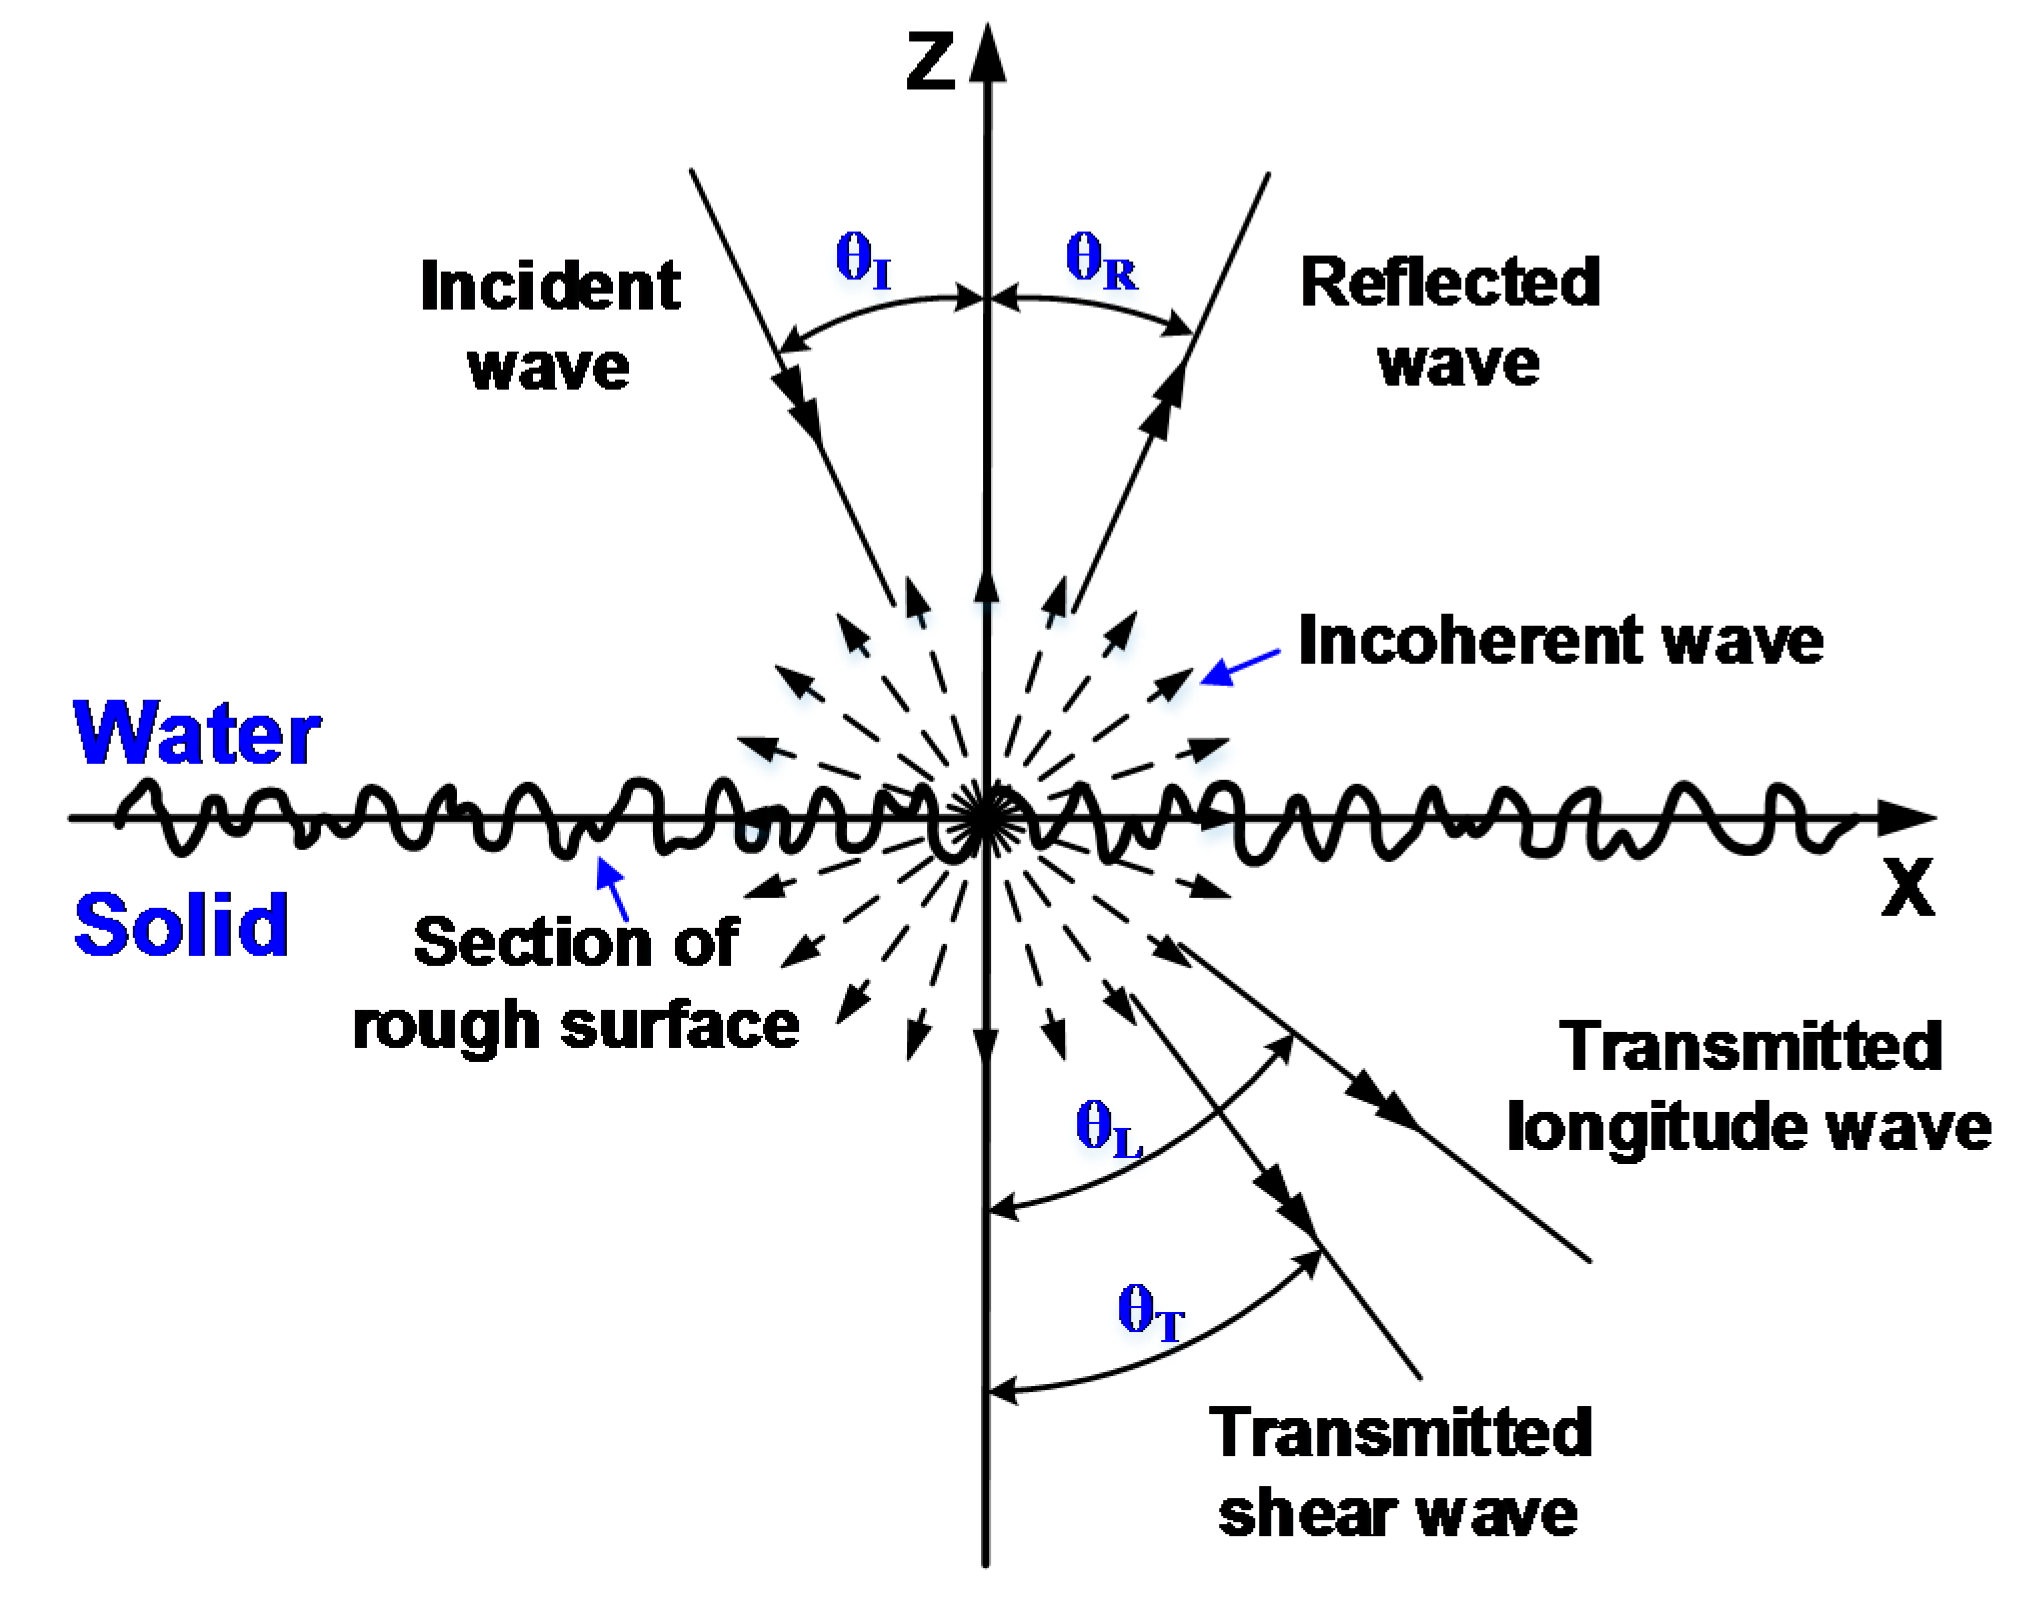
Coherent and incoherent acoustic waves are generated by the interaction of an incident wave with a randomly rough liquid-solid interface, as shown in Figure 2 [12]. Coherent waves propagate in the direction determined by Snell’s law, including a specularly reflected wave and transmitted shear and longitudinal waves. Characterization of the phases and magnitudes of coherent waves are affected by surface roughness. The incoherent waves are random components of the received ultrasonic signal, which correspond to random fluctuations of the rough surface.
Even though the transmitted wave contains only a small fraction of the incident acoustic energy after mode conversion and scattering through the rough interface, it still plays a key role in the inspection of micro-cracks in subsurface regions. It is therefore necessary to obtain the reflection and transmission coefficients of coherent waves at oblique incident angles. Nagy and Rose indicated that surface roughness simultaneously randomized the phase and degraded the magnitude of transmitted waves. The literature offers simple formulae of reflection and transmission coefficients described by the phase-screen approximation [12]. The results were based on the fact that the exponential change in phase determined variations in coefficients while the amplitude was only a proportional prefactor. The rough surface performed as a phase perturbation screen and the approximation describes the total wave fields inside the liquid and the solid.
2.3. Detection of Back-Surface Crack with Rough Surface
A general schematic diagram for the ultrasonic detection of micro-crack with rough surface is shown in Figure 3a. A pressure wave generated from the immersed ultrasonic-focused transducer is obliquely incident on the rough front surface of the workpiece. Generally, there are only transmitted shear waves inside the solid that improve detection accuracy and sensitivity. The oblique incident angle is therefore set as 17°, which is located between the first critical angle and second critical angle. Since the wavelength of shear wave is about half the wavelength of the longitudinal wave at the same low frequency, the influence of surface roughness on detection sensitivity of the shear wave is more serious than that of the longitudinal wave. Currently, in terms of the industrial ultrasonic testing system for steel pipes, it is difficult to detect micro-cracks of depth less than 5% of the wall thickness for pipes with large surface roughnesses. On the other hand, there is a possibility for inner and outer walls of steel pipe, such as hot-rolled steel pipes changing to rough surfaces that are rougher than bearing steel pipes. In these cases, incoherent waves scattering in all directions are generated when a longitudinal wave interacts with the rough surface. This leads to significant attenuation of energy intensity of the transmitted shear wave and severe degradation of amplitude of the micro-crack signal.
To further analyze the transmitting process of acoustic wave for micro-crack detection when the front surface and back surface are both rough, Figure 3b performs energy intensity changes of acoustic waves at different stages. The transmission coefficients T1 and T2 are modified by surface roughness [12]. The reflection coefficient R1 reflects the interaction of transmitted shear wave with the micro-crack and rough back surface. Considering absorption attenuation and scattering attenuation caused by the backscatter of microstructures inside the solid, the relationship between I0 and I5 can be simply given by:
where δ is the attenuation coefficient and x represents the propagation distance of the acoustic wave in the solid. For steel plate with uniform thickness, the absorption attenuation and scattering attenuation remain unchanged. It can be seen that the energy intensity of the crack echo is mainly related to the transmission and reflection coefficients. When the frequency is unchanged, the reflection coefficient depends on the size of micro-crack and back-surface roughness. The transmission coefficients are exponentially affected by the surface roughness Ra according to the phase-screen approximation. To further confirm the results of theoretical analysis, simulation and experimental studies are described in the following sections.
3. Simulation and Analyses
3.1. Two-Dimensional Rough Surface Model Setup
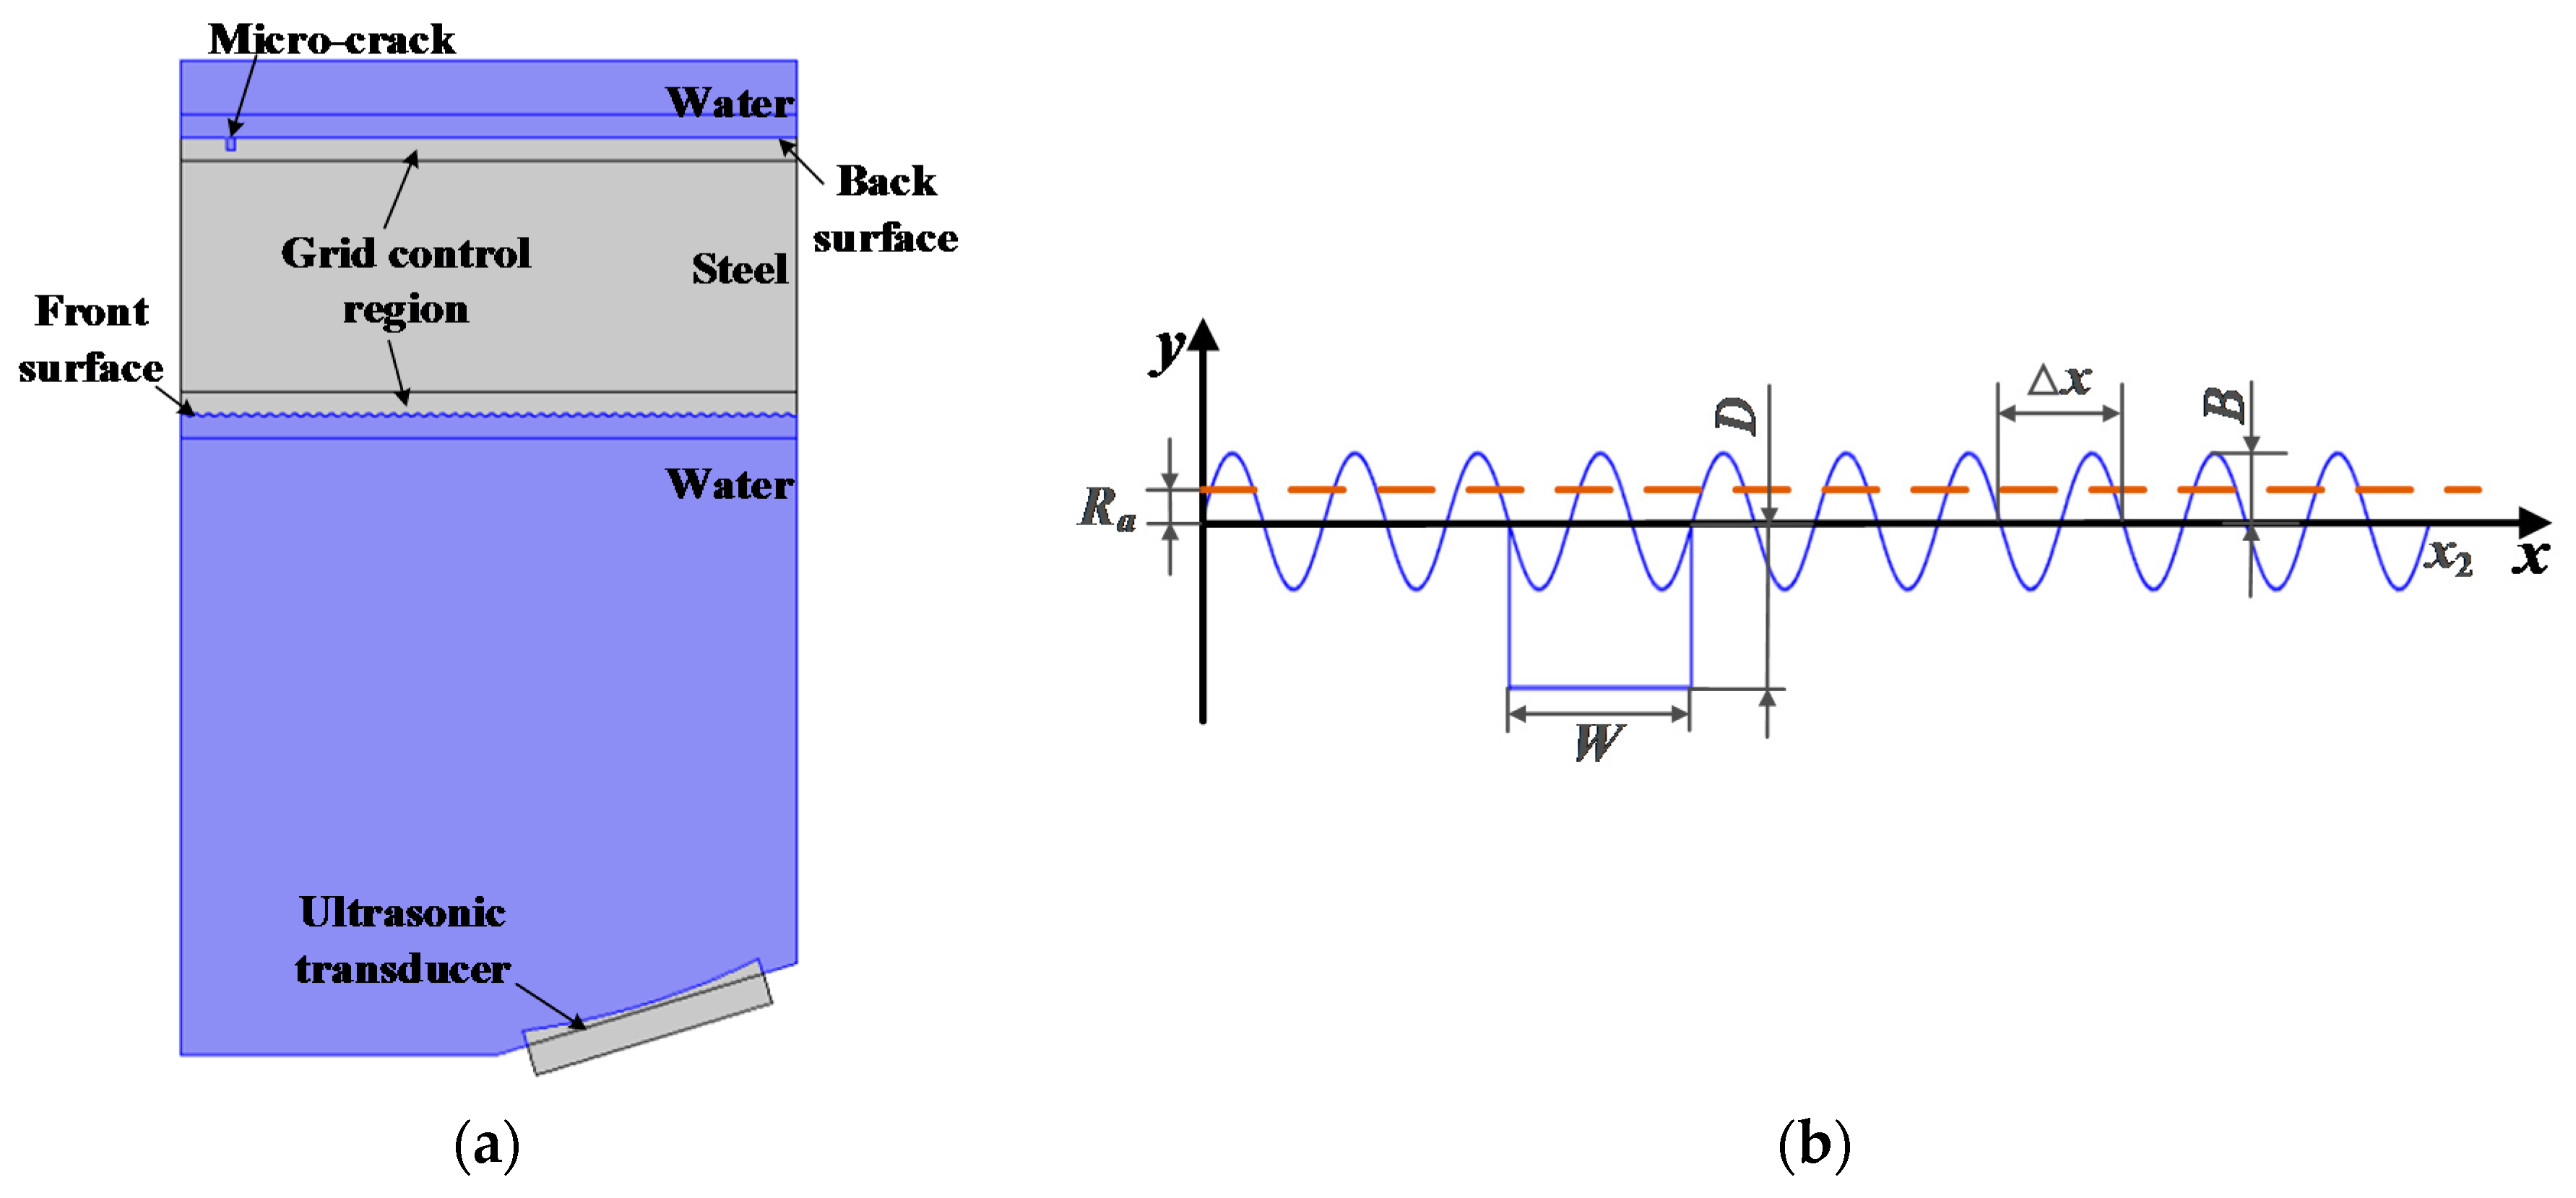
Finite element simulation is an effective method for studying ultrasonic detection, which involves multi-physics coupled field. A two-dimensional rough surface model is developed with commercial software (COMSOL Multiphysics 5.2a), as shown in Figure 4a. It is used to analyze the relationship between the surface roughness parameters (Ra and Rsm) and time-domain signal of micro-crack. The model consists of a virtual focused transducer, coupled water, and a 9 mm thick steel plate with a back-surface micro-crack. The depth of the micro-crack is normally less than five percent of the wall thickness of the workpiece. The focused transducer, formed by a piezoelectric wafer and arc lens, has chord length of 8 mm and curvature radius 25 mm. It is at a stand-off distance of 20 mm from the front surface of the steel plate. The material properties used in the model are obtained from the material library of the software. The longitude wave velocity in water is 1480 m/s and shear wave velocity in steel is 3230 m/s. The excitation signal applied to the external circuit is a broadband modulated pulse, which can be modeled as a Gabor function [35]:
where A is the reference amplitude and center frequency of the transducer is set to 5 MHz. and correspond to the translation and standard deviation of Gaussian function.
The liquid-solid interfaces, including the front surface and back surface and the arc lens surface in the model, are set to be acoustic-structure coupling boundaries. Other boundaries are set to be radiation boundaries in the water region and low reflection boundaries in the steel region. The grid control region is used to mesh the refined grid to improve calculation accuracy. The grid density is set to 8 elements per wavelength in the control region and 6 elements per wavelength in the other region. The simulation study is carried out with the transient analysis module. The temporal resolution is set to 20 time steps per period of the acoustic wave. The time domain signals are captured using the sampling time interval Δt = 0.01 μs. This study is on the rough surface, and a surface with sinusoidal curves is used to model the rough surface [7,28]. Amplitude and wavelength of the curves are used to describe the arithmetic average heights and the horizontal parameter. Figure 4b shows a partial view of the sinusoidal surface with different Ra and Rsm. The mathematical expression corresponding to the roughness parameters in the model can be described as:
where represents the end of the rough interface and corresponds to Rsm. Half of the amplitude B of the sinusoid is chosen to be of similar extent to Ra. In addition, W represents the width of the crack and D represents the crack depth.
3.2. Verification of the Micro-Crack Signal on the Rough Surface
Several simulations were conducted to demonstrate the significant degradation of the signal-to-noise ratio under the influence of surface roughness. As an example, the front surface is the rough surface while the micro-crack is on the smooth back surface. The depth of the crack is 400 μm, and width 250 μm. The front-surface roughness Ra is 25 μm and Rsm 400 μm. Figure 5 shows the propagation of the acoustic wave for ultrasonic detection of micro-crack. The coherent and incoherent waves caused by the interaction of the incident wave with the rough interface are shown in Figure 5a–c. It can be seen clearly that the reflected wave beam from the rough coupled interface inside water is no longer focused. The incoherent wave inside the solid is scattered in all directions. Figure 5d shows that the energy intensity of the reflected wave from the crack reduces significantly. The pulse-echo of the crack transmits from the rough solid-water interface. The energy intensity further weakens because of multiple scattering, as shown in Figure 5e,f. The phenomenon agrees with the previous analysis.
Figure 6 shows several raw A-scan signals acquired from the simulation models. The size of micro-cracks on the smooth back surface in the models is the same as that in Figure 5. The roughnesses Ra on the front surface are set to 3.2 μm, 12.5 μm, and 25 μm, respectively. The signals at the center correspond to the micro-crack, as shown in Figure 6a. The noise signals occurring elsewhere are attributed to scattering from the rough surface. Figure 6b,c show the echo received from rougher surfaces; the amplitude of the crack signal decreases with increase in Ra. When the front surface roughness Ra is 25 μm, the signal of the crack becomes nearly indistinguishable from the noise (Figure 6a). The reflected wave signals obtained from the front surface get wider with increase in Ra due to scattering in different directions. Figure 6d presents the reference signal when no micro-crack is on the rough back surface, and there is no apparent micro-crack signal (Figure 6c). The results correspond to previous analyses that the energy intensity of transmitted wave reduces because of multiple scattering. Furthermore, the amplitude of the noise signal increases slightly. Therefore, the signal-to-noise of the micro-crack signal degrades significantly with rougher surface.
The surface roughness-induced attenuation of the coherent reflected longitudinal wave and transmitted shear wave are characterized by the time-domain signal distortion of the micro-crack. It is necessary to distinguish the characteristics between the micro-crack signal and noise signal. For most ultrasonic nondestructive testing equipment, accurate identification of the crack mainly depends on the signal-to-noise ratio of the pulse-echo signal. A scalar parameter SARF is defined as the signal amplitude ratio factor to clearly demonstrate the signal-to-noise ratio. SARF can be expressed as:
where is the maximum amplitude of the echo signal of the crack and is the maximum amplitude of the noise signal, as shown in Figure 6b. and are mean amplitudes of the crack echo signal and noise signal, respectively, obtained from multiple simulations or measurements. As can be seen, when SARF approaches 1, the crack signal is completely immersed in the noise signal. For most industrial ultrasonic inspections, SARF is set to be greater than 3.16 to characterize the detection capacity of micro-cracks, which means the signal-to-noise ratio is larger than 10 dB.
3.3. Micro-Crack Signal Assessment under the Effect of Front-Surface Ra
To further validate the effect of reflected and transmitted attenuations caused by rough surface on micro-crack ultrasonic detection, micro-cracks 100 μm to 400 μm deep were first selected for ultrasonic simulation. For better contrast, the front surface was rough while the back surface was smooth. The horizontal direction parameter Rsm of the rough surface was set to 300 μm, width of the crack was 250 μm, and Ra changed from 0 to 25 μm. For the surface with determined Ra and Rsm, multiple simulations were performed and amplitudes of micro-cracks were averaged. Figure 7a shows that the mean amplitudes of crack signals decrease with an increase in Ra for micro-cracks with different depths. It can be seen that the mean amplitudes increase obviously when the crack depth changes from 100 μm to 200 μm. The trend remains almost unchanged as the depth increases from 200 μm to 400 μm. Meanwhile, the mean amplitudes of crack signals tend to be the same when Ra is larger than 15 μm.
The SARF critical solid line that represents the critical value 3.16 is displayed in Figure 7b. It can be seen that the signal-to-noise ratio of the crack increases with depth and SARF gets smaller as Ra increases. The significant decrease of SARF from Ra 12.5 µm is mainly caused by two aspects. On one hand, the amplitude of the echo signal drops significantly for cracks with different depths, as shown in Figure 7a. On the other hand, the mean amplitude of noise signal is nearly doubled compared to that of Ra 6.3 µm. The SARF tends to be less than the critical value when Ra is larger than 15 μm, which means that it is difficult to distinguish useful crack signals. Additionally, the smaller depth of micro-crack corresponds to a smaller SARF critical value because the depth of the micro-crack is close to the order of magnitude of the height of the rough surface and the scattering attenuation becomes more serious, as described in the previous section.
3.4. Micro-Crack Signal Assessment under the Effect of Back-Surface Ra
Figure 8a shows the non-linear change trend of mean amplitudes of micro-cracks caused by different depth cracks and different roughnesses Ra with a rough back surface. Rsm and size of crack parameters are the same as in Section 3.3 while the front surface is smooth. Compared to the influence of a rough front surface, the mean amplitudes of cracks drop more slowly with a rough back surface. According to the analysis in Section 2.2, there is only reflected attenuation caused by back-surface roughness for corner reflection wave of the crack while both reflected and transmitted attenuations exist when the ultrasound wave passes through the rough front surface. The relationship between SARF and Ra is displayed in Figure 8b, and the procedure for calculation is the same as that in Section 3.3. It can be seen that the SARF critical values corresponding to micro-cracks with depths 100 μm, 150 μm, and 200 μm, are 8.5 μm, 15.8 μm, and 24 μm, respectively. This means that it can be accurately identified when the depth of the micro-crack on the rough back surface is larger than 200 μm. On the other hand, the smaller the size of the micro-crack on the rough surface, the greater the effect of Ra becomes on ultrasonic detection.
3.5. Micro-Crack Signal Assessment under the Effect of Roughness Rsm
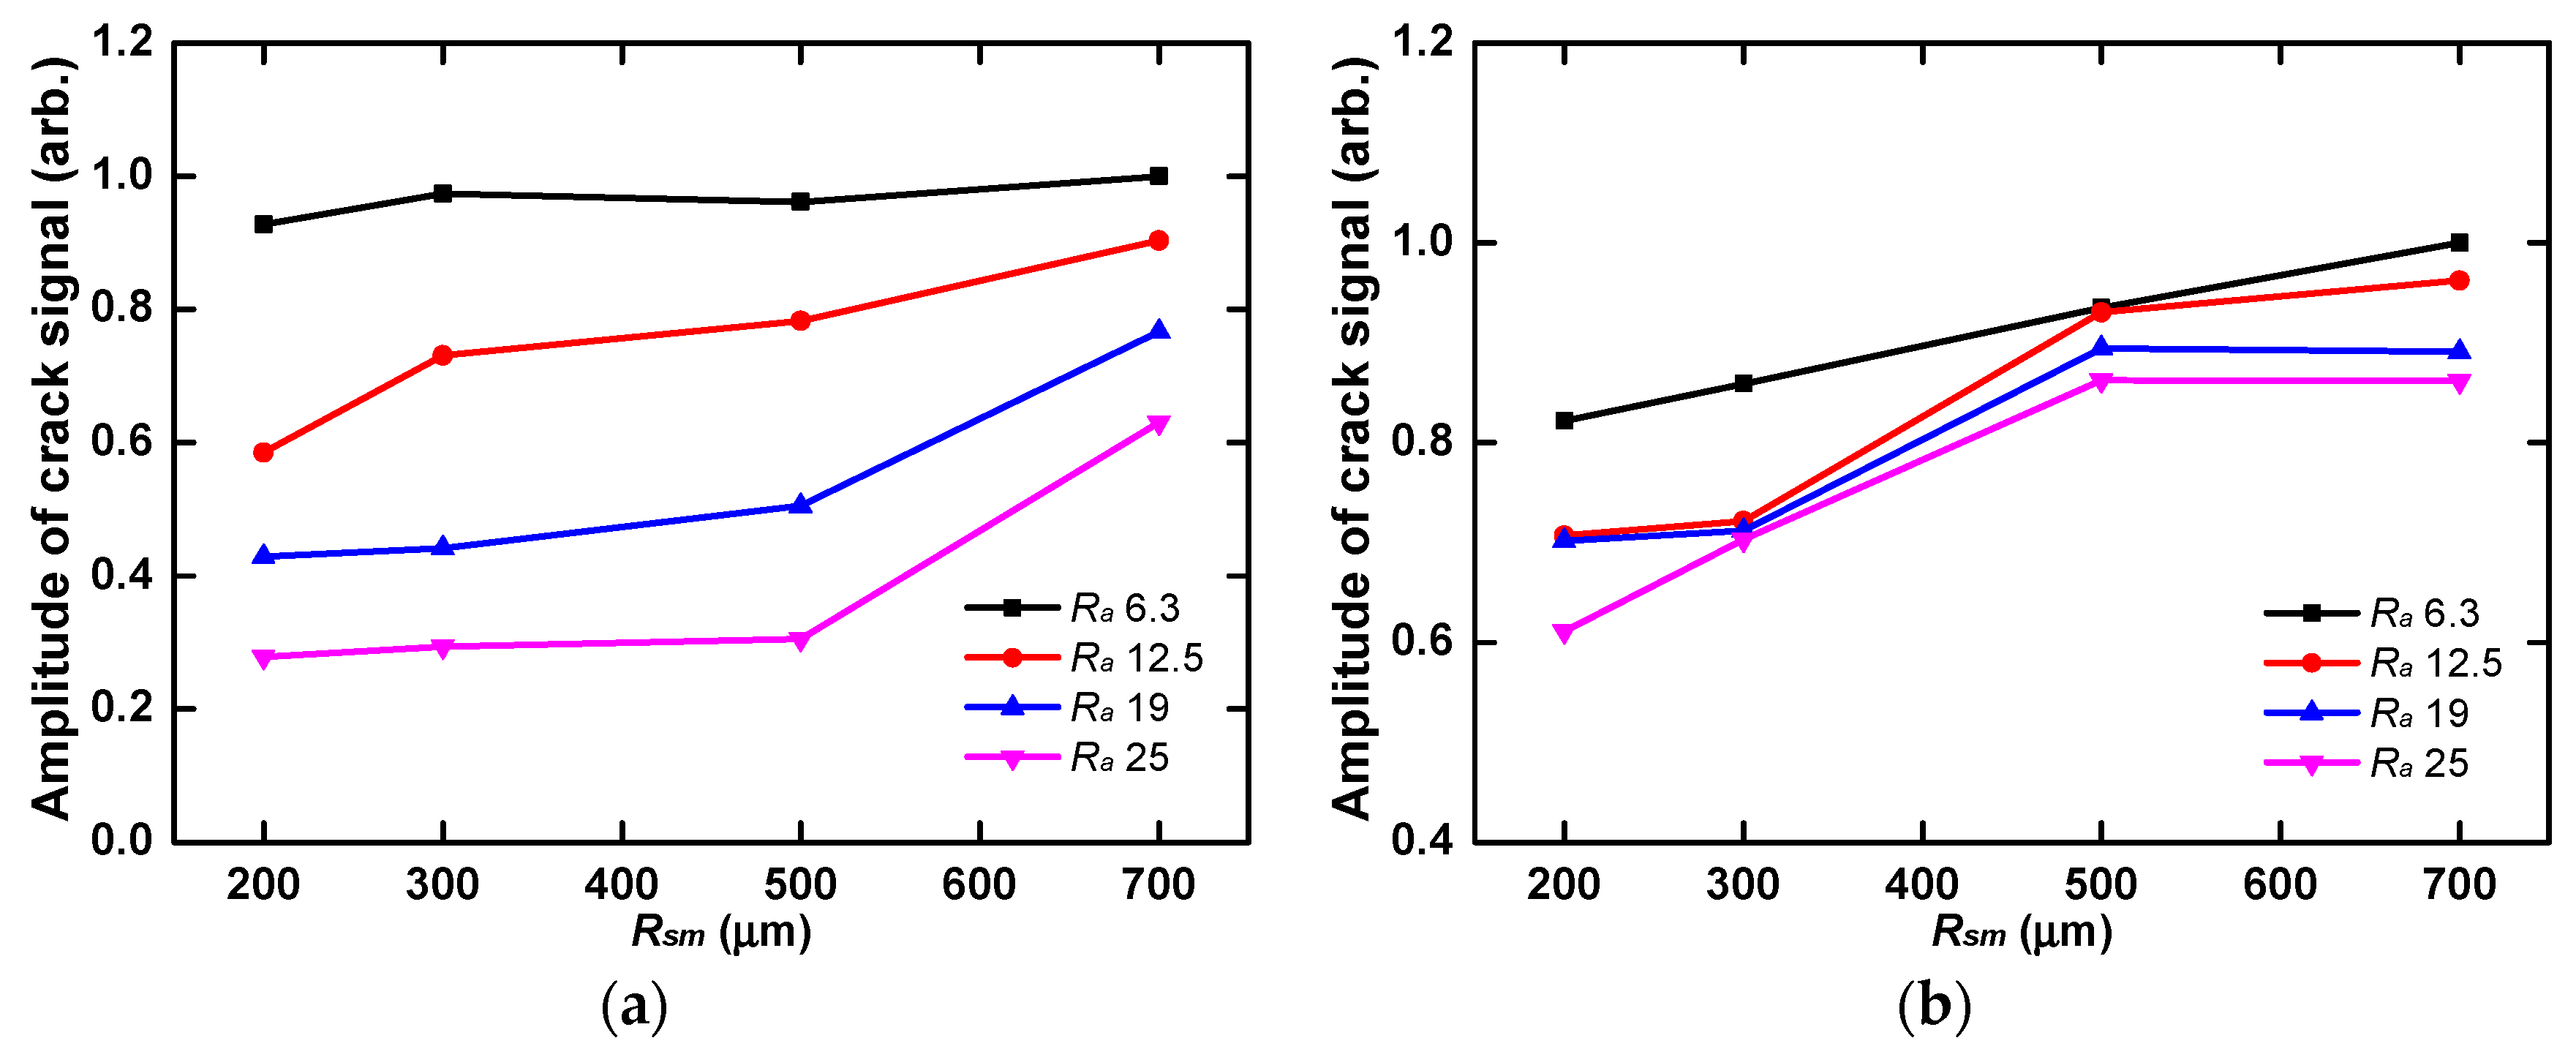
To investigate the relationship between Rsm and normalized mean amplitude of the micro-crack signal, further simulations are performed and the results are shown in Figure 9. The width W and depth D of the crack are simultaneously set to be 250 μm, and Rsm is set as 200 μm, 300 μm, 500 μm, or 700 μm. It can be seen from Figure 9a that the change trends are similar when Ra changes from 6.3 μm to 25 μm. The mean amplitudes of micro-crack signals grow slowly with an increase in Rsm with rough front surface due to weaker wave scattering. On the other hand, the influence of back-surface Rsm on the mean amplitude of the crack signal is slighter than that with front surface, according to Figure 9b. The variation in surface roughness parameter in the horizontal direction has a slight effect on acoustic attenuation. The fluctuation of microstructure height has greater influence on acoustic wave scattering, resulting in more serious distortion of the crack signal.
4. Experiments and Discussion
4.1. Experimental Equipment
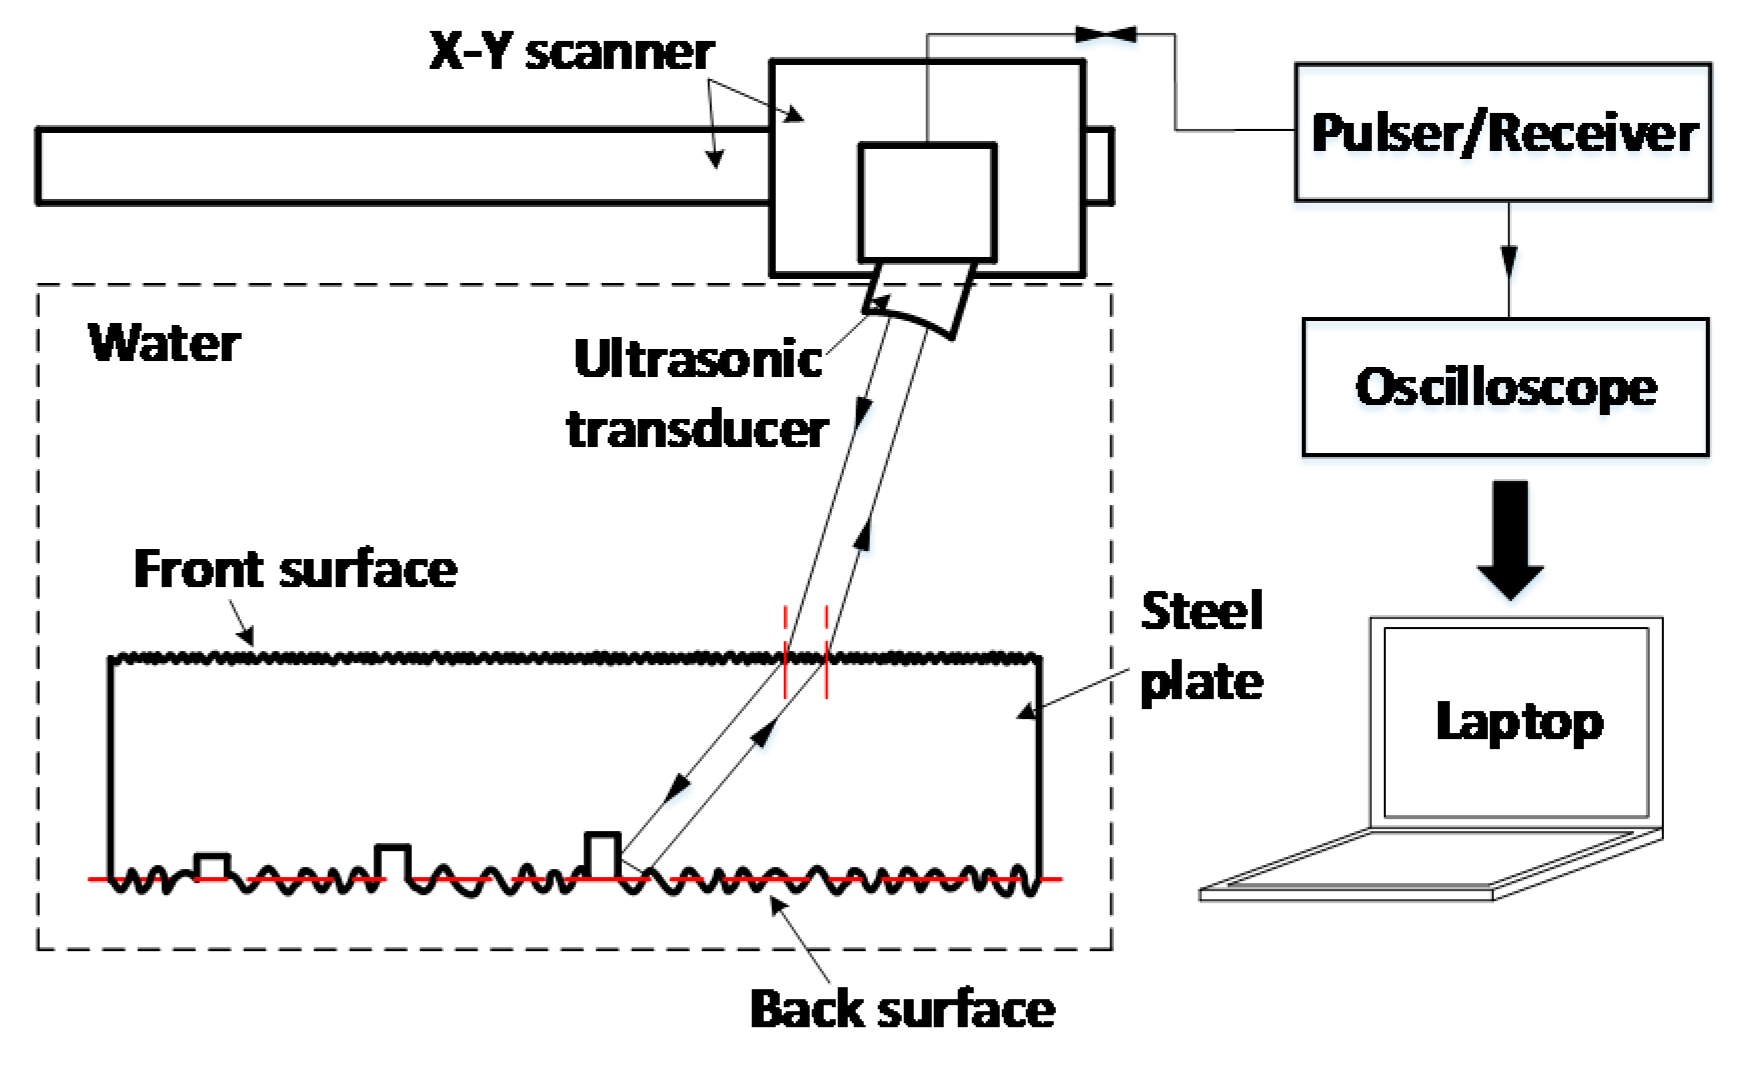
An experimental study was performed to validate the effect of surface roughness on back-surface micro-crack. Figure 10 shows a schematic diagram of the experimental setup, which mainly consisted of an ultrasonic scanner driver with ultrasonic transducer, and signal processing system, as well as several test samples. The ultrasonic scanner driver was used to move the transducer in two directions. The transducer was a broadband, 8 mm × 8 mm piezoelectric wafer. The nominal center frequency of the transducer was 5 MHz. The focal length of the transducer was 25 mm and it was oriented obliquely with respect to the sample’s front surface. The transducer was at a stand-off distance of 20 mm from the front surface. The incident angle was set at 17°.
The incident longitudinal wave generated by the transducer traveled through water and entered the plate with a smooth or rough surface. The pulse-echo generated by interaction of the transmitted shear wave with micro-crack on back surface was received by the same transducer and fed into a digital oscilloscope in the form of a time-race (A-scan). For each micro-crack, ten measurements were conducted and averaged to improve the accuracy of measurement while the other parts of the experimental setup remained unchanged.
A series of mild steel plates with 9 mm thickness were provided as test samples, and the experimental parameters of the test samples are shown in Table 1 and Figure 11. One side of each test sample with different surface roughnesses Ra and Rsm was machined by vertical CNC milling and CNC turning, respectively. The opposite sides of all test samples were ground to make their surfaces smooth. To validate surface variations of the test samples, a Comprehensive Measurement System (Form Talysurf PG1830, Taylor Hobson Limited, Leicester, UK) was used to measure roughness profiles across the surfaces of each sample. There was good agreement with the set roughness values. Different rectangular notches on the rough and smooth surfaces of each sample were machined by a laser cutting machine. The notches were used as reference defects for studying the ultrasonic detection capacity of micro-cracks. The notches were at the bottom of the surface texture.
4.2. The Effect of Front-Surface Roughness on Notch Detection
The main purpose of the experiment was to investigate the effect of rough and smooth surfaces on the ultrasonic detection capacity of back-surface micro-notches. The results were obtained first from rough front surfaces of testing samples while back surfaces were smooth, using the experimental equipment and parameters shown in Figure 10. Notches with depth 100 µm, 150 µm, and 250 µm for the ten samples listed in Table 1 were measured in immersion coupled mode. For example, Figure 12 shows three average signals of notch 3 on samples with different Ra. It can be seen that the mean amplitudes of notch signals dropped rapidly and the average signal shapes changed with an increase in Ra. In addition, the noise signals caused by the rough surface grew slightly with larger Ra. There is good agreement with the simulation results.
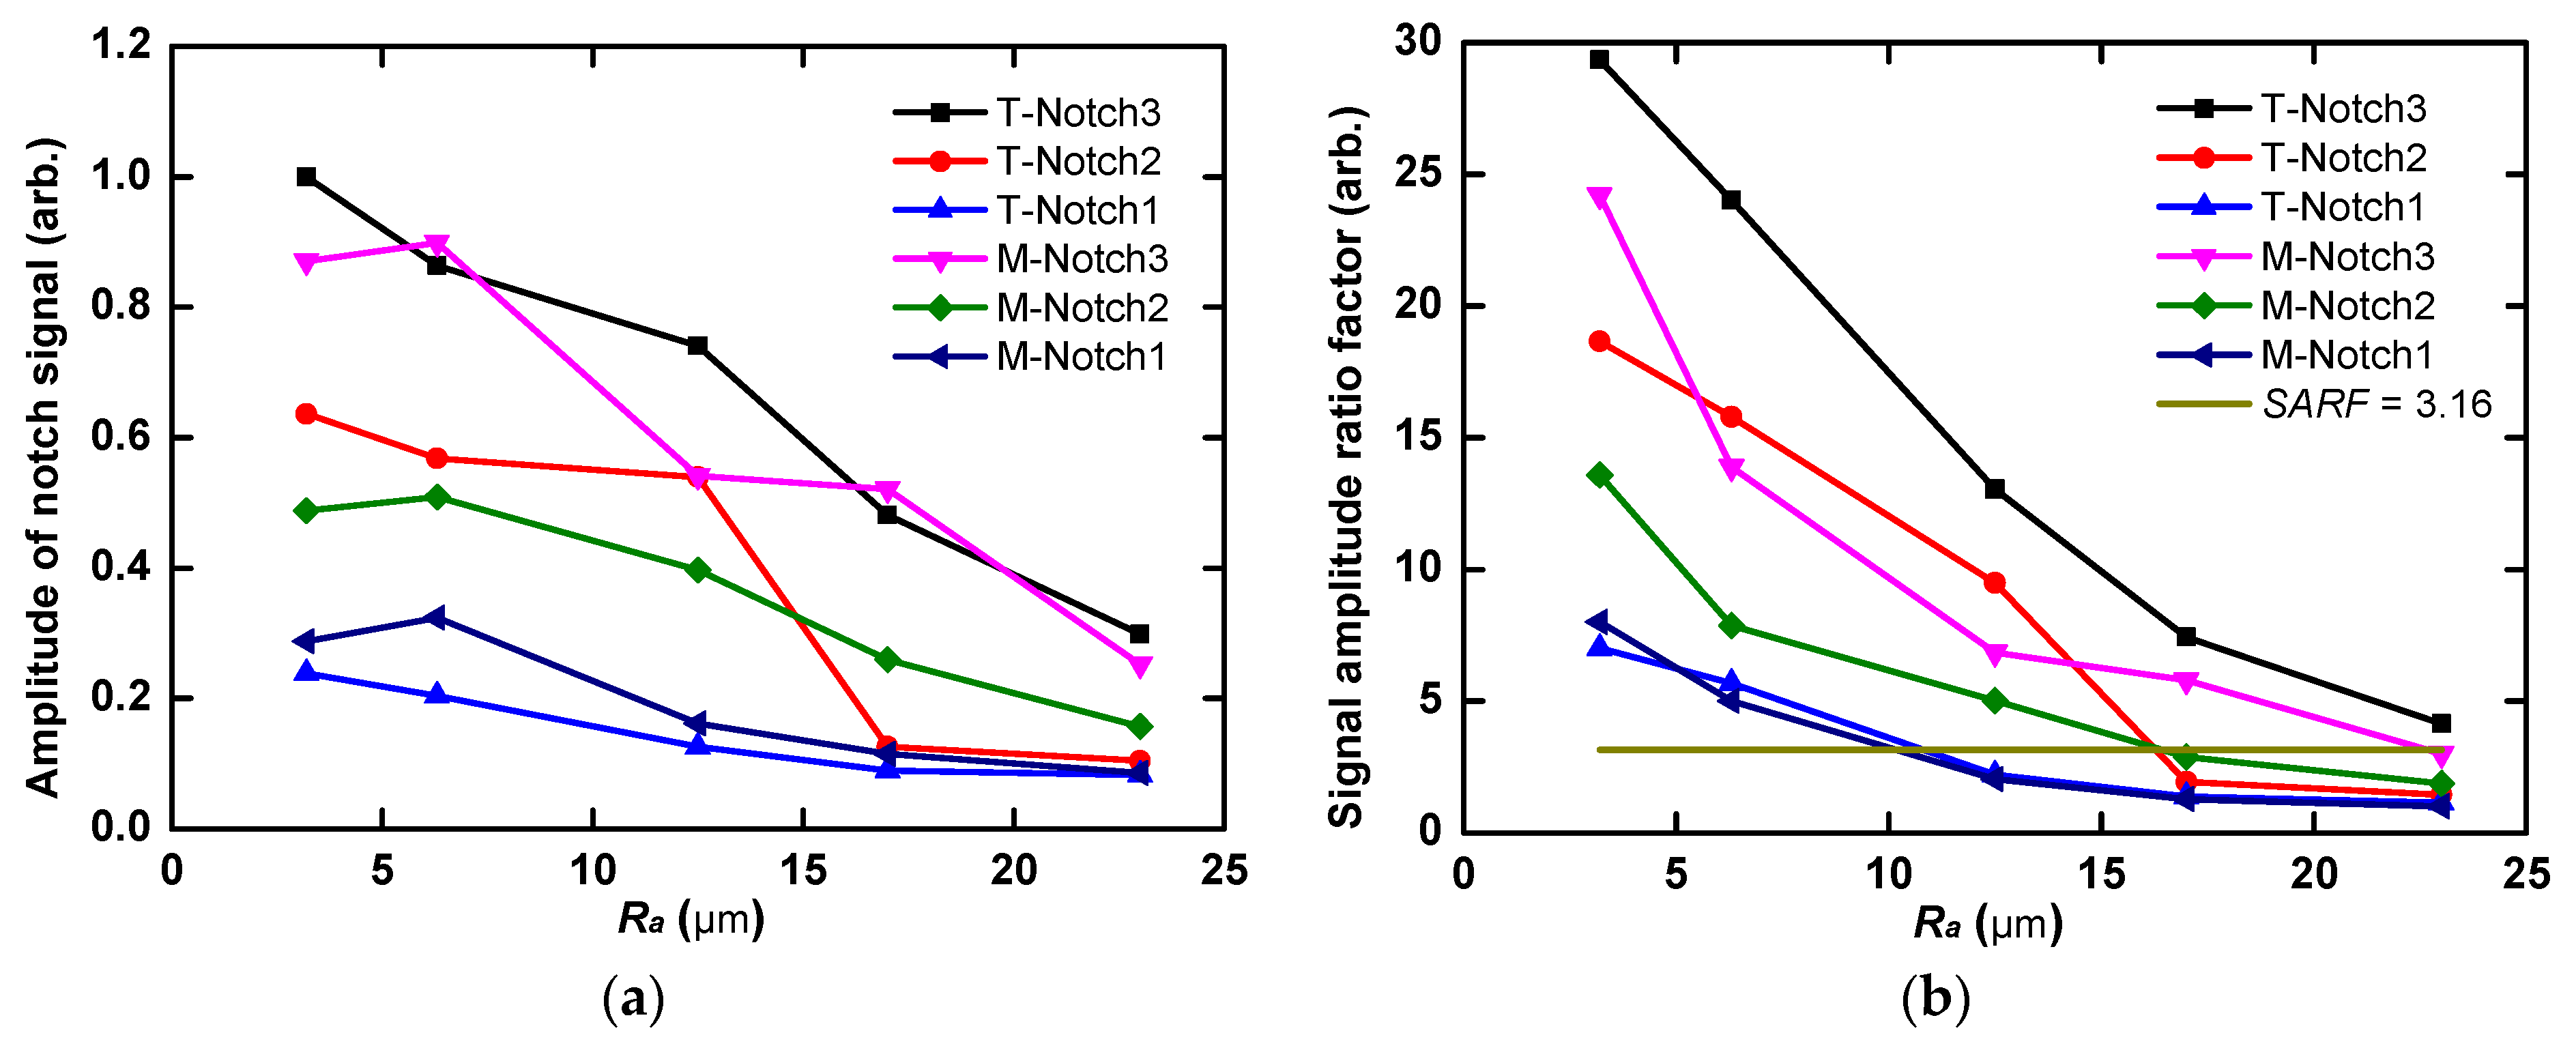
Figure 13a shows the relationship between the normalized mean amplitude of pulse-echo signal of notch and roughness Ra of front surface. The results indicated that the mean amplitude of notch signal was sensitive to notch depth. It can also be seen that larger Ra corresponds to weaker of notch signal; the mean amplitude of the deeper notch signal reduced rapidly with an increase in Ra, and was the same when Ra was larger than 17 µm. It indicated that the attenuation of energy intensity of pulse-echo increased with enhancement of multiple scattering caused by surface roughness Ra. Considering the experimental uncertainties of the attenuation measurement, the agreement between simulation results and measured data was deemed satisfactory.
Meanwhile, the relationship between signal amplitude ratio factor (SARF) and Ra is presented in Figure 13b. It can be seen that the SARF value decreased with Ra because of decrease in of the notch signal and increase in noise signal. When the roughness Ra was lower than 12.5 µm, the impact of a decrease in notch size on mean amplitude of notch signal was obvious. The SARF value of notch 3 was larger than those of notches 2 and 1 for the same Ra and processing method. On the other hand, the SARF critical solid line that represented the critical value 3.16 is given in Figure 13b. The deeper notch corresponded to larger critical Ra. When the roughness was larger than approximately 15 µm, the SARF value was lower than the critical value for these notches. The weaker notch signals were almost immersed in the noise signal and could not be distinguished easily.
Figure 13a shows the relationship between mean amplitude of notch signal and Rsm. The horizontal direction parameter Rsm of the test samples obtained from different processing methods were not the same, as shown in Table 1. Comparing the of sample numbers 1–5 and sample numbers 6–10, the mean amplitudes of notch signals changed slightly with an increase in Rsm at the same Ra and notch depth. The decreasing trend in SARF value was similar to the mean amplitudes of notch signals for different Rsm, as can be seen in Figure 13b.
4.3. The Effect of Back-Surface Roughness on Notch Detection
Figure 14 shows the experimental results of back-surface notch detection on rough back surface when the front surface was smooth. Similar to the observation of rough front surface, the normalized mean amplitude of notch signal decreased with an increase in Ra. The mean amplitude of the notch signal was directly proportional to the notch depth. As can be seen in Figure 14b, the signal amplitude ratio factor (SARF) also decreased with increase in Ra. The degree of attenuation caused by back surface roughness was slighter than that caused by front-surface roughness, observed from the relationship between variations in the mean amplitude of notch signal and Ra. The SARF critical value corresponding to notches with different depths in this experiment was larger than that of the rough front surface. The SARF critical value of M-notch3 was 22.5 µm in Figure 14b while the value was 15 µm corresponding to a rough front surface. This was due to the fact that the attenuation of energy intensity of the pulse-echo of the notch caused by reflection on the rough back surface was less than that caused by transmission on the rough front surface.
5. Conclusions
For ultrasonic inspection of back-surface micro-cracks, the energy intensity changes in the ultrasonic wave are mainly caused by losses of transmitted and reflected waves. The simulation results agreed with the experimental measurements on the relationship between surface roughness and pulse-echo signal of back-surface micro-crack. It was found that surface roughness influenced crack signals, which was reflected in two aspects. On one hand, the mean amplitude of the received pulse-echo signal of the micro-crack decreased obviously with the growth of Ra. The horizontal direction parameter Rsm had a negligible effect on change in crack signal. On the other hand, the mean amplitude of the noise signal caused by multiple scattering nearly in all directions on rough surface increased slightly with an increase in Ra.
The SARF value was applied to investigate the detection limits for back-surface micro-crack with rough front surface and rough back surface. For the rough front surface and smooth back surface, the signal of micro-crack with depth lower than 400 μm was difficult to distinguish from the noise signal when Ra exceeded 15 μm. Compared to the rough front surface, attenuation of the energy intensity of micro-crack pulse-echo caused by the rough back surface was slighter. The micro-crack with depth over 200 μm was accurately identified when the Ra of back surface was less than 24 μm. The surface roughness leads to substantial changes in the results of ultrasonic inspection for micro-cracks. This research provides a valuable reference for obtaining detection limits of micro-cracks under different rough surfaces, which is beneficial for improving detection reliability and accuracy for micro-cracks. Further work will focus on the effect of surface roughness on the detection of front-surface micro-cracks.
Author Contributions
Z.W. and Y.K. conceived the paper structure; Z.W. and X.C. performed the simulations and analyzed the data; Z.W. and H.M. designed and conducted the experiments; Z.W., Y.K. and Z.D. prepared the manuscript and checked the writing.
Funding
This paper was financially supported by the National Natural Science Foundation of China (NNSFC) (No. 51275193, No. 61401415).
Conflicts of Interest
The authors declare no conflict of interest.
References
- Mineo, C.; Cerniglia, D.; Pantano, A. Numerical study for a new methodology of flaws detection in train axles. Ultrasonics 2014, 54, 841–849. [Google Scholar] [CrossRef] [PubMed]
- Lee, L.H.; Rajkumar, R.; Lo, L.H.; Wan, C.H.; Isa, D. Oil and gas pipeline failure prediction system using long range ultrasonic transducers and Euclidean-Support Vector Machines classification approach. Expert Syst. Appl. 2013, 40, 1925–1934. [Google Scholar] [CrossRef]
- Carvalho, A.A.; Rebello, J.M.A.; Souza, M.P.V.; Sagrilo, L.V.S.; Soares, S.D. Reliability of non-destructive test techniques in the inspection of pipelines used in the oil industry. Int. J. Press. Vessels Pip. 2008, 85, 745–751. [Google Scholar] [CrossRef]
- Achenbach, J.D.; Adler, L.; Lewis, D.K.; McMaken, H. Diffraction of ultrasonic waves by penny-shaped cracks in metals: Theory and experiment. J. Acoust. Soc. Am. 1979, 66, 1848–1856. [Google Scholar] [CrossRef]
- Chapman, R.K. A system model for the ultrasonic inspection of smooth planar cracks. J. Nondestr. Eval. 1990, 9, 197–210. [Google Scholar] [CrossRef]
- Skjelvareid, M.H.; Birkelund, Y.; Larsen, Y. Synthetic aperture focusing of outwardly directed cylindrical ultrasound scans. IEEE Trans. Ultrason. Ferroelectr. Freq. Control 2012, 59, 2460–2469. [Google Scholar] [CrossRef] [PubMed]
- Benstock, D.; Cegla, F.; Stone, M. The influence of surface roughness on ultrasonic thickness measurements. J. Acoust. Soc. Am. 2014, 136, 3028–3039. [Google Scholar] [CrossRef] [PubMed] [Green Version]
- Jarvis, A.J.C.; Cegla, F.B. Application of the distributed point source method to rough surface scattering and ultrasonic wall thickness measurement. J. Acoust. Soc. Am. 2012, 132, 1325–1335. [Google Scholar] [CrossRef] [PubMed]
- Bass, F.G.; Fuks, I.M. Wave Scattering from Statistically Rough Surfaces: International Series on Natural Philosophy; Pergamon Press: Oxford, UK, 1979; Volume 93, pp. 240–274. ISBN 0-08-019896-1. [Google Scholar]
- Ogilvy, J.A.; Merklinger, H.M. Theory of wave scattering from random rough surfaces. J. Acoust. Soc. Am. 1991, 90, 3382. [Google Scholar] [CrossRef]
- Nagy, P.B.; Adler, L. Surface roughness induced attenuation of reflected and transmitted ultrasonic waves. J. Acoust. Soc. Am. 1987, 82, 193–197. [Google Scholar] [CrossRef]
- Nagy, P.B.; Rose, J.H. Surface roughness and the ultrasonic detection of subsurface scatterers. J. Appl. Phys. 1993, 73, 566–580. [Google Scholar] [CrossRef]
- Chimenti, D.E.; Lobkis, O.I. The effect of rough surfaces on guided waves in plates. Ultrasonics 1998, 36, 155–162. [Google Scholar] [CrossRef] [Green Version]
- Lopez-Sanchez, A.L.; Kim, H.J.; Schmerr, L.W.; Sedov, A. Measurement models and scattering models for predicting the ultrasonic pulse-echo response from side-drilled holes. J. Nondestr. Eval. 2005, 24, 83–96. [Google Scholar] [CrossRef]
- Chapman, R.K. Ultrasonic Scattering from Smooth Flat Cracks—An Elastodynamic Kirchhoff Diffraction Theory; CEGB Report; Central Electricity Generating Board: Wythenshawe, UK, 1984. [Google Scholar]
- Burch, S.F.; Collett, N.; Chapman, R.K.; Toft, M.W. Experimental validation of the TRANGLE and related NDT codes for modelling the ultrasonic inspection of rough cracks. Insight Nondestr. Test. Cond. Monit. 2004, 46, 74–76. [Google Scholar] [CrossRef]
- Shi, F.; Lowe, M.J.S.; Xi, X.; Craster, R.V. Diffuse scattered field of elastic waves from randomly rough surfaces using an analytical Kirchhoff theory. J. Mech. Phys. Solids 2016, 92, 260–277. [Google Scholar] [CrossRef] [Green Version]
- Dacol, D.K. The Kirchhoff approximation for acoustic scattering from a rough fluid-elastic solid interface. J. Acoust. Soc. Am. 1990, 88, 978–983. [Google Scholar] [CrossRef]
- Thorsos, E.I. The validity of the perturbation approximation for rough surface scattering using a Gaussian roughness spectrum. J. Acoust. Soc. Am. 1988, 83, 78–92. [Google Scholar] [CrossRef]
- Ogilvy, J.A. Theoretical comparison of ultrasonic signal amplitudes from smooth and rough defects. NDT Int. 1986, 19, 371–385. [Google Scholar] [CrossRef]
- Ogilvy, J.A. Computer simulation of acoustic wave scattering from rough surfaces. J. Phys. D Appl. Phys. 1988, 21, 260–277. [Google Scholar] [CrossRef]
- Ogilvy, J.A. Wave scattering from rough surfaces. Rep. Prog. Phys. 1987, 50, 1553–1608. [Google Scholar] [CrossRef]
- Shi, F.; Lowe, M.; Craster, R. Diffusely scattered and transmitted elastic waves by random rough solid-solid interfaces using an elastodynamic Kirchhoff approximation. Phys. Rev. B 2017, 95, 1–13. [Google Scholar] [CrossRef]
- Castaings, M.; Bacon, C. Finite element modeling of torsional wave modes along pipes with absorbing materials. J. Acoust. Soc. Am. 2006, 119, 3741–3751. [Google Scholar] [CrossRef]
- Rajagopal, P.; Drozdz, M.; Skelton, E.A.; Lowe, M.J.S.; Craster, R.V. On the use of absorbing layers to simulate the propagation of elastic waves in unbounded isotropic media using commercially available Finite Element packages. NDT E Int. 2012, 51, 30–40. [Google Scholar] [CrossRef]
- Mahaut, S.; Leymarie, N.; Poidevin, C.; Fouquet, T.; Dupond, O. Study of complex ultrasonic NDT cases using hybrid simulation method and experimental validations. Insight Nondestr. Test. Cond. Monit. 2011, 53, 664–667. [Google Scholar] [CrossRef]
- Pettit, J.R.; Walker, A.; Cawley, P.; Lowe, M.J.S. A Stiffness Reduction Method for efficient absorption of waves at boundaries for use in commercial Finite Element codes. Ultrasonics 2014, 54, 1868–1879. [Google Scholar] [CrossRef] [PubMed]
- Jarvis, A.; Cegla, F. Scattering of near normal incidence SH waves by sinusoidal and rough surfaces in 3-D: Comparison to the scalar wave approximation. IEEE Trans. Ultrason. Ferroelectr. Freq. Control 2014, 61, 1179–1190. [Google Scholar] [CrossRef] [PubMed]
- Cegla, F.; Jarvis, A. Modeling the effect of roughness on ultrasonic scattering in 2D and 3D. AIP Conf. Proc. 2014, 1581, 595–601. [Google Scholar]
- Zhang, J.; Drinkwater, B.W.; Wilcox, P.D. Longitudinal wave scattering from rough crack-like defects. IEEE Trans. Ultrason. Ferroelectr. Freq. Control 2011, 58, 2171–2180. [Google Scholar] [CrossRef] [PubMed]
- Pettit, J.R.; Walker, A.E.; Lowe, M.J.S. Improved detection of rough defects for ultrasonic nondestructive evaluation inspections based on finite element modeling of elastic wave scattering. IEEE Trans. Ultrason. Ferroelectr. Freq. Control 2015, 62, 1797–1808. [Google Scholar] [CrossRef] [PubMed]
- Standard ASME B46.1-2009. Surface Text (Surface Roughness, Waviness, and Lay); American Scociety of Mechanical Engineerings: New York, NY, USA, 2009; pp. 1–107.
- Gadelmawla, E.S.; Koura, M.M.; Maksoud, T.; Elewa, I.M.; Soliman, H.H. Roughness parameters. J. Mater. Process. Technol. 2002, 123, 133–145. [Google Scholar] [CrossRef]
- Deng, Z.; Sun, Y.; Yang, Y.; Kang, Y. Effects of surface roughness on magnetic flux leakage testing of micro-cracks. Meas. Sci. Technol. 2017, 28. [Google Scholar] [CrossRef]
- Zhang, Y.; Shi, T.; Su, L.; Wang, X.; Hong, Y.; Chen, K.; Liao, G. Sparse reconstruction for micro defect detection in acoustic micro imaging. Sensors 2016, 16. [Google Scholar] [CrossRef] [PubMed]
Figure 1.
Partial feature parameters within evaluation length on rough surface.

Figure 2.
Schematic diagram of scattering of waves at a rough water-solid interface.

Figure 3.
(a) Schematic diagram of ultrasonic detection of micro-crack with rough surface; (b) changes in energy intensity of acoustic wave for micro-crack detection. I0~I5 represent the changes in energy intensity from incident wave to crack echo. T1 represents the transmission coefficient of incident acoustic wave, R1 represents the reflection coefficient of transmitted shear wave, and T2 represents the retransmission coefficient of the reflected wave of back-surface crack.
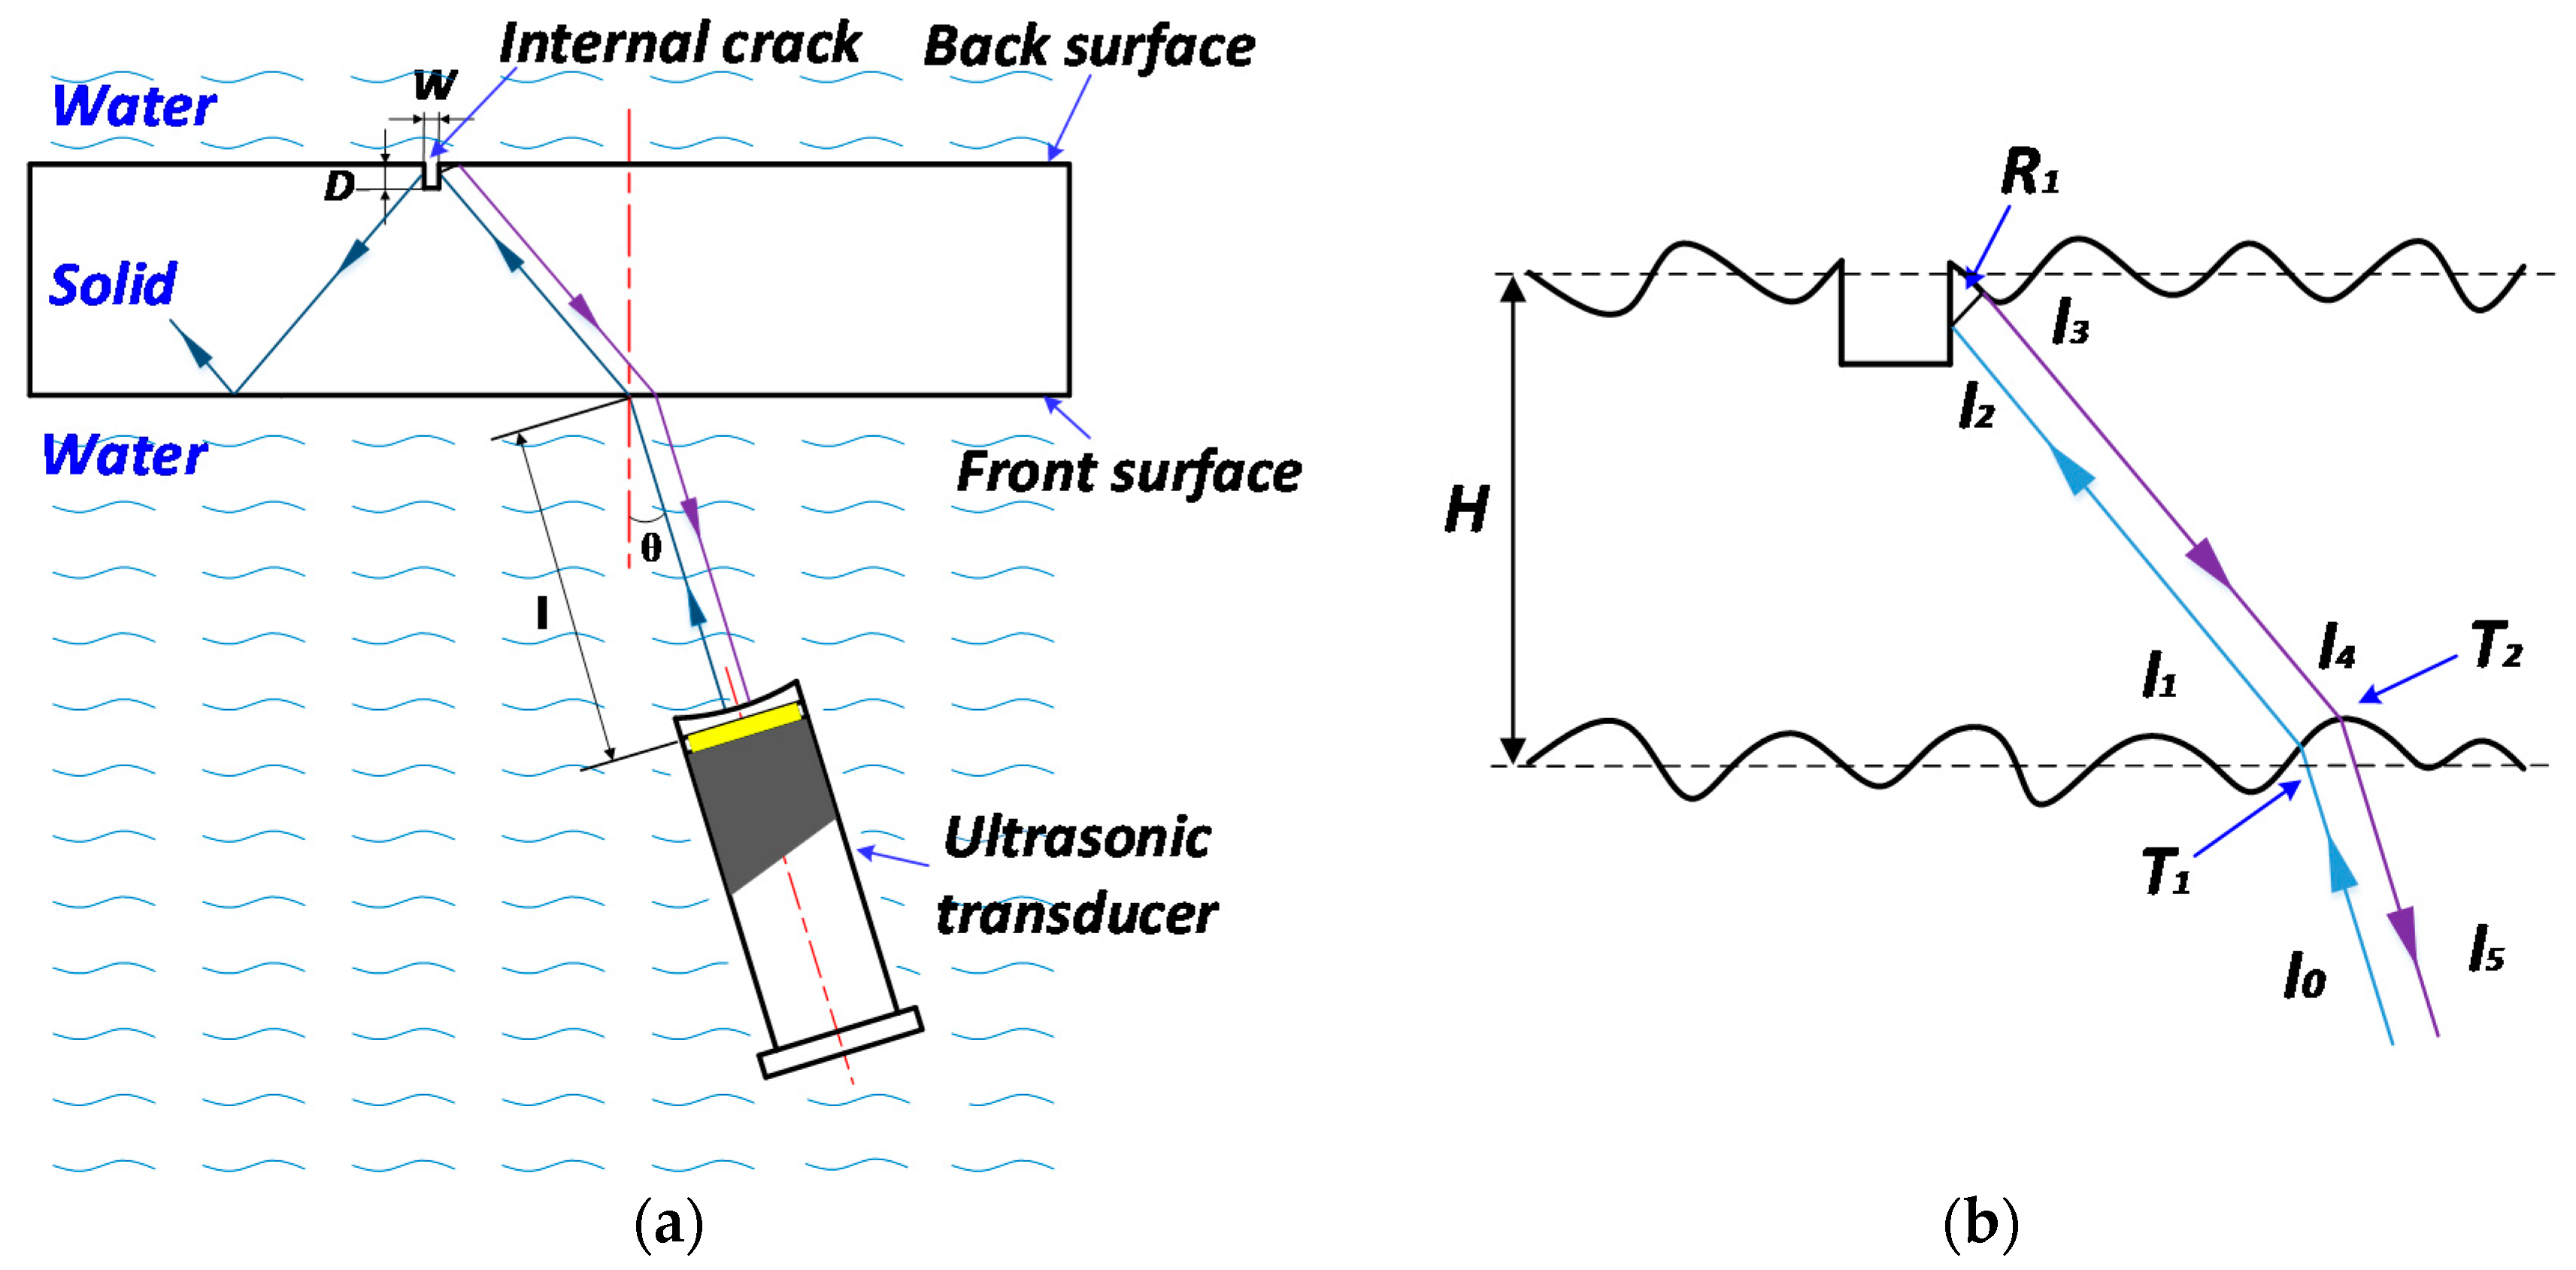
Figure 4.
(a) The two-dimensional simulation model; (b) partial view of rough sinusoidal surface.

Figure 5.
Scattering diagram of acoustic wave during ultrasonic detection process of micro-crack when the front surface is rough and back surface is smooth. (a) t = 13.5 μs; (b) t = 15 μs; (c) t = 16.5 μs; (d) t = 19.4 μs; (e) t = 21.9 μs; (f) t = 24 μs.
Figure 5.
Scattering diagram of acoustic wave during ultrasonic detection process of micro-crack when the front surface is rough and back surface is smooth. (a) t = 13.5 μs; (b) t = 15 μs; (c) t = 16.5 μs; (d) t = 19.4 μs; (e) t = 21.9 μs; (f) t = 24 μs.
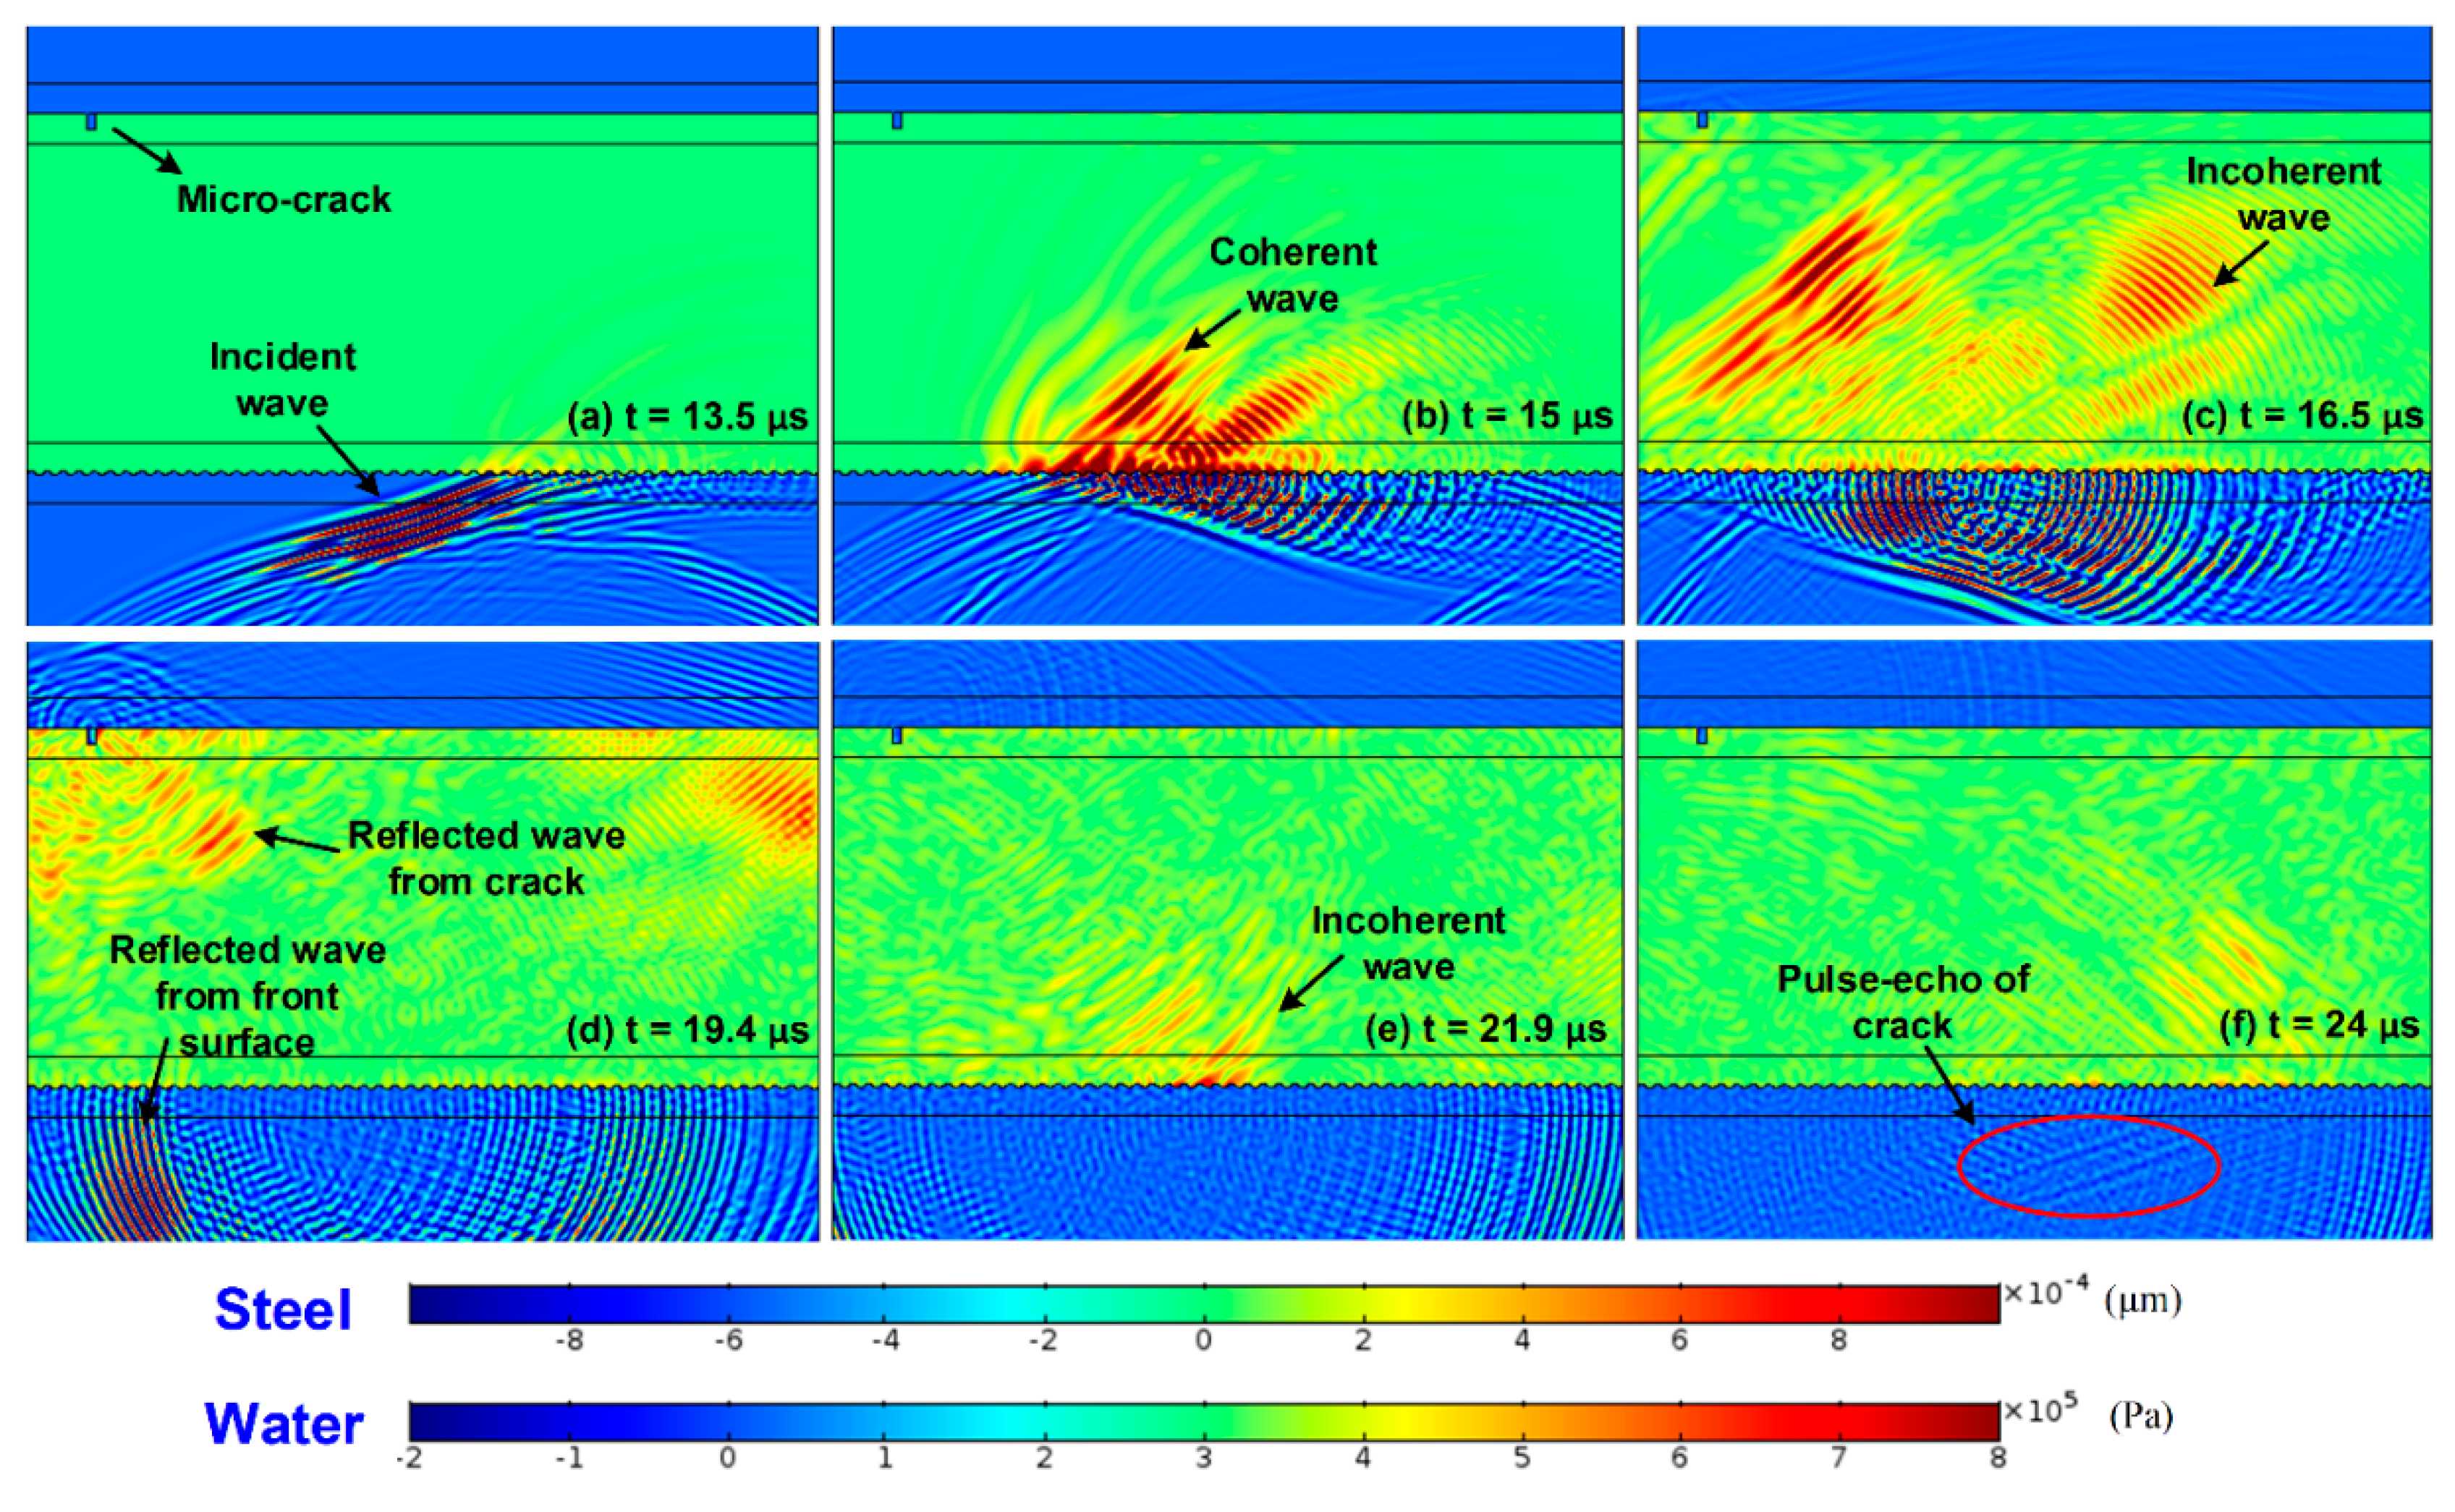
Figure 6.
Ultrasonic time-domain signal when front-surface roughness Ra is (a) 3.2 μm, (b) 12.5 μm, and (c) 25 μm and there is a micro-crack on the smooth back surface. Reference signal in (d) while front-surface roughness Ra is 25 μm and there is no micro-crack on the smooth back surface.
Figure 6.
Ultrasonic time-domain signal when front-surface roughness Ra is (a) 3.2 μm, (b) 12.5 μm, and (c) 25 μm and there is a micro-crack on the smooth back surface. Reference signal in (d) while front-surface roughness Ra is 25 μm and there is no micro-crack on the smooth back surface.
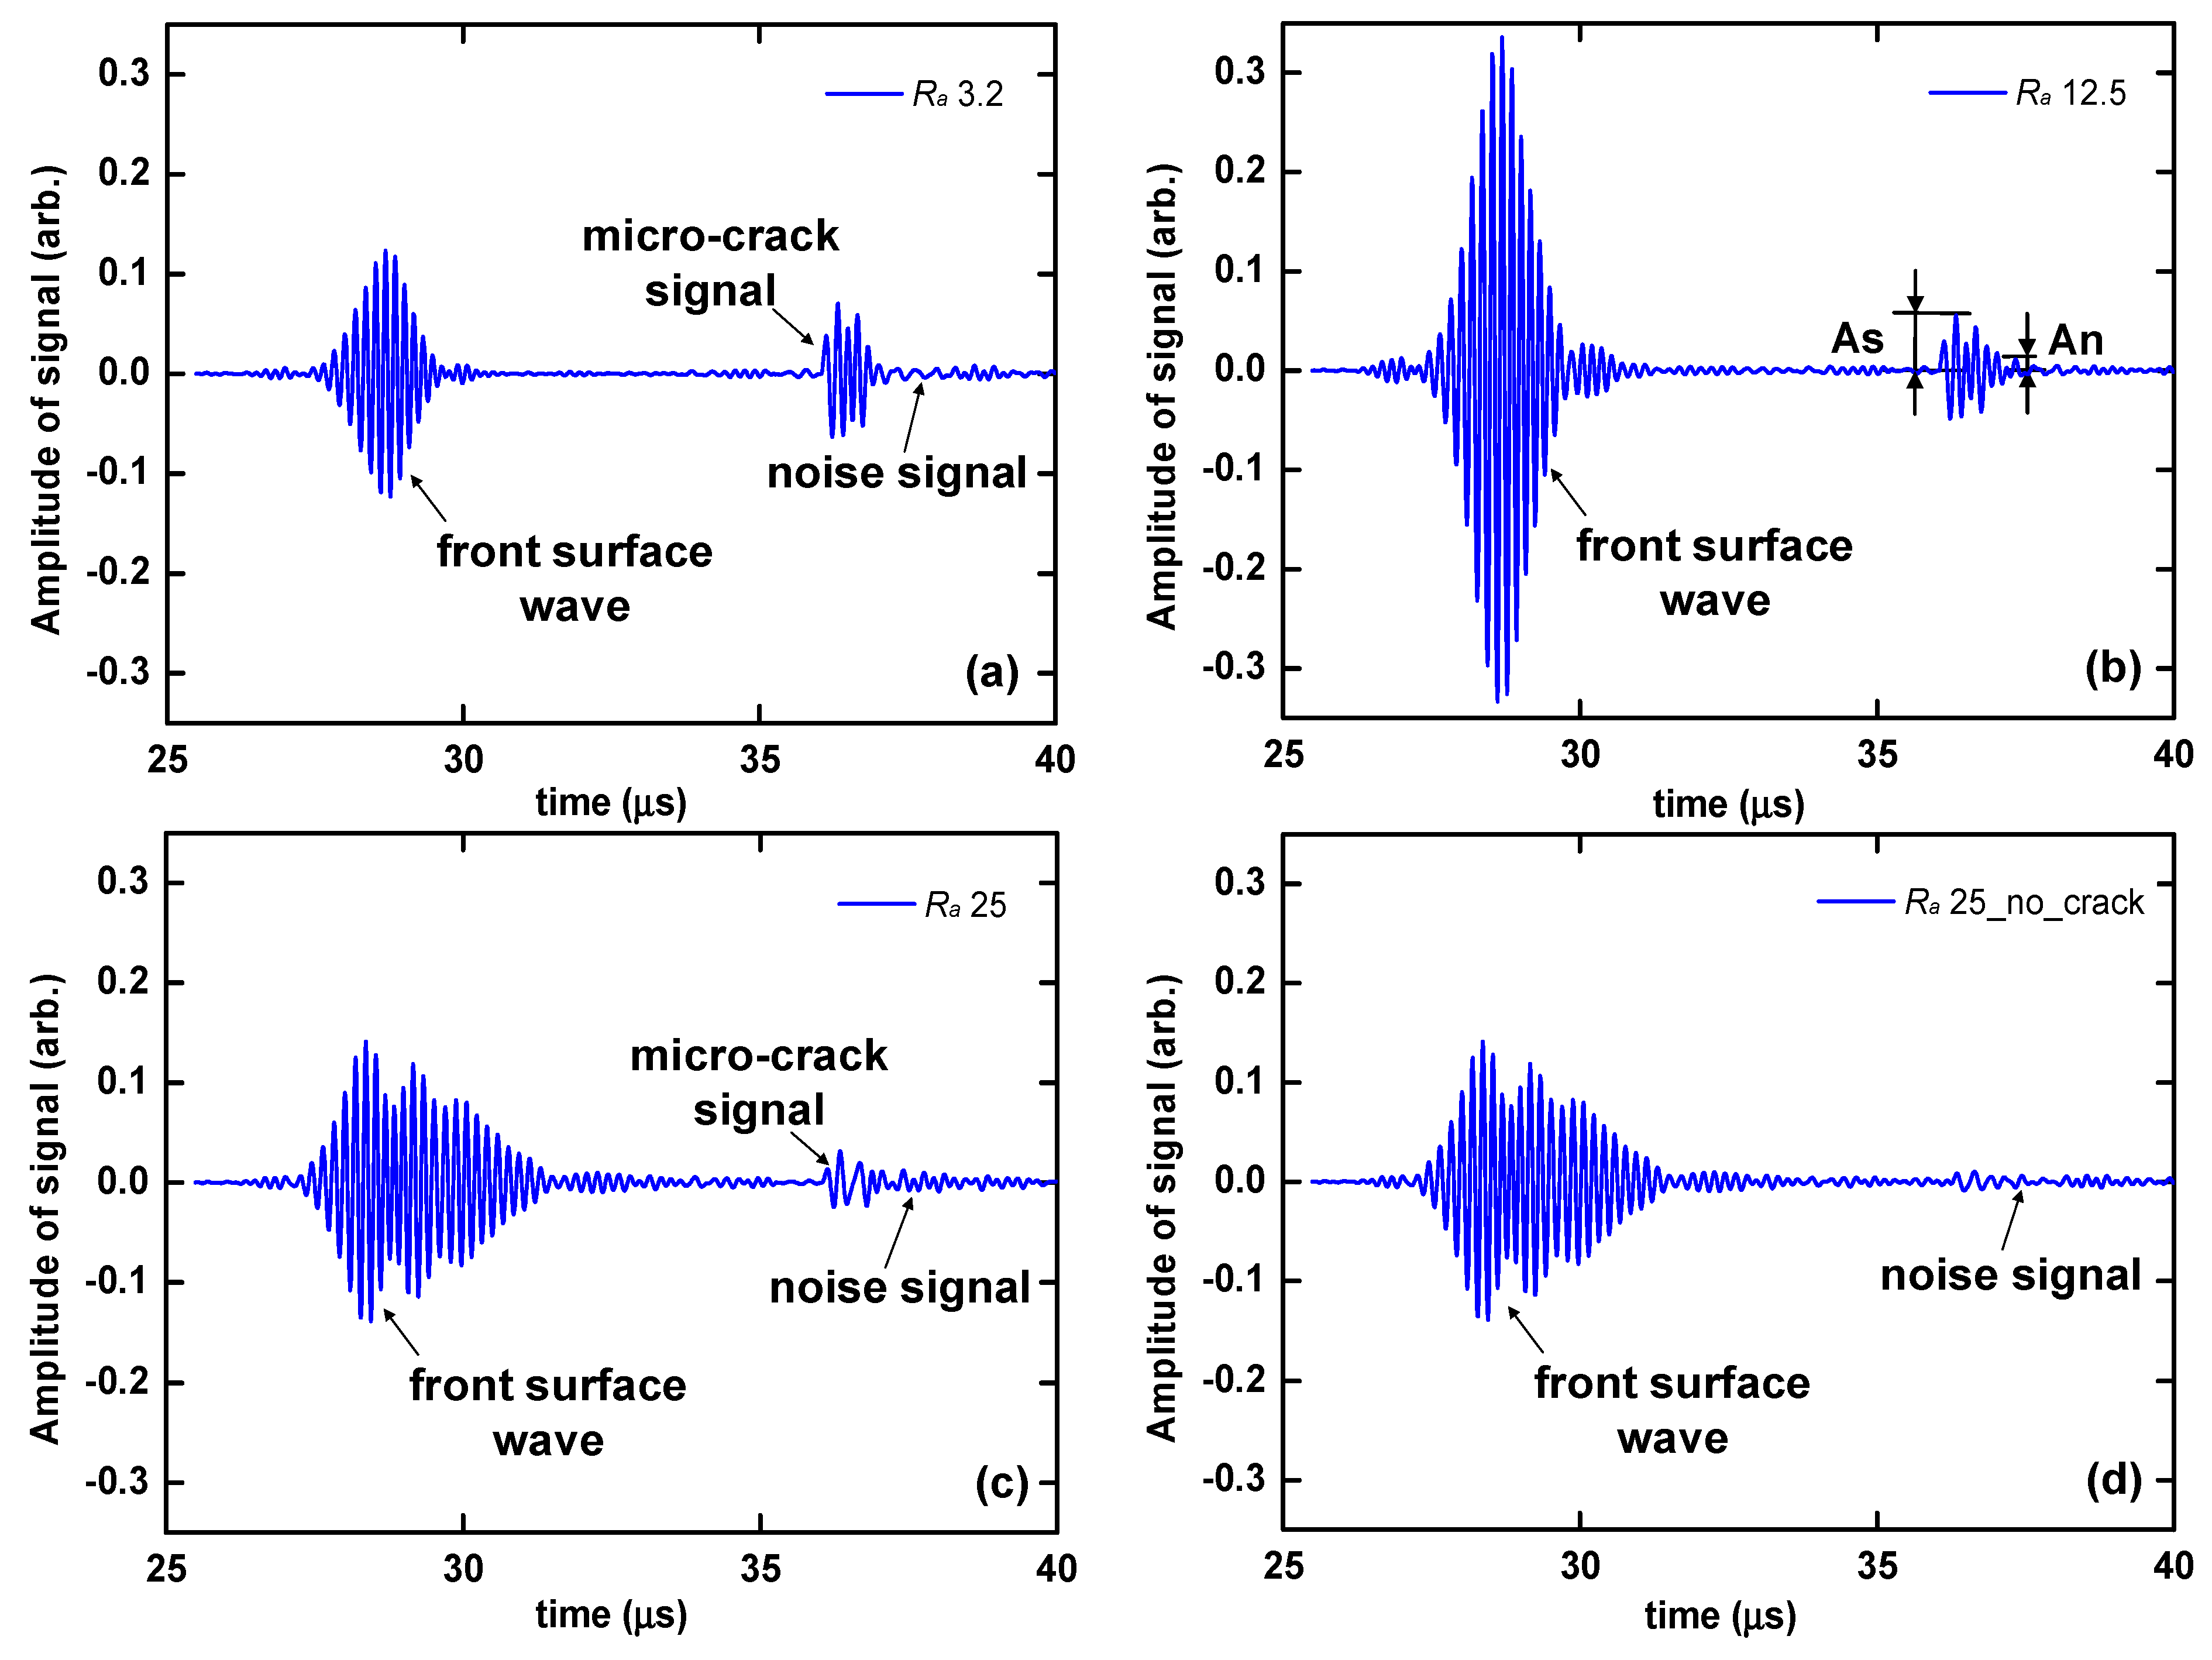
Figure 7.
(a) Normalized mean signal amplitudes of different cracks reduce as front-surface roughness Ra increases. (b) The signal amplitude ratio factor (SARF) reduces as front-surface roughness Ra increases.
Figure 7.
(a) Normalized mean signal amplitudes of different cracks reduce as front-surface roughness Ra increases. (b) The signal amplitude ratio factor (SARF) reduces as front-surface roughness Ra increases.
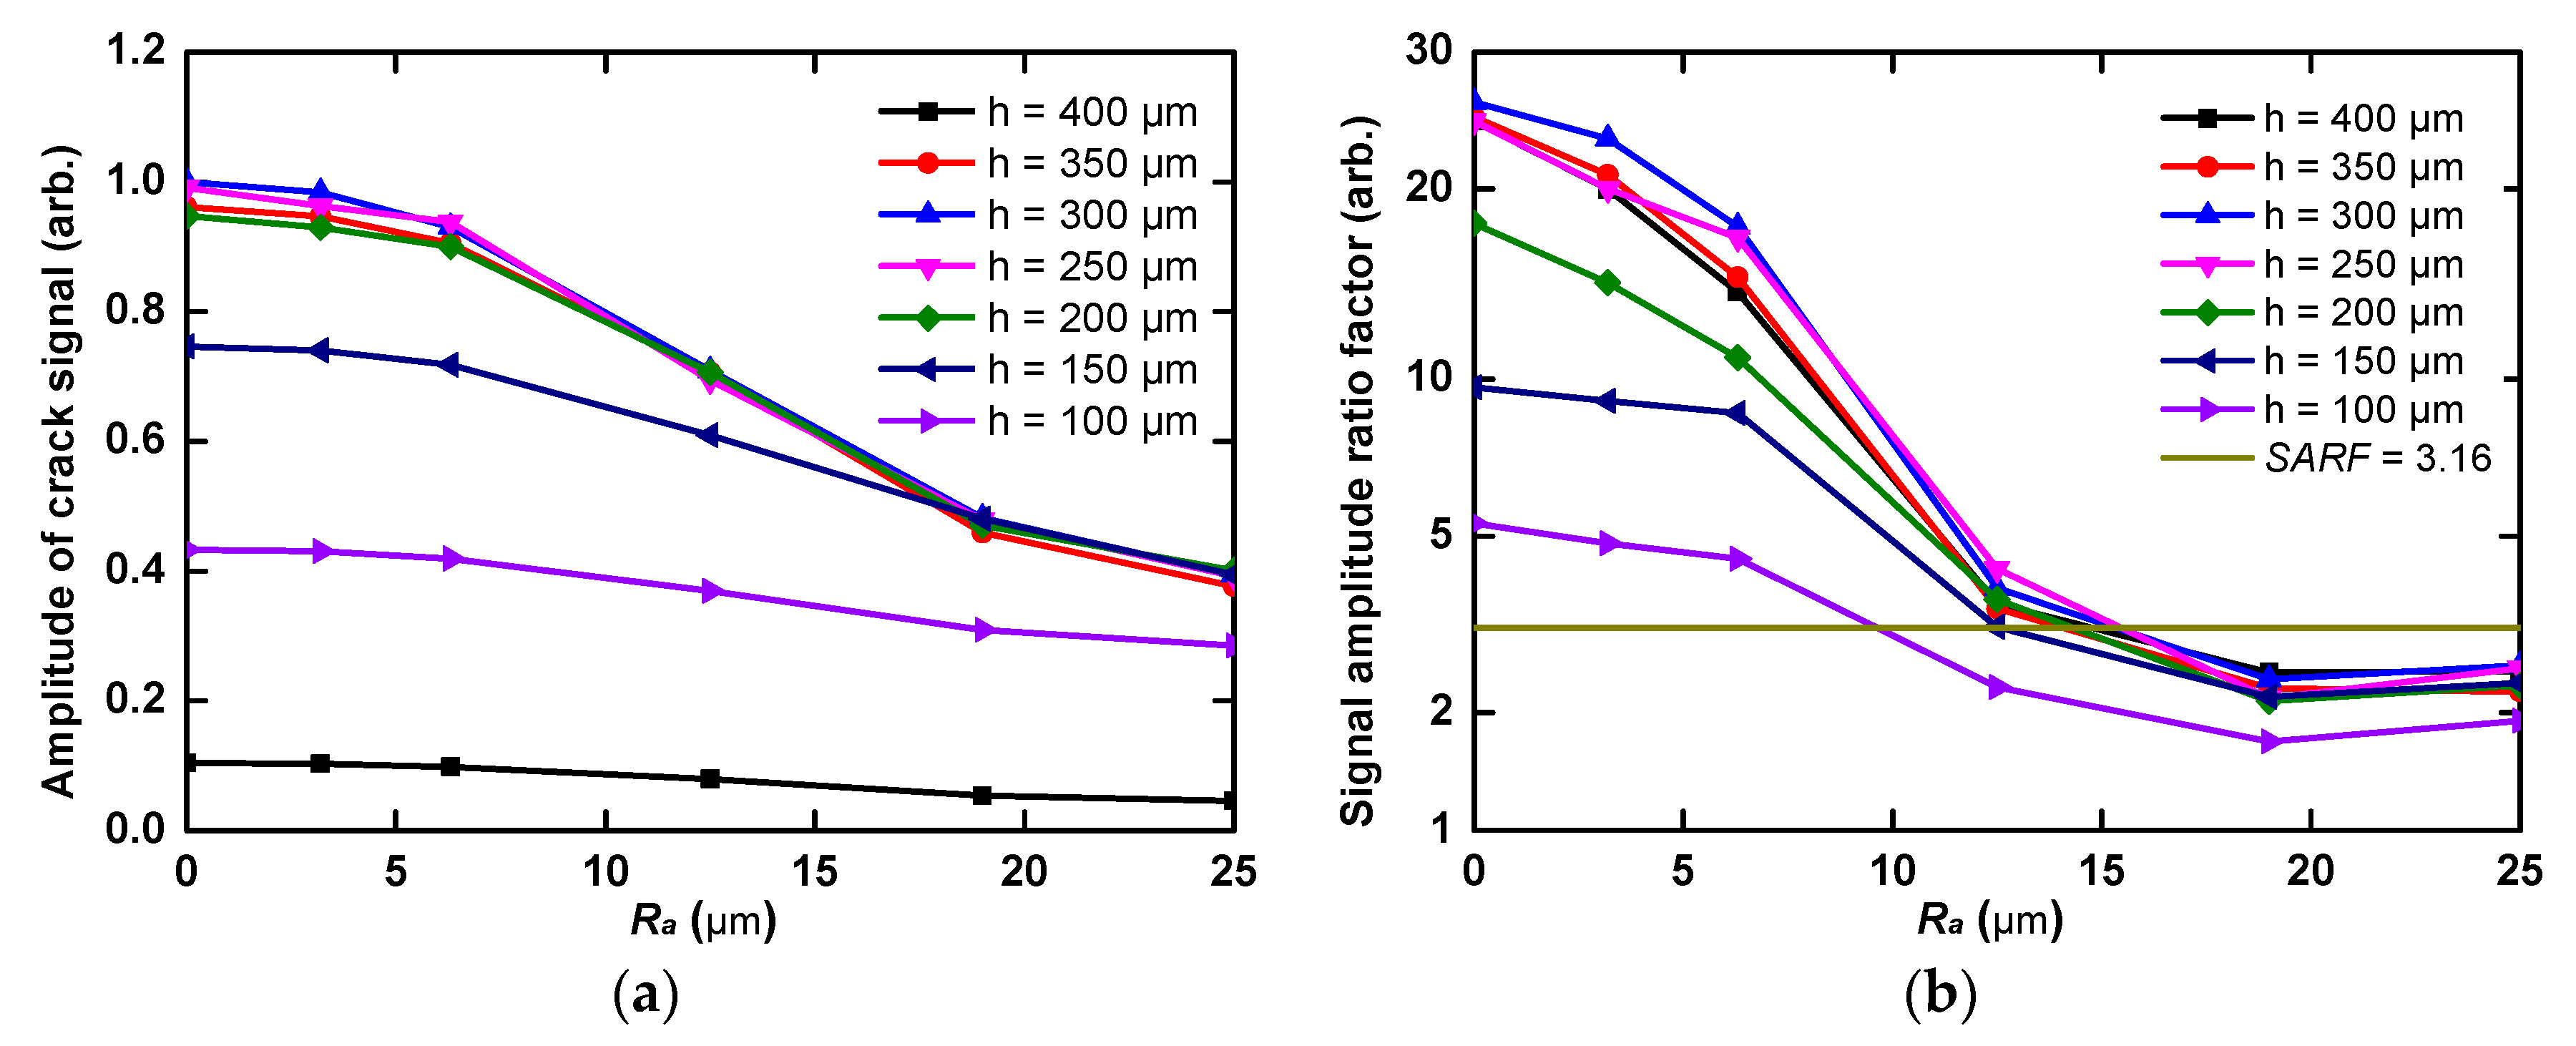
Figure 8.
(a) Normalized mean signal amplitudes of different cracks reduce as back-surface roughness Ra increases. (b) The signal amplitude ratio factor (SARF) reduces as back-surface roughness Ra increases.
Figure 8.
(a) Normalized mean signal amplitudes of different cracks reduce as back-surface roughness Ra increases. (b) The signal amplitude ratio factor (SARF) reduces as back-surface roughness Ra increases.
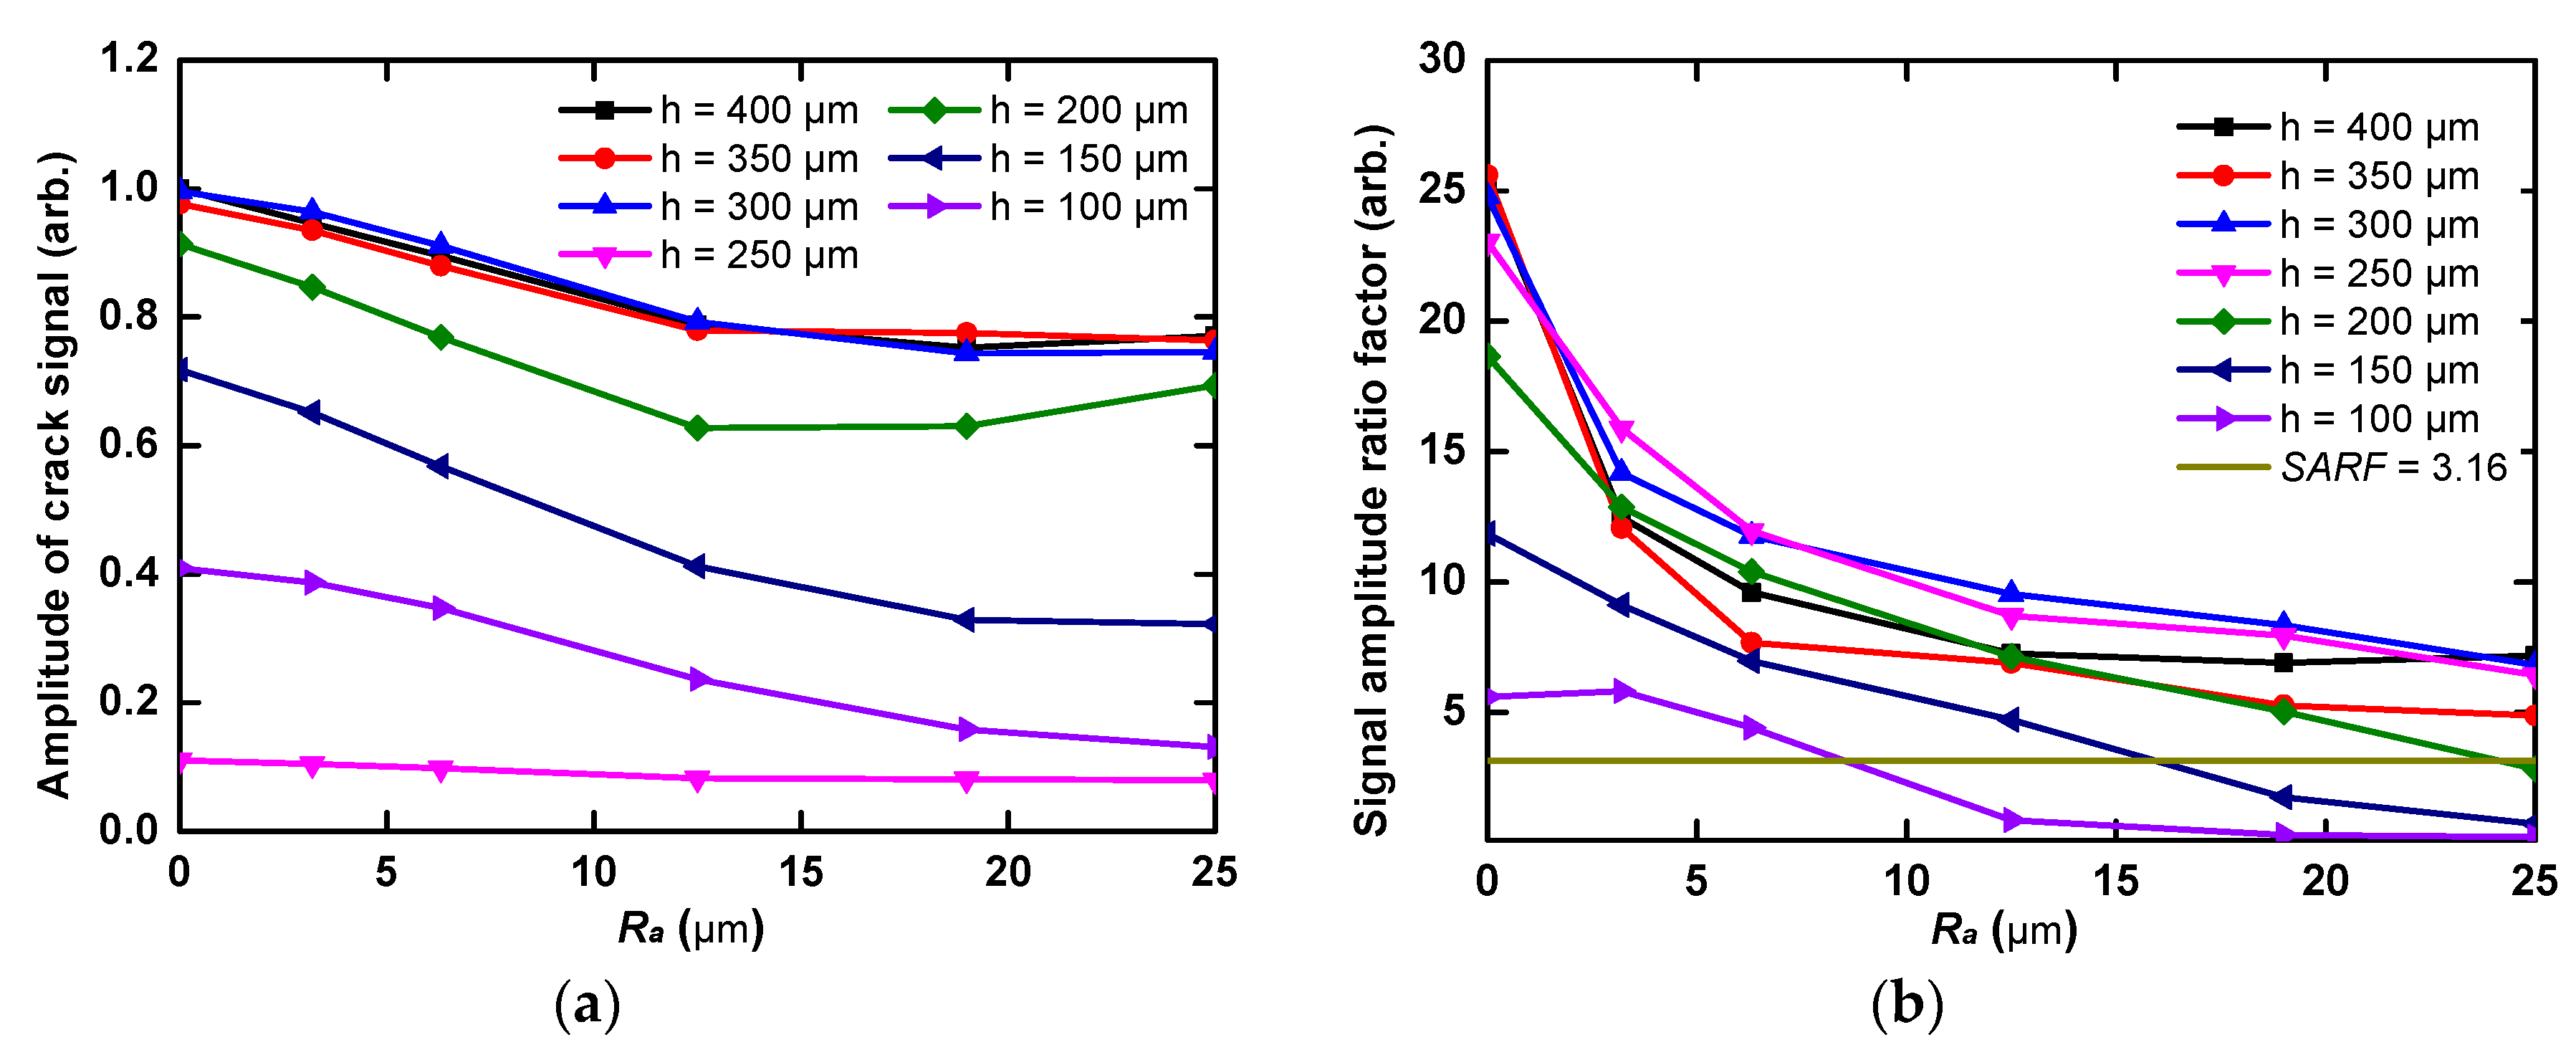
Figure 9.
(a) Normalized mean signal amplitude of the same crack reduces as front-surface roughness Rsm increases. (b) Normalized mean signal amplitude of the same crack reduces as back-surface roughness Rsm increases.
Figure 9.
(a) Normalized mean signal amplitude of the same crack reduces as front-surface roughness Rsm increases. (b) Normalized mean signal amplitude of the same crack reduces as back-surface roughness Rsm increases.

Figure 10.
Schematic diagram of the experimental setup.

Figure 11.
(a) The distribution of notches 1–3 on rough surface and smooth surface of test sample plate; (b) test samples 1–10; all steel plates are of the same size (240 mm × 50 mm × 90 mm).
Figure 11.
(a) The distribution of notches 1–3 on rough surface and smooth surface of test sample plate; (b) test samples 1–10; all steel plates are of the same size (240 mm × 50 mm × 90 mm).
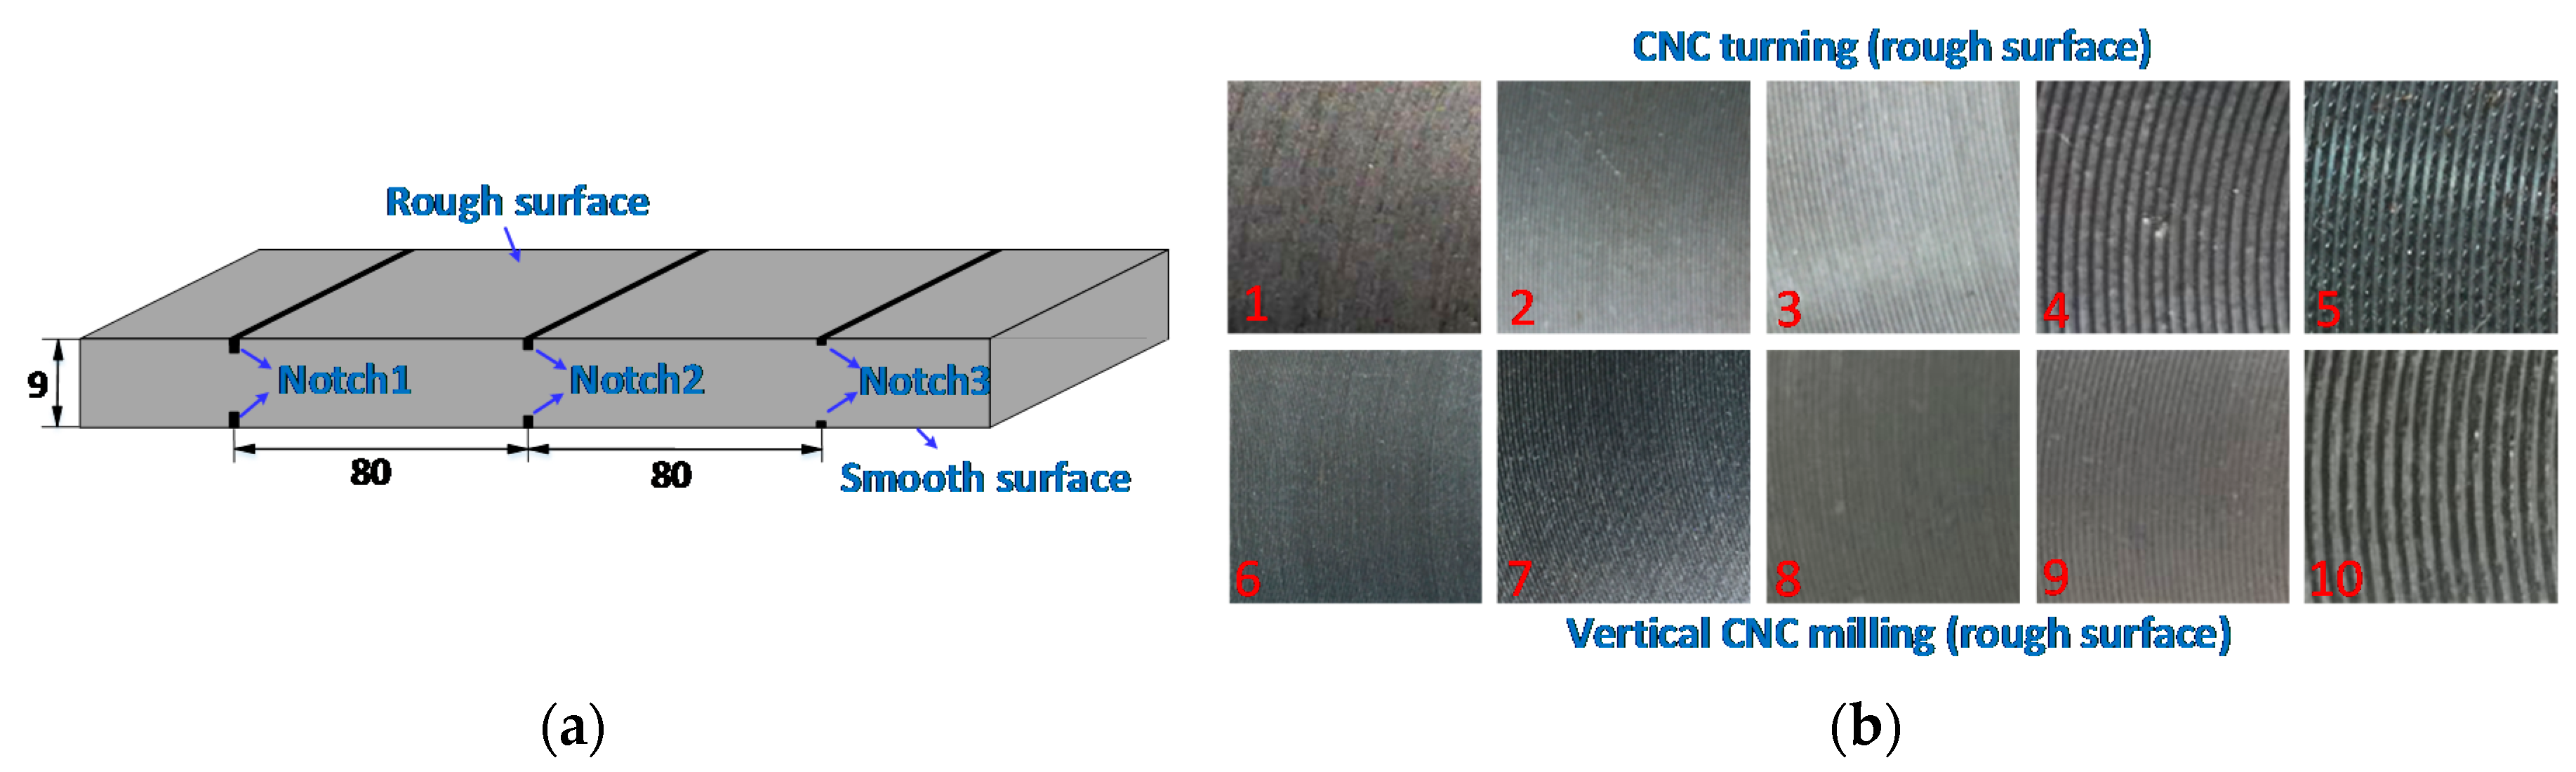
Figure 12.
Ultrasonic time-domain mean signals of notch 3 on different experimental samples with front-surface roughness Ra = 3.2 μm, 6.3 μm, and 12.5 μm.
Figure 12.
Ultrasonic time-domain mean signals of notch 3 on different experimental samples with front-surface roughness Ra = 3.2 μm, 6.3 μm, and 12.5 μm.
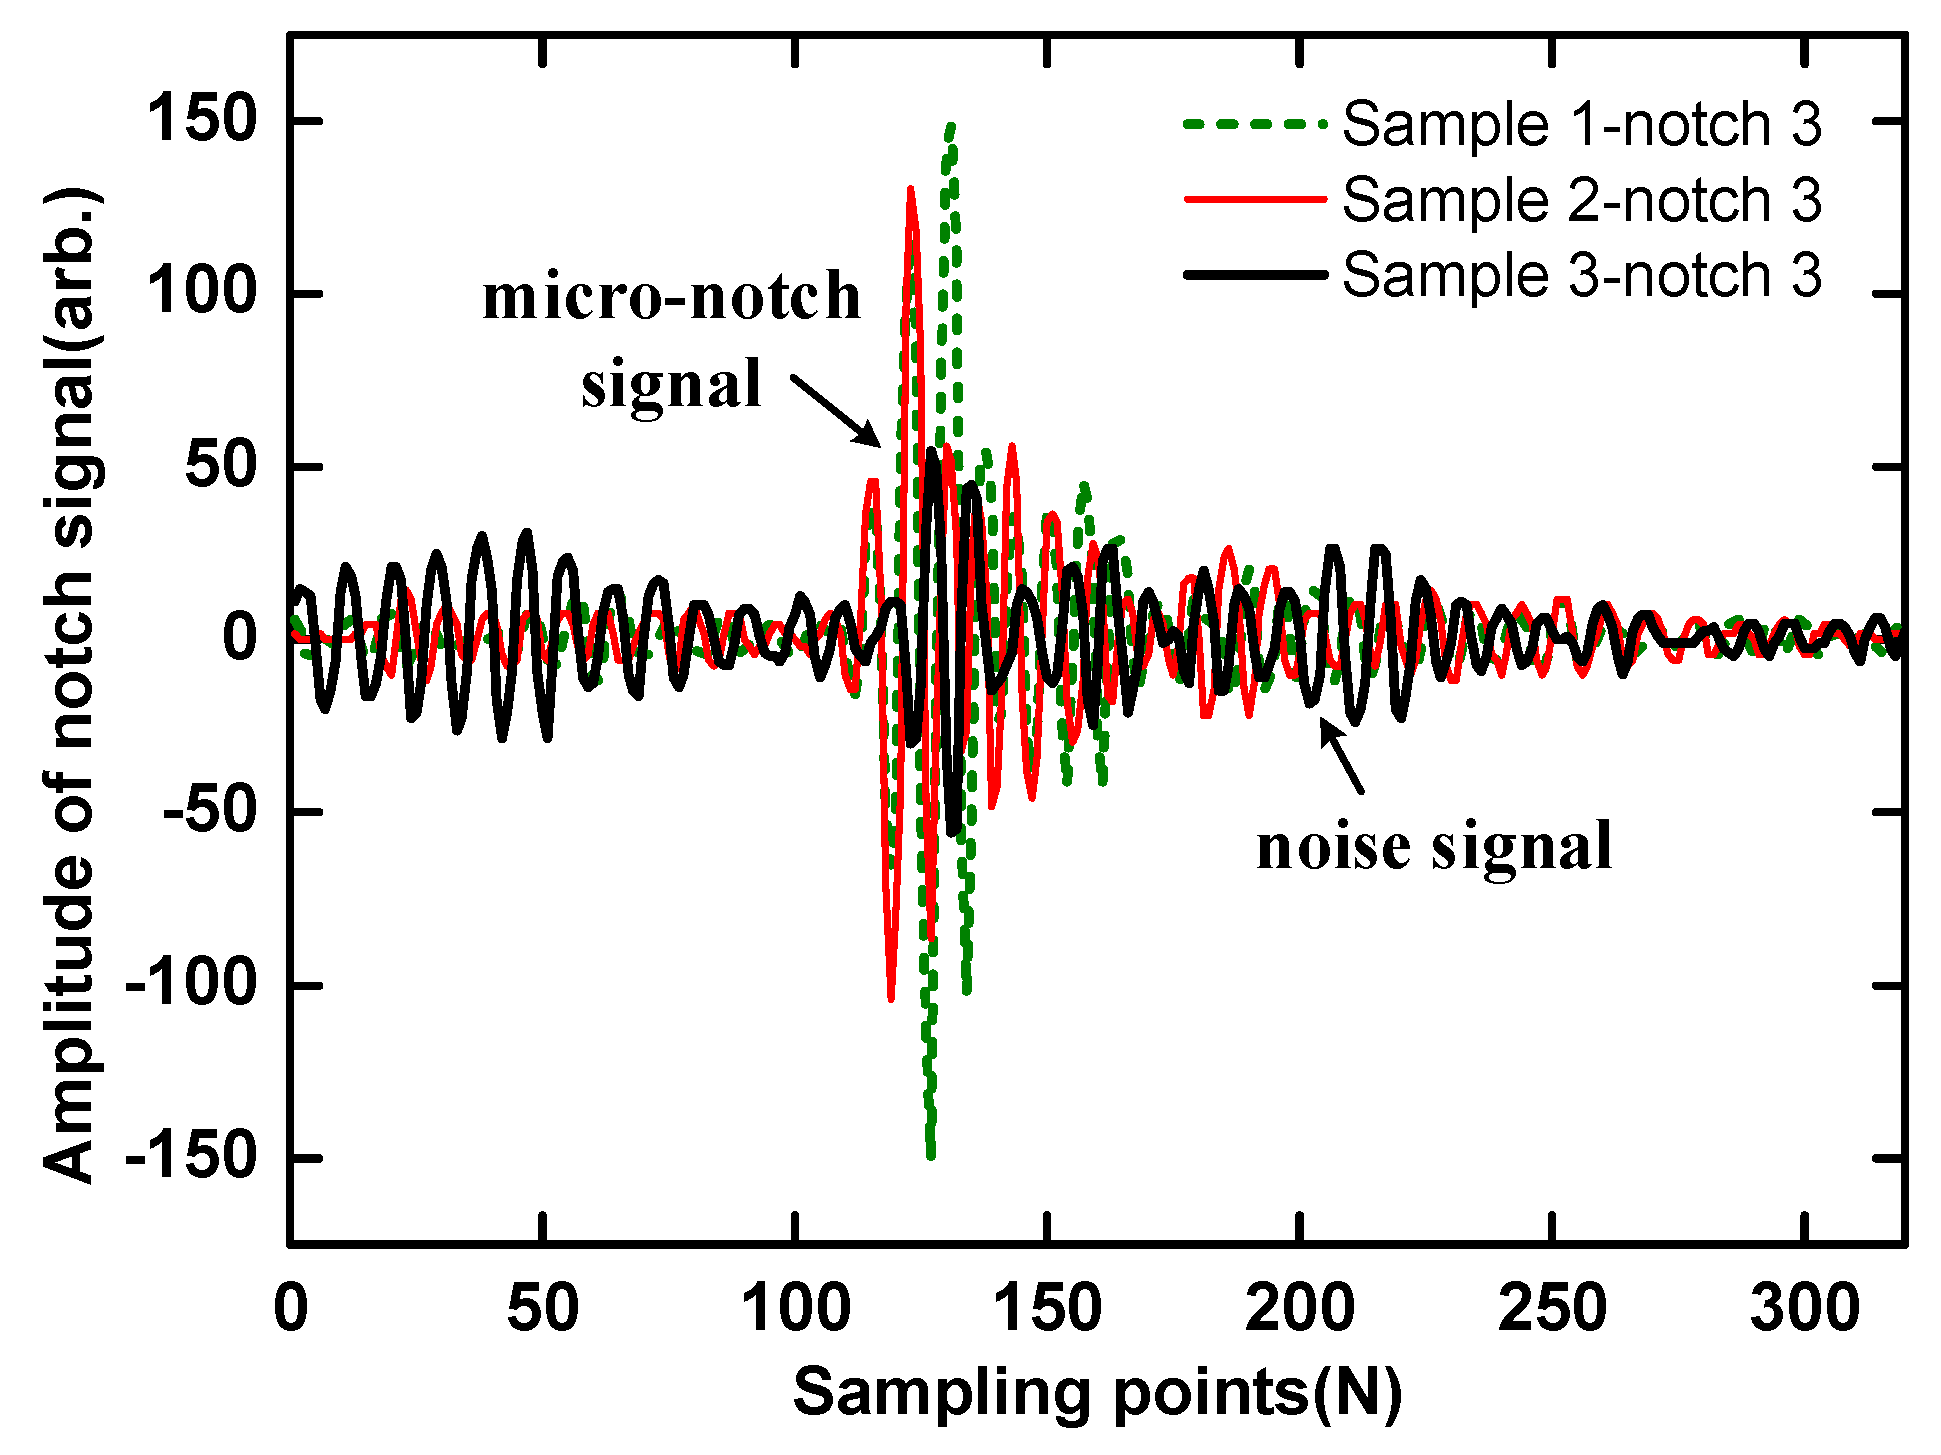
Figure 13.
(a) Normalized mean signal amplitudes of notches reduce as front-surface roughness Ra increases; ‘T’ represents CNC turning, ‘M’ represents vertical CNC milling. (b) The signal amplitude ratio factor (SARF) reduces as front-surface roughness Ra increases.
Figure 13.
(a) Normalized mean signal amplitudes of notches reduce as front-surface roughness Ra increases; ‘T’ represents CNC turning, ‘M’ represents vertical CNC milling. (b) The signal amplitude ratio factor (SARF) reduces as front-surface roughness Ra increases.
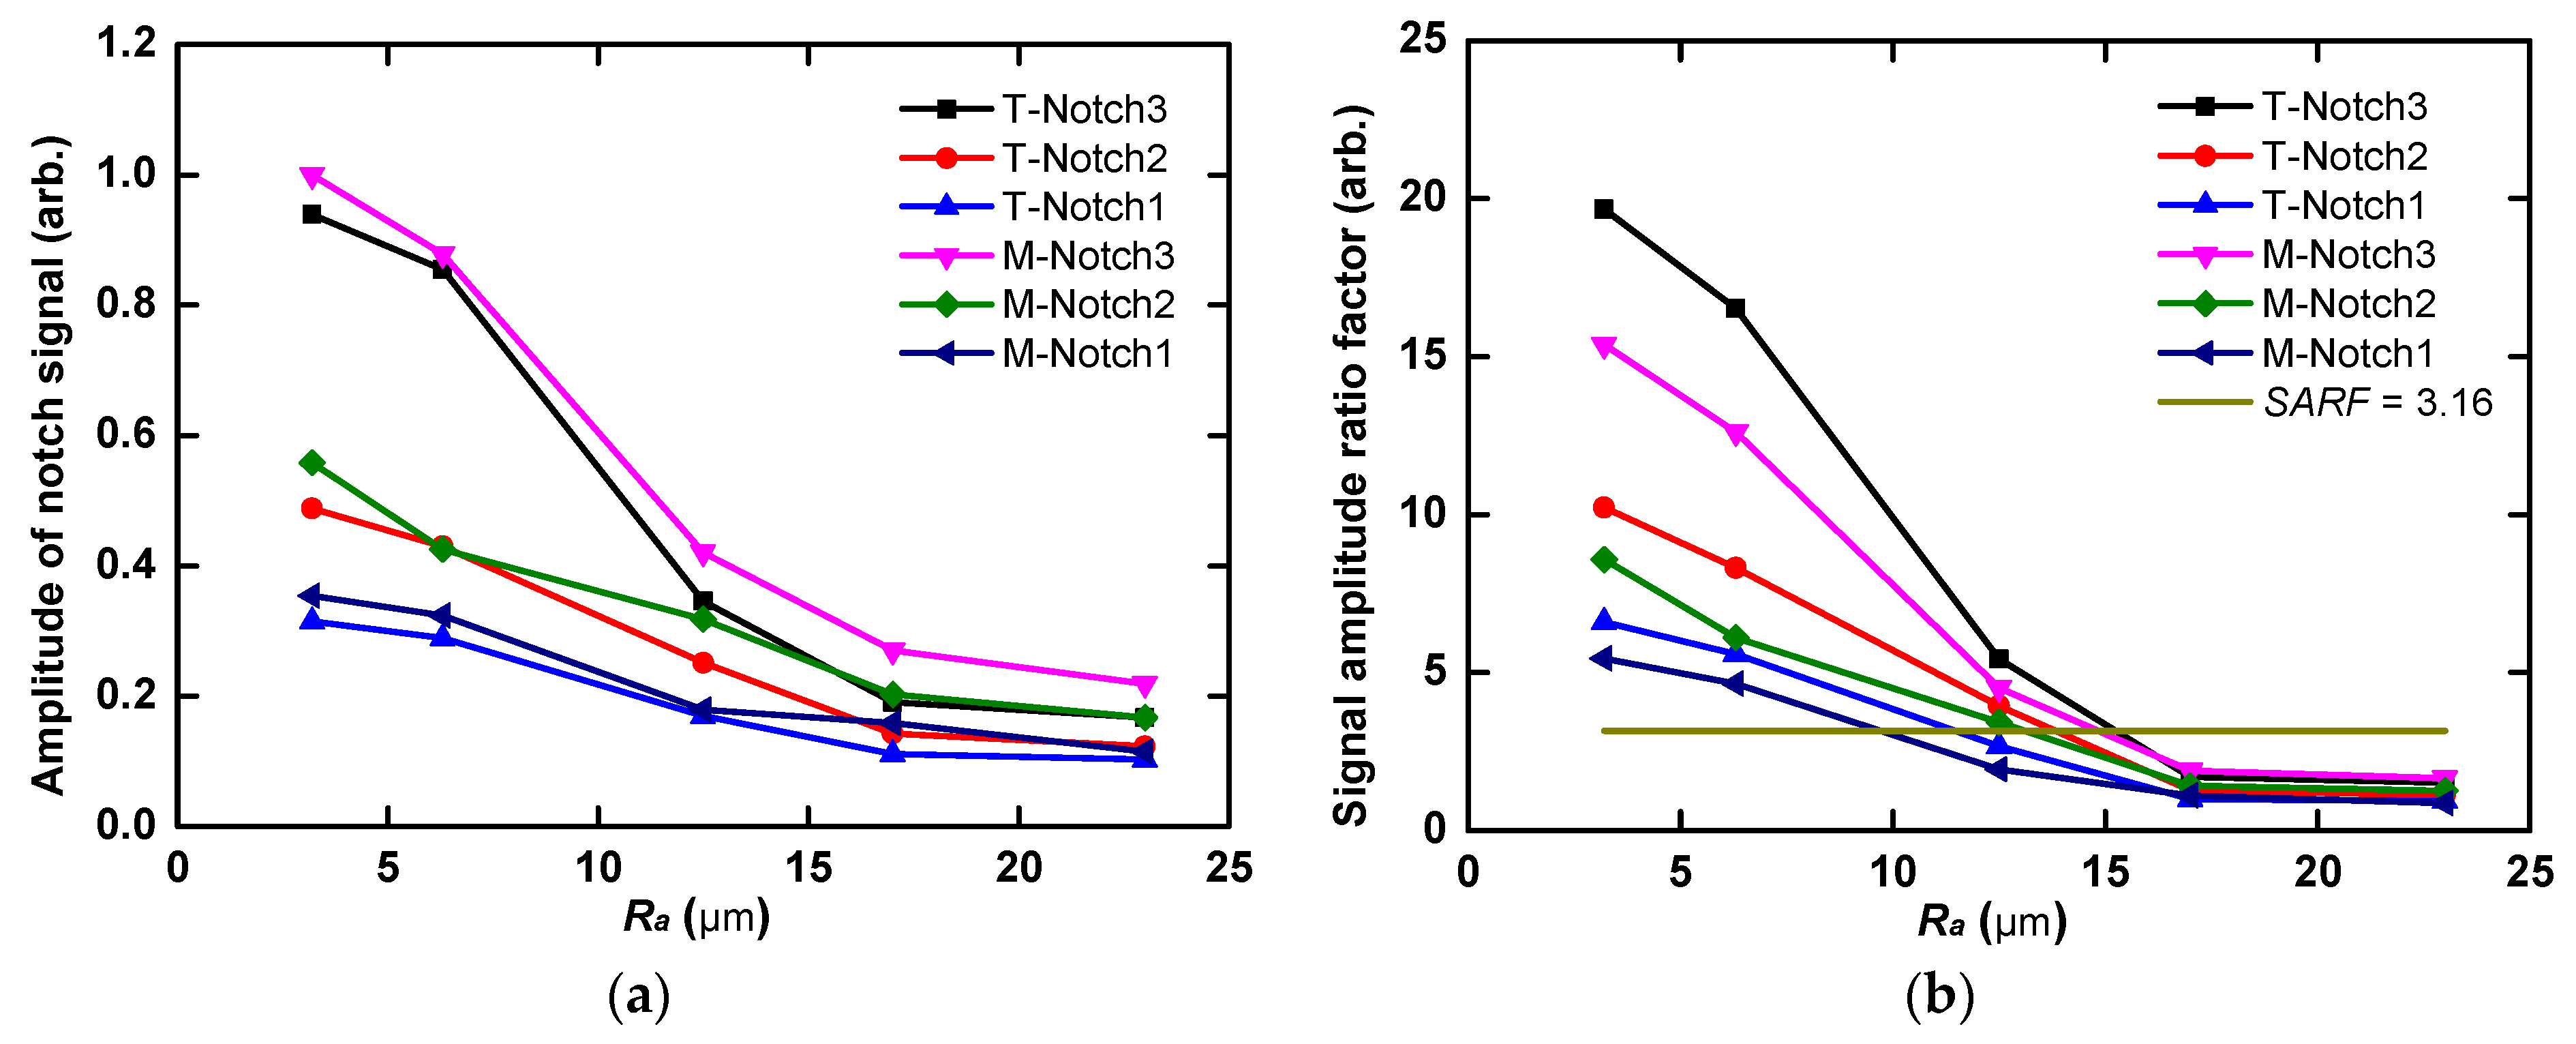
Figure 14.
(a) Normalized mean signal amplitudes of notches reduce as back-surface roughness Ra increases; ‘T’ represents CNC turning, ‘M’ represents vertical CNC milling. (b) The signal amplitude ratio factor (SARF) reduces as back-surface roughness Ra increases.
Figure 14.
(a) Normalized mean signal amplitudes of notches reduce as back-surface roughness Ra increases; ‘T’ represents CNC turning, ‘M’ represents vertical CNC milling. (b) The signal amplitude ratio factor (SARF) reduces as back-surface roughness Ra increases.


Table 1.
Parameters of test samples with rough and smooth surfaces. CNC: Computerized Numerical Control. Ra: the arithmetic average heights of rough surface. Rsm: the horizontal parameter of rough surface.
Table 1.
Parameters of test samples with rough and smooth surfaces. CNC: Computerized Numerical Control. Ra: the arithmetic average heights of rough surface. Rsm: the horizontal parameter of rough surface.
| Processing Method | Sample No. | Ra (µm) | Rsm (µm) | Notch Depth D (µm) | Notch Width W (µm) | Material | ||
|---|---|---|---|---|---|---|---|---|
| 1 | 2 | 3 | ||||||
| CNC turning (Rough surface) | 1 | 3.2 | 1320 | 250 | 150 | 100 | 100 | Q235A Steel |
| 2 | 6.3 | |||||||
| 3 | 12.5 | |||||||
| 4 | 17.0 | |||||||
| 5 | 23.0 | |||||||
| Vertical CNC milling (Rough surface) | 6 | 3.2 | 900 | 250 | 150 | 100 | ||
| 7 | 6.3 | |||||||
| 8 | 12.5 | |||||||
| 9 | 17.0 | |||||||
| 10 | 23.0 | |||||||
| Grinding (Smooth surface) | All samples | 1.6 | 85 | 250 | 150 | 100 | ||
© 2018 by the authors. Licensee MDPI, Basel, Switzerland. This article is an open access article distributed under the terms and conditions of the Creative Commons Attribution (CC BY) license (http://creativecommons.org/licenses/by/4.0/).
Share and Cite
MDPI and ACS Style
Wang, Z.; Cui, X.; Ma, H.; Kang, Y.; Deng, Z. Effect of Surface Roughness on Ultrasonic Testing of Back-Surface Micro-Cracks. Appl. Sci. 2018, 8, 1233. https://doi.org/10.3390/app8081233
AMA Style
Wang Z, Cui X, Ma H, Kang Y, Deng Z. Effect of Surface Roughness on Ultrasonic Testing of Back-Surface Micro-Cracks. Applied Sciences. 2018; 8(8):1233. https://doi.org/10.3390/app8081233
Chicago/Turabian StyleWang, Zhe, Ximing Cui, Hongbao Ma, Yihua Kang, and Zhiyang Deng. 2018. "Effect of Surface Roughness on Ultrasonic Testing of Back-Surface Micro-Cracks" Applied Sciences 8, no. 8: 1233. https://doi.org/10.3390/app8081233
Note that from the first issue of 2016, this journal uses article numbers instead of page numbers. See further details here.