1. Introduction
According to the Korean Statistical Information Service [
1], in 2016, the number of mobile phone subscriptions worldwide had surpassed the world’s population by reaching 7.5 billion subscriptions; the number of mobile subscribers in Korea alone had exceeded 60 million. Furthermore, based on this survey, the risks of smartphone addiction are increasing every year. Owing to the increase in the use of smartphones, the issue of smartphone addiction has become a serious social problem; for example, the emergence of “Smombies” (Smombie is a compound word including smart phone and zombie; it refers to individuals who walk on the road, while looking at their smartphone; because they are immersed in their smart phones, and are not aware of the surrounding environment, and such walking leads to a high risk of accidents.) has taken place. Even with the large number of studies performed in Korea, there is still no appropriate method to solve this addiction problem [
2,
3].
In particular, the data provided by the Korea National Statistical Office (KNSO) and various other studies are primarily based on old research methods such as questionnaires and interviews; these methods lead to inferior analysis results, because they are based on analyses and evaluation of the self-reported data, which can be intentionally manipulated.
Therefore, in recently years, studies using data collected via apps were conducted to analyze patterns of smartphone addiction; however, this method has several restrictions based on the software development kit (SDK) used to develop the app in terms of the analysis of the usage pattern of the app. Nevertheless, using the new approach developed by Park [
4], the phone usage pattern can be easily analyzed by measuring the usage time of the smartphone, time spent using apps by category, and number of times the apps were executed. Furthermore, Lee [
5] compared self-reporting and smartphone usage methods and found that there is a significant cognitive bias between the results of the two techniques. Lee [
6] concluded that smartphone use should be revised to some extent as a measure of addiction, and that smartphone use also plays a role of innocence.
Thus, in this study, we combine both abovementioned approaches; in particular, we use data mining technology to collect data collected via self-reports using a smartphone app called “How often do you use” [
7]. The data mining techniques were used to study the difference in perception and behavior of smartphone use as well as the effect of addiction on learning. In summary, the objectives of this study are as follows:
Understanding the pattern of smartphone usage by collecting long-term smartphone usage data in a manner that cannot be intentionally manipulated;
Identifying the impact of smartphone addiction in a reliable manner;
Identifying the differences between the self-reported data on smartphone usage.
The smartphone industry is growing rapidly with ever increasing options that influence users to follow through with newer adoptions and increased usage. Thus, by analyzing smartphone usage and addiction via unconscious usage pattern collection and data mining techniques rather than the existing survey methods, we can find methods to utilize smartphones efficiently and effectively.
3. Research Method
3.1. Research Method
In our study, we randomly selected 125 students without distinction of major or grade, but most of the selected students attend computer classes. It should be noted that, though it was a relatively small group of participants, it was challenging to manage the large amount of continuously collected real-time data for a month and manually process it; in addition, we checked whether the data collection was being performed appropriately twice every week.
First, the self-report questionnaire was developed based on the SAS developed and standardized by the Korea Informatization Promotion Agency [
15]; in particular, for the implementation and validation of our addiction behavioral study, we used a questionnaire based on six criteria by Griffiths [
16]. Then, the collected data was used to analyze the smartphone usage patterns (SUP) using the “How often do you use” app and analysis program RapidMiner 7.3.
3.2. Self-Report Data Collection
Before collecting smartphone usage data, the KISA [
17] standardized adult smartphone addiction self-diagnosis scale was used as the smartphone addiction self-diagnosis scale in our study. Our questionnaire consisted of four item categories with 15 questions (five, four, four, and two items for daily living disability, withdrawal, other times for tolerance, and virtual world orientation, respectively). Based on the score factors, the results of the questionnaire were classified into high-risk, potential risk, and general use. In addition, based on the study by Griffiths [
16], the smartphone-addiction scale classification was based on the following six criteria: selinenes, mood control, tolerance, conflict, withdrawal, and recurrence.
Table 2 lists the obtained results for self-reported addiction in our study.
Among the total of 125 respondents (including 49% men and 51% women), 28%, 38%, 18%, and 16% of the participants were first-year, second-year, third-year, and final-year students, respectively. Furthermore, the questions were divided into many life-related topics; in particular, questions on social studies, humanities, engineering, natural sciences, medical sciences, and arts/physical education consisted 41%, 27%, 17%, 10%, 2%, and 3% of the questions, respectively.
Our results show that 6.4% of the participants where 9 out of 13 students were female students suffer from smartphone addiction referred to as high-risk use. According to KNSO, in 2016, only 22.5% of the students suffered from smartphone addiction; however, based on our study (which was conducted in 2017), 29.6% of the participating students were part of the smartphone addiction risk and smartphone addiction high-risk user groups, thus showing an increase by 5.1% in smartphone addiction only in one year, indicating the danger of smartphone overuse on the youth.
In particular, grade-specific characteristics with high-risk were observed in the first- and second-year college students. There was no high-risk use for students achieving grade A, but 13.6% of grade B students were at risk for addiction. Thus, by measuring smartphone usage, it is found that students with high class are included in the group with high use of smartphone.
3.3. Real-Time Data Collection and Preprocessing
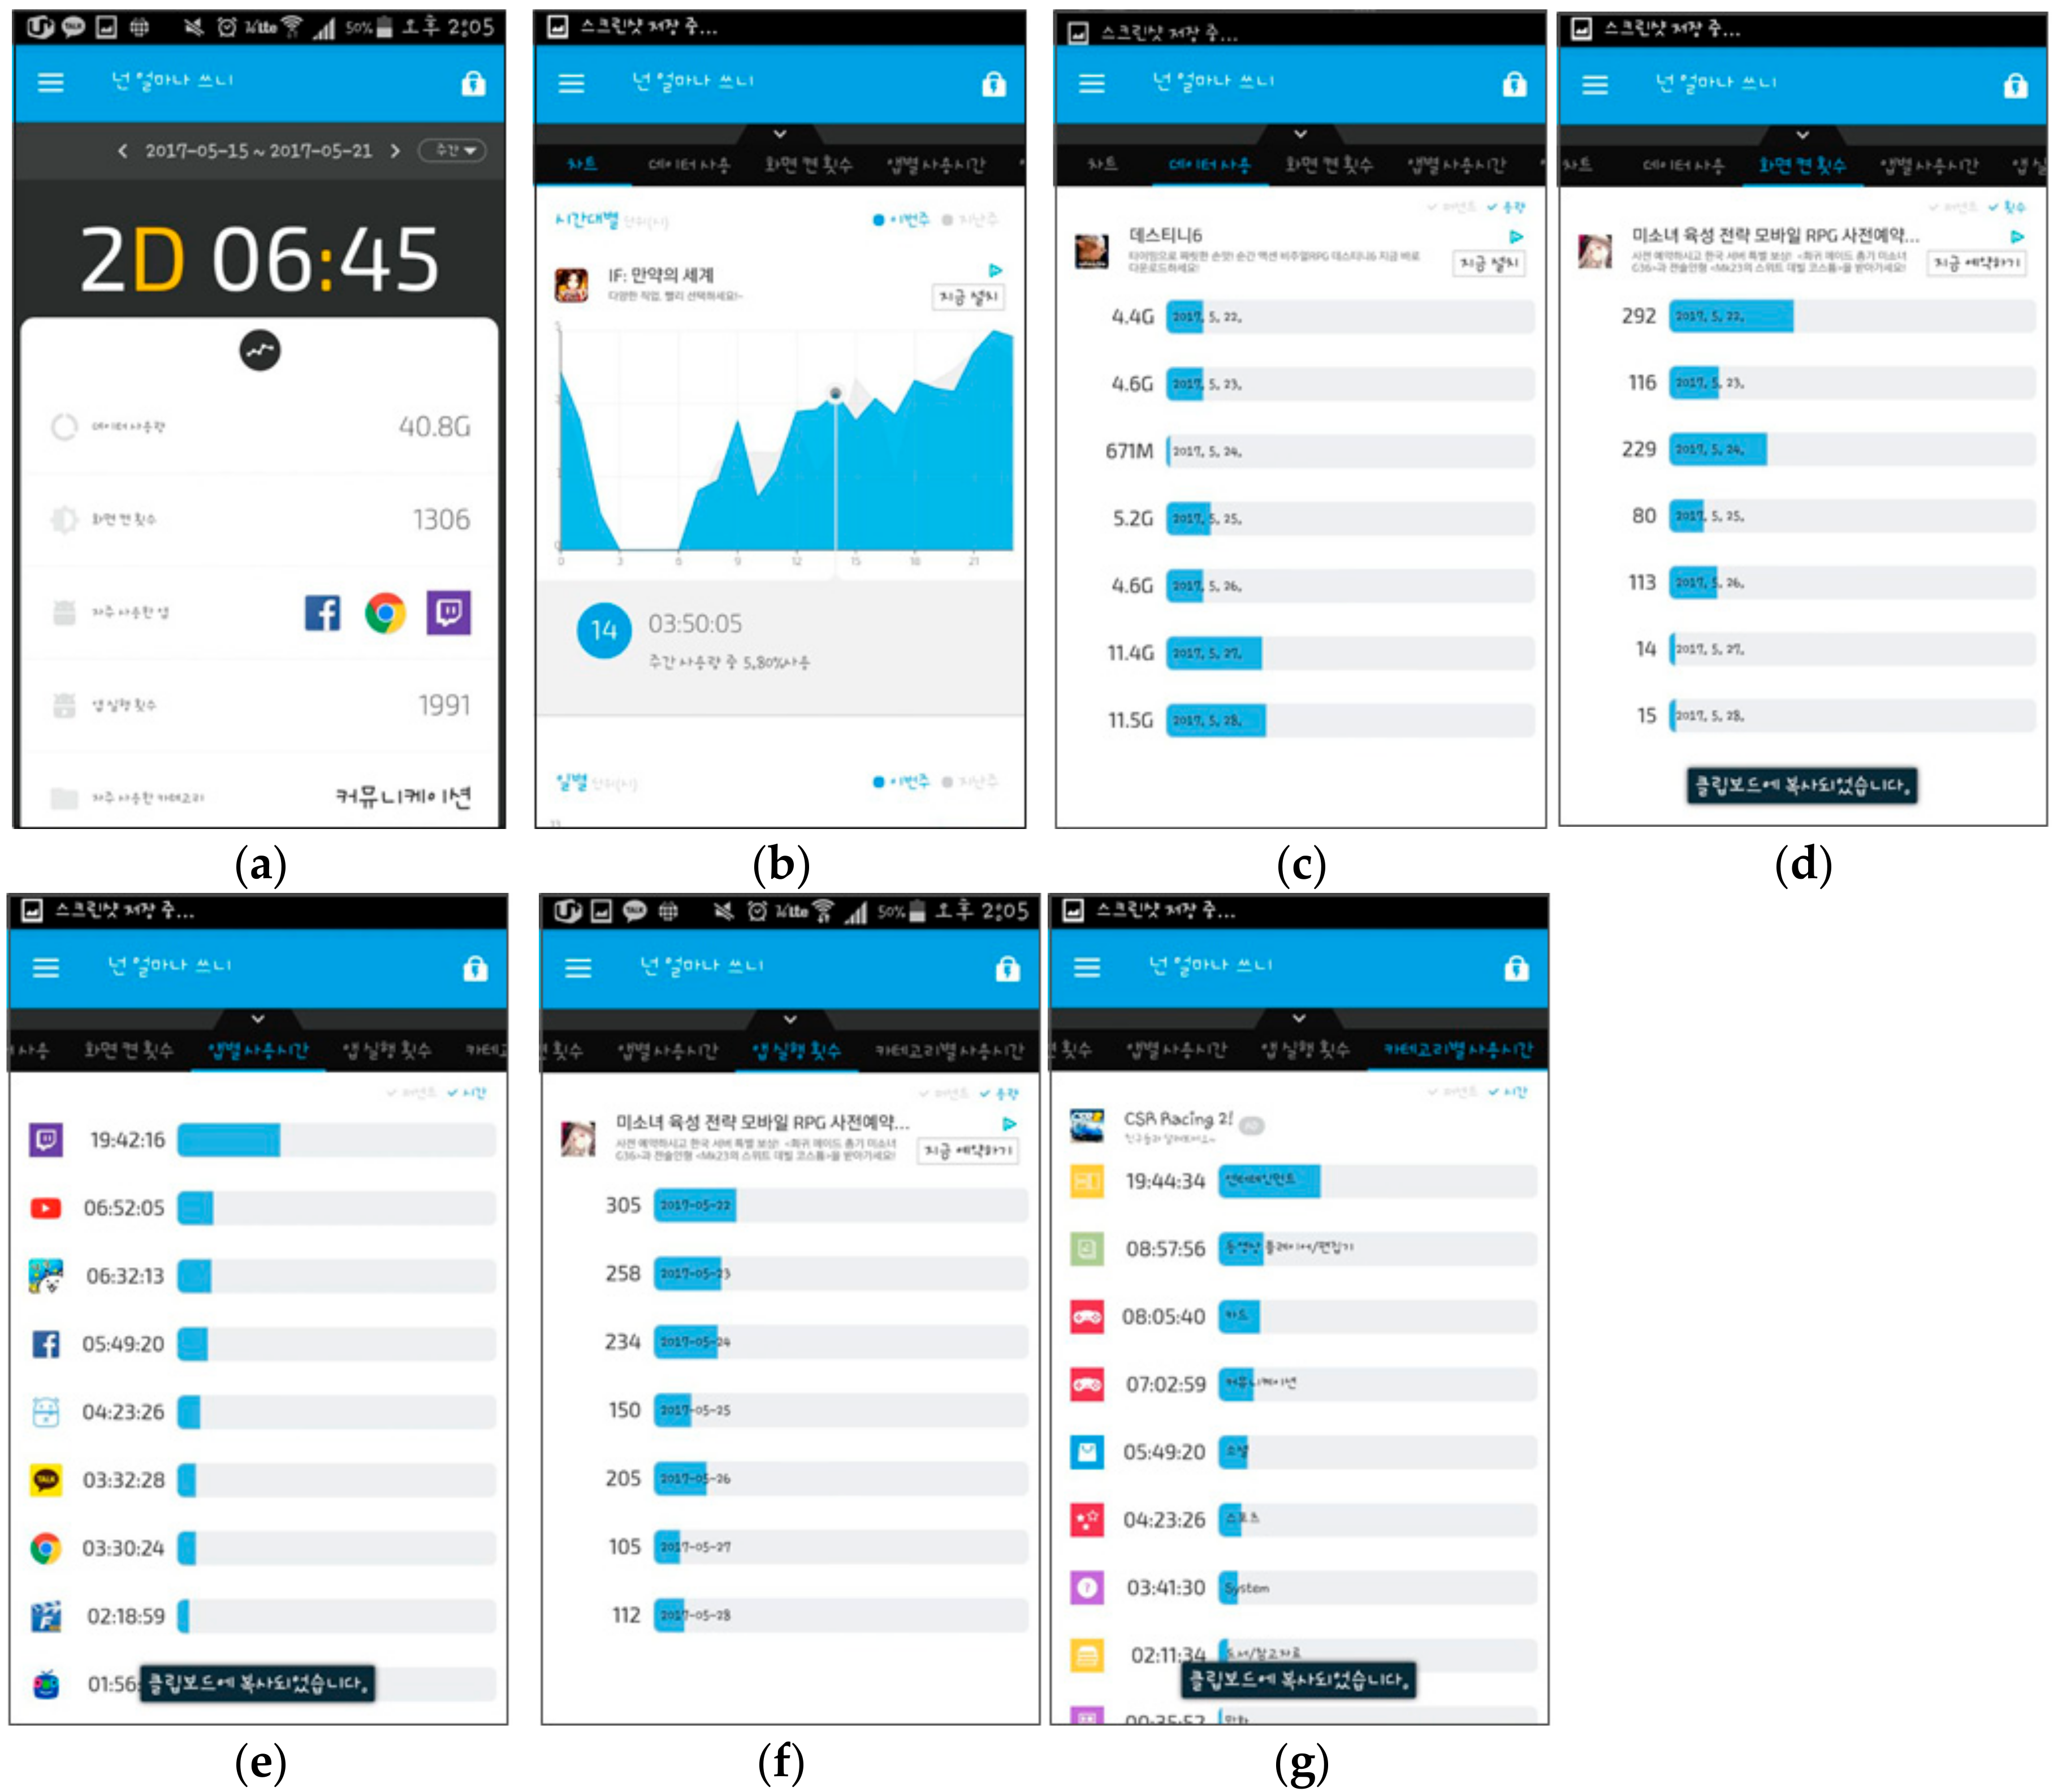
To investigate the patterns of smartphone usage, among the 125 people who participated in the self-report questionnaire study, only 64 participants agreed for data to be collected from their smartphone to measure and analyze their usage patterns in a more effective manner using data mining. In particular, we collected the following data items: total usage time, usage time by day, data usage, number of screen turns, usage time by app, number of executions by app, and frequently used apps. We collected the individual usage data, standardized, and combined the results of addiction on the SAS scale with the final dataset. The data collection lasted for a month (10 April 2017 to 10 May 2017); the recorded measurements are shown in
Figure 1.
4. Data Analysis Based on Data Mining
4.1. Data Mining Model
Data mining refers to the process of discovering useful correlations that are hidden among a large amount of data and extracting that information for future predictions or decision making. Smartphone usage data is an example of such massive data that can be mined for useful correlations.
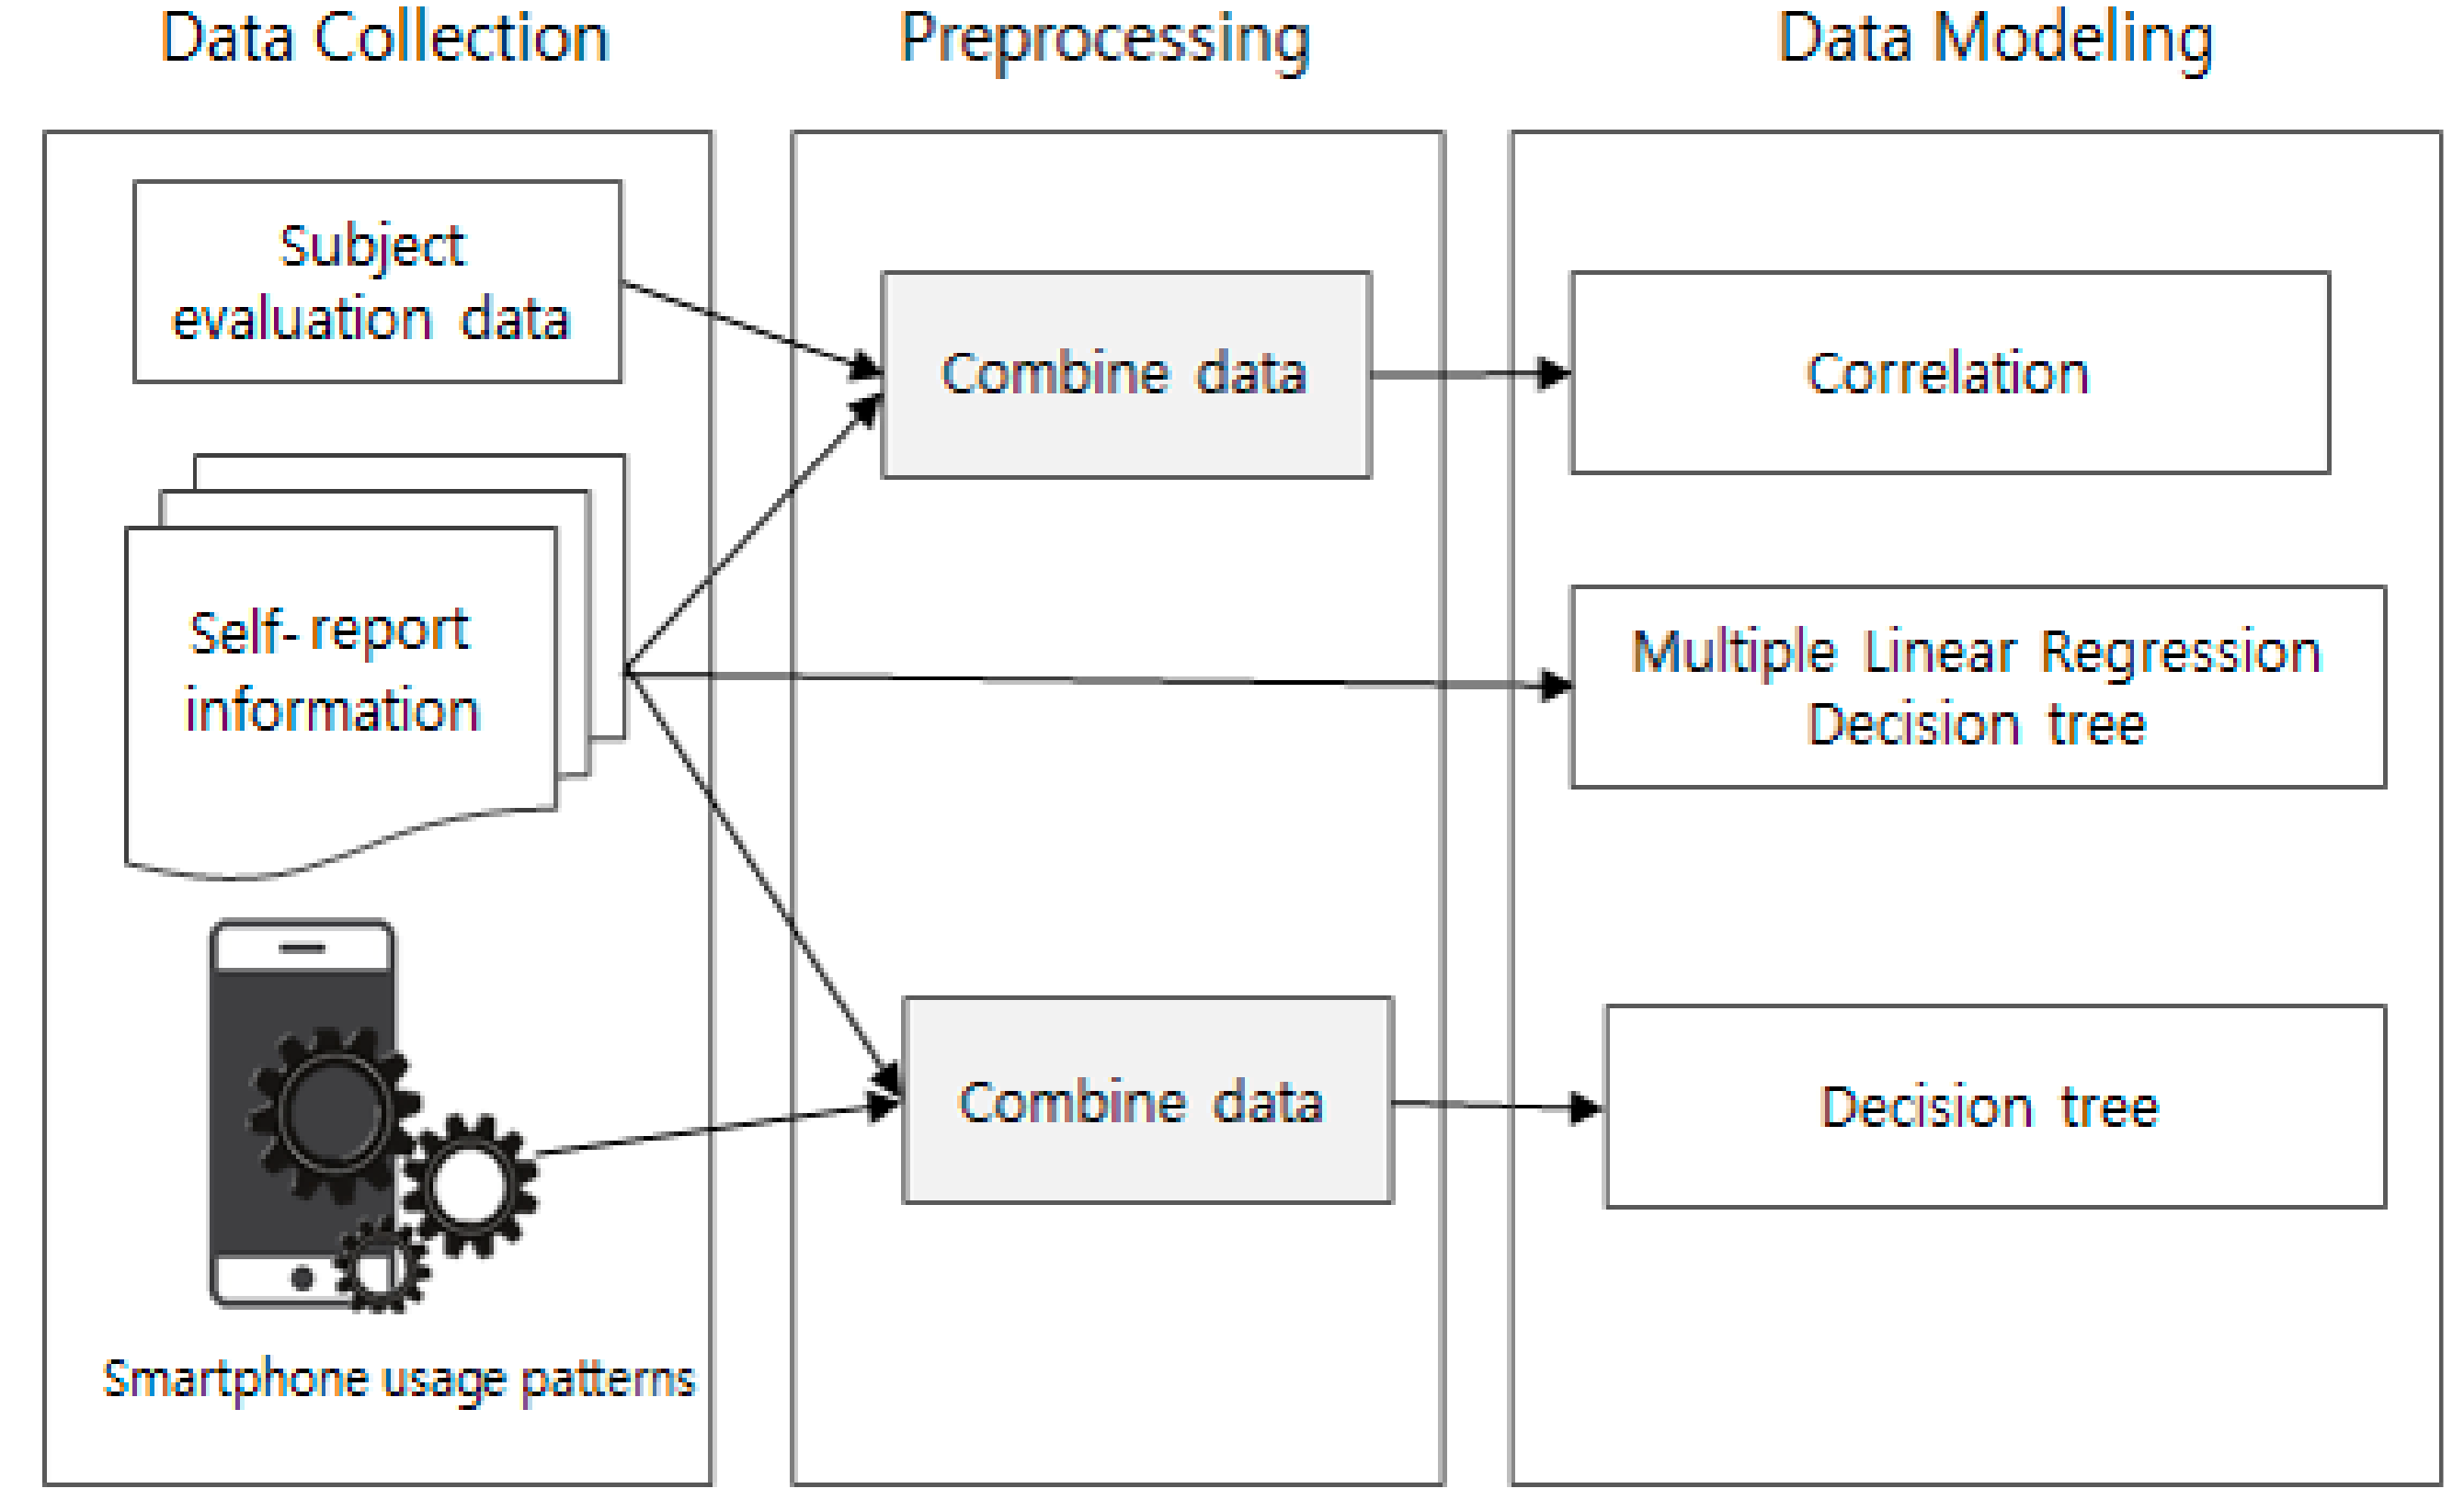
Our research process is depicted in
Figure 2; it involves combining self-reported data (via questionnaires), collected data from users’ smartphones, data mining for analyzing the effect of smartphone addiction on users, and finally, learning achievement.
A decision tree model was used as the data mining model. The purpose of this study was to identify the factors that influence the addiction, rather than determining whether it is the addiction. This factor analysis method is traditionally used in correlation multiple regression, and structural spinning model analyses. However, in recent years, decision tree models have been widely used. This is because decision trees internally use the evaluation criteria such as the information gain concept and the Chi-square test to find important variables. We analyze the relationship between several input variables and dependent variables using decision tree analysis. We also visualize the results as a tree model, so that we can easily understand which factors have a considerable effect on addiction and apply them to decision-making.
4.2. Data Mining for Self-Report Questionnaires
In order to validate the results of our study for behavioral characteristics of smartphone addiction, six criteria were used for the classification of the factors of addiction (salience, mood control, tolerance, conflict, withdrawal, and recurrence) including 3, 3, 2, 1, 2, and 2 items for salience, mood, tolerance, forbidden, conflict, and relapse, respectively.
To investigate the relationship between addiction and the abovementioned six factors, multiple linear regression and a decision support tool (decision tree) were used for classification analysis. Our study involved the following steps; first, for the multiple linear regression analysis, we used the data from the SAS scale measurement results as the dependent variable, whereas, for the independent variable, we utilized the dataset obtained from the questionnaires for action addiction. In order to solve the problem of small dataset observations compared with the independent variables, we used the Bootstrapping operator to increase the number of observations by three times.
Table 3 lists the results of applying the multiple linear regression model with a
p-value 0.05 or less.
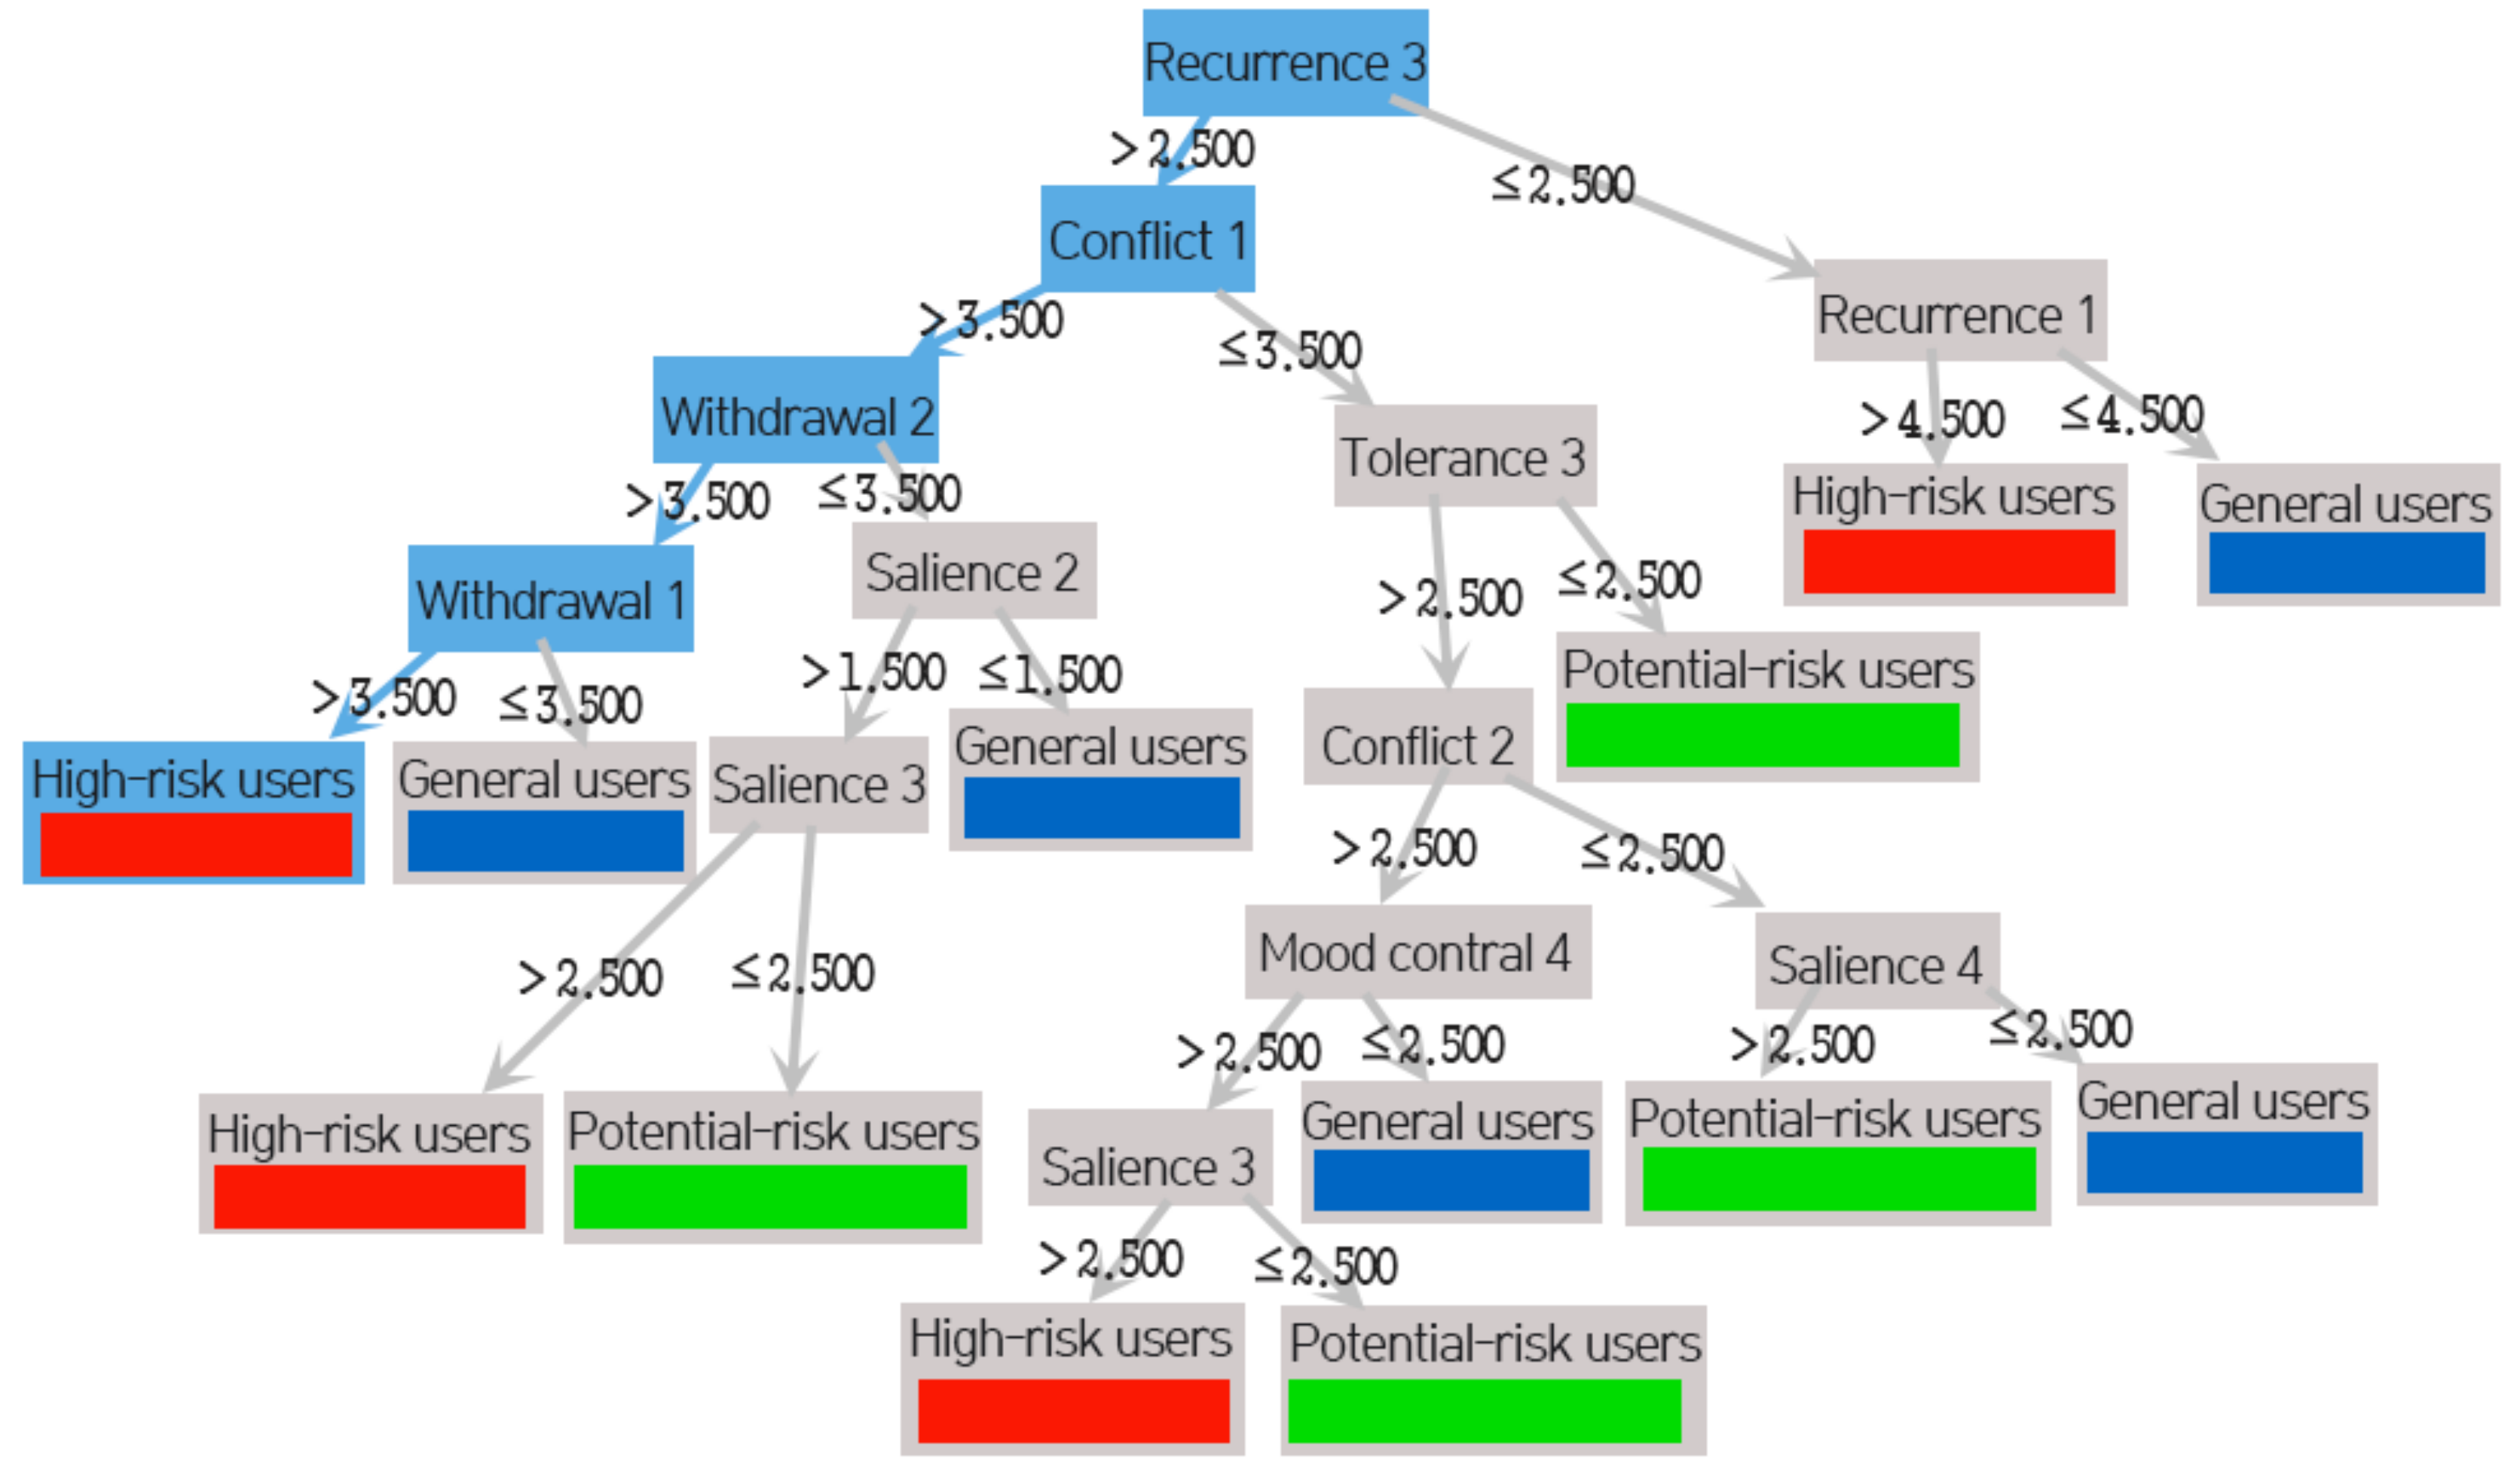
The results of the SAS scale were set as the label, while the attribute variable was set as the questionnaire for behavioral addiction. For the self-report questionnaires, classification analyses were conducted using RapidMiner’s Decision Tree to predict which of the participants’ answers (features) indicate addiction; these results are graphically depicted in
Figure 3.
The high-risk users’ group was further classified into four sub-groups. The first sub-group comprised recurred item 3 and forbidden both items 1 and 2. The second sub-group is same as the first sub-group with relapse in item 3 and conflict in item 1. However, it is a sub-group proceeding with withdrawal item 2, salient item 2, and salient item 3. The third sub-group, similar to the second sub-group, is a sub-group that progresses to relapse in item 3, conflict in item 1, resistant in item 3, conflict in item 2, the mood control in item 4, and salient in item 3. The fourth sub-group is progressing to relapse item 3 and relapse item 1. This is a very important problem for addiction item 3, where users pointed out that they have been using smartphones only from time to time. Therefore, all items from 1 to 5 are essential for addiction measurements. The higher the recurrence rate, the higher the addiction; withdrawal item 1 was the most influential item in our addiction measurement approach.
The decision tree is analyzed as follows. Overall, “recurrence 3” had the greatest impact on high-risk users. Among the 24 items of the questionnaire, it can be seen that items “recurrence 3,” “conflict 1,” “withdrawal 2,” “withdrawal 1,” and “recurrence 1” have an influence on the high-risk user group. Furthermore, items affecting the potential-risk user group are “salience 3,” “salience 4,” and “tolerance 3.” Therefore, we propose that we weight all items according to the items rather than 1 to 5 points equally.
4.3. Data Mining for Smartphone Usage Pattern
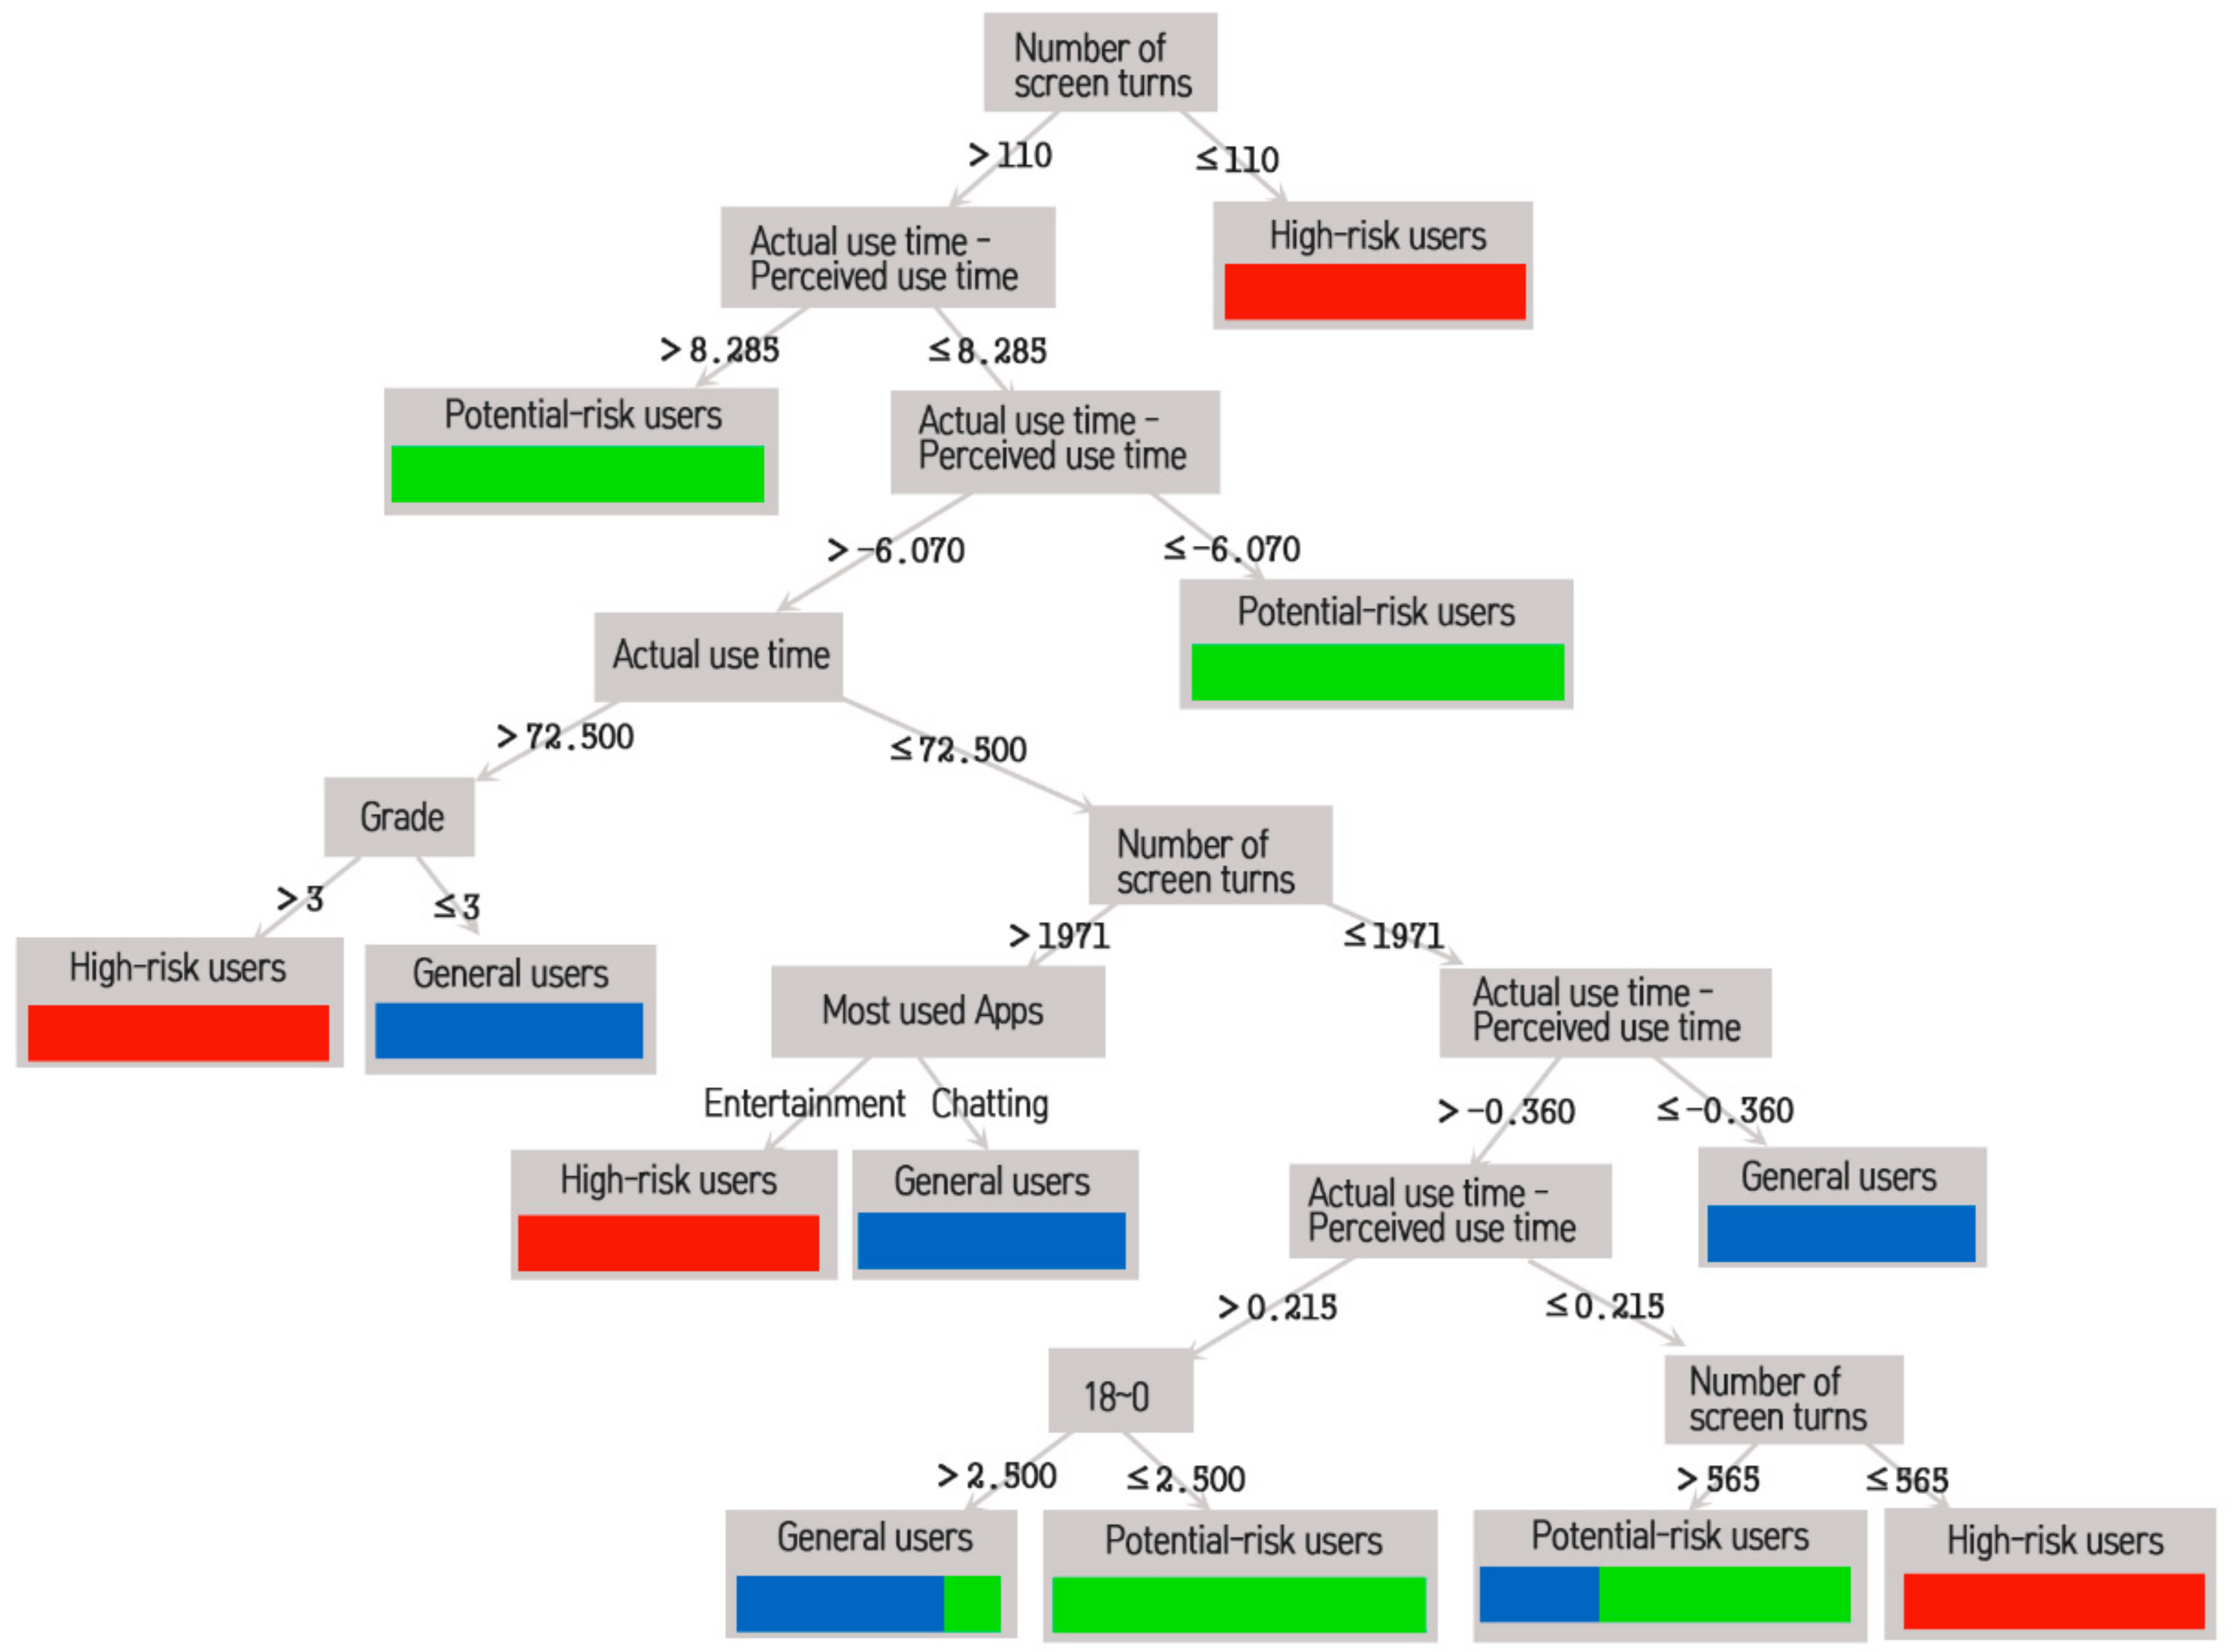
In order to confirm the relationship between addiction and smartphone usage pattern, the classification criterion was analyzed using the gain ratio. For supervised learning, the label variables were assigned to the addiction level. The input variables were demographic characteristics such as gender and grade and usage time of the smartphone (0–6 h, 6–12 h, 12–18 h, 18–24 h). The final result indicates that, among the 64 users who provided accurate data for smartphone usage pattern measurement, 4.7%, 18.7%, and 76.7% of the participants were high-risk, potential-risk, and general or normal smartphone users, respectively; it is evident that the general smartphone users were the majority. The accuracy of our prediction was 89.7% as listed in
Table 4.
The decision for the individuals to be grouped in the high-risk user group was made based on the following points. First, the screen is turned on for more than 110 times per day. Second, users spent more than 6.07 h and less than 8.29 h per day, while they spent more than 72.5 h per week using their smartphone. In particular, the third-grade students are smartphone-addicted, for whom, the results show that their phone screen was turned on more than 1971 times and most of their time is spent on entertainment applications. For the risk group, the usage time was less than 0.215 h and the number of the times the screen was turned on was less than 565 times; therefore, The input variables that have the greatest influence on the high-risk user group are the “number of screen turns” and the “actual use time—use time” variable. These results are shown in
Figure 4.
The results of applying the decision tree using the app are as follows. As the ‘Number of screen turns” variable increases, the higher-risk users increase. In addition, “Entertainment” and “Actual use time” variables belonged to high-risk users. The greater the difference between the actual use time and the cognitive use time, the more potential-risk users were. In the existing studies, the cases where the usage amount was high were found to be addictive; however, the new variables influencing the addiction were found. In addition, the addicts found that there was a large difference from the actual use time than the perceived use time. The high-risk users did not recognize the use of smartphones.
5. Conclusions
In this study, we analyze the problem of smartphone addiction by applying a new technology using smartphone apps data. In particular, the difference between the current study and previous studies is that most of the existing studies were based on self-reporting surveys; thus, their results were not always satisfying owing to possible intentional manipulation or bias. Therefore, in this study, we analyzed smartphone usage patterns by combining both the self-reporting method and data mining techniques for more accurate results.
Our results show that 6.4% of the participants where 9 out of 13 students were female students suffer from the smartphone addiction—high-risk use. In 2016, according to the National Statistical Office (NSO), only 22.5% of the students suffer from the smartphone group addiction, which is 158 based on our result (conducted in 2017), whereas 29.6% of the participating students suffer addiction from the 159 smartphone addiction risk group and smartphone addiction high-risk user group, which has 160 increased by 5.1% in only one year showing the danger of the overuse of smartphones on the youth.
In addition, there was a considerable difference between the results of our study and the previous studies in terms of smartphone overuse. In 2016, the average weekly smartphone usage was 8.29 h; however, based on our obtained result, the average smartphone usage time is more than 6 h per day. In addition, most of the users turn on their smartphones more than 300 times unconsciously; more than 50% of the respondents said that they spend more than half of the day using smartphones either for learning or getting assistance in their daily lives. Thus, though smartphones seem to be an essential tool, their use also needs to be well-controlled.
The self-reported questionnaire was classified into 13 items based on six criteria developed as the addictive scale for the behaviors of overuse. In this study, we used multiple linear regression analysis and decision tree analysis to determine which six factors are highly correlated with addiction.
The following results were obtained. First, the higher the “recurrence,” the higher the addiction, and the higher the risk users, the higher the “withdrawal,” “conflict,” and “salience” order. Second, “salience” was the highest for potential-risk users and some “tolerance” items were included. Third, as a result of applying the variables that may affect the addiction, the higher the number of screen turns, the greater the difference between the actual use time and the perceived use time, the higher the risk users. Fourth, potential-risk users have a large difference in “actual use time—perceived use time.” Fifth, the high-risk users were unable to identify the actual smartphone usage time.
Therefore, the results can be analyzed as follows. First, it can be interpreted that the variables “number of screen turns” and “actual use time—perceived use time” are more influential on poisoning than the previous research that used the smartphone as poisoning. Second, we propose that we weight all items according to the items rather than 1 to 5 points equally. Third, in the existing research results, the more the amount of usage and the time of use, the more detailed the factors and variables than the simple result of addiction.
This study has a limit of 125 in the experimental group; thus, it is necessary to add more experimental groups. In the future, by combining the self-report methods and use of smartphone data and analyzing it using data mining, we can also analyze the danger of overuse, such as depression, anxiety, stress, self-esteem, and emotional regulation.


