Article

Temperature Comparison of Looped and Vertical Carbon Nanotube Fibers during Field Emission

1
Department of Electrical and Computer Engineering, Michigan State University, East Lansing, MI 48824, USA
2
Materials and Manufacturing Directorate, Air Force Research Laboratory, WPAFB, OH 45433, USA
3
Directed Energy Directorate, Air Force Research Laboratory, Kirtland Air Force Base, NM 87117, USA
4
Department of Nuclear Engineering and Radiological Sciences, University of Michigan, Ann Arbor, MI 48109, USA
*
Authors to whom correspondence should be addressed.
Appl. Sci. 2018, 8(7), 1175; https://doi.org/10.3390/app8071175
Submission received: 14 June 2018 / Revised: 14 July 2018 / Accepted: 15 July 2018 / Published: 19 July 2018
(This article belongs to the Special Issue Field Emission from Graphene and other Nanostructures)

Abstract

:
Carbon nanotube (CNT) fiber-based emitters have shown great potential to deliver stable, high current beams for various potential applications. Because of joule heating, CNT field emitters are heated to high temperatures during field emission. It is important to improve the thermal management of emitters to increase their reliability and prevent premature failure. This paper compares the field emission characteristics and the temperature distribution of a new configuration of a looped CNT fiber emitter with a traditional single vertical CNT fiber emitter. It is found that the maximum temperature of the looped fiber emitter (~300 °C) is significantly reduced compared to that of the vertical fiber (~600 °C) at the same emission current of 3 mA. The experimentally measured temperature distribution is compared with a recent theory on joule heating of a one-dimensional conductor. This study provides new insights into the design of high performance field emitters.

1. Introduction

Carbon nanotube (CNT) fibers [1,2,3,4,5,6,7,8,9,10,11,12] have demonstrated significant promise as field emission (FE) cathodes due to their large aspect ratios and high electrical and thermal conductivities. They can potentially be used as FE cathodes in a wide range of applications, including compact radiation sources [13,14,15,16], electron guns for ring and linear accelerators [17], and vacuum nanoelectronics [18,19,20,21,22]. CNT fibers are also extremely flexible [5,12] and do not lose conductivity when bent [5]. This allows for their arrangement in various cathode geometries other than the typical free standing vertical emitter.
CNT fiber emitters are typically mounted vertically on a substrate [3,5,6] in order to take advantage of the high field enhancement factor due to their high aspect ratio. The tips of the fibers are cut either mechanically or by a laser [23]. The mechanically cut tips usually introduce rough edges with dangling fibrils (Figure 1). Laser cutting largely reduces the tip roughness, however, the fiber tips are still spread out at the edge. These rough edges and tip spread out are undesirable. They lead to non-uniform emission and uneven temperature distribution and hotspots at the fiber tip. To avoid these problems that are introduced by the fiber tips, we take advantage of the high flexibility of the CNT fiber to form an emitter by looping it (Figure 2), where electron emission occurs from a well-rounded fiber loop, instead of a rough tip edge.
Another issue with vertical fiber emitters is their limited heat conduction and poor thermal management because of the single contact point to the cathode base (Figure 1 and Figure 2a). In order to produce stable, high current beams, it is important to develop cathodes with improved thermal management properties, including reliable thermal stability, better thermal conduction and circulation, and reduced temperature during current emission. Despite their exceptional thermal conductivity, the maximum temperature of individual CNT field emitters can reach 2000 K near the emitter tip during field emission [24,25] because of joule heating. For CNT fiber based cathodes, a temperature of >500 ° C can be reached routinely during mA level current emission [3,23,26]. The high temperature could potentially increase the resistance of the emitter, degrade the performance of the emission, limit the stability and reliability, and eventually lead to the failure of the field emitters [26,27]. It is thus highly desirable to explore a new configuration of CNT fiber emitters with better thermal handling capabilities. A looped fiber emitter is one such candidate since it provides an additional heat conduction path to the cathode base (Figure 2b).
There are ongoing efforts to better understand the heating and temperature distribution of CNT fiber field emitters, including direct Infrared (IR) imaging [23], a multiscale model of heat dissipation [26], coupled electrical-thermal conduction with the effects of temperature dependent electrical and thermal conductivities [27], morphology dependent field emission [3], and the effects of contact resistance [6,28]. In this paper, we study field emission from a looped CNT fiber emitter and compare the temperature distribution with a single vertical CNT fiber emitter (Figure 2). Because of the additional heat conduction path to the cathode base, the looped emitter is expected to reach a lower temperature during field emission. Direct IR imaging shows that the maximum temperature of the looped fiber (~300 ° C ) is significantly lower than that of the vertical fiber (~600 ° C ) at the same emission current of 3 mA. The experimentally measured temperature distribution is compared with the recent theory on joule heating of a one-dimensional conductor [27]. The work represents a new development of high performance field emitters.

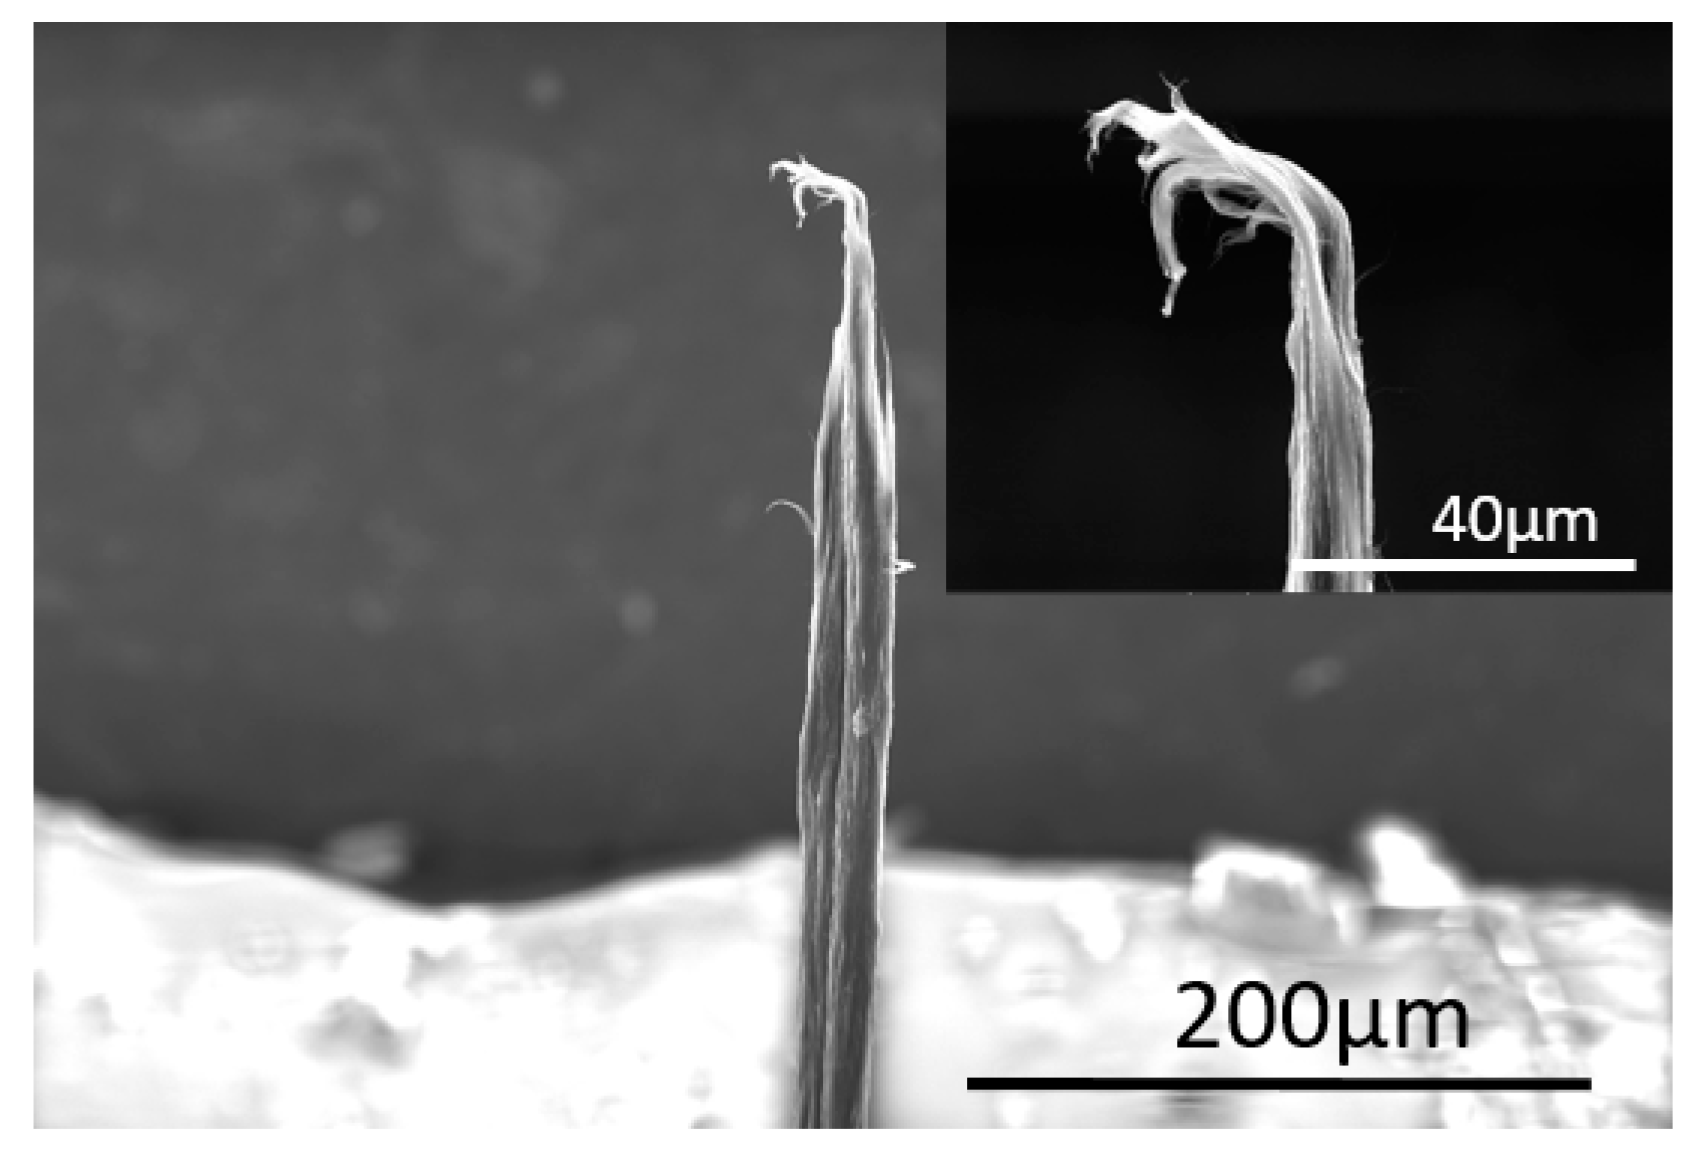
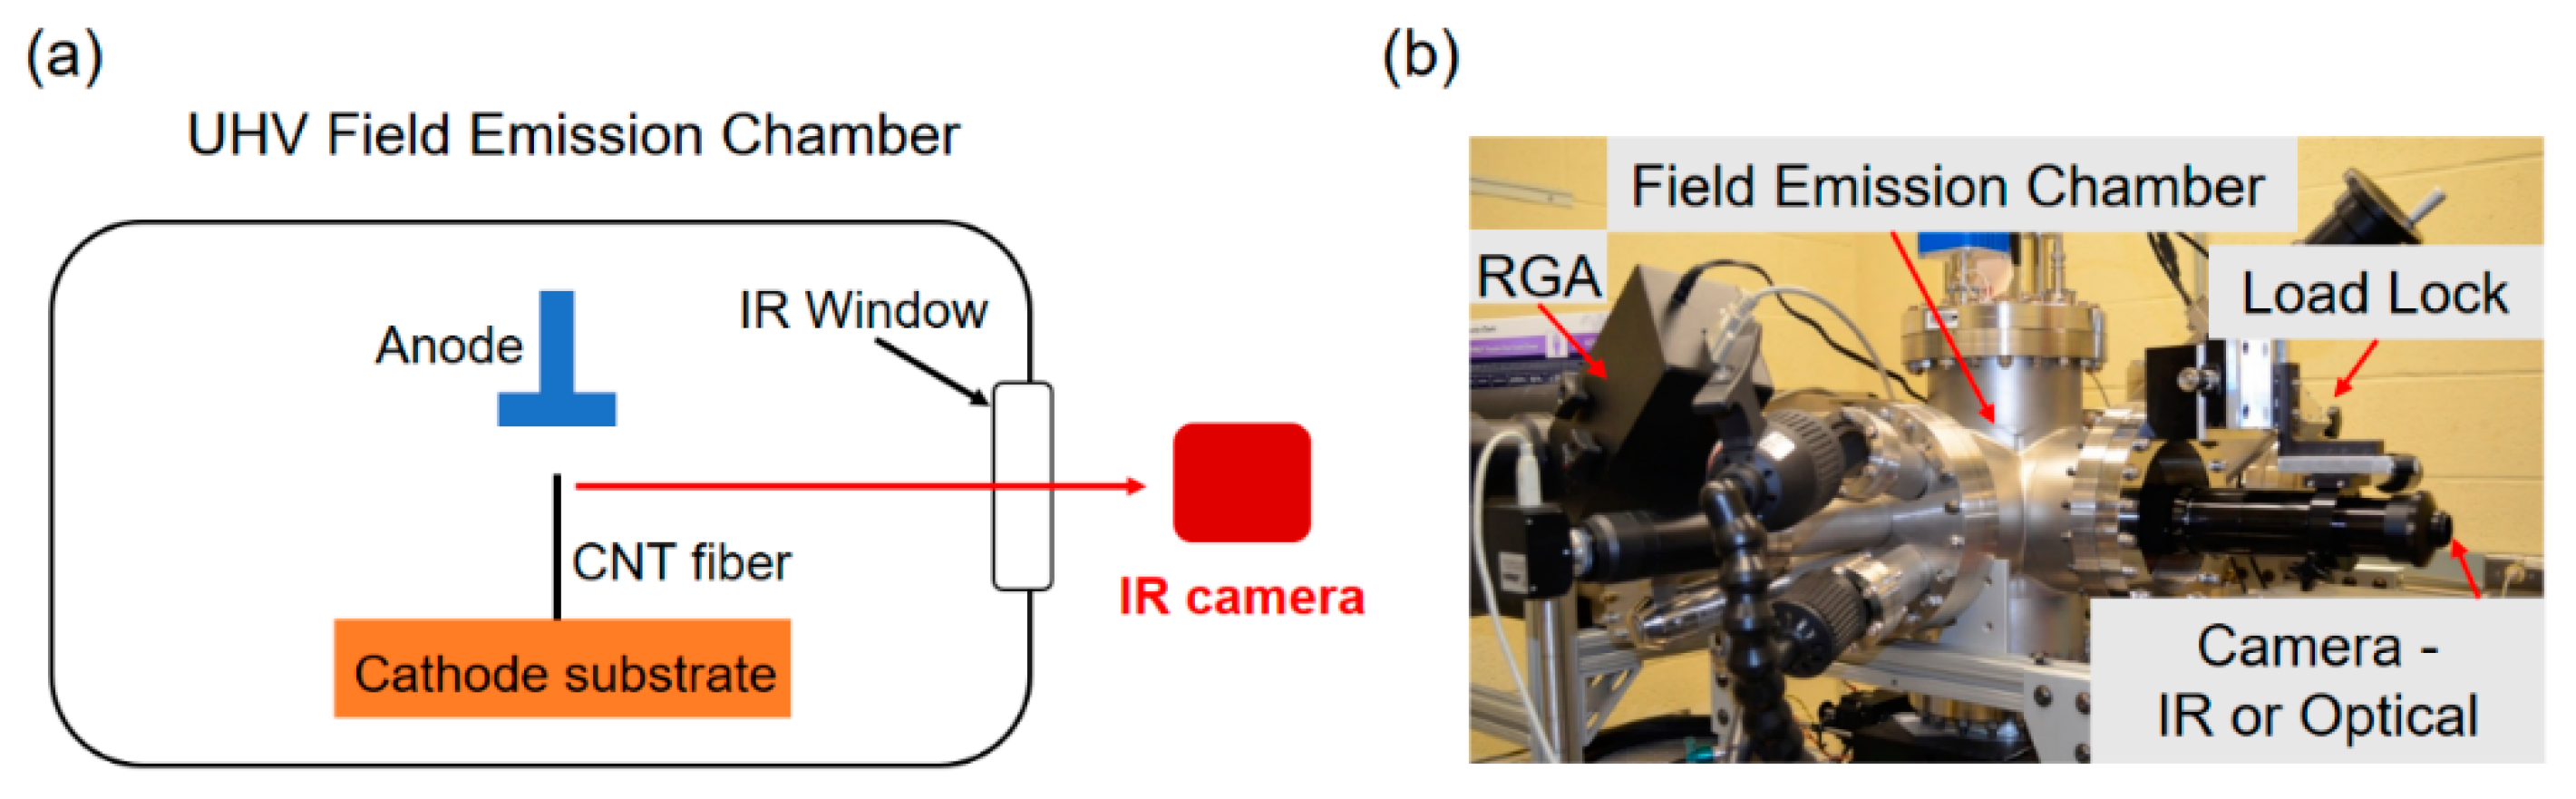
2. Experimental Methods

The CNT fibers were fabricated from concentrated dispersions of CNTs via a wet spinning technique [5]. Prefabricated CNTs were dissolved in a superacid at a concentration of 2–8 wt % and were filtered to remove particles in order to form a spinnable liquid crystal dope. This ordered CNT dope was extruded through a spinneret (65–130 μm diameter) into a coagulant (acetone or water) to remove the acid in a controlled fashion to produce continuous lengths of macroscopic neat CNT fibers. The spun fibers exhibited very high nanotube packing density and alignment [5]. The fibers were comprised of primarily double walled CNTs with an uncontrolled distribution of chiralities and types (metallic versus semiconductors), with a diameter of ~2.4 nm and an aspect ratio of ~2600–2800 [29]. Tsentalovich et al. have shown that CNT aspect ratio and purity are important for obtaining CNT fiber with good electrical and mechanical properties [29]. Additionally, improved CNT alignment and packing density in the CNT fibers has shown to lead to improved field emission performance and cathode lifetime [3].
The 3 Omega method was used to measure both the thermal (κ) and electrical (σ) conductivities of the fiber samples. This is detailed in Reference [3], however it is described here briefly for completeness. The sample was prepared by placing four silver epoxy contacts (EPO-TEK H20) in-line on a sapphire substrate (approximately 1 mm apart and 1 mm high). The substrate was mounted in a vacuum micro probe station with temperature control (MMR Technology Micro Probe chamber, 1 × 10⁻⁸ Torr). The fiber was placed on top of the electrodes to form a 4-point probe electrical conductivity configuration.
Due to the temperature coefficient of the resistivity of the fiber, a voltage change is induced when the temperature of the fiber varies with the frequency and the amplitude of the current. Electrical conductivity measurements utilize the 1st harmonic with the current that is low enough to prevent Joule heating, and thermal conductivity measurement utilizes the 3rd harmonic with a high current to induce Joule heating [30].
FE measurements were performed in a custom designed ultra-high vacuum (UHV) chamber in a background pressure of 5.0 × 10⁻⁹ Torr in a diode configuration, as shown in Figure 3. The CNT fibers were mounted with silver paint between 20 mm × 5 mm × 1 mm Cu tabs stacked together to make a block sample base. The CNT fiber emitters are prepared in two configurations: a single fiber standing vertically on the substrate, and a fiber loop with both ends attached to the substrate, as shown in Figure 2. To maintain the same height from the Cu cathode base, the CNT fiber used for the looped emitter is cut slightly longer than twice the length of that for the vertical emitter. To form the looped emitter, one end of the longer CNT fiber was mounted on the Cu base with silver paint first, the other end was then secured on the Cu base to have about 2 mm separation between the two ends. In both cases, the average diameter of the fiber is 21.3 μm, and the height of the emitter is approximately 4 mm. A stainless steel anode probe tip (7 mm diameter) was aligned with the CNT fiber emitter. The anode-cathode substrate gap distance is adjusted for each configuration to keep 3 mA emission current. The single and loop fiber has the gap (from the emitter apex to anode) at 1.5 mm and 2 mm, respectively. A Keithley 2410 sourcemeter was used for providing voltages up to 1 kV and measuring the current. During FE measurements, the voltage was ramped up from 0–1 kV at 1 s per volt.
Thermal images were captured through an Infinity K2 long-distance microscope with a Xenics Xeva 640 InGaAs array camera with a resolution of 640 by 512 pixels and an optical response between 900 nm and 1.7 μm, as shown in Figure 3. The integration time that was used to capture the images was 2 ms, and the InGaAs sensor was cooled to −10 °C. To obtain the fiber temperatures, a calibration was performed at multiple integration times using the Xenics camera and the Infinity long-distance microscope against a blackbody source. Post-processing the captured images against the calibration data produced temperature information for the points along the length of the fibers.

3. Results and Discussion

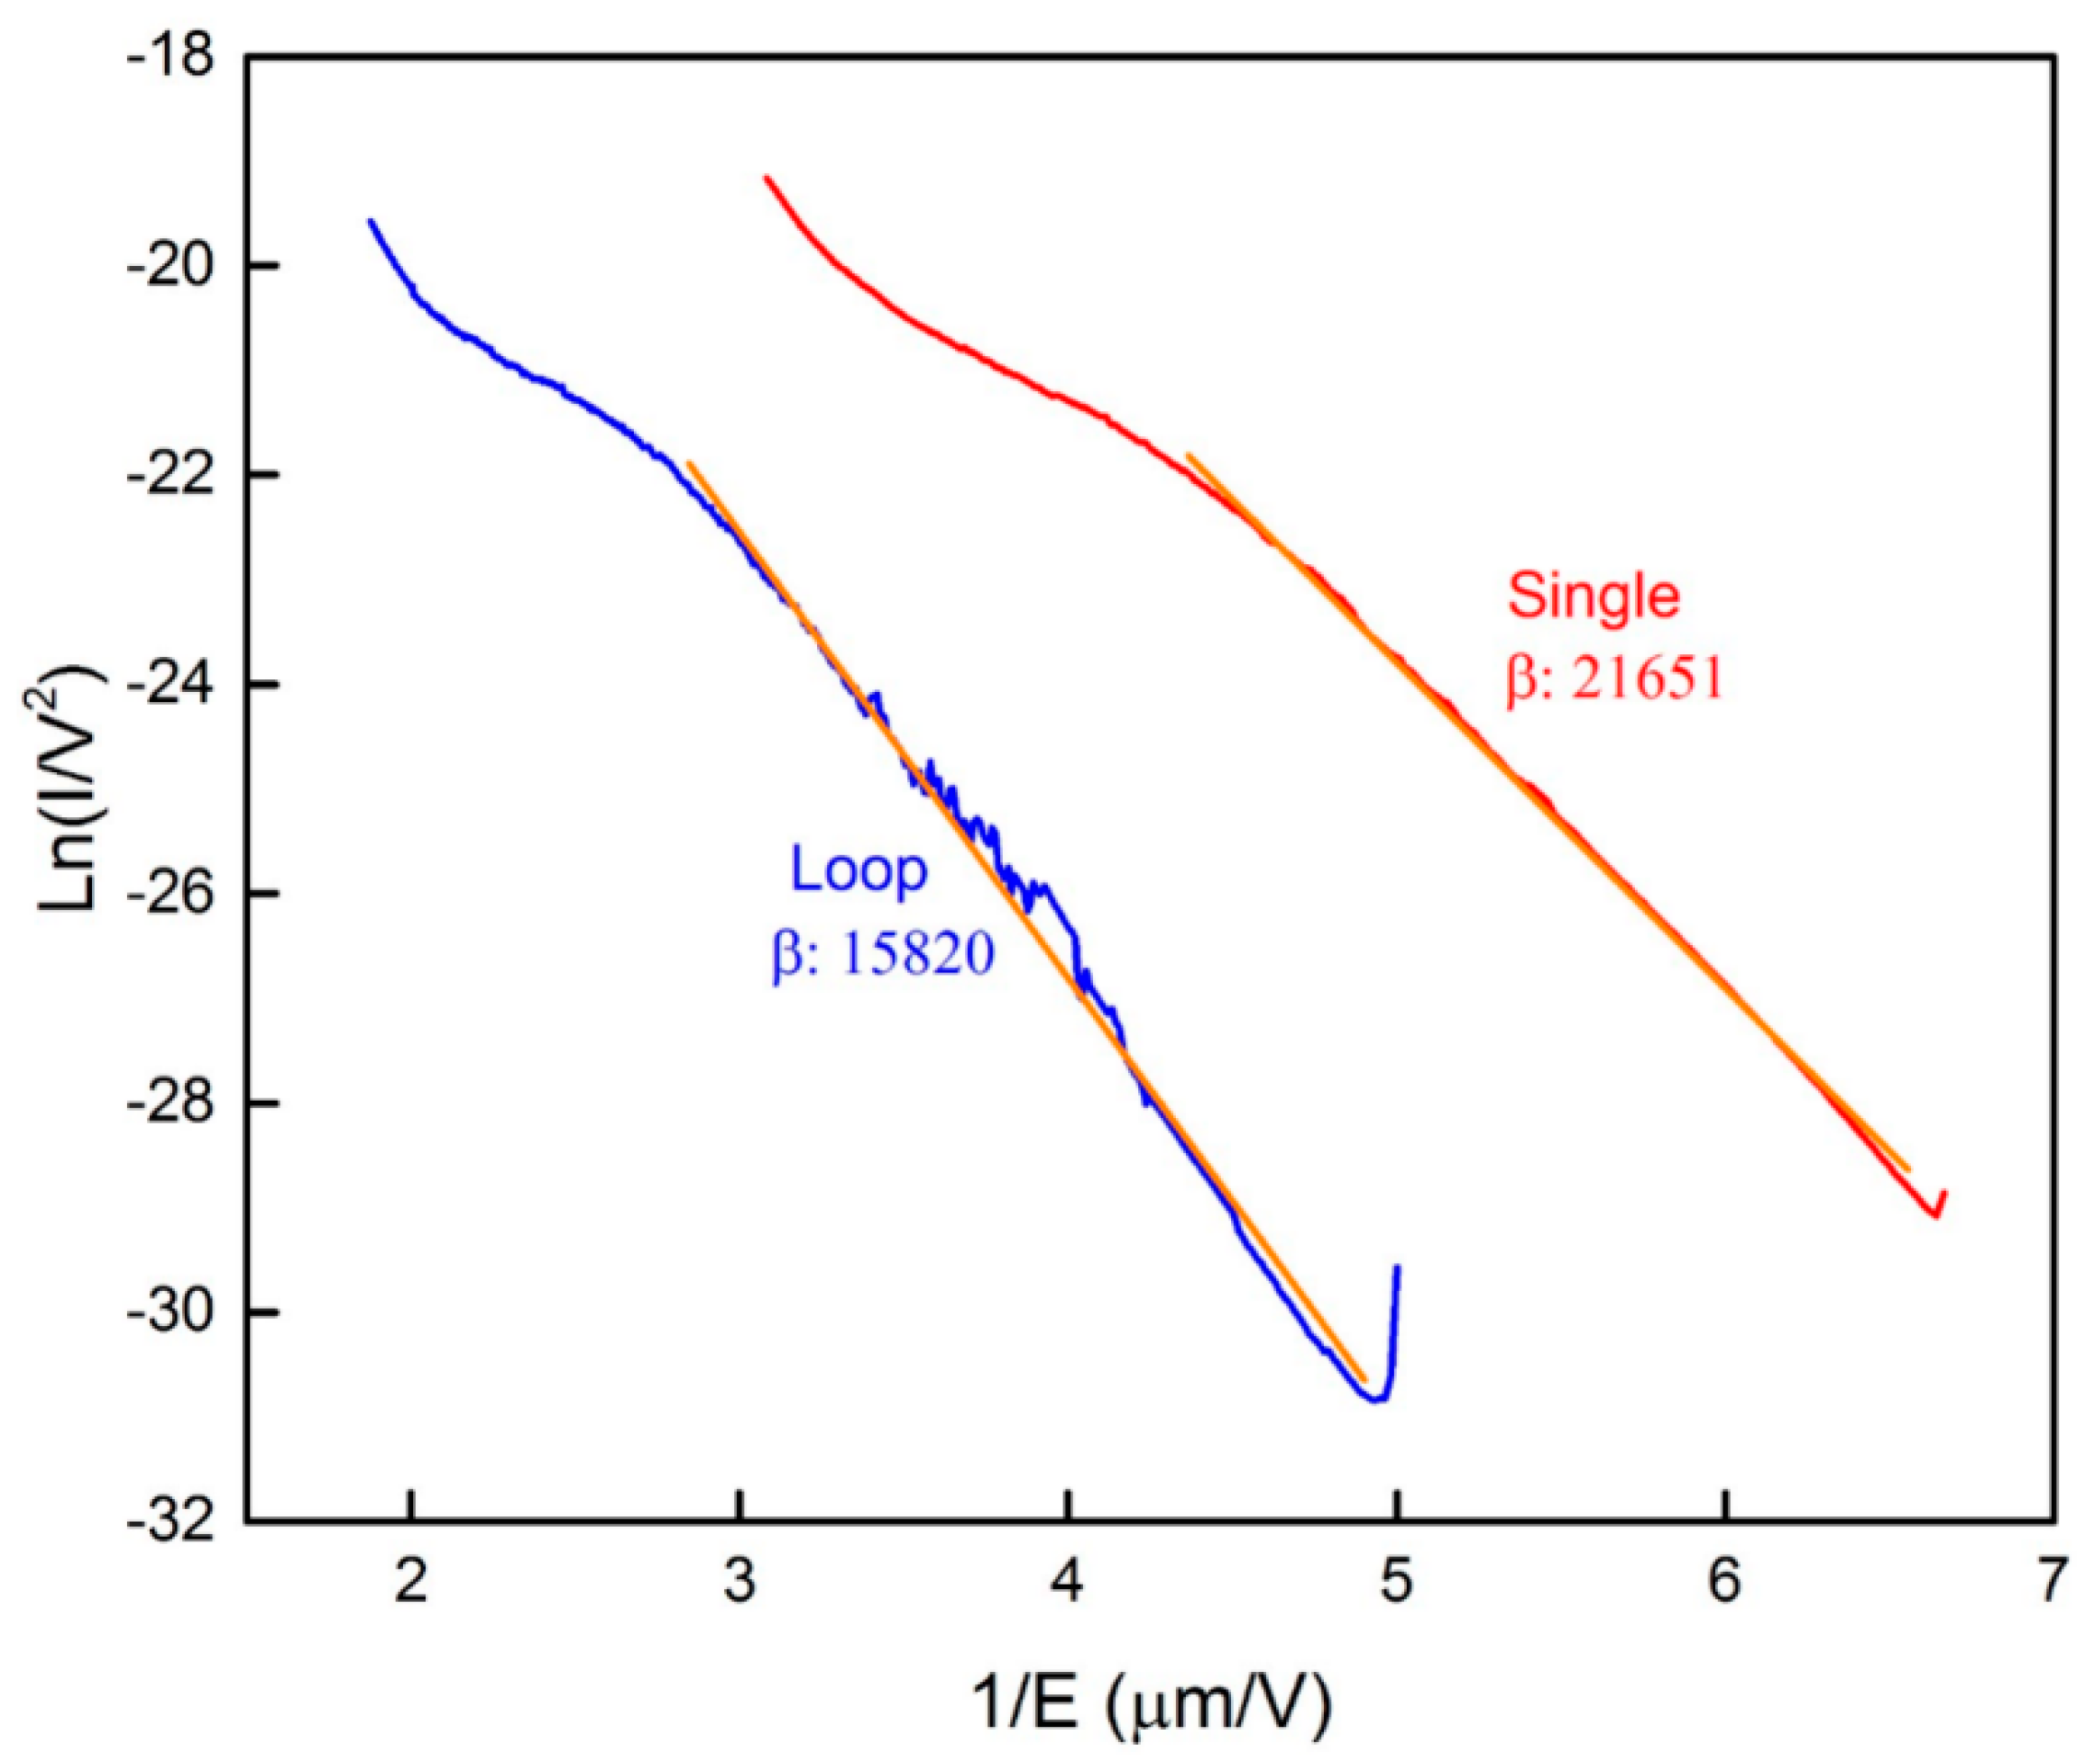
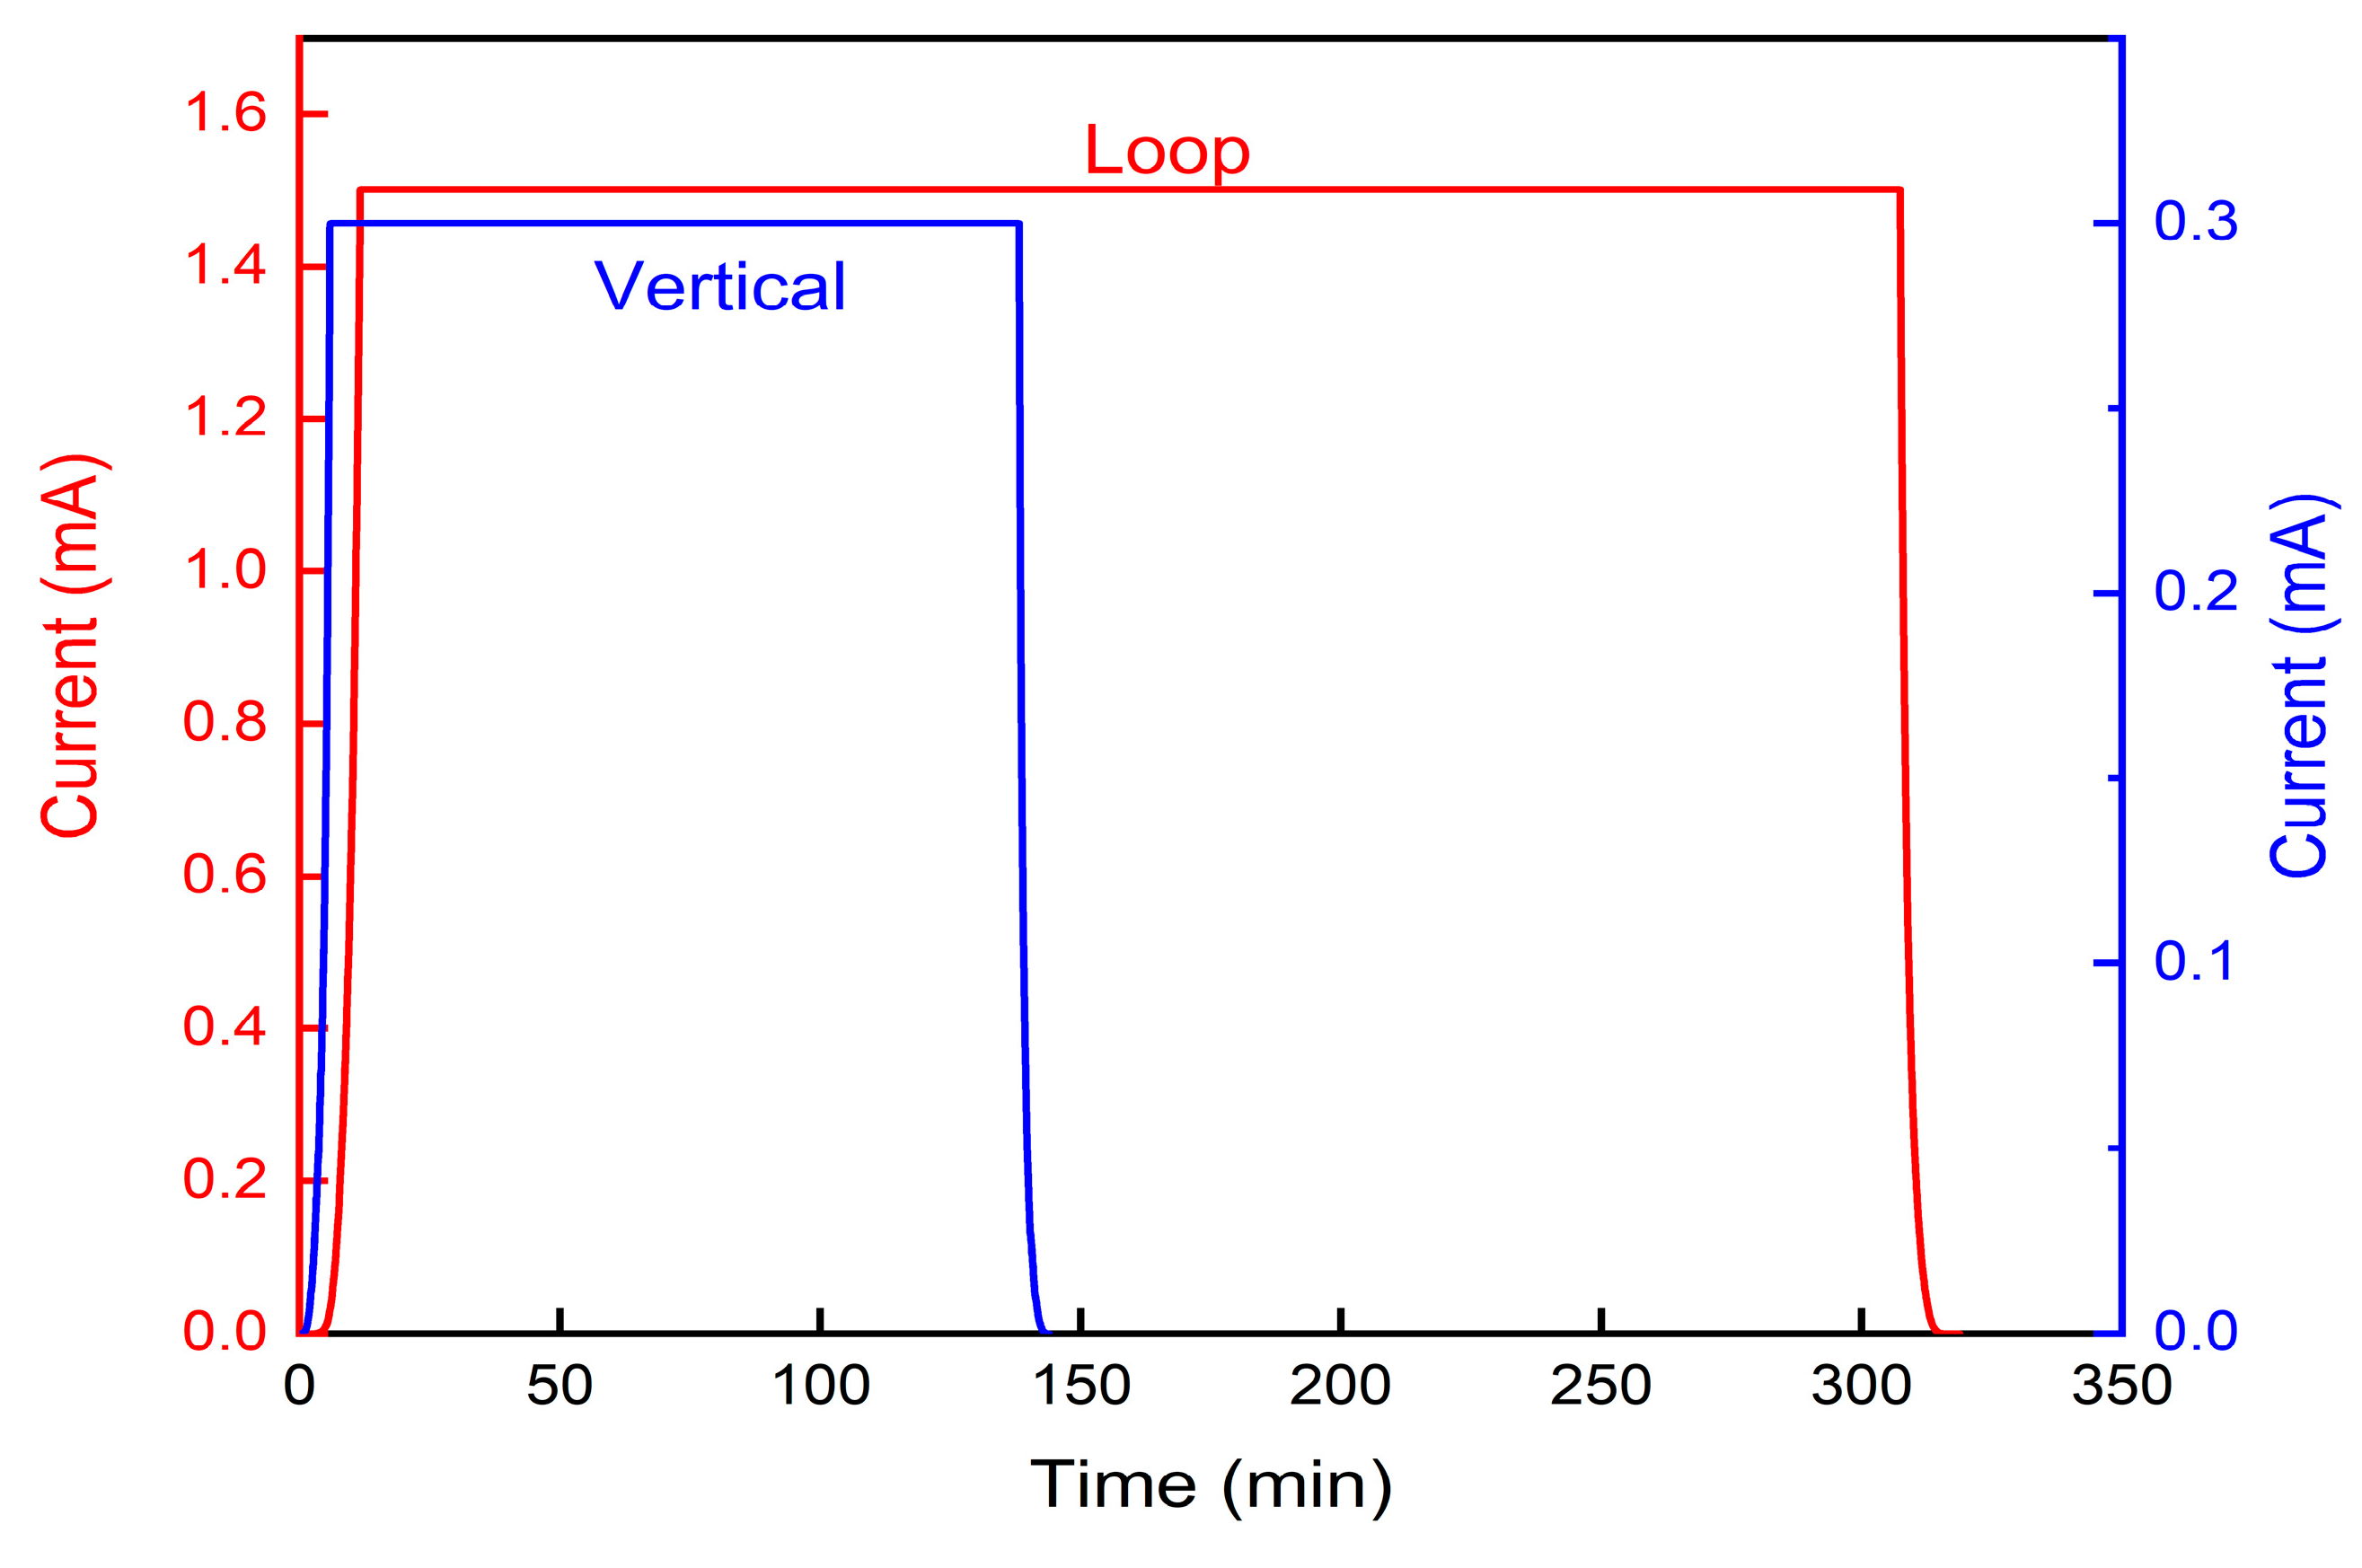
3.1. Field Emission Measurement

Figure 4 shows the FE current data from the single vertical CNT fiber and the looped CNT fiber. For both emitters, the current emission level on the order of mA can be easily achieved from a single CNT fiber, confirming the excellent properties of the CNT fibers as field emitters [3,5,6]. To reach the same current emission level, the looped CNT fiber emitter requires a larger applied electric field as compared to the single vertical fiber emitter. For example, at a current level of 2 mA, the applied electric fields for the looped and vertical fibers are 0.53 V/μm and 0.32 V/μm, corresponding to an applied voltage of 800 V and 650 V, respectively. This is due to the lower effective field enhancement factor ( β e f f in Equation (1) below) of the looped fiber, because of its smaller aspect ratio and the minimized sharp edges as compared to those of the vertical fiber (Figure 2).
Figure 5 shows the Fowler–Nordheim (FN) plot of the measured I-V curves in Figure 4 for both the looped and the single vertical CNT fibers. For FN FE, the current-gap voltage characteristics could be fitted by the FN equation [6,31,32],
I ( A ) = S e f f A ( β e f f E ) 2 e B β e f f E
where A = 1.54 × 10 6 / W , B = 6.83 × 10 9 W 3 / 2 , S e f f is the effective emission area ( m 2 ) of the fiber, W is the work function (in eV) of the emitting surface, β e f f is the effective field enhancement factor, E = V g / D (in V/m) is the gap electric field, D is the gap distance between the anode and the base of the CNT fiber cathode, and V g is the gap voltage. In the FN plot, Equation (1) yields a straight line when plotted as ln ( I / V g 2 ) vs. 1 / E , with a slope of B / β e f f . By assuming the gap voltage is the same as the external applied voltage, V g = V e x t (i.e., no series resistance to the emitter is assumed) [6,33], the measured FN data can be fitted by a straight line when the applied voltage is small, as shown in Figure 5. From the slope of these linear fittings, the effective field enhancement factor is extracted to be β e f f = 15,820 and 21,651 for the looped fiber and the vertical fiber, respectively. In the curve fitting, a constant work function of W = 4.8 eV is assumed for both CNT fiber emitters.
The slope drop in the high electric field regime is usually attributed to space charge effects [34,35,36], outgassing of the field emitter [2], series bulk resistance or contact resistance of the emitter [6,33,37]. Further study is needed to identify the origin of the slope drop in Figure 5.

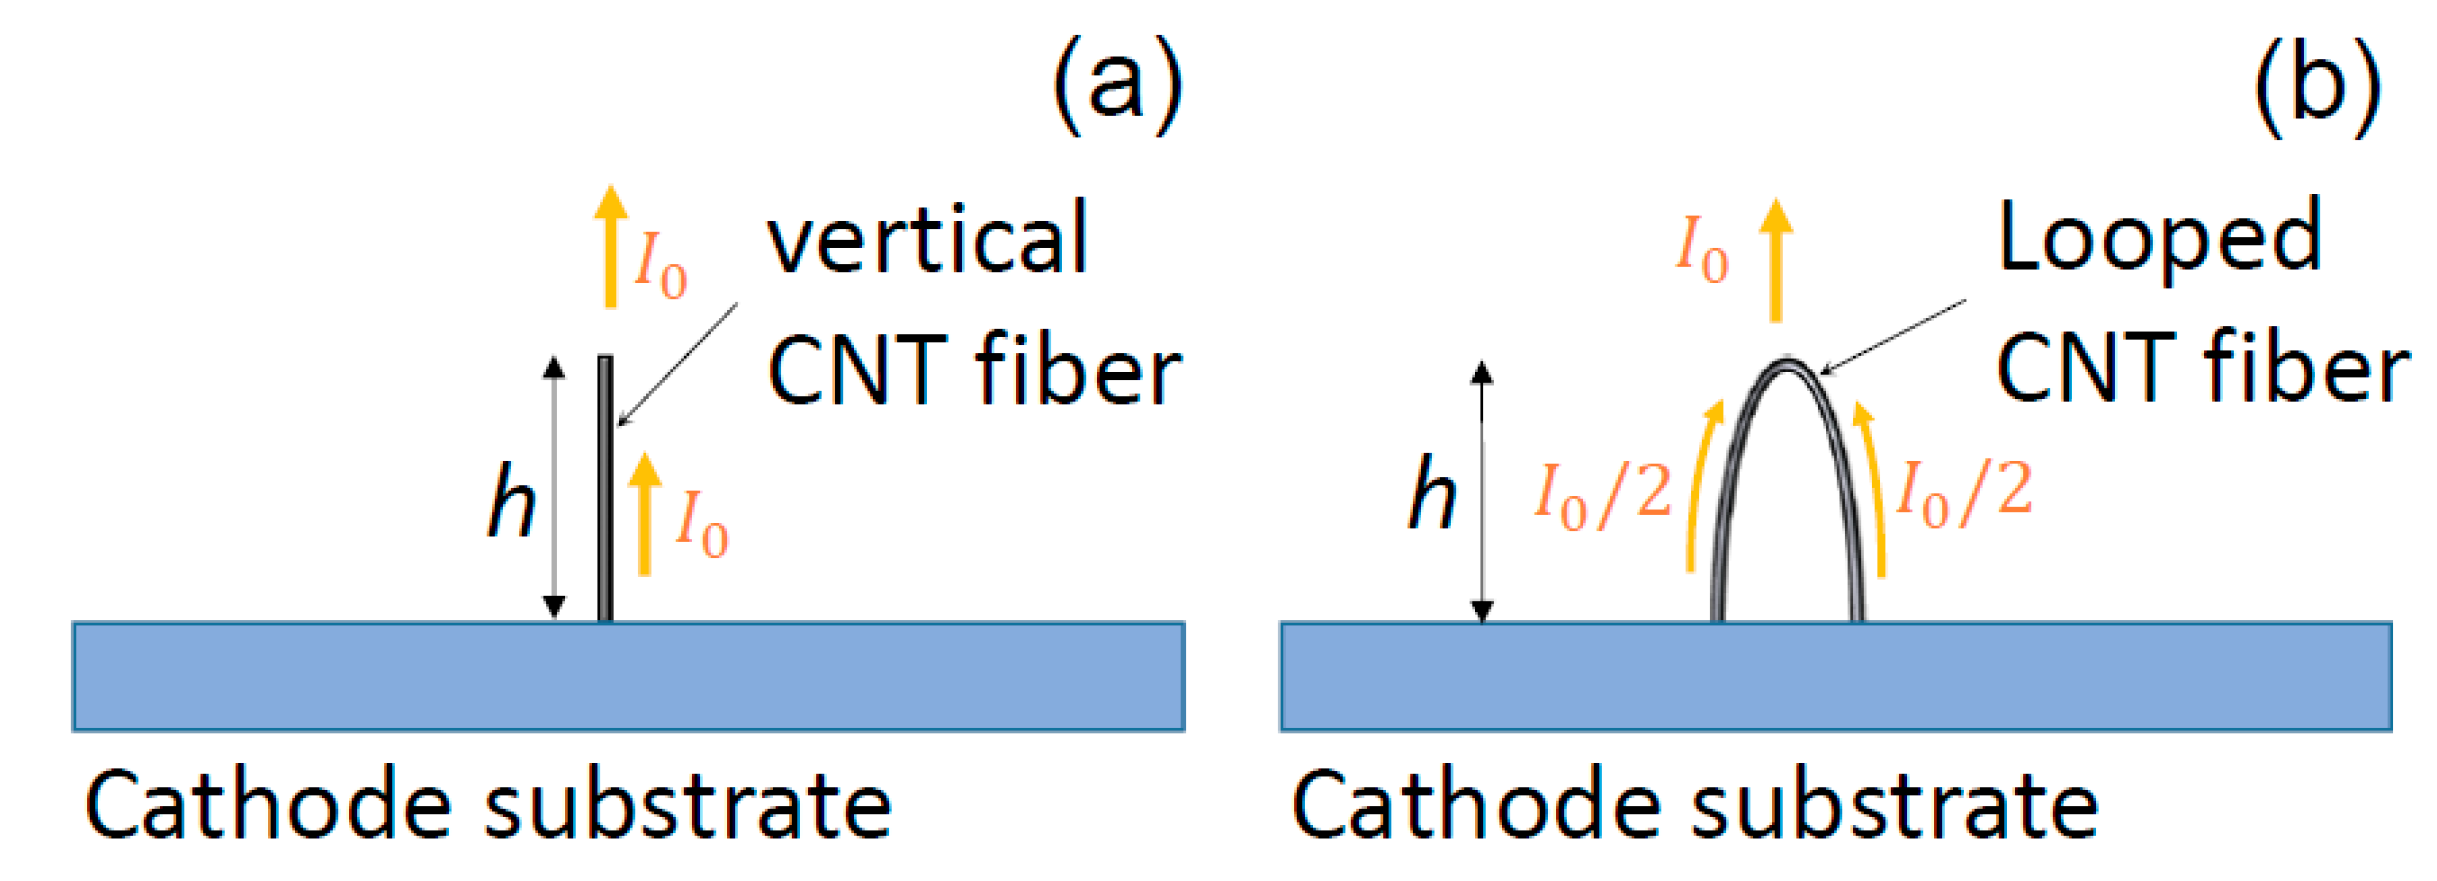
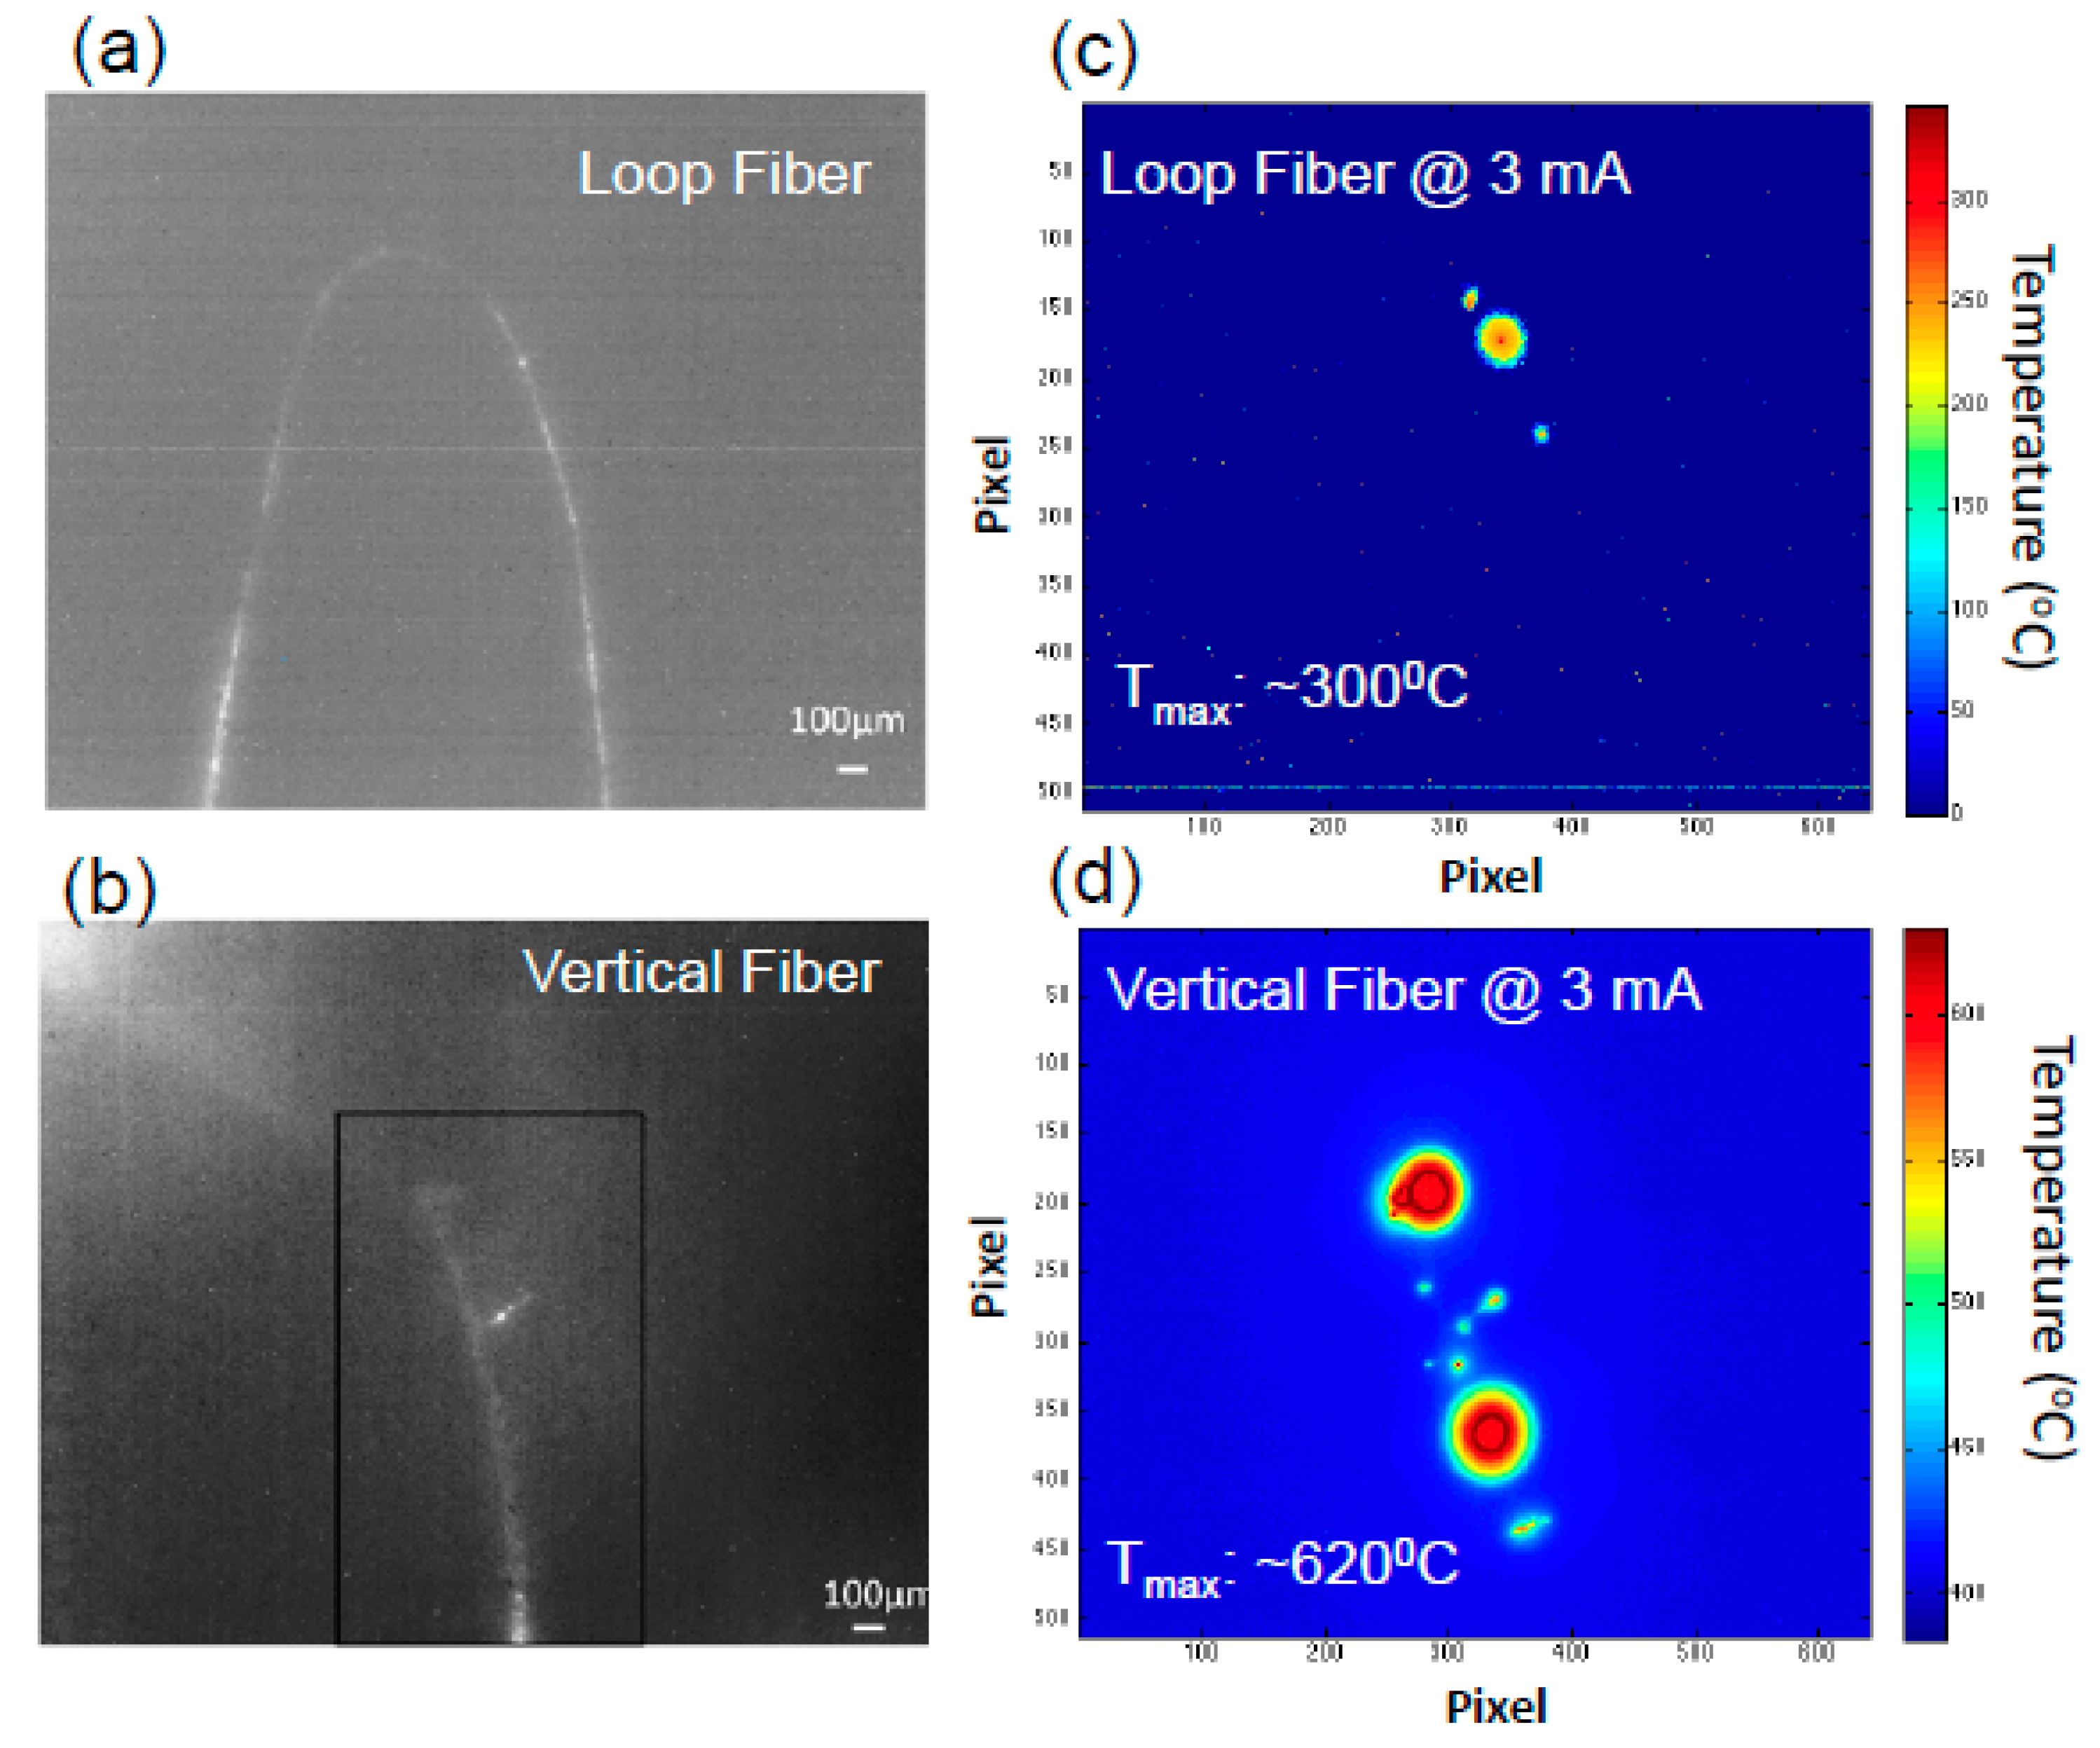
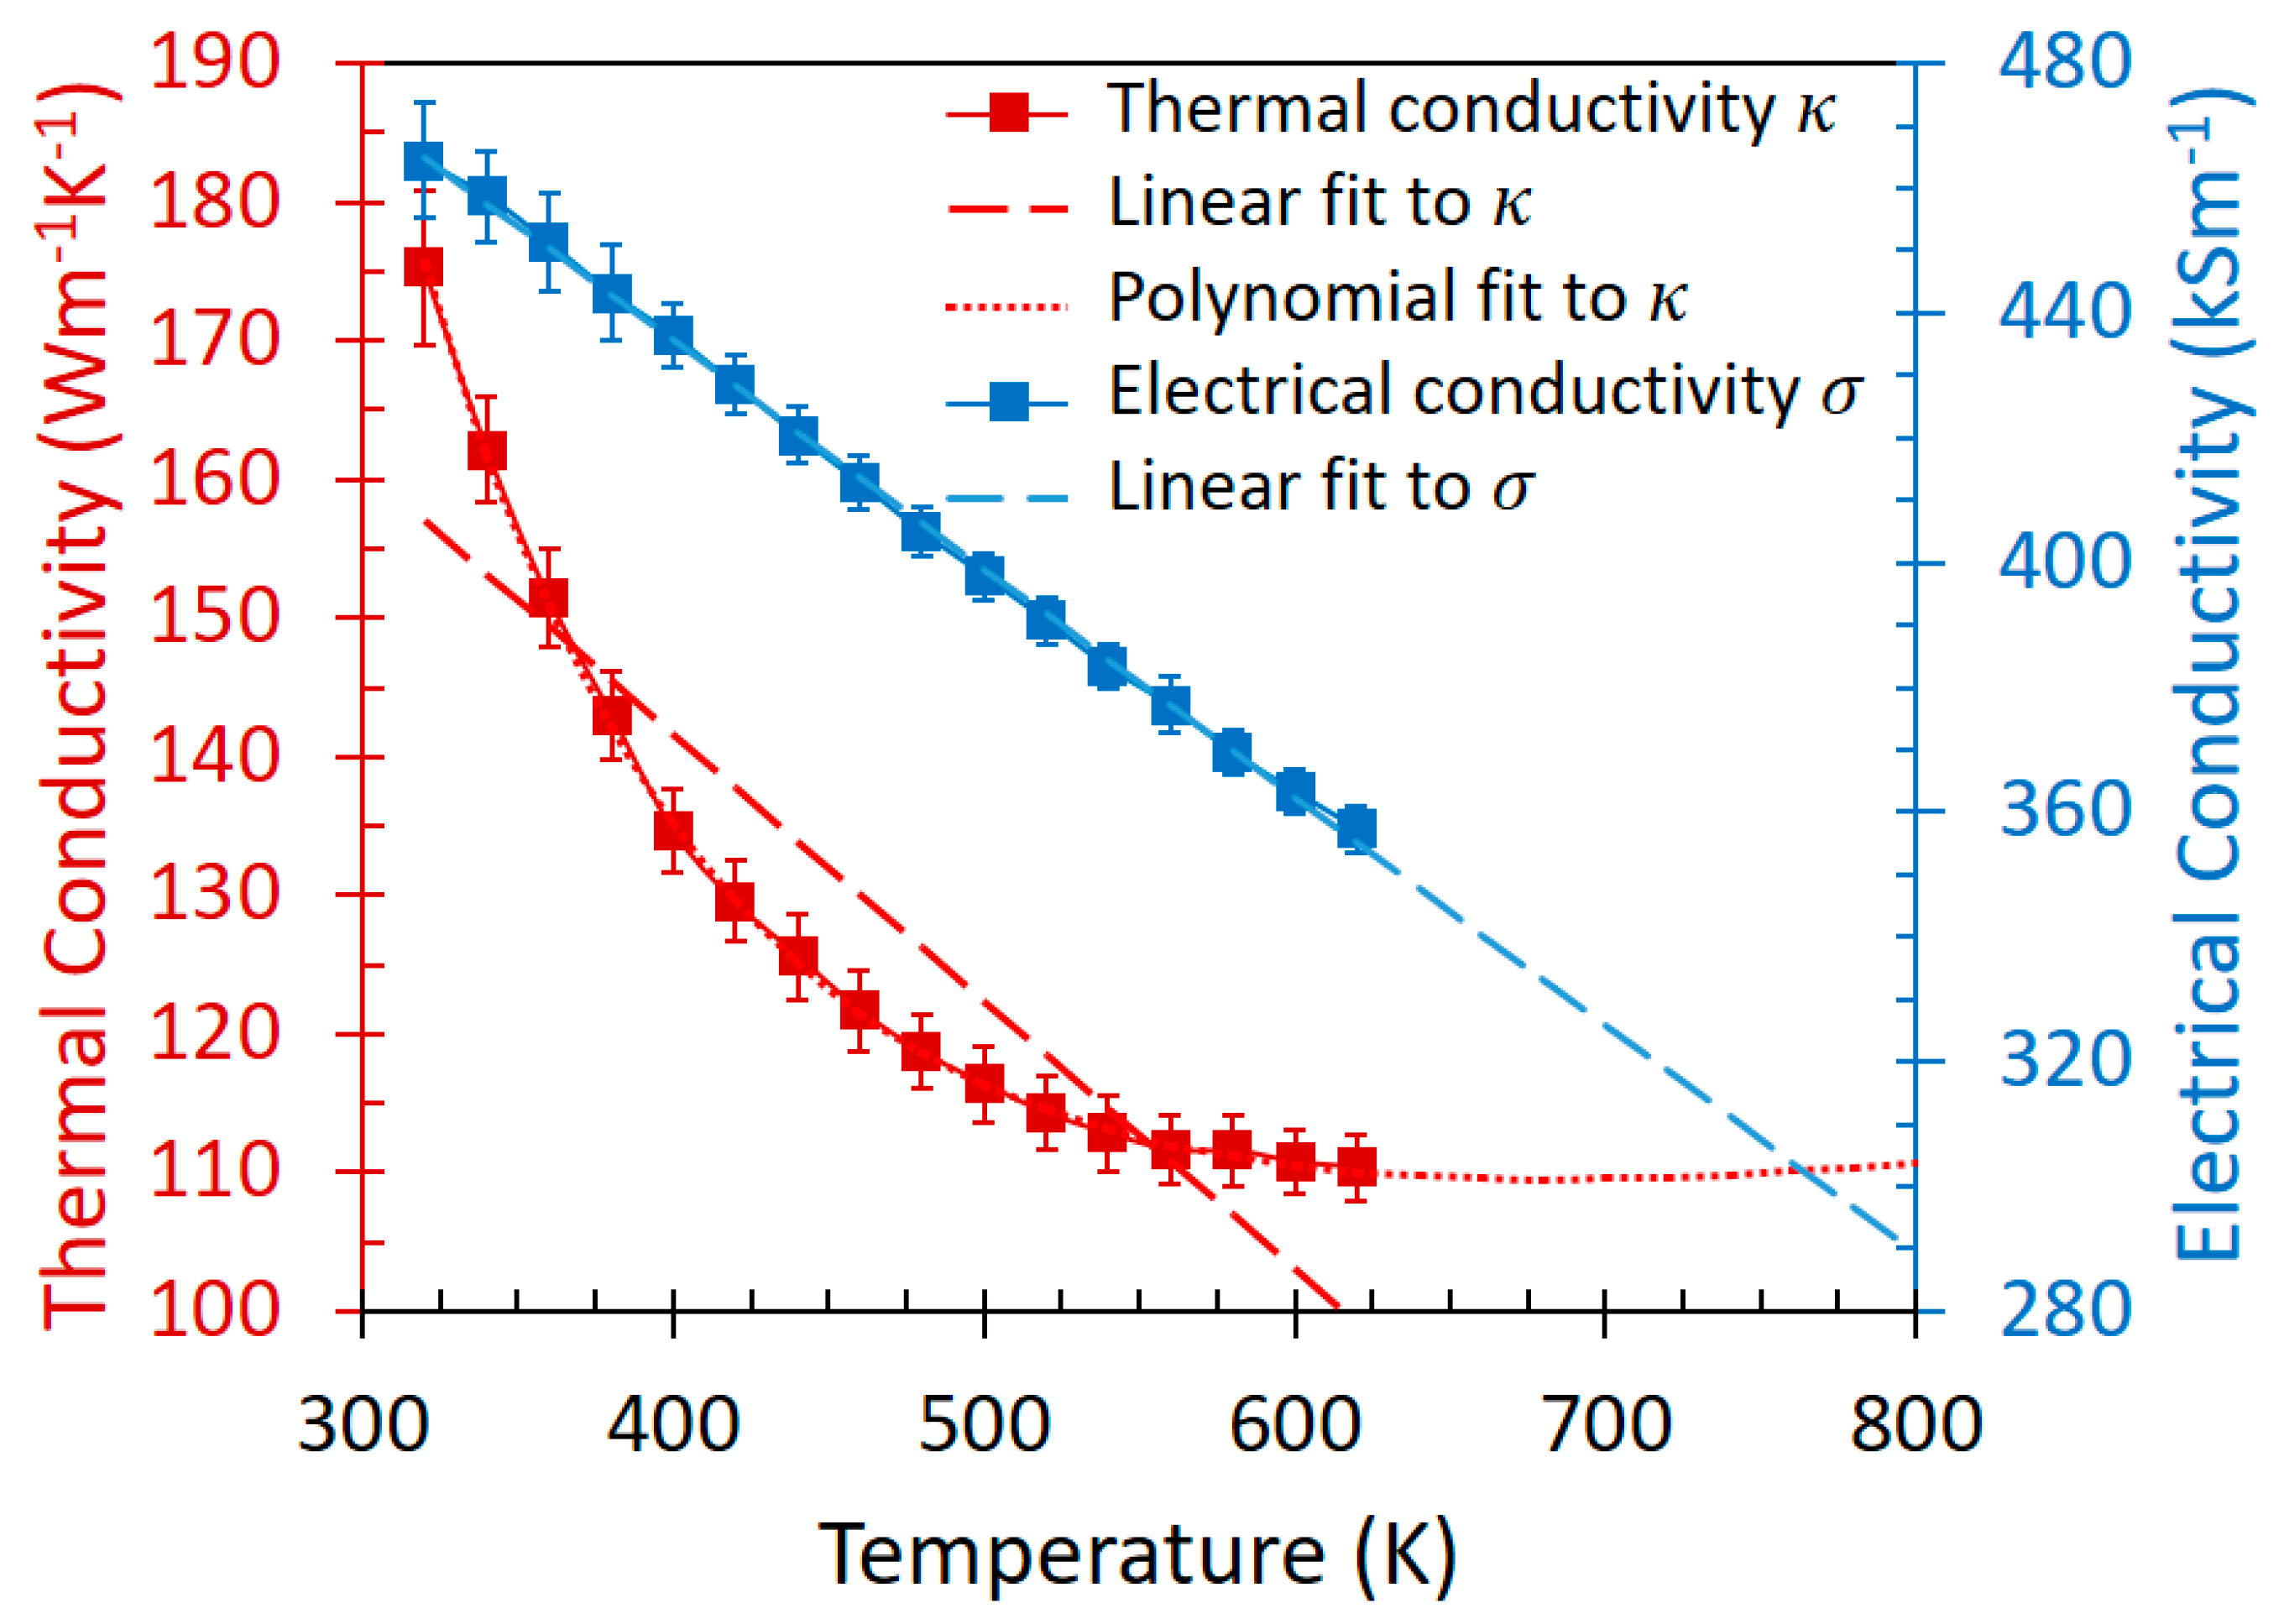
3.2. Temperature Distribution Measurement and Analysis

Due to Joule heating, the temperature of the CNT fibers will be increased. The temperature distributions of both the looped and single vertical CNT fibers were measured directly with an IR camera at the emission current of 3 mA, as shown in Figure 6. It is important to note that even though a higher applied voltage is needed to achieve 3 mA emission current for the looped CNT fiber, its maximum temperature is only around 300 ° C , which is approximately half of the maximum temperature of about 600 ° C in the single vertical CNT fiber. The location of the maximum temperature is very close to the top for the looped fiber emitter, whereas for the vertical fiber emitter, besides the hotspot near the emitter tip, there is a second hotspot around 1 mm below the tip.
It is important to note that, at a given current level, the exact location of the hottest spot depends on the following two factors. The first one is the local emission site, which is related to surface defects, roughness, and/or dangling fibrils along the CNT fiber. The other factor is the self-consistent coupled electrical-thermal conduction along the fiber, which is governed by Equation (2) below. For the looped fiber, both ends are attached to the same substrate with the same temperature and thus, by symmetry, the maximum temperature occurs at the middle point (i.e., the tip) of the looped fiber. For the vertical fiber, Joule heating produces excessive heat inside the fiber, which can only be conducted away (ineffectively and unsymmetrically as compared to the looped configuration) from the two ends of the fiber, resulting in heat built up inside the fiber, with a maximum temperature that is located apart from its ends.
Emission stability was measured for both emitters, as shown in Figure 7. The emission current was measured for 120 min at the current level of 0.3 mA for the vertical CNT configuration, while the looped fiber emission was monitored for 300 min under the current level of 1.5 mA. We observed the long-term stability of both of the emission configurations.
To better understand Joule heating and the thermal properties of the CNT fiber emitters, the temperature dependent electrical (σ) and thermal (κ) conductivities of the CNT fiber (sample from the same fabrication batch as those used in the emitters) were measured using the 3 Omega method, as shown in Figure 8. As temperature T increases, the electrical conductivity decreases linearly; whereas the thermal conductivity decreases strongly before T = 500 K and then gradually saturates afterwards. We next compared the experimental measured temperature distribution with a recent theory on the Joule heating of a one dimensional conductor, with the above measured temperature dependent electrical and thermal conductivities as inputs [27].
From the steady-state heat conduction equation and the electrical current continuity equation, we have [27]
d d s ( κ ( T , s ) d T d s ) + J c 2 σ ( T , s ) = 0 ,
where J c = σ d V / d s = constant is the current density in the conductor, which satisfies 0 L ( J c / σ ) d s = V 0 , where s is the position along the CNT fiber, L is the total length (half length) of the single vertical fiber (looped fiber), and V 0 is the voltage drop along the fiber from the top of the emitter to the cathode base, and is much smaller than the gap voltage. For simplicity, we assume L to be the same as the height of the emitter, L = h (Figure 2). The boundary conditions for Equation (2) are T ( s = 0 ) = T ( s = 2 L ) = T 0 = 320 K for the looped fiber (i.e., both ends are attached to the cathode base at ~room temperature); and T ( s = 0 ) = T 1 = T 0 = 320 K and T ( s = L ) = T 2 for the single vertical fiber (i.e., one end is attached to the cathode based at room temperature and the other end is at temperature T 2 = 580   ° C (853 K), which is estimated from Figure 6d). Equation (2) is solved with these boundary conditions to give the temperature distribution along the CNT fibers.
By assuming constant electrical conductivity σ = σ 0 and linear temperature dependence of thermal conductivity κ = κ 0 + κ ( T T 1 ) , Equation (2) can be solved analytically [27]. The maximum temperature for the looped fiber and for the single vertical fiber is found to be [27],
T m a x = T 0 + κ 0 κ ( 1 + κ V 0 2 σ 0 4 κ 0 2 1 ) ,   Looped   fiber
T m a x = T 1 + κ 0 κ ( 1 + κ T Δ 2 4 V 0 2 σ 0 ( V 0 2 σ 0 κ 0 T Δ + κ T Δ κ 0 + 2 ) 2 1 ) ,   Vertical   fiber
where, for the looped fiber, the location of T m a x always occurs at the top of the fiber loop (i.e., half the length of the total loop); for the vertical fiber, it occurs (measured from the cathode base) at s m a x = L / 2 + L ( κ T 0 2 / 2 σ 0 V 0 2 + κ 0 T 0 / σ 0 V 0 2 ) if s m a x < L , otherwise at s m a x = L with T m a x = T 2 . In Equations (3) and (4), T 0 is the temperature at the cathode base, T Δ = T 2 T 1 is the temperature difference between the two ends of the vertical fiber, V 0 = I 0 R is the voltage drop from the top to the bottom of the emitter during field emission, I 0 is the emission current, and R is the total resistance of the emitter. When the temperature dependence coefficient κ 0 , Equations (3) and (4) become,
T m a x = T 0 + V 0 2 σ 0 8 κ 0 ,   Looped   fiber
T m a x = T 1 + κ 0 T Δ 2 8 V 0 2 σ 0 ( V 0 2 σ 0 κ 0 T Δ + 2 ) 2 ,   Vertical   fiber
Note that Equation (5) is identical to the V-T relation that is used in electrical contacts and ohmic heated nanowire [38,39].
By using σ 0 ( 320   K ) = 4.64 × 10 5 S/m, κ 0 ( 320   K ) = 175.28 W/(mK), and κ = 0.1298 W/(mK2) (cf. linear fit in Figure 8), the maximum temperature for the looped fiber is estimated to be T m a x = 254 ° C (527 K) and 286 ° C (559 K), from Equations (5) and (3), respectively; and the maximum temperature for the vertical fiber is estimated to be T m a x = 580 ° C (853 K) at s m a x = 4 mm and 595 ° C (868 K) at s m a x = 3.5 mm, from Equations (6) and (4), respectively. It is clear that including the negative linear dependence of the thermal conductivity κ gives a higher maximum temperature, yielding a closer fit to the measured temperature distribution data in Figure 6. A more accurate polynomial fit for κ ( T ) and a linear fit for σ ( T ) are also used in Equation (2) to numerically calculate the maximum temperature, giving T m a x = 300   ° C for the looped fiber and T m a x = 600   ° C at S m a x = 3.1 mm for the vertical fiber, which are the closest fit to the experimental measurements in Figure 6. The results that were obtained from the experiments and from theory under various assumptions are summarized in Table 1. Despite the agreement with experiments, we would like to emphasize again that the model in Equation (2) does not take into account the effects of the local emission site that is induced from fiber imperfection.
In the above calculation, in order to give the best fit, the voltage drop across the emitters was adjusted to be V 0 = 0.79 V and 0.61 V for the looped and the vertical fiber, respectively. These values are equivalent to a CNT fiber emitter resistance of R l o o p = V 0 / I 0 = 0.79   V / 3   mA = 263   Ω and R v e r t i c a l = V 0 / I 0 = 0.61   V / 3   mA = 203   Ω , which are much higher than the direct estimation of R = ( 1 / σ 0 ) L / π r 2 = 24   Ω for the single vertical fiber (and R / 2 = 12   Ω for the looped fiber due to the parallel connection of two resistors, cf. Figure 2b). Several possible explanations are speculated as follows. First, even though the CNT fibers that were installed for the two emitters and for the σ and κ measurement are from the same fabrication batch, it was noticed that there were significant variations on the thermal conductivity values from sample to sample, as well as the number of measurements. We observed about 30% variation among the samples and 2 to 5% variation among the measurements of thermal conductivity. While the origin of this variation is yet to be identified (one possible origin is poor contact between the CNT fiber and the epoxy), the error during the conductivities measurement may lead to the difference in the calculations for the emitter resistance. It is also possible that the high current cycles during the FE measurement may have conditioned and damaged a fraction of the CNT fibers [6,26,34], resulting in a different σ and κ from those in the pristine samples that were used for the 3 Omega measurement. Another speculation is that during FE, only a small percentage of the CNT fibrils (sub-fiber units, ~20–50 nm in diameter, formed by CNT tubes [5]) in the fiber were active to conduct current for field emission, which is postulated based on the fact that only a small fraction of the surface area of the emitter tip field emit [3,6,22]. It is also important to note that near the top of the looped fiber, only one side of the fiber faces the anode to emit current (Figure 2b). Because of the high inter-tube resistance [40,41,42], the resistance of the small fraction of conducting fibrils in a CNT fiber during field emission will be significantly higher than that of the overall macroscopic fiber.

4. Conclusions

In summary, we have studied field emission and temperature distribution from a looped CNT fiber and a single vertical CNT fiber. For both emitters, the field emission current level of mA can be easily reached with an applied voltage of <1000 V, demonstrating their excellent field emission properties. For a given applied voltage, the single vertical CNT fiber gave a higher emission current because of its higher field enchantment factor. However, at the same emission current of 3 mA, the maximum temperature of the looped fiber (~300 ° C ) was significantly lower than that of the vertical fiber (~600 ° C ). The temperature dependent electrical and thermal conductivities were also measured for the CNT fiber. Based on these measured conductivities, the maximum temperature and its location in the fibers were compared with a recent theory on joule heating of a one-dimensional conductor [27]. The measured temperature distribution for both the looped and vertical CNT fibers were well fitted with the theory by adjusting the voltage drop across the emitter. Our study suggests that the novel configuration of a looped CNT fiber can significantly improve the thermal management of field emitters, which could improve the reliability and lifetime of field emitters for high power and high current operations. Future studies will include the effects of different looped fiber geometries (e.g., separation between the two ends and height of the loop) on electric field, current emission, and temperature distribution. Additionally, the effect of increased fiber conductivity on field emission properties will be measured.

Author Contributions

J.P. and S.B.F. conceived and designed the experiments. J.P., J.F., and T.B. performed the experiments. P.Z., N.P.L., J.P., and S.B.F. analyzed the data. P.Z. and Y.Y.L. contributed to the modeling. P.Z. wrote the original draft. All authors contributed to the editing of the paper.

Acknowledgments

We would like to thank Matteo Pasquali, Rice University for providing the materials. This material is based upon work that is supported by the Air Force Office of Scientific Research YIP award No. FA9550-18-1-0061, by the Air Force Office of Scientific Research under award No. FA9550-17RXCOR428, and by the Air Force Office of Scientific Research under award No. FA9550-18-1-0153.

Conflicts of Interest

The authors declare no conflict of interest.

References

  1. Shiffler, D.; Fairchild, S.; Tang, W.; Maruyama, B.; Golby, K.; LaCour, M.; Pasquali, M.; Lockwood, N. Demonstration of an Acid-Spun Single-Walled Nanotube Fiber Cathode. IEEE Trans. Plasma Sci. 2012, 40, 1871–1877. [Google Scholar] [CrossRef]
  2. Murray, P.T.; Back, T.C.; Cahay, M.M.; Fairchild, S.B.; Maruyama, B.; Lockwood, N.P.; Pasquali, M. Evidence for adsorbate-enhanced field emission from carbon nanotube fibers. Appl. Phys. Lett. 2013, 103, 053113. [Google Scholar] [CrossRef]
  3. Fairchild, S.B.; Boeckl, J.; Back, T.C.; Ferguson, J.B.; Koerner, H.; Murray, P.T.; Maruyama, B.; Lange, M.A.; Cahay, M.M.; Behabtu, N.; et al. Morphology dependent field emission of acid-spun carbon nanotube fibers. Nanotechnology 2015, 26, 105706. [Google Scholar] [CrossRef] [PubMed]
  4. Giubileo, F.; Di Bartolomeo, A.; Iemmo, L.; Luongo, G.; Urban, F. Field Emission from Carbon Nanostructures. Appl. Sci. 2018, 8, 526. [Google Scholar] [CrossRef]
  5. Behabtu, N.; Young, C.C.; Tsentalovich, D.E.; Kleinerman, O.; Wang, X.; Ma, A.W.K.; Bengio, E.A.; ter Waarbeek, R.F.; de Jong, J.J.; Hoogerwerf, R.E.; et al. Strong, Light, Multifunctional Fibers of Carbon Nanotubes with Ultrahigh Conductivity. Science 2013, 339, 182–186. [Google Scholar] [CrossRef] [PubMed] [Green Version]
  6. Zhang, P.; Fairchild, S.B.; Back, T.C.; Luo, Y. Field emission from carbon nanotube fibers in varying anode-cathode gap with the consideration of contact resistance. AIP Adv. 2017, 7, 125203. [Google Scholar] [CrossRef] [Green Version]
  7. Velasquez-Garcia, L.F.; Adeoti, B.; Niu, Y.; Akinwande, A.I. Uniform High Current Field Emission of Electrons from Si and CNF FEAs Individually Controlled by Si Pillar Ungated FETs. In Proceedings of the 2007 IEEE International Electron Devices Meeting, Washington, DC, USA, 10–12 December 2007; pp. 599–602. [Google Scholar]
  8. Chen, L.Y.; Velasquez-Garcia, L.F.; Wang, X.; Cheung, K.; Teo, K.; Akinwande, A.I. Design, fabrication and characterization of double-gated vertically aligned carbon nanofiber field emitter arrays. In Proceedings of the 2007 IEEE 20th International Vacuum Nanoelectronics Conference, Chicago, IL, USA, 8–12 July 2007; pp. 82–83. [Google Scholar]
  9. Chen, L.Y.; Velasquez-Garcia, L.F.; Wang, X.; Teo, K.; Akinwande, A.I. A Microionizer for Portable Mass Spectrometers Using Double-Gated Isolated Vertically Aligned Carbon Nanofiber Arrays. IEEE Trans. Electron Device 2011, 58, 2149–2158. [Google Scholar] [CrossRef]
  10. Teo, K.B.K.; Lee, S.-B.; Chhowalla, M.; Semet, V.; Binh, V.T.; Groening, O.; Castignolles, M.; Loiseau, A.; Pirio, G.; Legagneux, P.; et al. Plasma enhanced chemical vapour deposition carbon nanotubes/nanofibres—How uniform do they grow? Nanotechnology 2003, 14, 204. [Google Scholar] [CrossRef]
  11. Saito, Y.; Uemura, S. Field emission from carbon nanotubes and its application to electron sources. Carbon 2000, 38, 169–182. [Google Scholar] [CrossRef]
  12. Zakhidov, A.A.; Nanjundaswamy, R.; Obraztsov, A.N.; Zhang, M.; Fang, S.; Klesch, V.I.; Baughman, R.H.; Zakhidov, A.A. Field emission of electrons by carbon nanotube twist-yarns. Appl. Phys. A 2007, 88, 593–600. [Google Scholar] [CrossRef]
  13. Ryu, J.H.; Kang, J.S.; Park, K.C. Carbon Nanotube Electron Emitter for X-ray Imaging. Materials 2012, 5, 2353–2359. [Google Scholar] [CrossRef] [Green Version]
  14. Booske, J.H. Plasma physics and related challenges of millimeter-wave-to-terahertz and high power microwave generationa. Phys. Plasmas 2008, 15, 055502. [Google Scholar] [CrossRef]
  15. Gupta, A.P.; Park, S.; Yeo, S.J.; Jung, J.; Cho, C.; Paik, S.H.; Park, H.; Cho, Y.C.; Kim, S.H.; Shin, J.H.; et al. Direct Synthesis of Carbon Nanotube Field Emitters on Metal Substrate for Open-Type X-ray Source in Medical Imaging. Materials 2017, 10, 878. [Google Scholar] [CrossRef] [PubMed]
  16. Park, S.; Gupta, A.P.; Yeo, S.J.; Jung, J.; Paik, S.H.; Mativenga, M.; Kim, S.H.; Shin, J.H.; Ahn, J.S.; Ryu, J. Carbon Nanotube Field Emitters Synthesized on Metal Alloy Substrate by PECVD for Customized Compact Field Emission Devices to Be Used in X-Ray Source Applications. Nanomaterials 2018, 8, 378. [Google Scholar] [CrossRef] [PubMed]
  17. Minoux, E.; Groening, O.; Teo, K.B.K.; Dalal, S.H.; Gangloff, L.; Schnell, J.-P.; Hudanski, L.; Bu, I.Y.Y.; Vincent, P.; Legagneux, P.; et al. Achieving High-Current Carbon Nanotube Emitters. Nano Lett. 2005, 5, 2135–2138. [Google Scholar] [CrossRef] [PubMed]
  18. Evtukh, A.; Hartnagel, H.; Yilmazoglu, O.; Mimura, H.; Pavlidis, D. Vacuum Nanoelectronic Devices: Novel Electron Sources and Applications, 1st ed.; Wiley: Chichester, UK, 2015; ISBN 978-1-119-03795-8. [Google Scholar]
  19. Piltan, S.; Sievenpiper, D. Plasmonic nano-arrays for enhanced photoemission and photodetection. J. Opt. Soc. Am. B 2018, 35, 208–213. [Google Scholar] [CrossRef] [Green Version]
  20. Zhang, P.; Lau, Y.Y. Ultrafast and nanoscale diodes. J. Plasma Phys. 2016, 82, 595820505. [Google Scholar] [CrossRef]
  21. Zhang, P.; Valfells, A.; Ang, L.K.; Luginsland, J.W.; Lau, Y.Y. 100 years of the physics of diodes. Appl. Phys. Rev. 2017, 4, 011304. [Google Scholar] [CrossRef] [Green Version]
  22. Lin, J.; Wong, P.Y.; Yang, P.; Lau, Y.Y.; Tang, W.; Zhang, P. Electric field distribution and current emission in a miniaturized geometrical diode. J. Appl. Phys. 2017, 121, 244301. [Google Scholar] [CrossRef]
  23. Fairchild, S.B.; Bulmer, J.S.; Sparkes, M.; Boeckl, J.; Cahay, M.; Back, T.; Murray, P.T.; Gruen, G.; Lange, M.; Lockwood, N.P.; et al. Field emission from laser cut CNT fibers and films. J. Mater. Res. 2014, 29, 392–402. [Google Scholar] [CrossRef]
  24. Purcell, S.T.; Vincent, P.; Journet, C.; Binh, V.T. Hot Nanotubes: Stable Heating of Individual Multiwall Carbon Nanotubes to 2000 K Induced by the Field-Emission Current. Phys. Rev. Lett. 2002, 88, 105502. [Google Scholar] [CrossRef] [PubMed]
  25. Sveningsson, M.; Hansen, K.; Svensson, K.; Olsson, E.; Campbell, E.E.B. Quantifying temperature-enhanced electron field emission from individual carbon nanotubes. Phys. Rev. B 2005, 72, 085429. [Google Scholar] [CrossRef]
  26. Cahay, M.; Zhu, W.; Fairchild, S.; Murray, P.T.; Back, T.C.; Gruen, G.J. Multiscale model of heat dissipation mechanisms during field emission from carbon nanotube fibers. Appl. Phys. Lett. 2016, 108, 033110. [Google Scholar] [CrossRef]
  27. Antoulinakis, F.; Chernin, D.; Zhang, P.; Lau, Y.Y. Effects of temperature dependence of electrical and thermal conductivities on the Joule heating of a one dimensional conductor. J. Appl. Phys. 2016, 120, 135105. [Google Scholar] [CrossRef]
  28. Zhang, P.; Lau, Y.Y. Scaling laws for electrical contact resistance with dissimilar materials. J. Appl. Phys. 2010, 108, 044914. [Google Scholar] [CrossRef]
  29. Tsentalovich, D.E.; Headrick, R.J.; Mirri, F.; Hao, J.; Behabtu, N.; Young, C.C.; Pasquali, M. Influence of Carbon Nanotube Characteristics on Macroscopic Fiber Properties. ACS Appl. Mater. Interfaces 2017, 9, 36189–36198. [Google Scholar] [CrossRef] [PubMed]
  30. Lu, L.; Yi, W.; Zhang, D.L. 3ω method for specific heat and thermal conductivity measurements. Rev. Sci. Instrum. 2001, 72, 2996–3003. [Google Scholar] [CrossRef] [Green Version]
  31. Fowler, R.H.; Nordheim, L. Electron Emission in Intense Electric Fields. Proc. R. Soc. Lond. Ser. A 1928, 119, 173–181. [Google Scholar] [CrossRef] [Green Version]
  32. Forbes, R.G. Field emission: New theory for the derivation of emission area from a Fowler–Nordheim plot. J. Vac. Sci. Technol. B Microelectron. Nanometer Struct. Process. Meas. Phenom. 1999, 17, 526–533. [Google Scholar] [CrossRef]
  33. Luginsland, J.W.; Valfells, A.; Lau, Y.Y. Effects of a series resistor on electron emission from a field emitter. Appl. Phys. Lett. 1996, 69, 2770–2772. [Google Scholar] [CrossRef]
  34. Cahay, M.; Murray, P.T.; Back, T.C.; Fairchild, S.; Boeckl, J.; Bulmer, J.; Koziol, K.K.K.; Gruen, G.; Sparkes, M.; Orozco, F.; et al. Hysteresis during field emission from chemical vapor deposition synthesized carbon nanotube fibers. Appl. Phys. Lett. 2014, 105, 173107. [Google Scholar] [CrossRef]
  35. Lau, Y.Y.; Liu, Y.; Parker, R.K. Electron emission: From the Fowler—Nordheim relation to the Child—Langmuir law. Phys. Plasmas 1994, 1, 2082–2085. [Google Scholar] [CrossRef]
  36. Di Bartolomeo, A.; Scarfato, A.; Giubileo, F.; Bobba, F.; Biasiucci, M.; Cucolo, A.M.; Santucci, S.; Passacantando, M. A local field emission study of partially aligned carbon-nanotubes by atomic force microscope probe. Carbon 2007, 45, 2957–2971. [Google Scholar] [CrossRef]
  37. Baturin, S.S.; Zinovev, A.V.; Baryshev, S.V. Current Saturation in Nonmetallic Field Emitters. arXiv, 2017; arXiv:1710.03692. [Google Scholar]
  38. Greenwood, J.A.; Williamson, J.B.P. Electrical conduction in solids II. Theory of temperature-dependent conductors. Proc. R. Soc. Lond. A 1958, 246, 13–31. [Google Scholar] [CrossRef]
  39. Timsit, R.S. Remarks on the thermal stability of an Ohmic-heated nanowire. J. Appl. Phys. 2018, 123, 175105. [Google Scholar] [CrossRef]
  40. Li, C.; Thostenson, E.T.; Chou, T.-W. Dominant role of tunneling resistance in the electrical conductivity of carbon nanotube–based composites. Appl. Phys. Lett. 2007, 91, 223114. [Google Scholar] [CrossRef]
  41. Banerjee, S.; Luginsland, J.W.; Zhang, P. A Two Dimensional Tunneling Resistance Transmission Line Model for Parallel Contacts. 2018; in preparation. [Google Scholar]
  42. Zhang, P. Scaling for quantum tunneling current in nano- and subnano-scale plasmonic junctions. Sci. Rep. 2015, 5, 9826. [Google Scholar] [CrossRef] [PubMed] [Green Version]
Figure 1. Scanning electron microscope (SEM) image of a typical single vertical carbon nanotube (CNT) fiber. Inset: the fiber tip after cutting by razor blade.
Applsci 08 01175 g001
Figure 2. Schematic of the field emitter configurations (a) single vertical CNT fiber, (b) looped CNT fiber. In the experiments, the diameter of the fiber is 21.3 μm and the height of the emitters is h = 4 mm. I 0 is the emission current.
Applsci 08 01175 g002
Figure 3. (a) Schematic and (b) photograph of the experimental setup for the field emission measurements and the infrared (IR) (or optical) imaging.
Applsci 08 01175 g003
Figure 4. Current-voltage (I-V) curves for both the single vertical CNT fiber and the looped CNT fiber emitters.
Applsci 08 01175 g004
Figure 5. The Fowler–Nordheim (FN) plot of the FE data in Figure 4, for both the single vertical CNT fiber and the looped CNT fiber emitters.
Applsci 08 01175 g005
Figure 6. Optical image of the (a) looped CNT fiber and (b) single vertical CNT fiber. Temperature distribution of the (c) looped CNT fiber and (d) vertical CNT fiber, obtained from the IR camera.
Applsci 08 01175 g006
Figure 7. Long-term stability measurement for both the vertical and looped CNT fiber emitters.
Applsci 08 01175 g007
Figure 8. Temperature dependent thermal and electrical conductivities of the CNT fiber, measured from the 3 Omega method. Dashed lines are for a linear fit to the electrical conductivity, σ [ S / m ] = 366.09 T [ K ] + 582,096 and to the thermal conductivity, κ [ W / mK ] = 0.1298 T [ K ] + 218.75 . Dotted lines are for a polynomial fit to the thermal conductivity, κ [ W / mK ] = 2.4 × 10 7 / T [ K ] 2 70,369 / T [ K ] + 161.11 . These curve fittings are used in Equation (2) to estimate the maximum temperature in the fiber emitters.
Applsci 08 01175 g008
Table 1. Comparison of the measured maximum temperature and its location for both the vertical and looped fiber emitters, with the theory [27] of Equation (2) under various assumptions.
Carbon Nanotube (CNT) Fiber EmitterMeasuredConstant σ and κ Constant σ and Linear κ ( T ) Linear σ ( T ) and Polynomial Fit to κ ( T )
Vertical T m a x [ ° C ]~600580595600
S m a x [mm]~3.043.53.1
Looped T m a x [ ° C ]~300254286300
S m a x [mm]~4444

