The Role of Managerial Commitment and TPM Implementation Strategies in Productivity Benefits

 ,
,  , , ,
, , , 
Abstract
:Featured Application
Abstract
1. Introduction
2. Maintenance and Concepts
2.1. Critical Success Factors of TPM
2.2. Preventive Maintenance
2.3. TPM Benefits
3. Hypotheses and Literature Review
4. Materials and Methods
4.1. Stage 1: Survey Design
4.2. Stage 2: Survey Administration
4.3. Stage 3: Data Capture and Screening
- The standard deviation was calculated; if the value was lower than 0.5, that case was removed, since all the items had a similar value [55].
4.4. Stage 4: Survey Validation
- R-squared and adjusted R-squared for the predictive validity of the survey from a parametric perspective; only values over 0.2 were acceptable.
- Q-squared for the predictive validity of the survey from a nonparametric perspective; acceptable Q-squared values, and their R-square values, must be greater than 0.
- Cronbach’s alpha and compound reliability index for internal variability of the latent variables; internal validity can be estimated based on the variance or correlation index between the items of a latent variable [61], and acceptable values must be greater than 0.7.
- Average variance extracted (AVE) for the convergent validity of the items in the latent variables; acceptable values must be greater than 0.5.
- Average block variance inflation factor (VIF) and average full collinearity VIF (AFVIF) for the collinearity of the items in the latent variables; acceptable values must be less than 3.3.
4.5. Stage 5: Structural Equation Model
- Average path coefficient (APC): statistically validates the hypotheses in a generalized way. The p-value must be less than 0.05.
- Average R-squared (ARS) and average adjusted R-squared (AARS): measure the model’s predictive validity. Acceptable p-values for ARS and AARS must be less than 0.05. The null hypotheses to be tested are APC = 0 and ARS = 0 against the alternative hypotheses, where and .
- Average variance inflation factor (AVIF) and average full collinearity VIF (AFVIF): measure the level of collinearity between the latent variables. The acceptable value must be less than 3.3.
- Tenenhaus goodness of fit (GoF): measures the explanatory power of the model. The GoF value must be greater than 0.36.
4.5.1. Direct Effects
4.5.2. Indirect Effects and Total Effects
4.5.3. Sensitivity Analysis
5. Results
5.1. Sample Description
5.2. Survey Statistical Validation
5.3. Structural Equation Model
5.3.1. Direct Effects
5.3.2. Indirect Effects
5.3.3. Total Effects
5.3.4. Sensitivity Analysis
6. Conclusions and Industrial Implications
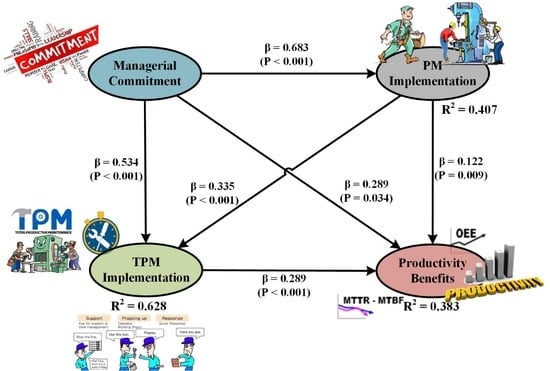
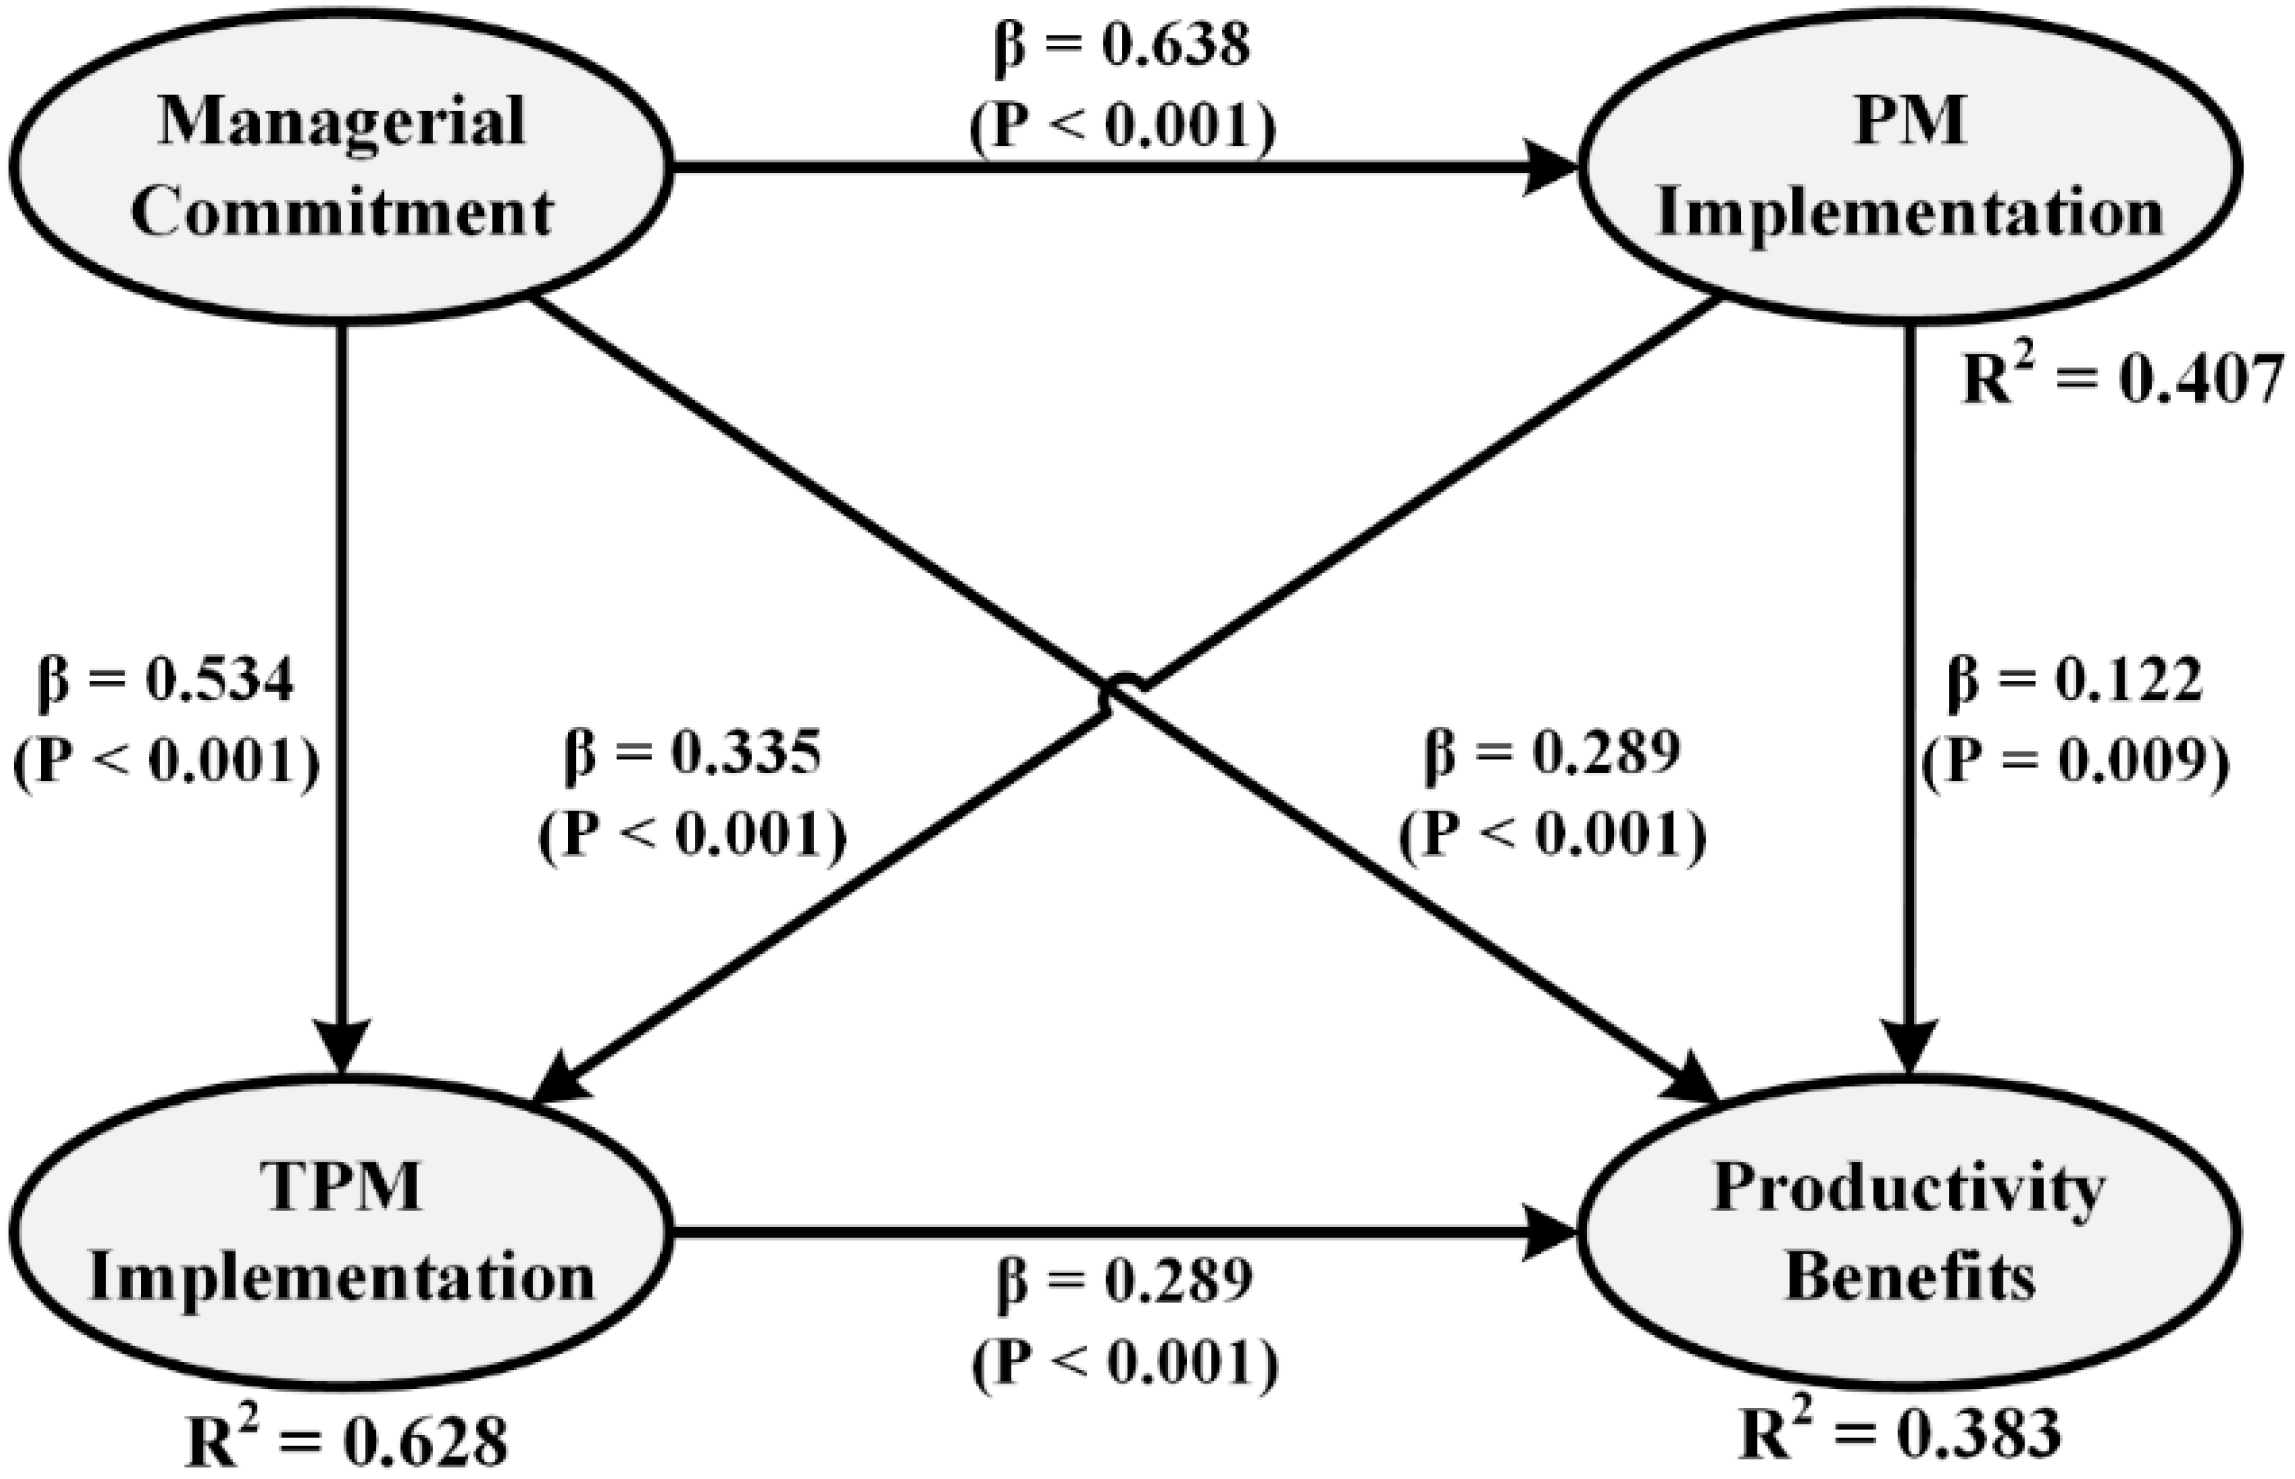
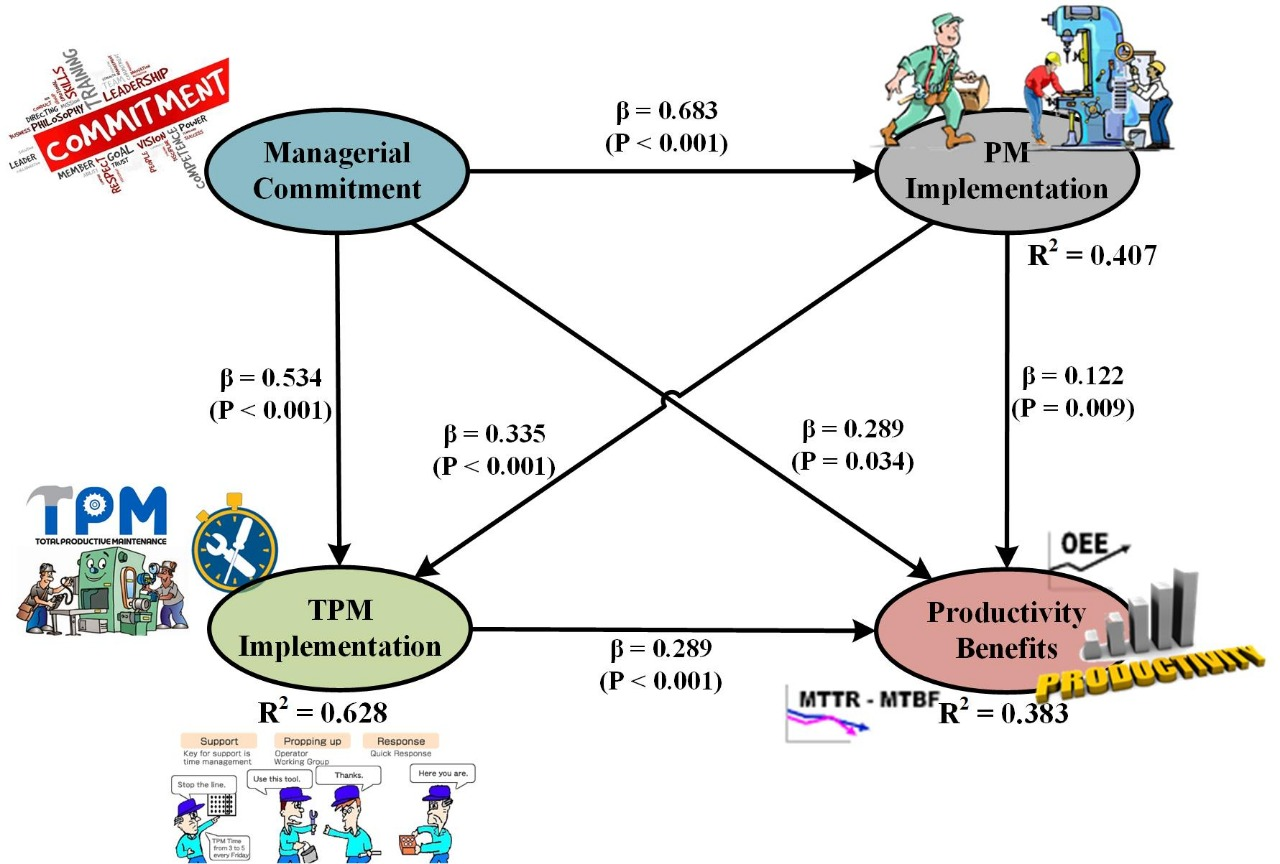
- Based on the R2 values, TPM implementation has a 62.8% dependence on two variables, but managerial commitment explains most of the variability in 40%. In this sense, manufacturing companies must encourage department leaders and managers to embrace their responsibility for and commitment to TPM. Similarly, managers must promote the active participation of maintenance staff and communicate a corporate vision centered on quality and equipment maintenance, and among these aspects, they must be actively involved in TPM projects. Two other responsibilities of senior managers are to make sure that staff commitment to TPM is aligned with the corporate mission and supervise tracking of the implemented maintenance plans.
- The managerial commitment latent variable explains 40.7% of PM implementation variability. Therefore, for a preventive maintenance program to be successful, managerial commitment is necessary. Hence, PM programs must be focused on adjusting and changing components before the equipment fails. Also, preventing machine failures must be promoted by managers, since they need to understand the components’ life cycle and generate a replacement plan.
- TPM is a set of programs, among which is preventive maintenance. According to the findings, PM implementation is an important antecedent to any comprehensive TPM program. In fact, in this research, PM implementation explains 22.8% of the variability of TPM implementation. These findings imply that TPM managers and operators must focus their efforts on preventive maintenance programs that consider the components’ life cycle to make changes before machines fail.
- Statistically, three latent variables explain 38.3% of the productivity benefits latent variable: TPM implementation (16.4%), managerial commitment (16.2%), and PM implementation (5.7%). Such estimates imply that managers must pay close attention to the first two variables, since they have the largest effects. Although the direct impact from PM implementation is low in productivity benefits, the indirect effect has a value of 0.097, which can explain 4.55%. In the end, the total effects of PM implementation on productivity benefits have a value of 0.218 units, and this latent variable explains up to 10.2%. In other words, preventive maintenance as a part of TPM implementation is vital if companies aim to obtain productivity benefits.
- The total effects of managerial commitment are larger than 0.5 standard deviations, demonstrating that this variable is a key element in productivity, TPM success, and PM programs. Consequently, TPM operators must always demand managerial support before starting any preventive maintenance program, because managerial commitment on its own does not guarantee all the productivity benefits, since its direct effects on this variable were only 0.289. On the other hand, the total effects of managerial commitment on productivity benefits where the TPM and PM were involved had a value of 0.582.
- It is interesting to observe the relationship between managerial commitment and productivity benefits obtained from TPM, where the direct effect was only 0.289, but the indirect effect that occurs through the mediating variables PM implementation and TPM implementation was 0.293, that is, the indirect effect is greater than the direct effect, and the sum gives a total effect of 0.582. The foregoing indicates that management commitment is not sufficient to obtain productivity benefits, because it is necessary to have a labor culture focused on conserving the machinery and equipment that can be reflected in a preventive maintenance program, but in addition, a more holistic TPM implementation program in which all departments of the company are integrated is required.
- Based on information in Table 10, the following conclusions can be summarized:
- High managerial commitment levels are not associated with low productivity benefits levels, even if the probability of simultaneous occurrence is zero.
- Even if managerial commitment is low, it is possible to obtain high productivity benefits, because these may come from other sources.
- Having low managerial commitment levels represent a risk in PM implementation, TPM implementation, and productivity benefits.
- High TPM implementation levels guarantee high productivity benefits levels.
- There is no statistical evidence to declare that the automotive industrial sector is different from other sectors when multiple groups are analyzed.
7. Research Limitations and Suggestions for Future Work
Author Contributions
Funding
Acknowledgments
Conflicts of Interest
References
- Tang, Y.; Liu, Q.; Jing, J.; Yang, Y.; Zou, Z. A framework for identification of maintenance significant items in reliability centered maintenance. Energy 2017, 118, 1295–1303. [Google Scholar] [CrossRef]
- Singh, R.; Gohil, A.M.; Shah, D.B.; Desai, S. Total productive maintenance (TPM) implementation in a machine shop: A case study. Procedia Eng. 2013, 51, 592–599. [Google Scholar] [CrossRef]
- Andersson, R.; Manfredsson, P.; Lantz, B. Total productive maintenance in support processes: An enabler for operation excellence. Total Qual. Manag. Bus. Excell. 2015, 26, 1042–1055. [Google Scholar] [CrossRef]
- Pettersen, J. Defining lean production: Some conceptual and practical issues. TQM J. 2009, 21, 127–142. [Google Scholar] [CrossRef]
- Nakajima, S. Total Productive Maintenance; Productivity Press: London, UK, 1998. [Google Scholar]
- Attri, R.; Grover, S.; Dev, N.; Kumar, D. An ISM approach for modelling the enablers in the implementation of total productive maintenance (TPM). Int. J. Syst. Assur. Eng. Manag. 2013, 4, 313–326. [Google Scholar] [CrossRef]
- Eti, M.C.; Ogaji, S.O.T.; Probert, S.D. Implementing total productive maintenance in Nigerian manufacturing industries. Appl. Energy 2004, 79, 385–401. [Google Scholar] [CrossRef] [Green Version]
- Rahman, C.M.L. Assessment of Total Productive Maintenance Implementation in a Semiautomated Manufacturing Company Through Downtime and Mean Downtime Analysis. In Proceedings of the 2015 International Conference on Industrial Engineering and Operations Management (IEOM), Aveiro, Portugal, 3–5 March 2015; pp. 1–9. [Google Scholar]
- Ahuja, I.P.S.; Khamba, J.S. Total productive maintenance: Literature review and directions. Int. J. Qual. Reliab. Manag. 2008, 25, 709–756. [Google Scholar] [CrossRef]
- Bon, A.T.; Lim, M. Total Productive Maintenance in Automotive Industry: Issues and Effectiveness. In Proceedings of the 2015 International Conference on Industrial Engineering and Operations Management (IEOM), Aveiro, Portugal, 3–5 March 2015; pp. 1–6. [Google Scholar]
- Barrios, L.J.; Minguillón, J.; Perales, F.J.; Ron-Angevin, R.; Solé-Casals, J.; Mañanas, M.A. Estado del arte en neurotecnologías para la asistencia y la rehabilitación en españa: Tecnologías auxiliares, trasferencia tecnológica y aplicación clínica. Revista Iberoamericana de Automática e Informática Industrial RIAI 2017, 14, 355–361. [Google Scholar] [CrossRef]
- Ng, K.C.; Goh, G.G.G.; Eze, U.C. Critical Success Factors of Total Productive Maintenance Implementation: A Review. In Proceedings of the 2011 IEEE International Conference on Industrial Engineering and Engineering Management, Changchun, China, 6–9 December 2011; pp. 269–273. [Google Scholar]
- Gupta, P.; Vardhan, S.; Haque, M.S.A. Study of Success Factors of TPM Implementation in Indian Industry Towards Operational Excellence: An Overview. In Proceedings of the 2015 International Conference on Industrial Engineering and Operations Management (IEOM), Aveiro, Portugal, 3–5 March 2015. [Google Scholar]
- Gómez, A.H.; Toledo, C.E.; Prado, J.M.L.; Morales, S.N. Factores críticos de éxito para el despliegue del mantenimiento productivo total en plantas de la industria maquiladora para la exportación en ciudad juárez: Una solución factorial. Contaduría y Administración 2015, 60, 82–106. [Google Scholar] [CrossRef]
- Shen, C.C. Discussion on key successful factors of TPM in enterprises. J. Appl. Res. Technol. 2015, 13, 425–427. [Google Scholar] [CrossRef]
- Willmott, P.; McCarthy, D. 2—Assessing the true costs and benefits of TPM. In Total Productivity Maintenance, 2nd ed.; Butterworth-Heinemann: Oxford, UK, 2001; pp. 17–22. [Google Scholar]
- Park, K.S.; Han, S.W. TPM—total productive maintenance: impact on competitiveness and a framework for successful implementation. Hum. Factors Ergon. Manuf. Serv. Ind. 2001, 11, 321–338. [Google Scholar] [CrossRef]
- Bamber, C.J.; Sharp, J.M.; Hides, M.T. Factors affecting successful implementation of total productive maintenance: A UK manufacturing case study perspective. J. Qual. Maint. Eng. 1999, 5, 162–181. [Google Scholar] [CrossRef]
- Netland, T.H. Critical success factors for implementing lean production: The effect of contingencies. Int. J. Prod. Res. 2016, 54, 2433–2448. [Google Scholar] [CrossRef]
- McAdam, R.; Duffner, A.-M. Implementation of total productive maintenance in support of an established total quality programme. Total. Qual. Manag. 1996, 7, 613–630. [Google Scholar] [CrossRef]
- Kamath, N.H.; Rodrigues, L.L.R. Simultaneous consideration of TQM and TPM influence on production performance: A case study on multicolor offset machine using SD model. Perspect. Sci. 2016, 8, 16–18. [Google Scholar] [CrossRef]
- Chlebus, E.; Helman, J.; Olejarczyk, M.; Rosienkiewicz, M. A new approach on implementing TPM in a mine—A case study. Arch. Civ. Mech. Eng. 2015, 15, 873–884. [Google Scholar] [CrossRef]
- Ahuja, I.P.S.; Khamba, J.S. Strategies and success factors for overcoming challenges in TPM implementation in Indian manufacturing industry. J. Qual. Maint. Eng. 2008, 14, 123–147. [Google Scholar] [CrossRef]
- AMAC. Infogramas. Available online: https://indexjuarez.com/estadisticas/infograma (accessed on 12 May 2018). (In Spanish).
- Caralli, R.; Stevens, J.; Willke, B.; Wilson, W. The Critical Success Factor Method: Establishing a Foundation for Enterprise Security Management. Available online: https://resources.sei.cmu.edu/library/asset-view.cfm?assetid=7129 (accessed on 18 April 2018).
- Piechnicki, A.S.; Herrero Sola, A.V.; Trojan, F. Decision-making towards achieving world-class total productive maintenance. Int. J. Oper. Prod. Manag. 2015, 35, 1594–1621. [Google Scholar] [CrossRef]
- Hernández Gómez, J.A.; Noriega Morales, S.; Pérez, L.R.; Romero López, R.; Guillen Anaya, L.G. Factores críticos de éxito para la implementación estratégica del MPT: Una revisión de literatura Ingeniería Industrial. Actualidad y Nuevas Tendencias 2014, 4, 14. [Google Scholar]
- Moghaddam, K.S. Preventive maintenance and replacement optimization on CNC machine using multiobjective evolutionary algorithms. Int. J. Adv. Manuf. Technol. 2015, 76, 2131–2146. [Google Scholar] [CrossRef]
- Swanson, L. Linking maintenance strategies to performance. Int. J. Prod. Econ. 2001, 70, 237–244. [Google Scholar] [CrossRef]
- McKone, K.E.; Schroeder, R.G.; Cua, K.O. The impact of total productive maintenance practices on manufacturing performance. J. Oper. Manag. 2001, 19, 39–58. [Google Scholar] [CrossRef]
- Nourelfath, M.; Nahas, N.; Ben-Daya, M. Integrated preventive maintenance and production decisions for imperfect processes. Reliab. Eng. Syst. Saf. 2016, 148, 21–31. [Google Scholar] [CrossRef]
- Eti, M.C.; Ogaji, S.O.T.; Probert, S.D. Reducing the cost of preventive maintenance (PM) through adopting a proactive reliability-focused culture. Appl. Energy 2006, 83, 1235–1248. [Google Scholar] [CrossRef] [Green Version]
- Anis, C.; Nidhal, R.; Mehdi, R. Simultaneous determination of production lot size and preventive maintenance schedule for unreliable production system. J. Qual. Maint. Eng. 2008, 14, 161–176. [Google Scholar]
- Shrivastava, D.; Kulkarni, M.S.; Vrat, P. Integrated design of preventive maintenance and quality control policy parameters with CUSUM chart. Int. J. Adv. Manuf. Technol. 2016, 82, 2101–2112. [Google Scholar] [CrossRef]
- Fumagalli, L.; Macchi, M.; Giacomin, A. Orchestration of preventive maintenance interventions. In Proceedings of the 20th IFAC World Congress, Toulouse, France, 9–14 July 2017; pp. 13976–13981. [Google Scholar]
- Ma, L.; Dong, S.; Gong, Y.; Yu, G. Study on application of TPM in small and medium-sized enterprises. In Proceedings of the MSIE 2011, Harbin, China, 6–11 January 2011; pp. 678–681. [Google Scholar]
- Ng, K.C.; Chong, K.E.; Goh, G.G.G. Total Productive Maintenance Strategy in a Semiconductor Manufacturer: A Case Study. In Proceedings of the 2013 IEEE International Conference on Industrial Engineering and Engineering Management, Bangkok, Thailand, 10–13 December 2013; pp. 1184–1188. [Google Scholar]
- Rodrigues, M.; Hatakeyama, K. Analysis of the fall of TPM in companies. J. Mater. Process. Technol. 2006, 179, 276–279. [Google Scholar] [CrossRef]
- Mwanza, B.G.; Mbohwa, C. Design of a total productive maintenance model for effective implementation: Case study of a chemical manufacturing company. Procedia Manuf. 2015, 4, 461–470. [Google Scholar] [CrossRef]
- Tsuchiya, S. Quality Maintenance: Zero Defects through Equipment Management; Productivity Press: London, UK, 1992. [Google Scholar]
- Chan, F.T.S.; Lau, H.C.W.; Ip, R.W.L.; Chan, H.K.; Kong, S. Implementation of total productive maintenance: A case study. Int. J. Prod. Econ. 2005, 95, 71–94. [Google Scholar] [CrossRef]
- Smith, R.; Mobley, R.K. Chapter 7—Total productive maintenance. In Rules of Thumb for Maintenance and Reliability Engineers; Butterworth-Heinemann: Burlington, VT, USA, 2008; pp. 107–120. [Google Scholar]
- Campuzano-Cervantes, J.; Meléndez-Pertuz, F.; Núñez-Perez, B.; Simancas-García, J. Sistema de monitoreo electrónico de desplazamiento de tubos de extensión para junta expansiva. Revista Iberoamericana de Automática e Informática Industrial RIAI 2017, 14, 268–278. [Google Scholar] [CrossRef]
- Abhishek, J.; Rajbir, B.; Harwinder, S. Total productive maintenance (TPM) implementation practice: A literature review and directions. Int. J. Lean Six Sigma 2014, 5, 293–323. [Google Scholar]
- Nakajima, S. Introduction to TPM: Total Productive Maintenance; Productivity Press: Cambridge, MA, USA, 1988. [Google Scholar]
- Nakajima, S. TPM Development Program: Implementing Total Productive Maintenance; Productivity Press: Cambridge, MA, USA, 1989. [Google Scholar]
- Lycke, L. Team development when implementing TPM. Total. Qual. Manag. Bus. Excell. 2003, 14, 205–213. [Google Scholar] [CrossRef]
- Ahmad, N.; Hossen, J.; Ali, S.M. Improvement of overall equipment efficiency of ring frame through total productive maintenance: A textile case. Int. J. Adv. Manuf. Technol. 2018, 94, 239–256. [Google Scholar] [CrossRef]
- Chong, M.Y.; Chin, J.F.; Hamzah, H.S. Transfer of total productive maintenance practice to supply chain. Total Qual. Manag. Bus. Excell. 2012, 23, 467–488. [Google Scholar] [CrossRef]
- Ahuja, I.P.S.; Khamba, J.S. An evaluation of TPM initiatives in Indian industry for enhanced manufacturing performance. Int. J. Qual. Reliab. Manag. 2008, 25, 147–172. [Google Scholar] [CrossRef]
- Kalir, A.A.; Rozen, K.; Morrison, J.R. Evaluation of preventive maintenance segregation: A multi factorial study. IEEE Trans. Semicond. Manuf. 2017, 30, 508–514. [Google Scholar] [CrossRef]
- Chalabi, N.; Dahane, M.; Beldjilali, B.; Neki, A. Optimisation of preventive maintenance grouping strategy for multi-component series systems: Particle swarm based approach. Comput. Ind. Eng. 2016, 102, 440–451. [Google Scholar] [CrossRef]
- Avelar-Sosa, L.; García-Alcaraz, J.L.; Vergara-Villegas, O.O.; Maldonado-Macías, A.A.; Alor-Hernández, G. Impact of traditional and international logistic policies in supply chain performance. Int. J. Adv. Manuf. Technol. 2015, 76, 913–925. [Google Scholar] [CrossRef]
- Duenckel, J.R.; Soileau, R.; Pittman, J.D. Preventive maintenance for electrical reliability: A proposed metric using mean time between failures plus finds. IEEE Ind. Appl. Mag. 2017, 23, 45–56. [Google Scholar] [CrossRef]
- Leys, C.; Ley, C.; Klein, O.; Bernard, P.; Licata, L. Detecting outliers: Do not use standard deviation around the mean, use absolute deviation around the median. J. Exp. Soc. Psychol. 2013, 49, 764–766. [Google Scholar] [CrossRef] [Green Version]
- Hair, J.F.J.; Black, W.C.; Babin, B.J.; Anderson, R.E. Multivariate Data Analysis; Prentice Hall: Upper Saddle River, NJ, USA, 2013. [Google Scholar]
- Lynch, S.M. Introduction to Applied Bayesian Statistics and Estimation for Social Scientists; Springer Science & Business Media: New York, NY, USA, 2007. [Google Scholar]
- Kohler, M.; Müller, F.; Walk, H. Estimation of a regression function corresponding to latent variables. J. Stat. Plan. Inference 2015, 162, 22. [Google Scholar] [CrossRef]
- Tabachnick, B.; Fidell, L. Using Multivariate Statistics, 2nd ed.; Pearson: Chennai, India, 2013. [Google Scholar]
- Kock, N. Warppls 5.0 User Manual; ScriptWarp Systems: Laredo, TX, USA, 2015. [Google Scholar]
- Adamson, K.A.; Prion, S. Reliability: Measuring internal consistency using Cronbach’s α. Clin. Simul. Nurs. 2013, 9, e179–e180. [Google Scholar] [CrossRef]
- Evermann, J.; Tate, M. Assessing the predictive performance of structural equation model estimators. J. Bus. Res. 2016, 69, 4565–4582. [Google Scholar] [CrossRef]
- Jenatabadi, H.S.; Ismail, N.A. Application of structural equation modelling for estimating airline performance. J. Air Transp. Manag. 2014, 40, 25–33. [Google Scholar] [CrossRef]
- Kock, N. Advanced mediating effects tests, multi-group analyses, and measurement model assessments in PLS-based SEM. Int. J. e-Collab. 2014, 10, 1–13. [Google Scholar] [CrossRef]
- Midiala Oropesa, V.; Jorge Luis García, A.; Aidé Aracely Maldonado, M.; Valeria Martínez, L. The impact of managerial commitment and kaizen benefits on companies. J. Manuf. Technol. Manag. 2016, 27, 692–712. [Google Scholar] [CrossRef]
- García-Alcaraz, J.L.; Prieto-Luevano, D.J.; Maldonado-Macías, A.A.; Blanco-Fernández, J.; Jiménez-Macías, E.; Moreno-Jiménez, J.M. Structural equation modeling to identify the human resource value in the JIT implementation: Case maquiladora sector. Int. J. Adv. Manuf. Technol. 2015, 77, 1483–1497. [Google Scholar] [CrossRef]
- Mendoza-Fong, J.R.; García-Alcaraz, J.L.; Ochoa-Domínguez, H.d.J.; Cortes-Robles, G. Green production attributes and its impact in company’s sustainability. In New Perspectives on Applied Industrial Tools and Techniques; García-Alcaraz, J.L., Alor-Hernández, G., Maldonado-Macías, A.A., Sánchez-Ramírez, C., Eds.; Springer: Cham, Switerland, 2018; pp. 23–46. [Google Scholar]

| Latent Variable | Items |
|---|---|
| preventive maintenance (PM) Implementation [51,54] | preventive maintenance as a quality strategy. |
| maintenance department committed to prevention and operator support. | |
| report the maintenance actions performed on the equipment. | |
| disclose statistics of the maintenance records. | |
| easy access to equipment maintenance records. | |
| record the quality generated by the equipment. | |
| identify causes of machine failures and report the statistics. | |
| TPM implementation [4,26,27] | proper education and training of maintenance staff. |
| follow-up and control of the maintenance program. | |
| commitment from managers and maintenance staff. | |
| managerial leadership in TPM execution. | |
| leadership from production and engineering departments in TPM execution. | |
| maintenance staff leadership in TPM execution. | |
| communication between production and maintenance departments. | |
| knowledge of critical machine systems. | |
| TPM focused on the life cycle of machine systems, parts, and components. | |
| purchase of machines and equipment based on TPM. | |
| managerial commitment [26,27,39] | department leaders embrace their TPM responsibilities. |
| top managers lead TPM execution. | |
| meetings are held between production and maintenance departments. | |
| top managers promote employee participation and encourage preservation of the work team. | |
| top managers develop and communicate a quality- and maintenance-centered vision. | |
| top managers are directly involved in maintenance projects. | |
| productivity benefits [15,37] | elimination of productivity losses. |
| increased equipment reliability and availability. | |
| reduction of maintenance costs. | |
| improved final product quality. | |
| decreased spare parts inventory costs. | |
| improved corporate technology. | |
| improved response to market changes. | |
| development of corporate competitive skills |
| Value | 1 | 2 | 3 | 4 | 5 |
|---|---|---|---|---|---|
| interpretation | never | rarely | regularly | frequently | always |
| Job Position | Industrial Sector | ||||||
|---|---|---|---|---|---|---|---|
| Aeronautics | Electrics | Automotive | Electronics | Medical | Other | Total | |
| technician | 0 | 21 | 74 | 29 | 7 | 11 | 142 |
| operator | 1 | 4 | 41 | 11 | 10 | 12 | 79 |
| engineer | 3 | 6 | 32 | 7 | 4 | 1 | 53 |
| supervisor | 1 | 9 | 22 | 8 | 2 | 6 | 48 |
| manager | 0 | 1 | 1 | 1 | 2 | 1 | 6 |
| other | 0 | 0 | 2 | 0 | 0 | 1 | 3 |
| total | 5 | 41 | 172 | 56 | 25 | 32 | 331 |
| Index | Managerial Commitment | TPM Implementation | PM Implementation | Productivity Benefits |
|---|---|---|---|---|
| R-squared | – | 0.628 | 0.407 | 0.382 |
| adj. R-squared | – | 0.626 | 0.405 | 0.377 |
| composite reliability | 0.942 | 0.939 | 0.902 | 0.956 |
| cronbach’s alpha | 0.926 | 0.928 | 0.873 | 0.948 |
| average | 0.729 | 0.608 | 0.569 | 0.732 |
| variance inflation factor | 2.560 | 2.804 | 1.982 | 1.499 |
| Q-squared | – | 0.630 | 0.409 | 0.381 |
| Index | Value |
|---|---|
| average path coefficient (APC) | 0.368, p < 0.001 |
| average R-squared (ARS) | 0.472, p < 0.001 |
| average adjusted R-squared (AARS) | 0.470, p < 0.001 |
| average block VIF (AVIF); acceptable if ≤ 5, ideally ≤ 3.3 | 1.912 |
| average full collinearity VIF (AFVIF); acceptable if ≤ 5, ideally ≤ 3.3 | 2.211 |
| tenenhaus goodness of fit (GoF); small ≥ 0.1, medium ≥ 0.25, large ≥ 0.36 | 0.558 |
| Hypothesis | Independent Variable | Dependent Variable | β | p-Value | Conclusion |
|---|---|---|---|---|---|
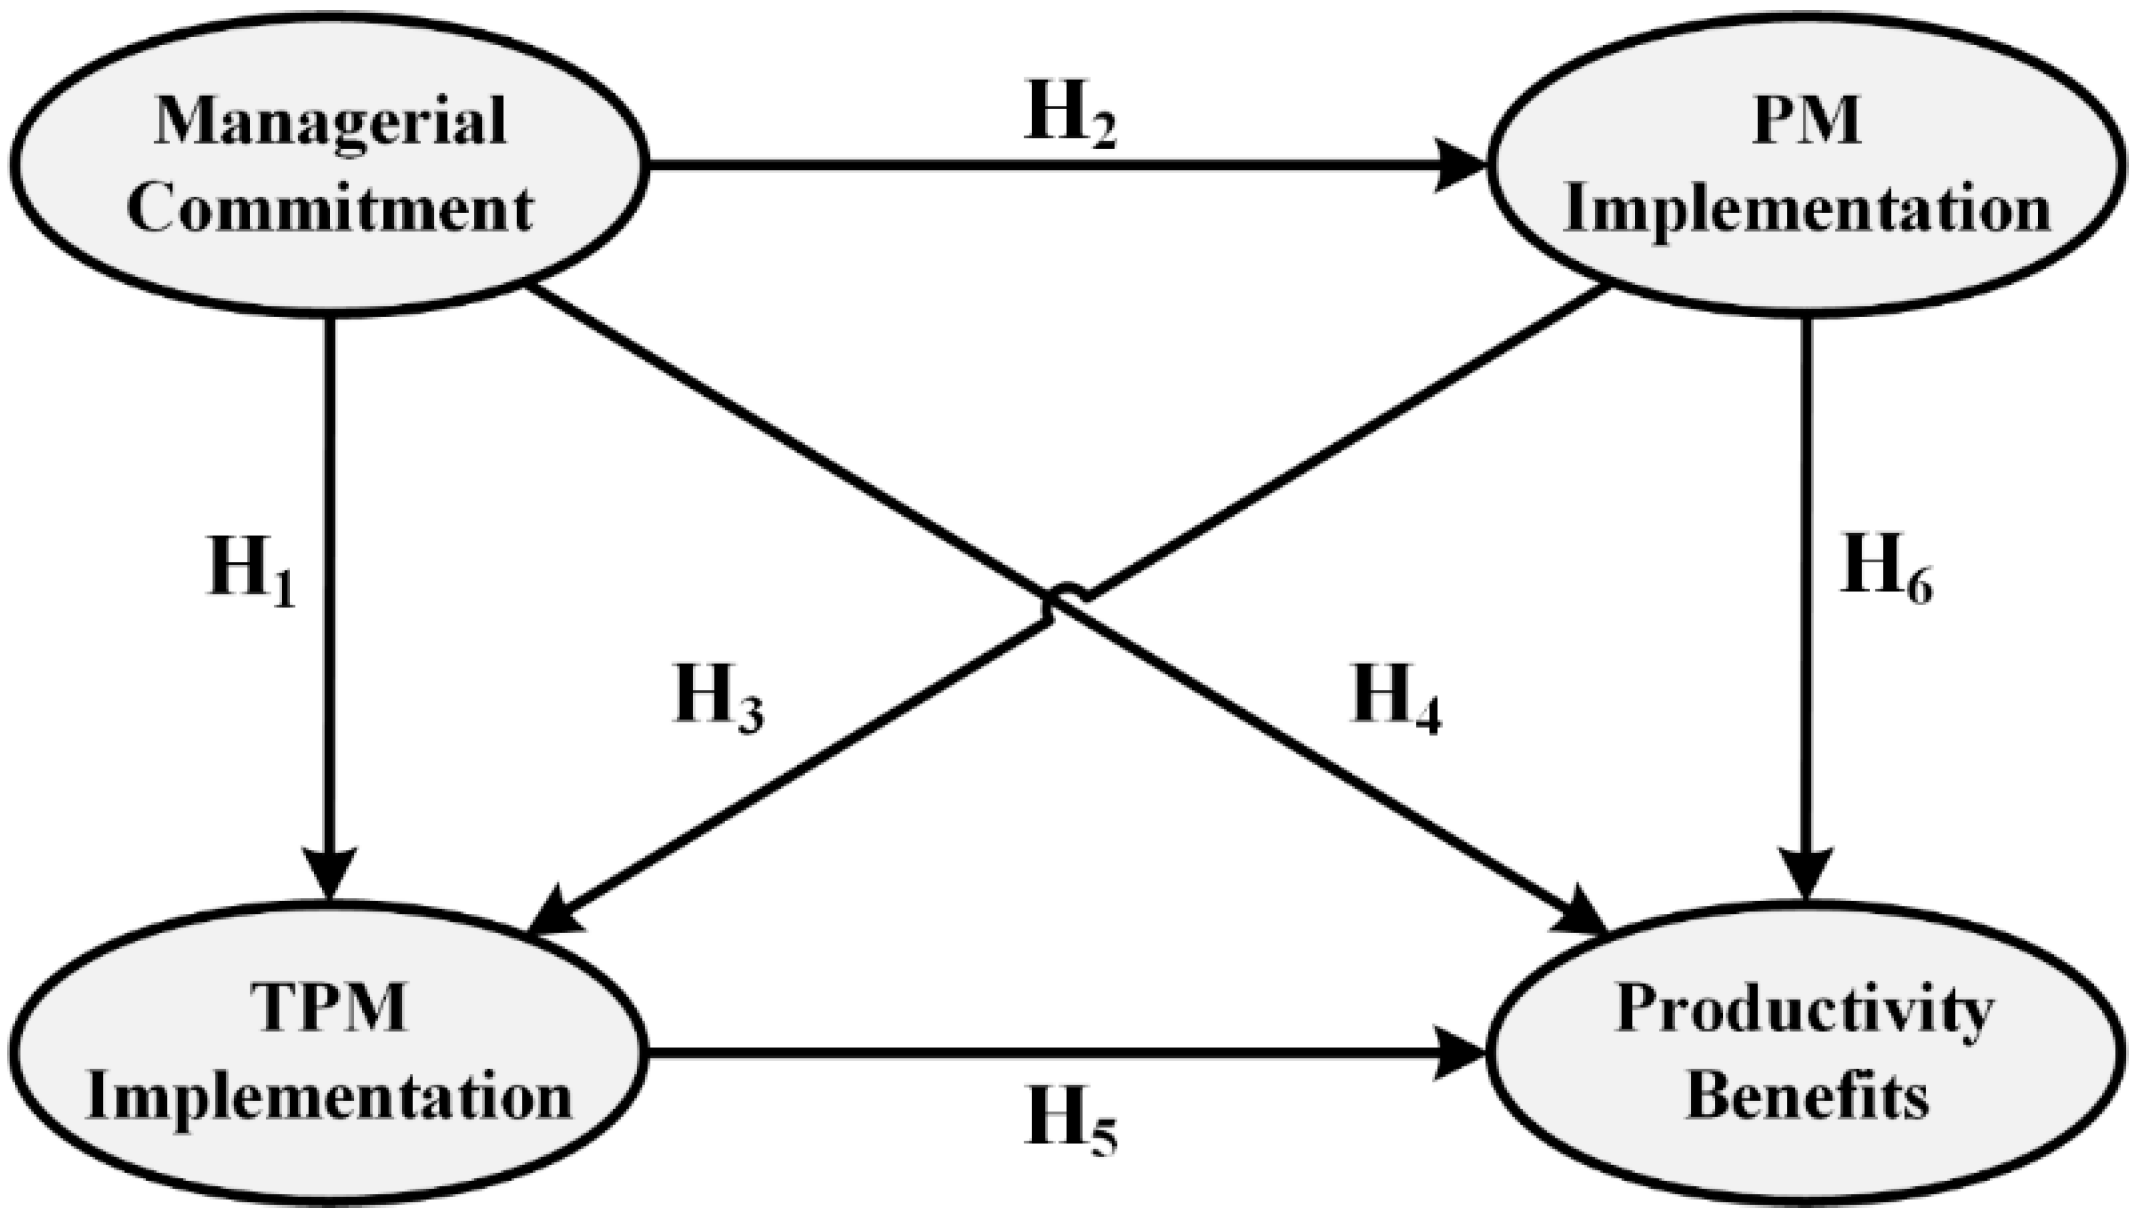
| H1 | managerial commitment | TPM implementation | 0.534 | <0.001 | accepted |
| H2 | managerial commitment | PM implementation | 0.638 | <0.001 | accepted |
| H3 | PM implementation | TPM implementation | 0.335 | <0.001 | accepted |
| H4 | managerial commitment | productivity benefits | 0.289 | <0.001 | accepted |
| H5 | TPM implementation | productivity benefits | 0.289 | <0.001 | accepted |
| H6 | PM implementation | productivity benefits | 0.122 | =0.009 | accepted |
| Dependent Variable | Independent Variable | |
|---|---|---|
| Managerial Commitment | PM Implementation | |
| TPM implementation | 0.214 p < 0.001 ES = 0.160 | - |
| productivity benefits | 0.293 p < 0.001 ES = 0.165 | 0.097 p = 0.004 ES = 0.045 |
| Dependent Variable | Independent Variable | ||
|---|---|---|---|
| Managerial Commitment | TPM Implementation | PM Implementation | |
| TPM implementation | 0.748 p < 0.001 ES = 0.561 | - | 0.335 p < 0.001 ES = 0.228 |
| PM implementation | 0.638 p < 0.001 ES = 0.407 | - | - |
| productivity benefits | 0.582 p < 0.001 ES = 0.326 | 0.289 p < 0.001 ES = 0.164 | 0.218 p < 0.001 ES = 0.102 |
| Latent Variable | Scenario | Probability |
|---|---|---|
| managerial commitment | – | 0.158 |
| + | 0.190 | |
| TPM implementation | – | 0.160 |
| + | 0.166 | |
| PM implementation | – | 0.190 |
| + | 0.179 | |
| productivity benefits | – | 0.155 |
| + | 0.190 |
| Dependent Variable | Independent Variable | ||||||
|---|---|---|---|---|---|---|---|
| Managerial Commitment | TPM Implementation | PM Implementation | |||||
| Scenario | – | + | – | + | – | + | |
| TPM implementation | – | & = 0.098 If = 0.621 | & = 0.003 If = 0.016 | ||||
| + | & = 0.005 If = 0.034 | & = 0.095 If = 0.565 | |||||
| PM implementation | – | & = 0.090 If = 0.569 | & = 0.008 If = 0.048 | & = 0.092 If = 0.486 | & = 0.003 If = 0.014 | ||
| + | & = 0.008 If = 0.052 | & = 0.084 If = 0.500 | & = 0.005 If = 0.030 | & = 0.087 If = 0.485 | |||
| productivity benefits | – | & = 0.065 If = 0.414 | & = 0.00 If = 0.00 | & = 0.076 If = 0.475 | & = 0.003 If = 0.016 | & = 0.065 If = 0.343 | & = 0.003 If = 0.015 |
| + | & = 0.027 If = 0.172 | & = 0.068 If = 0.403 | & = 0.027 If = 0.169 | & = 0.065 If = 0.393 | & = 0.024 If = 0.129 | & = 0.063 If = 0.348 | |
| Dependent Variable | Automotive Sector | Other Sectors | ||||
|---|---|---|---|---|---|---|
| Independent Variable | ||||||
| MC | PMI | TPMI | MC | PMI | TPMI | |
| PM implementation | 0.654 | - | - | 0.631 | - | - |
| TPM implementation | 0.49 | 0.364 | - | 0.573 | 0.298 | - |
| productivity benefits | 0.277 | 0.233 | 0.436 | 0.304 | 0.210 | 0.359 |
| Dependent Variable | Independent Variable | ||
|---|---|---|---|
| Managerial Commitment | TPM Implementation | PM Implementation | |
| TPM implementation | –0.098 to 0.1333 | - | - |
| PM implementation | –0.069 to 0.141 | –0.096 to 0.115 | - |
| productivity benefits | –0.032 to 0.178 | –0.035 to 0.174 | –0.104 to 0.107 |
© 2018 by the authors. Licensee MDPI, Basel, Switzerland. This article is an open access article distributed under the terms and conditions of the Creative Commons Attribution (CC BY) license (http://creativecommons.org/licenses/by/4.0/).
Share and Cite
Díaz-Reza, J.R.; García-Alcaraz, J.L.; Avelar-Sosa, L.; Mendoza-Fong, J.R.; Sáenz Diez-Muro, J.C.; Blanco-Fernández, J. The Role of Managerial Commitment and TPM Implementation Strategies in Productivity Benefits. Appl. Sci. 2018, 8, 1153. https://doi.org/10.3390/app8071153
Díaz-Reza JR, García-Alcaraz JL, Avelar-Sosa L, Mendoza-Fong JR, Sáenz Diez-Muro JC, Blanco-Fernández J. The Role of Managerial Commitment and TPM Implementation Strategies in Productivity Benefits. Applied Sciences. 2018; 8(7):1153. https://doi.org/10.3390/app8071153
Chicago/Turabian StyleDíaz-Reza, José Roberto, Jorge Luis García-Alcaraz, Liliana Avelar-Sosa, José Roberto Mendoza-Fong, Juan Carlos Sáenz Diez-Muro, and Julio Blanco-Fernández. 2018. "The Role of Managerial Commitment and TPM Implementation Strategies in Productivity Benefits" Applied Sciences 8, no. 7: 1153. https://doi.org/10.3390/app8071153
APA StyleDíaz-Reza, J. R., García-Alcaraz, J. L., Avelar-Sosa, L., Mendoza-Fong, J. R., Sáenz Diez-Muro, J. C., & Blanco-Fernández, J. (2018). The Role of Managerial Commitment and TPM Implementation Strategies in Productivity Benefits. Applied Sciences, 8(7), 1153. https://doi.org/10.3390/app8071153