Article

Using Ultrasonic Pulse and Artificial Intelligence to Investigate the Thermal-Induced Damage Characteristics of Concrete

1
Department of Civil Engineering, National Taipei University of Technology, Taipei 10608, Taiwan
2
Department of Civil and Construction Engineering, National Taiwan University of Science and Technology, Taipei 10607, Taiwan
3
Architecture and Building Research Institute, Ministry of the Interior, Taipei 23143, Taiwan
4
Department of Computer Science, National Chengchi University, Taipei 11605, Taiwan
*
Author to whom correspondence should be addressed.
Appl. Sci. 2018, 8(7), 1107; https://doi.org/10.3390/app8071107
Submission received: 30 May 2018 / Revised: 5 July 2018 / Accepted: 6 July 2018 / Published: 9 July 2018
(This article belongs to the Special Issue Selected Papers from the 2017 International Conference on Inventions)

Abstract

:

Featured Application

The developed wave velocity ratio measured using the ultrasonic pulse technique can be used to identify the degree of thermal-induced damage in concrete. It has a potential applying to investigate the degree of damage to buildings and the maximum fire temperature after a fire disaster.

Abstract

Using the traditional assessment method considering single-input and single-output variables, the correlation between ignition loss and maximum temperature is usually used to evaluate the fire-damage degree of concrete. To improve this method, multi-input and multi-output variables are examined in this study using a newly-developed experiment consisting of a thermo-induced damage test, ultrasonic pulse (UP) measurement technique, and uniaxial compressive test. The input variables include the designed strength, rate of heating, maximum temperature, and exposure time. The output variables include the stiffness, strength, toughness, and ratio of shear wave velocity to pressure wave velocity (Vs/Vp). Artificial intelligence (AI) is used to assess these variables. The test results show that the stiffness, strength, and toughness decreased with an increase in maximum temperature. The measured Vs/Vp has a high positive correlation with maximum temperature and the reduced ratio of stiffness, strength, and toughness. This correlation was also identified using AI analysis. The findings in this study suggest that the wave velocity ratio obtained using the UP technique can be applied to quantitatively evaluate thermal-induced damage in concrete.

1. Introduction

A reinforced concrete (RC) structure is the main system for buildings and construction in Taiwan. The quality/quantity evaluation of fire-induced damage in RC structures is important for living safety. Tovey [1] proposed several methods such as the color change identification method, core experiment, ultrasonic pulse (UP) measurement, and the correlation of concrete strength reduction with temperature to evaluate the degree of fire-damage. However, the color change identification method, core experiment, and UP measurement are not widely used due to their low accuracy [2]. The correlation between the ignition loss (weight loss) and the maximum fire temperature was usually investigated and used to evaluate the degree of fire-damage in past decades [3,4].
With the development of science and technology, the UP technique with a high accuracy has been developed and used as a non-destructive detection technique. However, the low correlation between pressure wave velocity (Vp) measured using UP measurement and uniaxial compressive strength was found by some researchers [5,6,7,8]. Artificial Intelligence was then used to construct a model of Vp and strength relation [9,10]. In this study, the correlation between UP wave velocity ratio Vs/Vp (ratio of shear wave velocity to pressure wave velocity) and the maximum temperature, reduced ratio of stiffness, strength, and toughness of concrete subjected to thermal damage was investigated. A new thermo-solid damage experiment that consisted of the thermo-induced damage test, UP measurement technique, and uniaxial compressive test was established. Furthermore, to identify these experimental results, the data mining/machine learning method was used to evaluate the correlation between thermal conditions (the rate of heating, maximum temperature, exposure time, as well as cooling condition), mechanical parameters (stiffness, strength, and toughness), and the UP wave velocity ratio.

2. Mechanical Behavior of Thermal-Induced Damage in Concrete

The thermal-induced damage process in concrete could be defined as the rate of heating, maximum temperature, exposure time, and cooling method. The effect of these four conditions on the mechanical behavior of concrete is defined as follows.

2.1. Heating Rate (Rheat)

The temperature difference between the surface and the center of the specimen generates thermal stress, causing crack formation. With a high heating rate, more cracks are formed, thus reducing the concrete strength. This mechanical behavior was observed by Anderberg and Thelandersson [11] who conducted compressive testing with different heating rates for concrete.

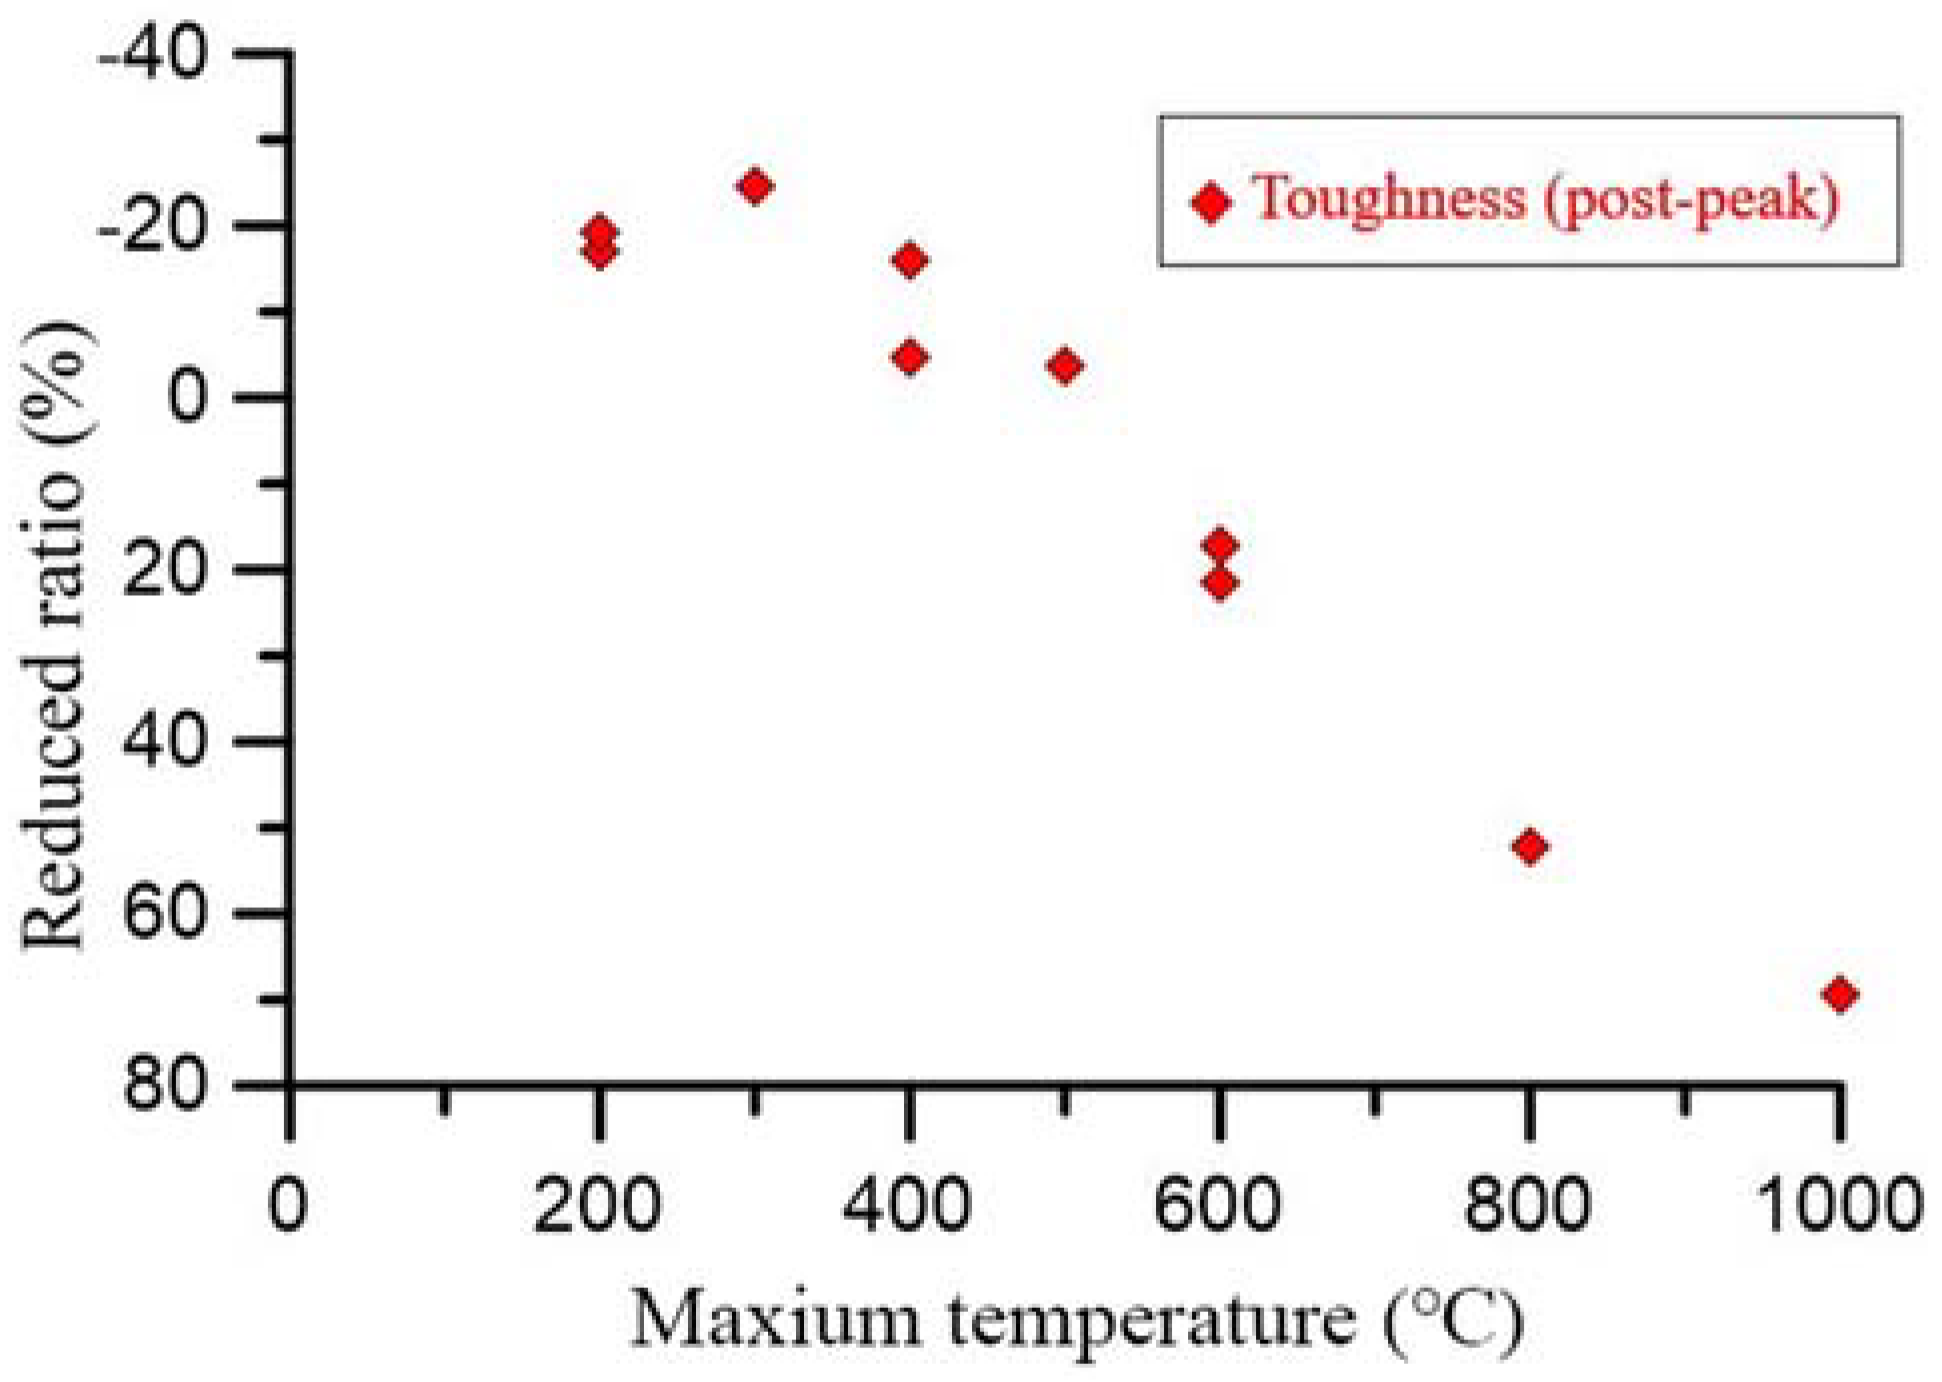
2.2. Maximum Temperature (Tmax)

The maximum temperature is the main factor that reduces concrete strength. High temperature makes the bonded water between the cement and particle material disappear and results in particle phase change. A crack is formed at the interface of these materials within the concrete. In general, with higher maximum temperature treatment, a lower stiffness and strength are produced [3,12].

2.3. Exposure Time (Etime)

Mohamedbhai [13], who conducted the heat-driven-damage test with different maximum temperatures (200, 400, 600, and 800 °C) and exposure times (1, 2, 3, and 4 h), indicated that concrete strength was reduced at the maximum temperature range from 300 °C to 600 °C with a 2 h exposure time.

2.4. Cooling Method (Mcool)

After the heat treatment, different cool down rates will also have different temperature effects on the specimen surface and center, inducing secondary damage in the concrete. The three cooling methods include cooling in a furnace, cooling in air, and cooling in water.

3. Thermal-Solid Damage Experiment

Thermal-solid damage experiments were conducted to investigate the thermal-induced characteristics of concrete. The uniaxial compressive test (stress-induced damage) was conducted after specimens were subjected to heating (thermal-induced damage) under different thermal-conditions (Table 1). Tests were designed based on the mechanical behavior of thermal-induced damage described in Section 2. During the testing, the circumferential extensometer was used to stabilize crack growth. Furthermore, after heating treatment, ultrasonic pulse measurement was used to find the correlation between UP waves and mechanical properties.

3.1. Thermo-Induced-Damage Concrete Specimen

The 70 MPa strength concrete produced by Ya Tung Ready Mixed Concrete Corporation in Taiwan was used as the test material. Considering the size effect and end effect, the specimens were fabricated into 50 mm × 45 mm × 120 mm cubes, as shown in Figure 1a. The cube specimens were then placed in an oven at 105 ± 5 °C and remained there for 24 h to produce void water dissipation. The prepared specimens were used to simulate thermal-induced damage with different temperature conditions in a high temperature oven (Figure 1b). When the thermal-induced damaged specimen cooled, the specimen was stored in vacuum packaging. The heating rate Rheat = 5 °C/min, exposure time Etime = 300 min, and maximum temperature Tmax = 25, 200, 300, 400, 500, 600, 800, and 1000 °C.

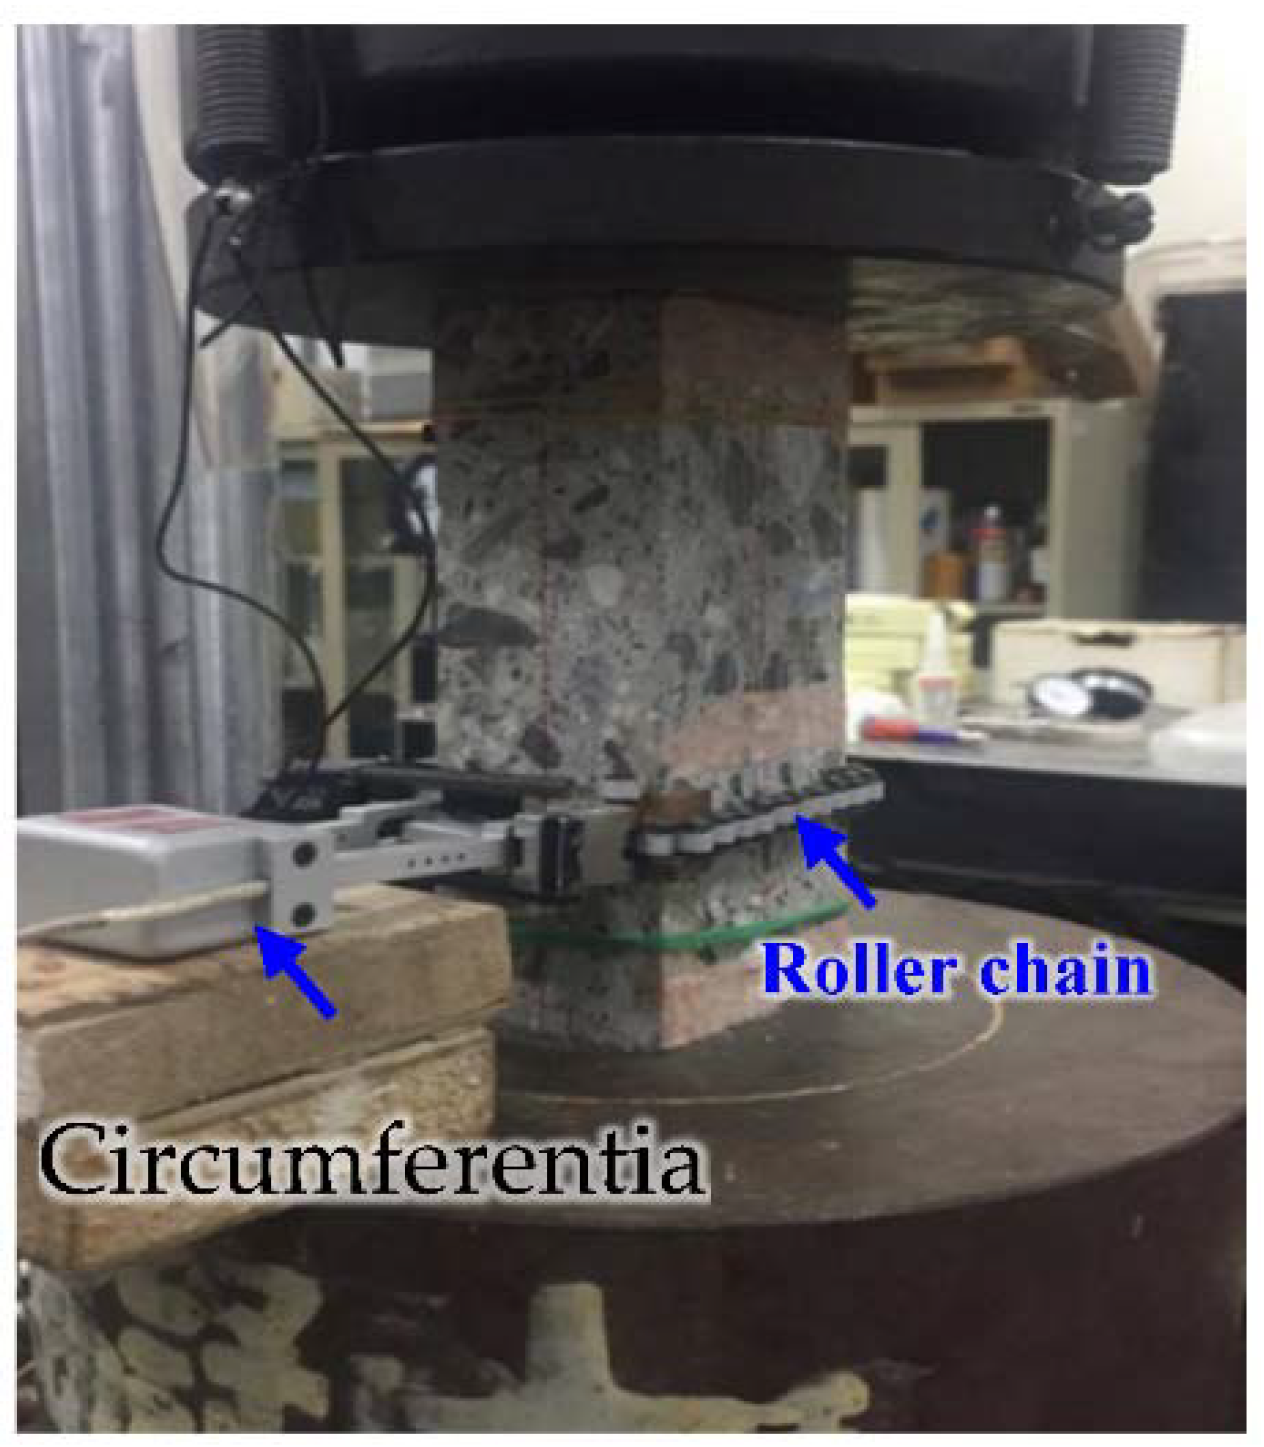
3.2. Stress-Induced Damage Test (Uniaxial Compressive Test)

Uniaxial compressive tests were conducted after thermal-induced damage treatment. The multifunction, precision, high-stiffness servo-controlled hydraulic test system MTS 810 with a 1MN output force capacity was adopted as the load system. A circumferential extensometer (model 632.92F-05C, MTS Corp., Eden Prairie, MN, USA) was installed through the roller chain (Figure 2) and used to obtain the entire load curve. Data recorded by the extensometer indicates changes in the circumference of the specimen during the test. The length increment was used as a feedback signal to automatically control the load output.

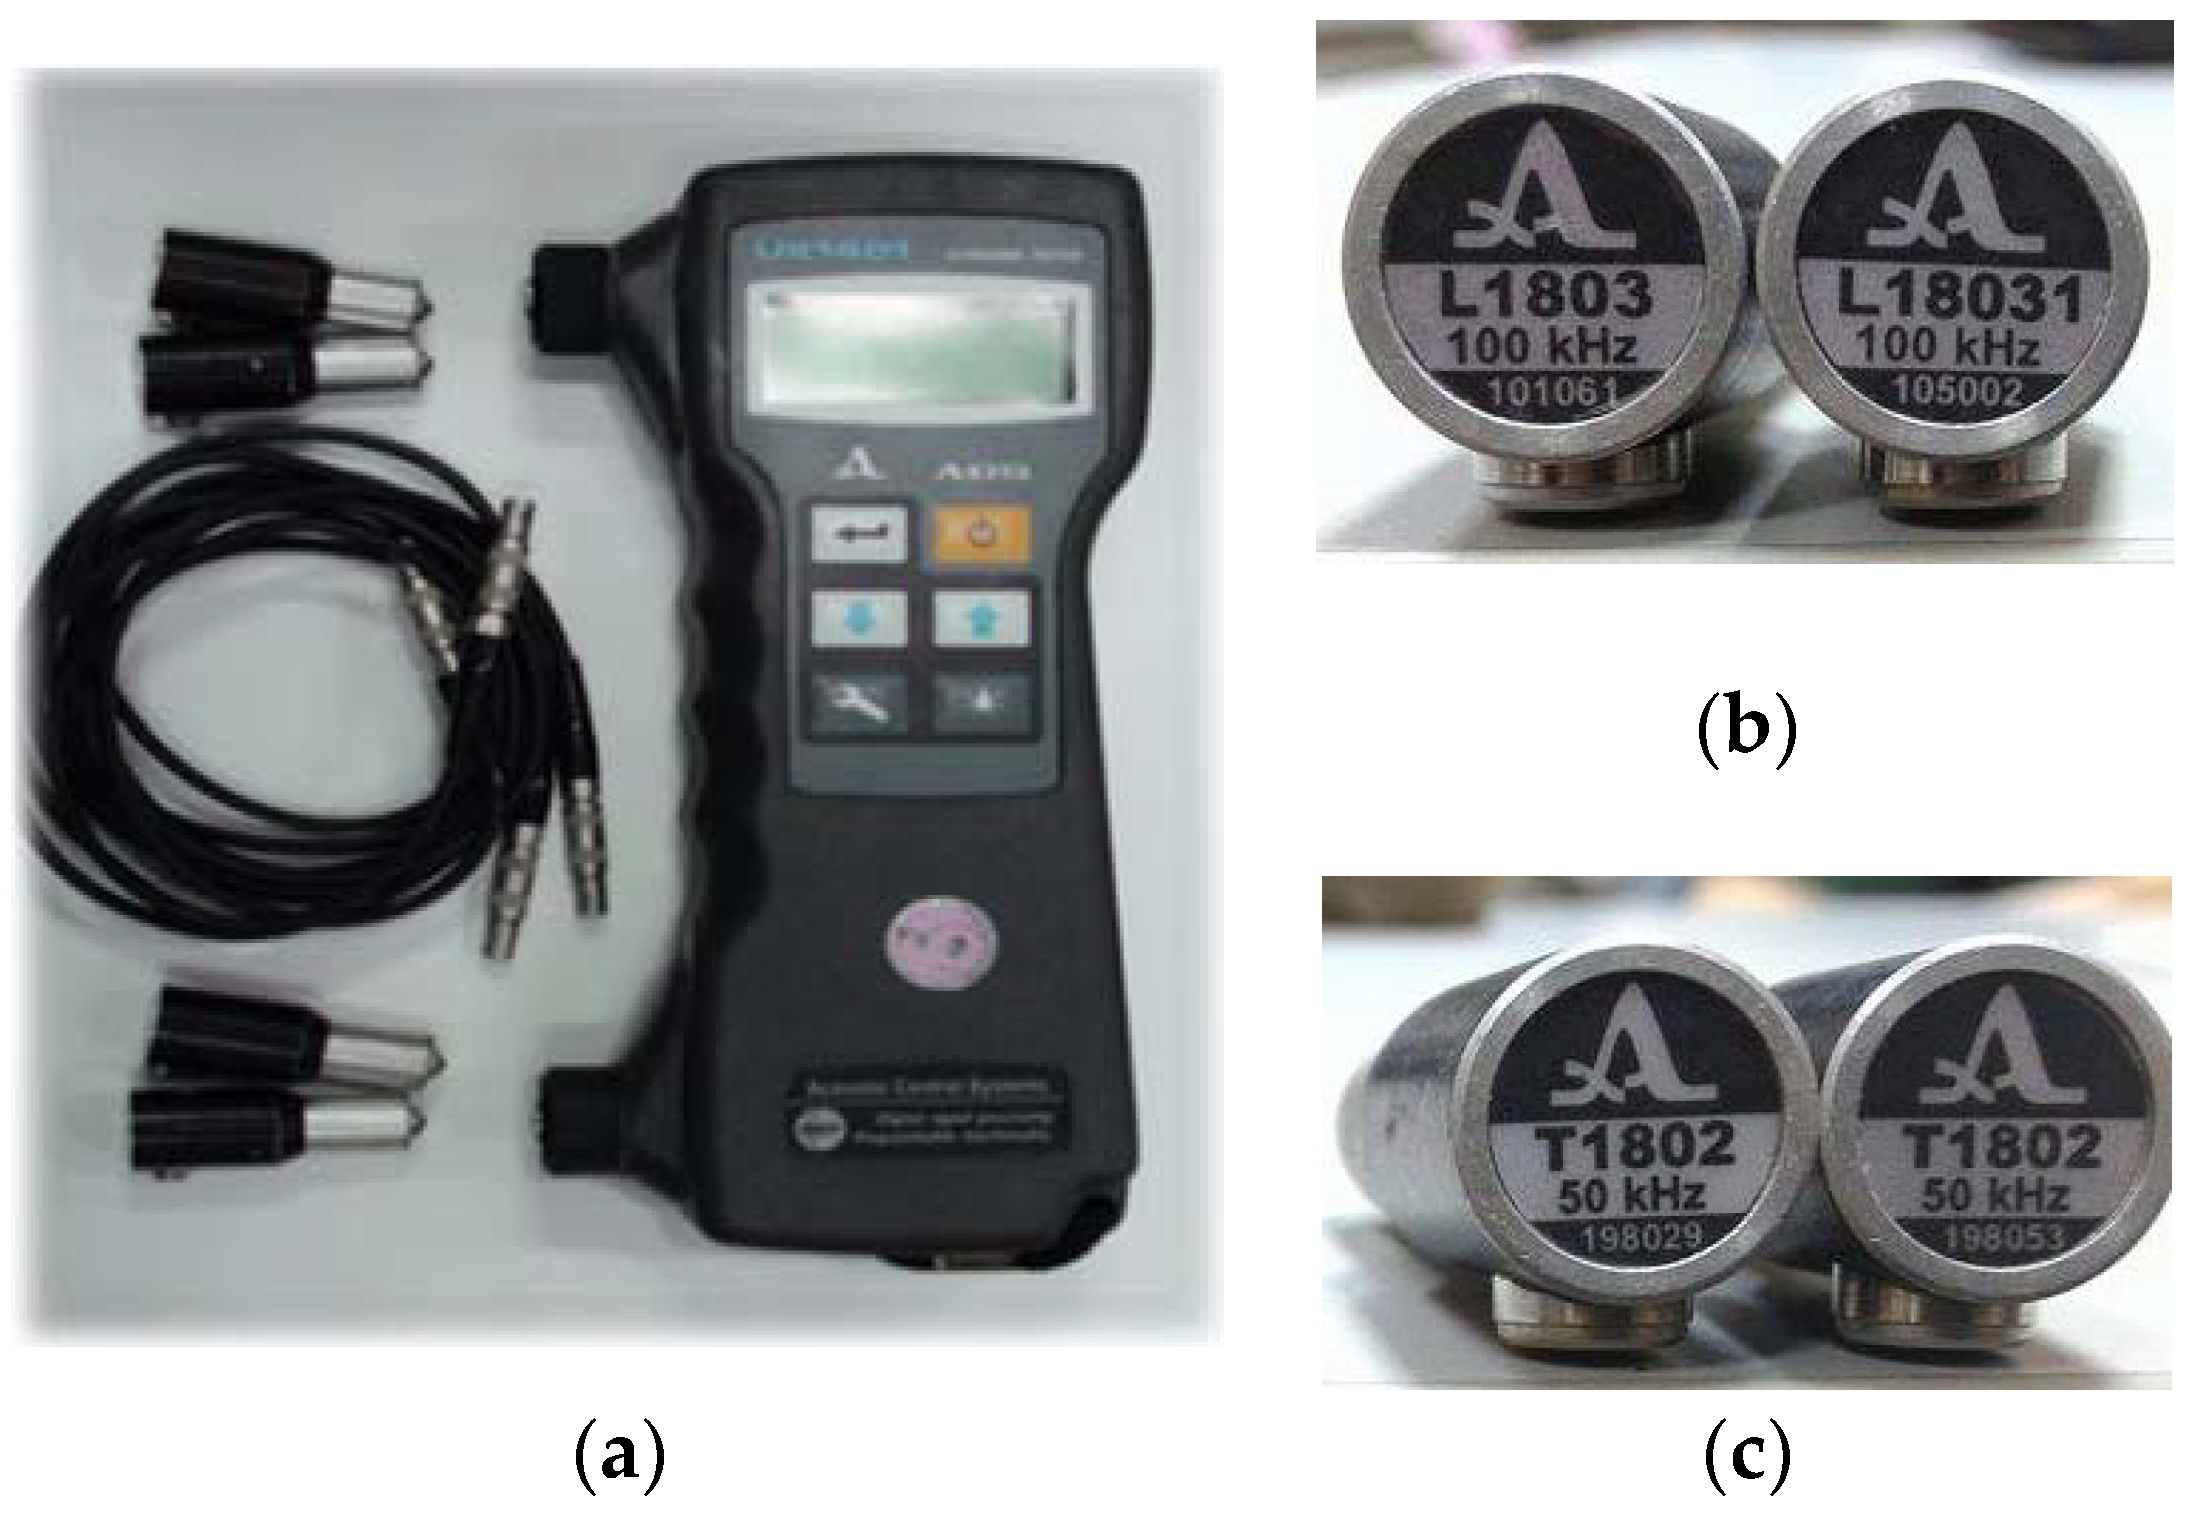
3.3. Ultrasonic Pulse Measurement

The ultrasonic pulse measurement principle is to generate a vibration source with a fixed frequency by driving the piezoelectric material within the ultrasonic transducer (Figure 3b,c). When the transmitting transducer makes contact with one side of the test specimen, the vibration source is transmitted within the specimen material as a stress wave and received by the receiving transducer on the other side of the specimen. If the detected distance is known, the wave velocity can be calculated.
The speed of wave propagation will be affected by the type of medium. It is prevalent that the fewer the voids and defects within the material, the higher the wave transmission speed [14,15,16]. It should be noted that the generated stress wave type can be a pressure wave (P wave) defined as the particles in the material vibrating along the wave propagation axis, or a shear wave (S wave) defined as wave vibration direction perpendicular to the wave propagation direction.
Ultrasonic pulse measurement was first used to detect defects in metal material in 1929. At present, it has been used widely in civil engineering to evaluate rock quality, species, strength, and properties including density, porosity, and elastic modulus [17,18,19]. This study is the first attempt at using ultrasonic pulse measurement to examine the thermal-induced damage level of concrete. Ultrasonic pulse measurement was practiced in this study using the UK-1401 dry point ultrasonic tester with P/S wave transmitted and received transducers from Acoustic Control Systems (ACS), as shown in Figure 3. The measured wave velocity and distance of UK-1401 ranged from 1000 to 9990 m/s and from 50 to 250mm, respectively.

4. Machine Learning

To find the correlation between the input and output variables in the thermal-induced damage experiment (Table 1), in this study, WEKA (Waikato Environment for Knowledge Analysis) developed at the University of Waikato, New Zealand, was used as the machine learning/data mining tool [20,21]. WEKA performs several standard machine learning tasks including data preprocessing, classification, clustering, regression, feature selection, and visualization. The correlation of variables in WEKA was chosen by finding a variable set that gives the maximum value in Equation (1). In Equation (1), c o r r e l is the function of correlation, Fi is the i-th input variable, T is the output variable, and Fj is the j-th input variable, respectively. In this study, the designed strength, rate of heating, maximum temperature, and exposure time were input variables; whereas the wave-velocity ratio, stiffness, strength, and toughness were output variables. Correlation is a measurement of the linear relationship between two variables. The target of Equation (1) is to find a set of variables that are correlated to the output as much as possible, but correlated to each other as less as possible. Such a set of variables is supposed to be more discriminative.
i c o r r e l ( F i ,     T ) i j , j i c o r r e l ( F i , F j ) ,

5. Results and Discussions

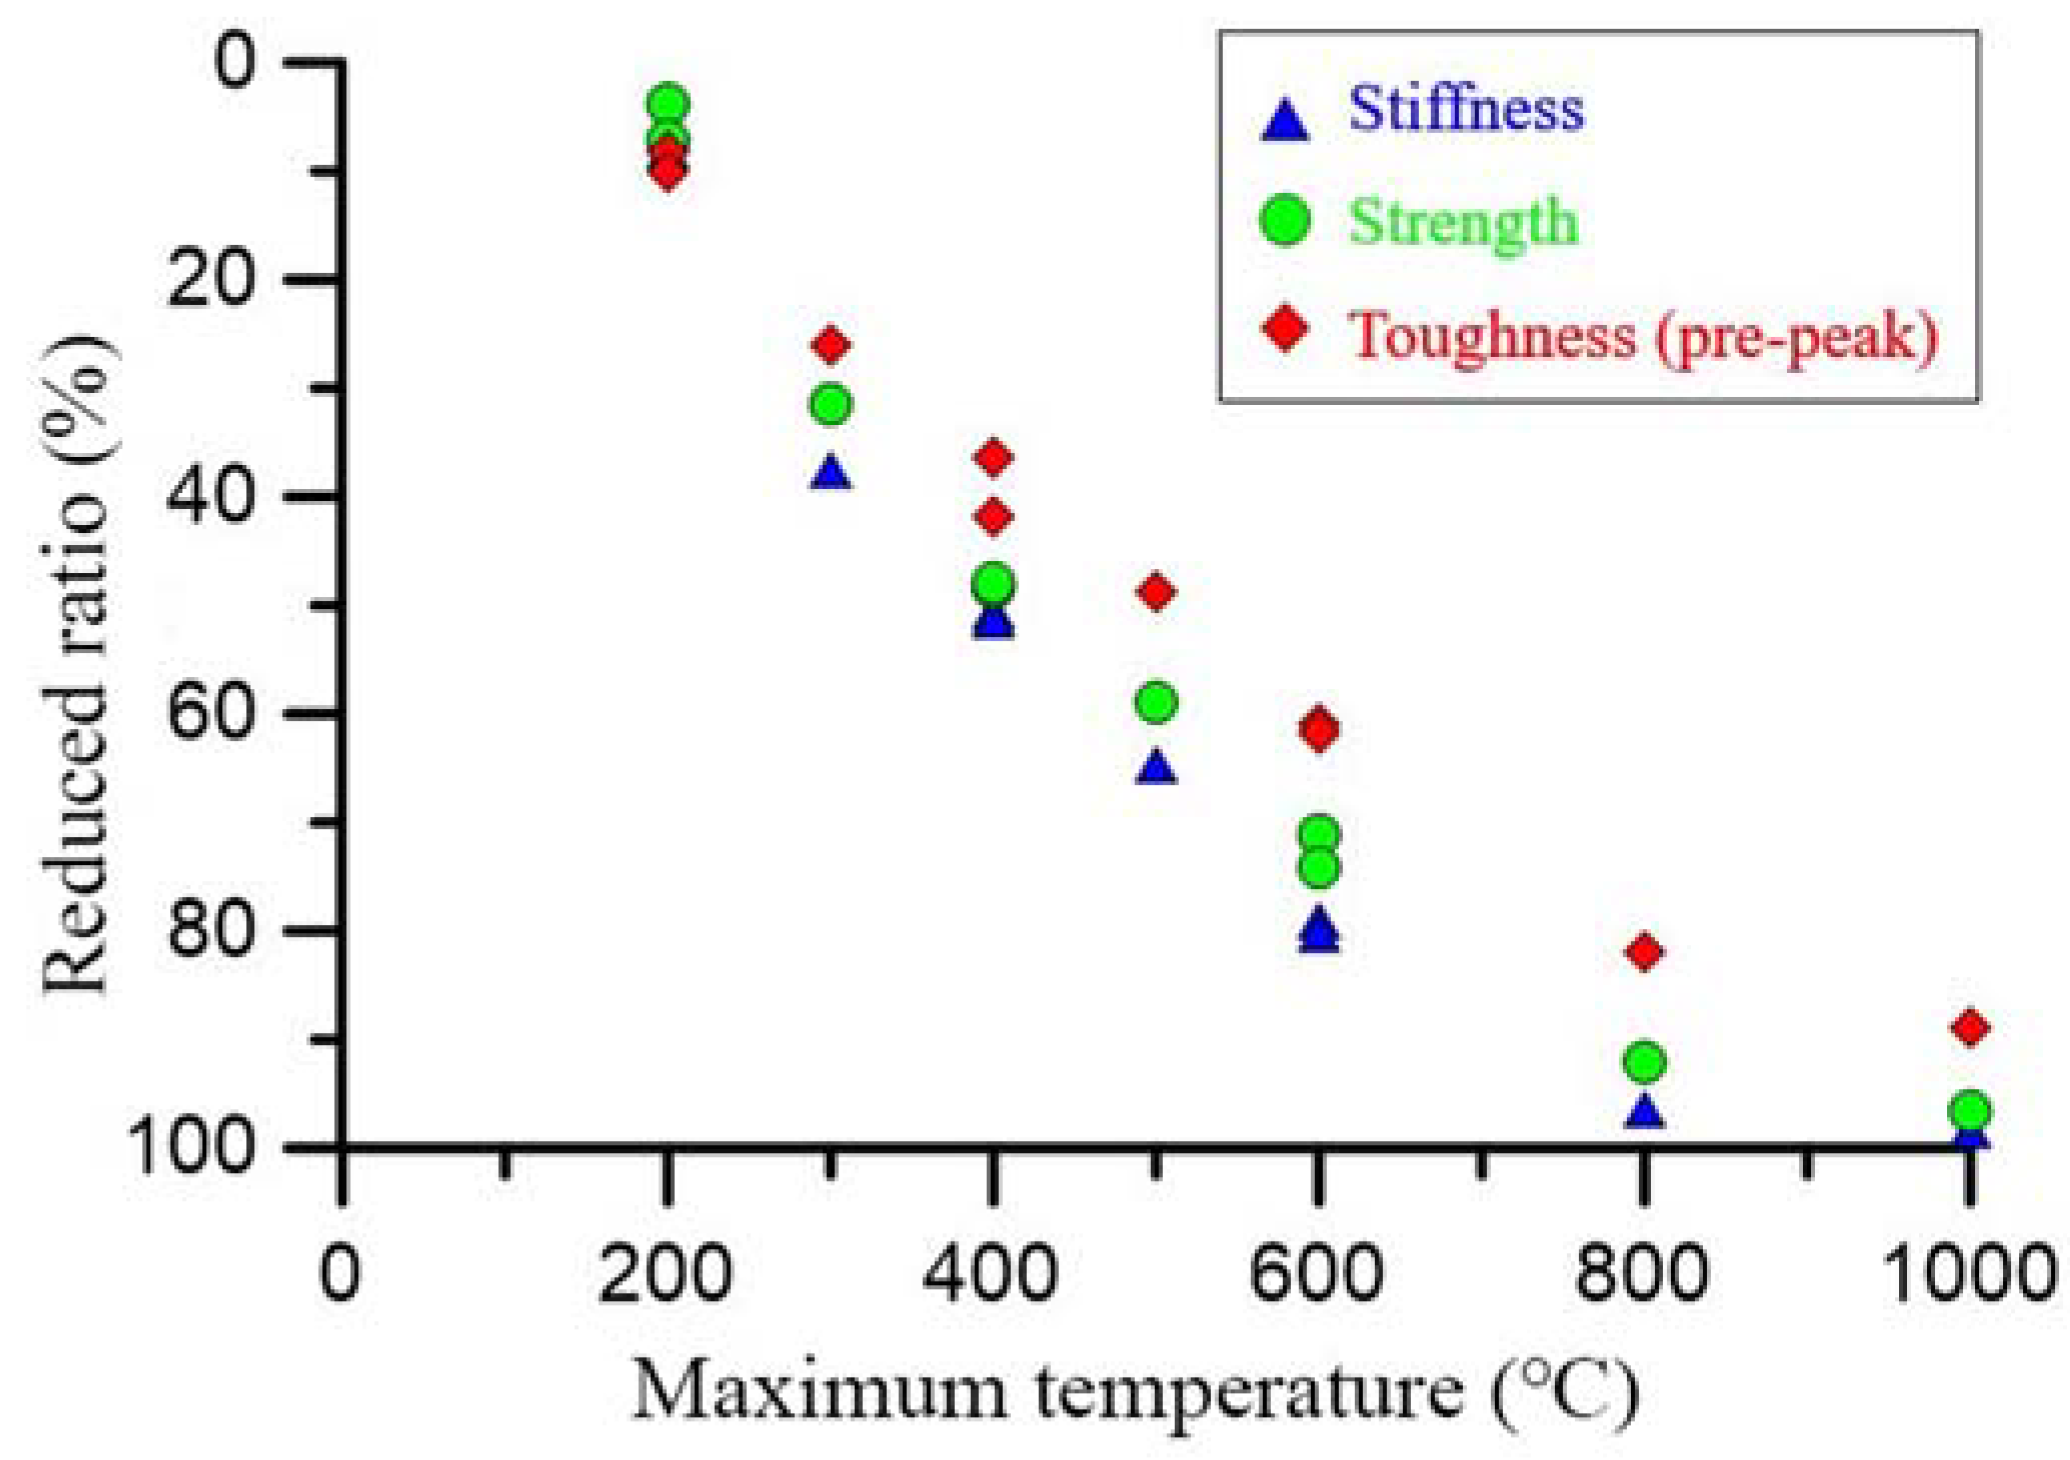
5.1. Experimental Results

The uniaxial compressive test was conducted on concrete after heat treatment. During the test, the circumference extensometer was used to stabilize the fracture propagation. The complete stress-strain curve can therefore be obtained. Some basic mechanical parameters such as stiffness, strength, and toughness can be defined, as shown in Figure 4. In Figure 4a, the peak point (P) value qu and the gradient at the half of qu (point E) were defined as the strength and the stiffness (elastic modulus), respectively. In addition, the area under the OP curve in Figure 4a can be calculated as the toughness at the pre-peak stage (Tpre), whereas the area under the OQ curve (Q is the point at half of qu after peak) in Figure 4b is the post-peak toughness (Tpost). The influence of heat temperature on stiffness, strength, and toughness and its relation with the ultrasonic wave is discussed as follows.

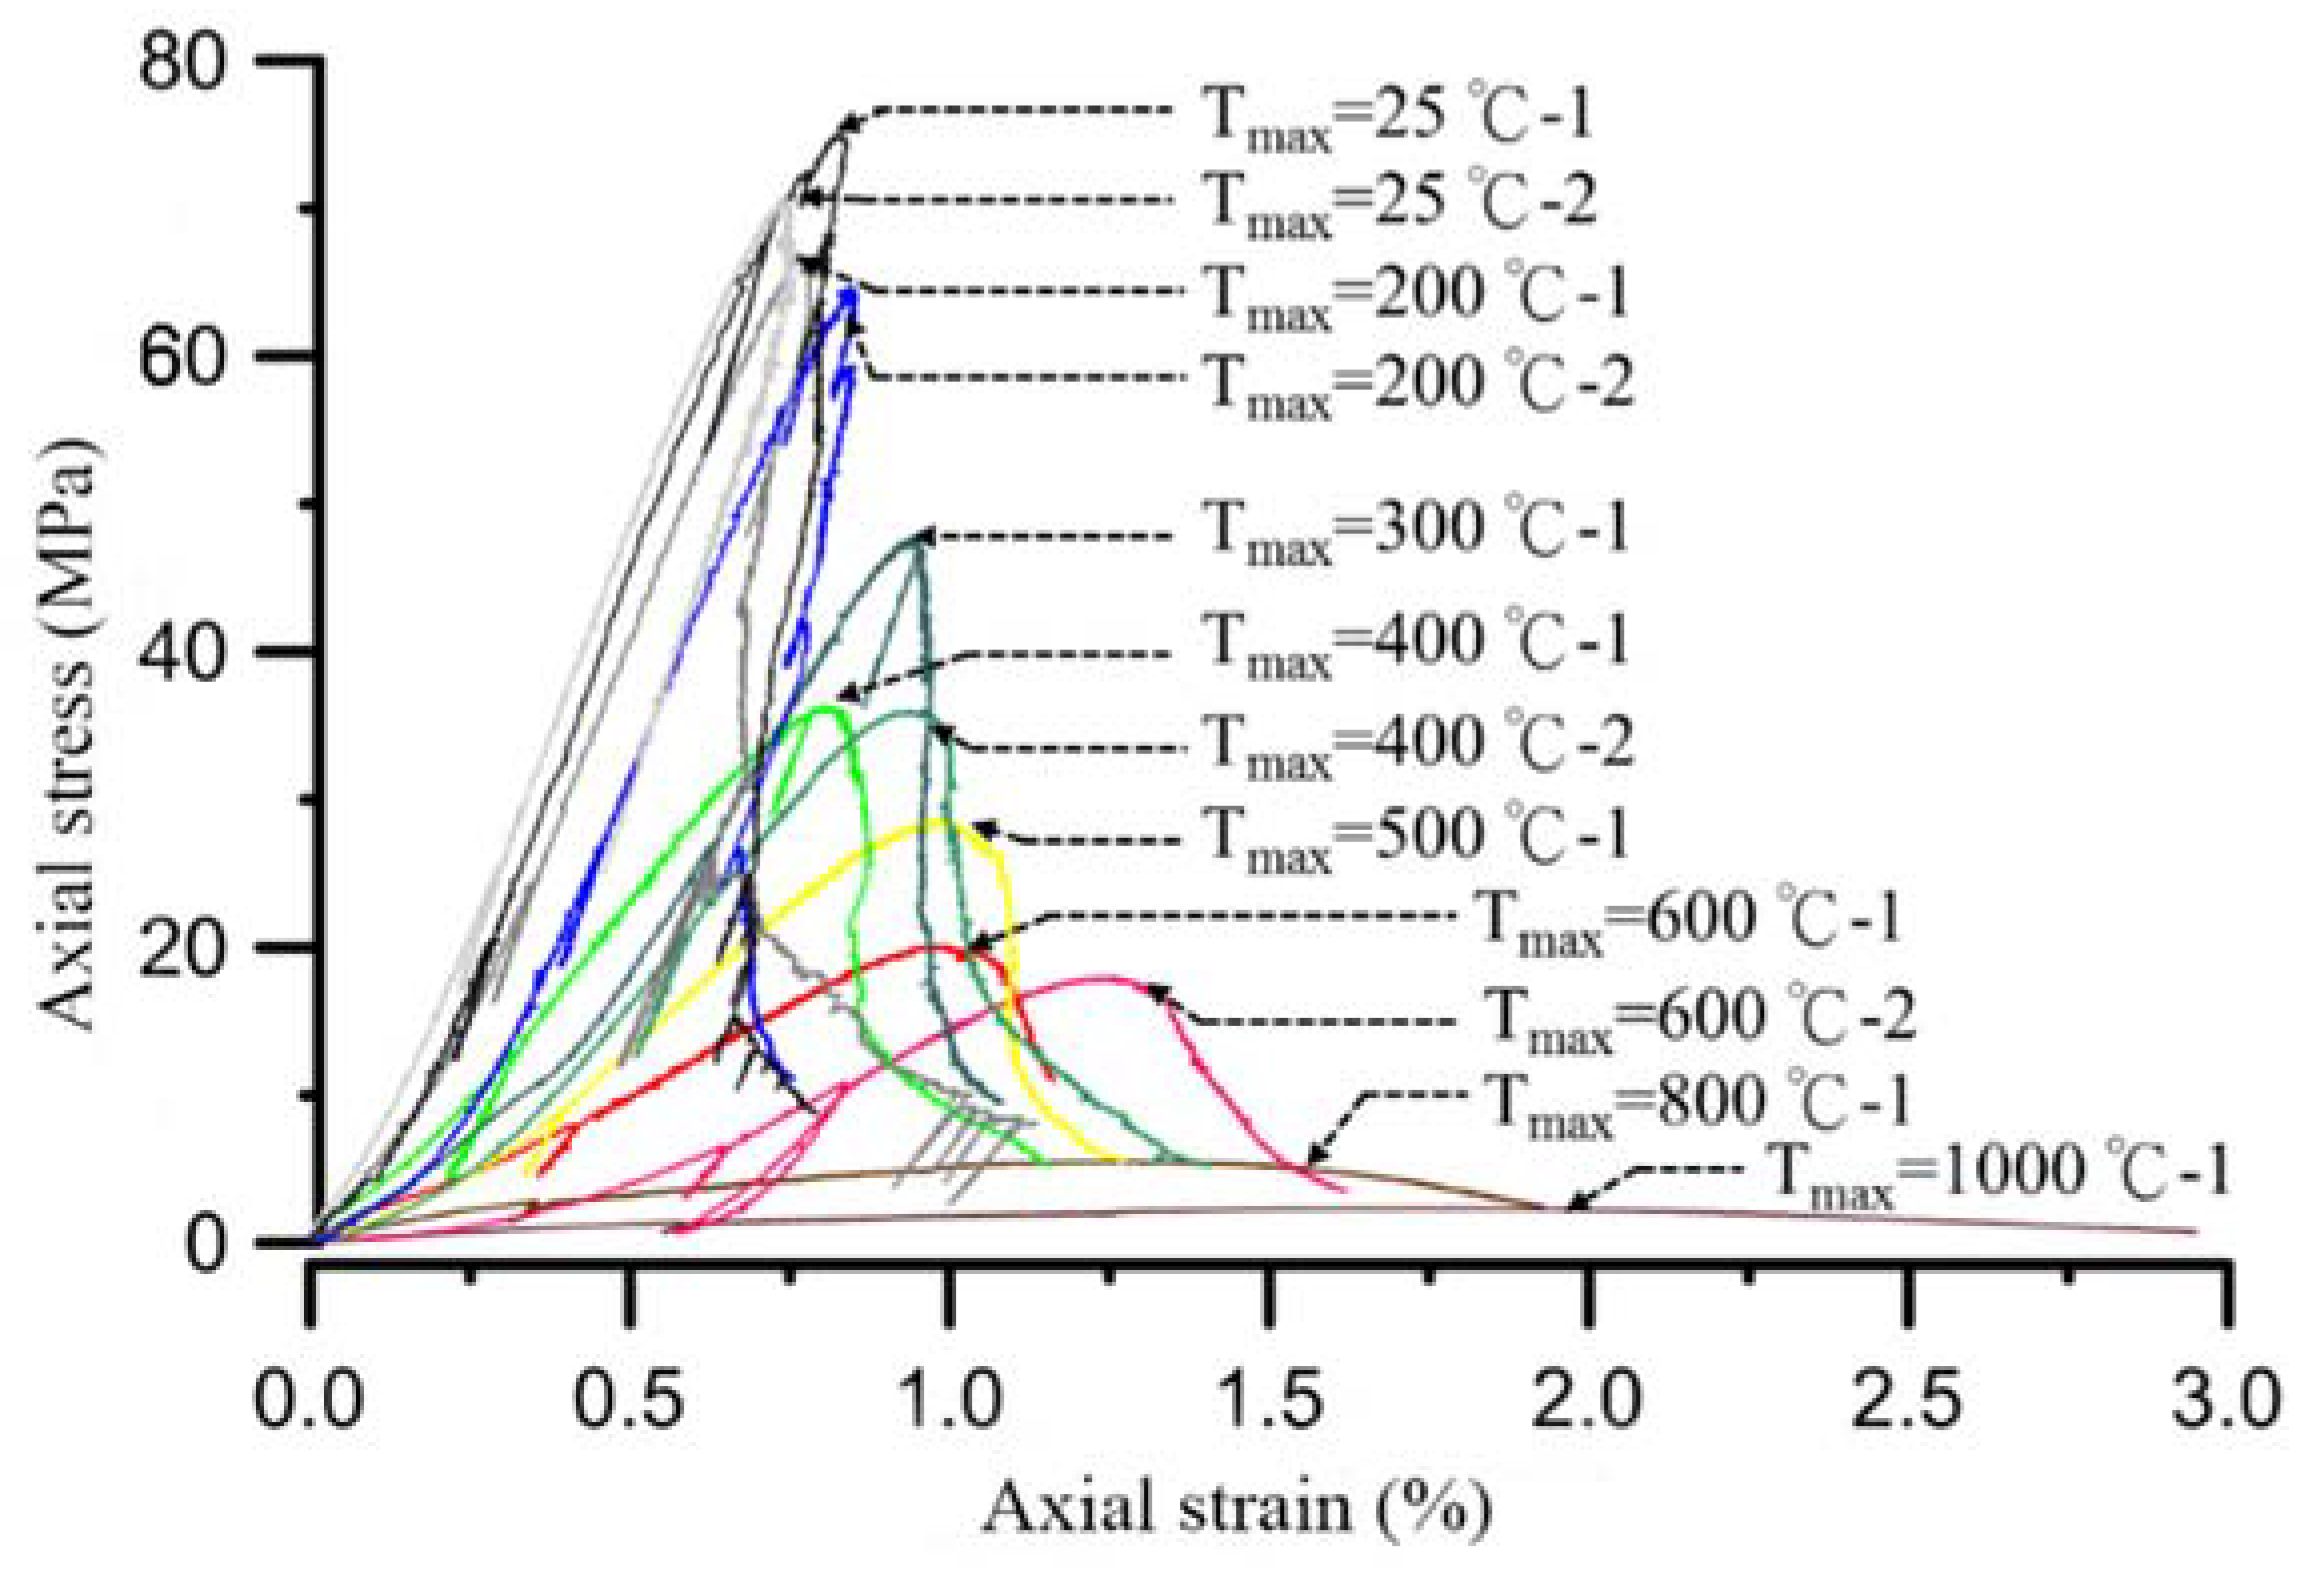
5.1.1. Relation of Loading Behavior and Heat Temperature

Figure 5 shows the complete loading curve with different maximum temperatures obtained in this study, including the pre- and post-peak loading processes. As expected, the stiffness, strength, and toughness decreased with an increase in maximum temperature. The reduced stiffness, strength, and pre-peak toughness ratios are shown in Figure 6. At Tmax = 200 °C, the stiffness, strength, and pre-peak toughness were not reduced significantly. However, when Tmax reached to 400 °C, the stiffness, strength, and pre-peak toughness were reduced significantly. The reduced stiffness, strength, and pre-peak toughness ratios are 51%, 48%, and 36%, respectively. At Tmax = 600 °C, the reduced stiffness, strength, and pre-peak toughness ratios reached 79%, 71%, and 61%, respectively. When Tmax = 800 °C, the material lost its strength.
As the heat temperature increases, cracks are formed at the particle and cementitious material interface and also the C-S-H (calcium-silicate-hydrate) colloid, provided that the cementitious material strength is initially decomposed at a 200 °C temperature. When the elevated temperature reaches 500 °C and 600 °C, calcium hydroxide (Ca(OH)2) and calcium carbonate (CaCO3) decomposition occurs [16]. This is why the stiffness and strength decrease as the heat temperature is increased. As the stiffness and strength decrease, the toughness with respect to the area under the stress-strain curve is also decreased, as shown in Figure 5.
For the post-peak behavior, two classified post-peak behavior fracture types for rock: snap through (Class I) and snap back (Class II), were defined using uniaxial compressive tests, as shown in Figure 7 (Wawersik 1968). In Class I (stable fracture type), the post-peak cumulative strain energy cannot sustain crack propagation. The specimen carrying capacity decreases with the increase in strain. In Class II (unstable fracture type), the post-peak strain or degree of specimen displacement decreases; however, the energy stored in the specimen can sustain crack propagation, even without external pressure. Figure 5 shows that concrete suffers from heat-driven damage, causing the post-peak stability from snap back (Class II) convert to snap through (Class I), and the transition temperature is between 200 to 400 °C. Therefore, the post-peak toughness increased at Tmax = 200−500 °C (Figure 8).

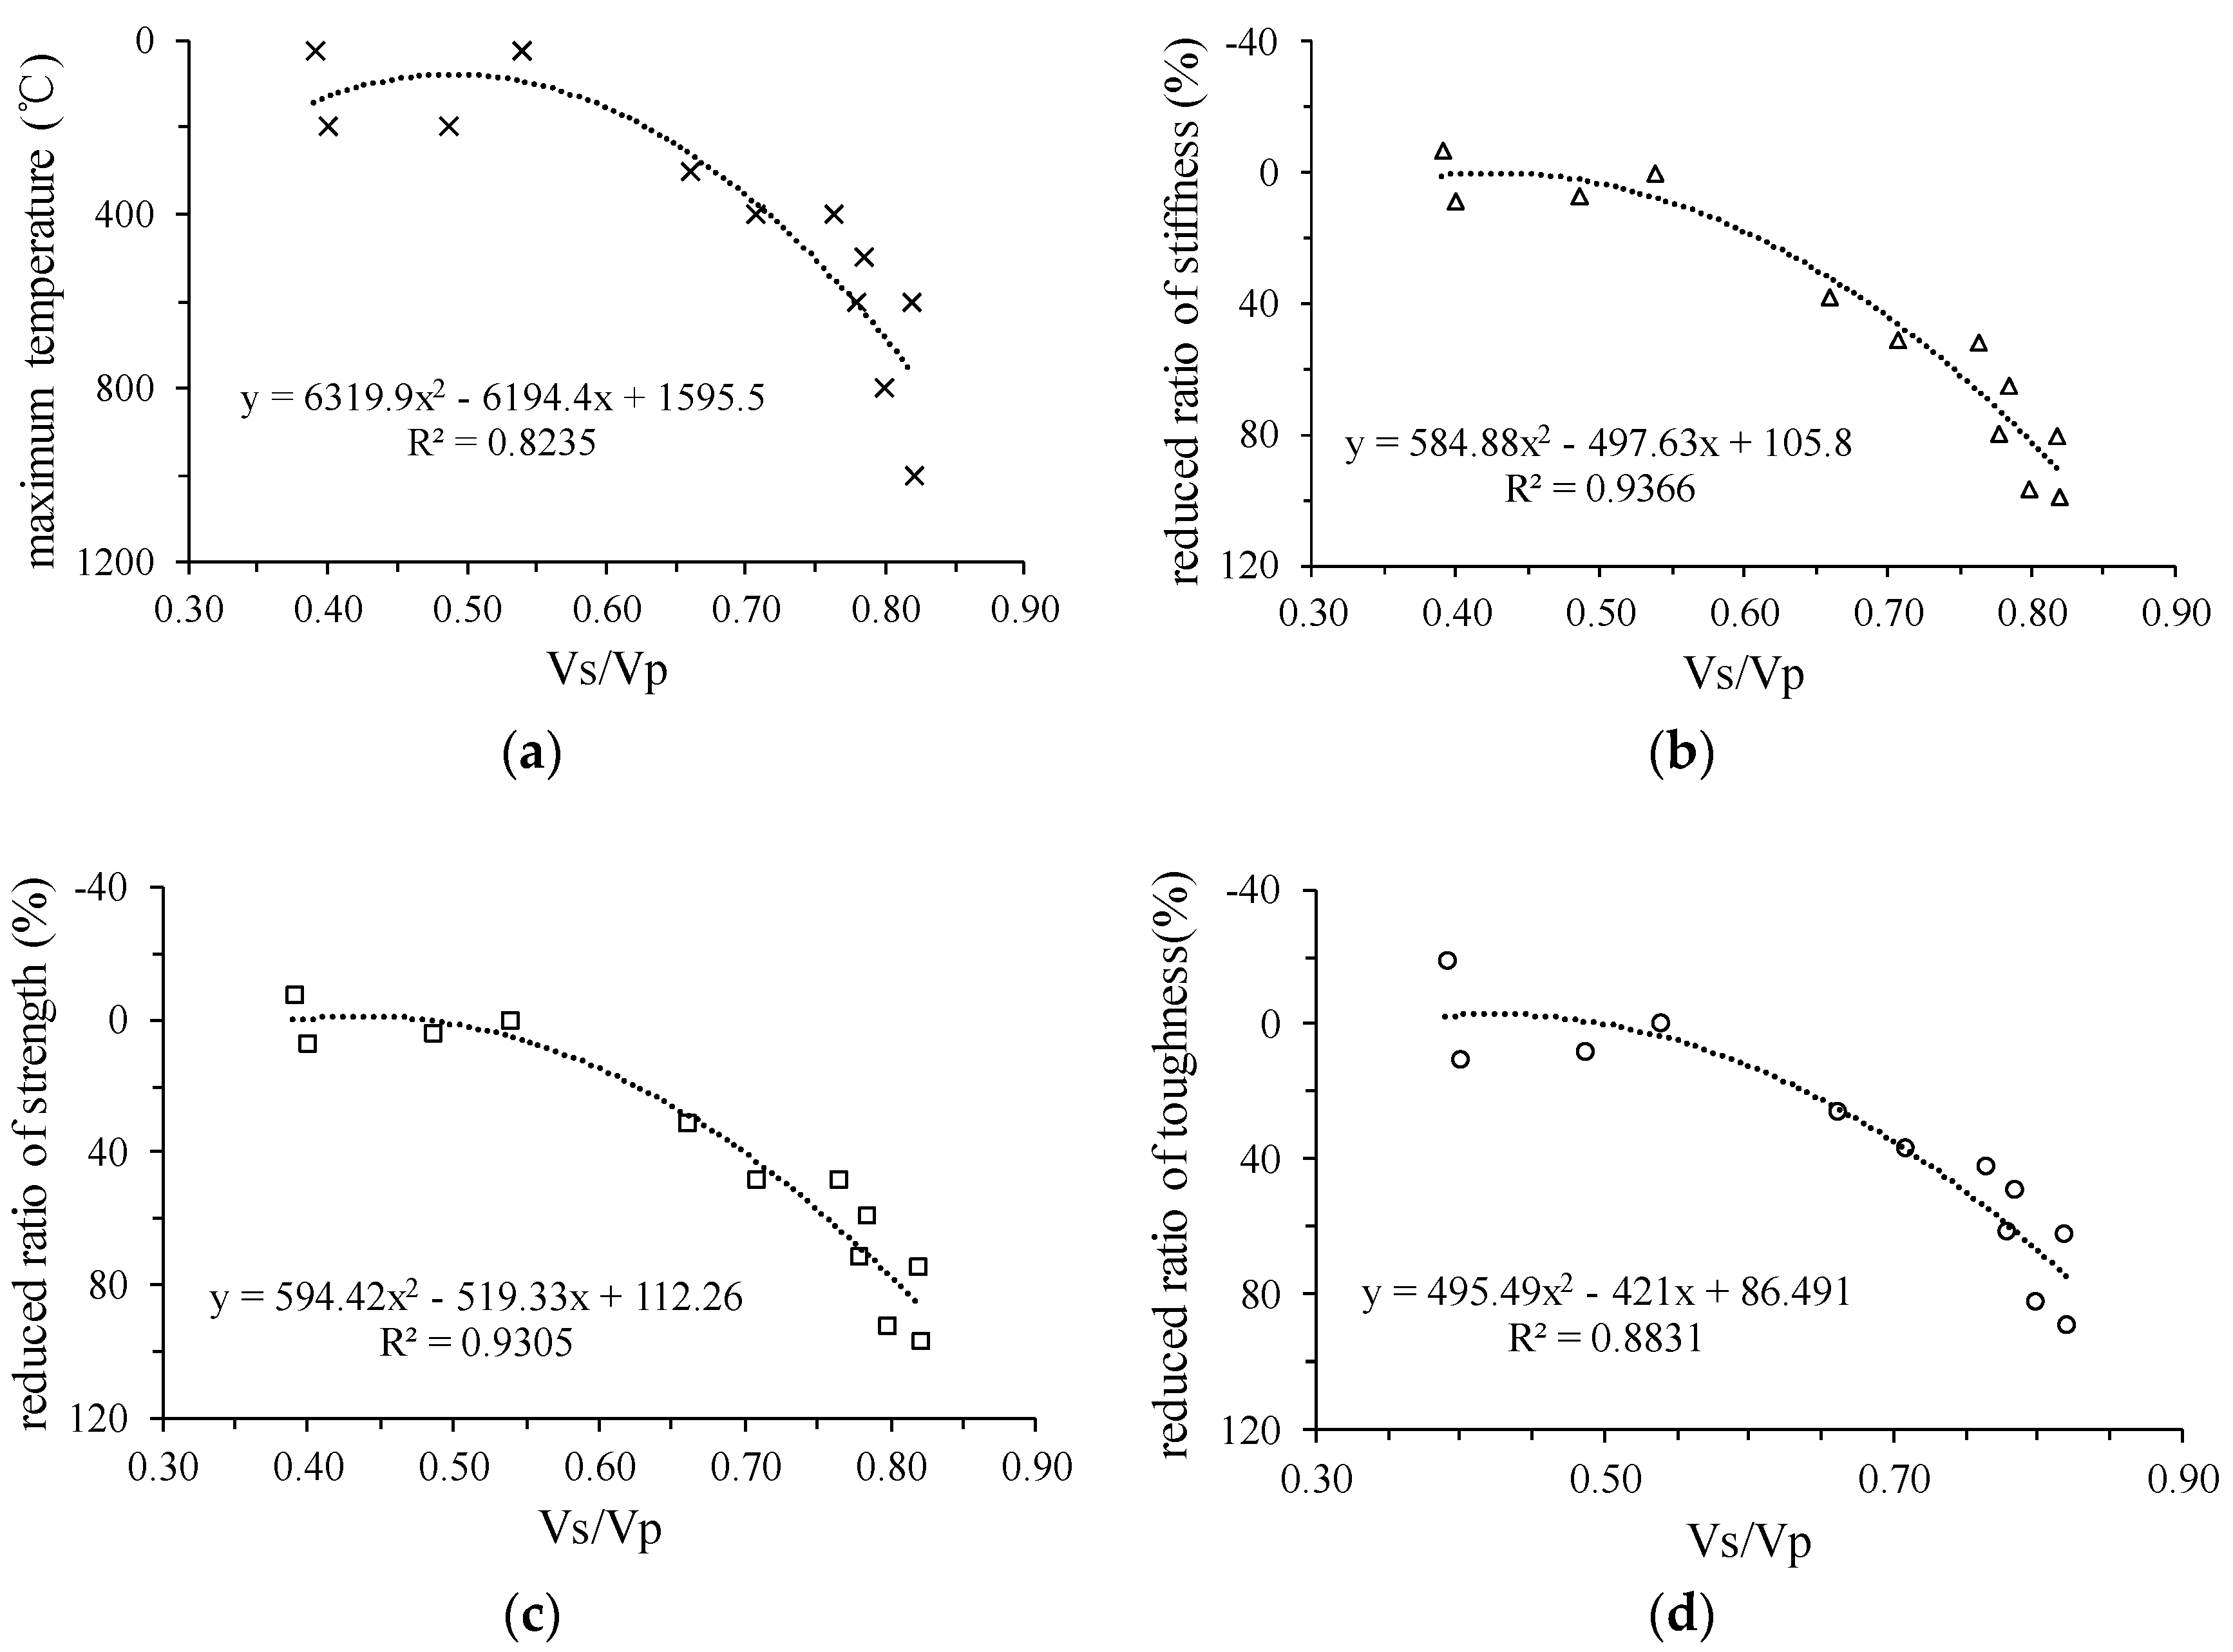
5.1.2. Damage Characteristics Examined Using the Wave Velocity Ratio

Naus [22] indicated that when concrete is subjected to heat damage, the Poisson’s ratio of concrete will decrease with an increase in maximum temperature. This is because the heat-damage resulting in concrete cracks increases to decrease the lateral deformation. According to the shear-pressure wave velocity ratio (Vs/Vp) relation to Poisson’s ratio, as shown in Equation (2) [15], Vs/Vp increases with a decreasing Poisson’s ratio. In other words, as the maximum temperature increases, the measured Vs/Vp of concrete should be increased. UP measurement was used in this study to measure the Vs and Vp of concrete after heat treatment. The normalized Vs/Vp was then calculated.
V s V p = ( 1 2 ν ) 2 ( 1 υ ) ,
where ν is the Poisson’s ratio.
Figure 9 shows the Vs/Vp relation to maximum temperature and reduced ratio of stiffness, strength, and toughness. As expected, as Vs/Vp increased with an increase in maximum temperature, as shown in Figure 9a, the Vs/Vp also increased with an increase in the reduced ratio of stiffness, strength, and toughness, as shown in Figure 9b−d. It is interesting to note that VS/VP has a high positive correlation with the maximum temperature and the reduced ratio of stiffness, strength, and toughness. The coefficient of determination (R2 value) between VS/VP and maximum temperature, reduced ratio of stiffness, strength, and toughness reached 0.82, 0.94, 0.93, and 0.88, respectively. This suggests that VS/VP could be applied to identify the degree of thermal-induced damage in concrete based on the experimental result in Figure 9.

5.2. Artificial Intelligence Analysis

Artificial Intelligence was used to identify the experimental findings. In machine learning processing, 21 experimental data records were used. Table 2 shows the correlation coefficient between the input and output variables. The correlation coefficient in Table 2 was used to examine the degree of correlation between input and output variables. An absolute value of the coefficient greater than or equal to 0.8 represents high correlation; whereas a value smaller than 0.8 but greater than or equal to 0.7 shows medium-high correlation. Therefore, the maximum temperature with high or medium-high correlation to Vs/Vp, stiffness, pre-peak toughness, and post-peak toughness was obtained.
An Artificial Neural Network (ANN) was built using WEKA. The inputs of the ANN include the aforementioned variables, and the output is the maximum temperature. For prediction, the mean absolute error is 99.2042, and the root-mean-square error is 130.3246. A high correlation coefficient of 0.8646 between the real maximum temperature and the one predicted by the ANN model is obtained. High correlation means high covariance between the two temperatures, and high covariance means that the model describes how the predicted maximum temperature varies or changes with the real maximum temperature well. Therefore, the maximum temperature can be predicted using the established ANN model. These results show that the fire-damage temperature could be simply detected by Vs/Vp. Note that the rate of heating is only related to the strength with a coefficient of 0.19. However, more data records are needed to confirm this finding. Table 3 shows the correlation coefficient between the output variables. The Vs/Vp has a high correlation with stiffness, strength, and pre-peak toughness, as shown in Table 3. These analysis results show a good agreement with those from the experiment.

6. Conclusions

This study was the first to apply ultrasonic pulse measurement to investigate the thermal-induced damage characteristics of concrete by conducting the uniaxial compressive test after concrete was subjected to heating under different thermal conditions (the rate of heating, maximum temperature, exposure time, as well as cooling condition). During the uniaxial compressive test process, a circumferential extensometer was used to prevent unstable crack growth. A complete stress-strain curve was then obtained. The experimental results show that the stiffness, strength, and pre-peak toughness decrease with an increase in maximum temperature, whereas the post-peak toughness increased with an increase in maximum temperature at a maximum temperature ranging from 200 to 500 °C. In addition, the wave velocity ratios in relation to the maximum temperature, stiffness, strength, and pre-peak toughness were obtained. The obtained experimental data was then analyzed using artificial intelligence.
The thermal conditions in the experiment were used as input variables. The experimental stiffness, strength, toughness, and wave velocity ratio results were used as output variables. The obtained correlation of the input and output variables using artificial intelligence showed that the wave velocity ratio has a high relation with the maximum temperature, stiffness, strength, and pre-peak toughness. These results indicate that the wave velocity ratio can be used to identify the thermal-induced damage characteristics. Ultrasonic pulse measurement coupled with the uniaxial compressive test can be employed to investigate the degree of damage with respect to the maximum temperature of concrete subject to heating.

Author Contributions

Conceptualization, L.-H.C. and Y.-C.C.; Methodology, L.-H.C.; Software, K.-W.H.; Visualization, W.-C.C. and H.-J.L.; Formal Analysis, W.-C.C., H.-J.L., and K.-W.H.; Validation, M.-Y.L. and T.-C.W.; Resources, C.-F.C.; Writing-Original Draft Preparation, W.-C.C.; Writing-Review & Editing, W.-C.C.; Supervision, L.-H.C.; Project Administration, H.-J.L.

Funding

This research was funded by Architecture and Building Research Institute, Ministry of the Interior, ROC (Taiwan) grant number 105301070000G0032.

Acknowledgments

This research is supported by the Architecture and Building Research Institute, Ministry of the Interior, ROC (Taiwan).

Conflicts of Interest

The authors declare no conflict of interest.

References

  1. Tovey, A.K. Assessment and repair of fire-damaged concrete structures-an update. Spec. Publ. 1986, 92, 47–62. [Google Scholar]
  2. Luo, B.-Y. Fire-Resistance Property of Reinforced Lightweight Aggregate Concrete Wall. Master’s Thesis, National Chung Hsing University, Taichung, Taiwan, 2008. [Google Scholar]
  3. Arioz, O. Effects of elevated temperatures on properties of concrete. Fire Saf. J. 2007, 42, 516–522. [Google Scholar] [CrossRef]
  4. Janotka, I.; Nürnbergerová, T. Effect of temperature on structural quality of the cement paste and high-strength concrete with silica fume. Nucl. Eng. Des. 2005, 235, 2019–2032. [Google Scholar] [CrossRef]
  5. Del Rio, L.; Jimenez, A.; Lopez, F.; Rosa, F.; Rufo, M.; Paniagua, J. Characterization and hardening of concrete with ultrasonic testing. Ultrasonics 2004, 42, 527–530. [Google Scholar] [CrossRef] [PubMed]
  6. Kheder, G. A Two stage procedure for assessment of in situ concrete strength using combined non-destructive testing. Mater. Struct. 1999, 32, 410–417. [Google Scholar] [CrossRef]
  7. Nash’t, I.H.; A’bour, S.H.; Sadoon, A.A. Finding an unified relationship between crushing strength of concrete and non-destructive tests. In Proceedings of the Middle East Nondestructive Testing Conference & Exhibition, Bahrain, Manama, 27–30 November 2005. [Google Scholar]
  8. Turgut, P. Research into the correlation between concrete strength and UPV values. NDT Net 2004, 12, 1–9. [Google Scholar]
  9. Trtnik, G.; Kavčič, F.; Turk, G. Prediction of concrete strength using ultrasonic pulse velocity and artificial neural networks. Ultrasonics 2009, 49, 53–60. [Google Scholar] [CrossRef] [PubMed] [Green Version]
  10. Hola, J.; Schabowicz, K. New technique of nondestructive assessment of concrete strength using artificial intelligence. NDT E Int. 2005, 38, 251–259. [Google Scholar] [CrossRef]
  11. Anderberg, Y.; Thelandersson, S. Stress and Deformation Characteristics of Concrete at High Temperatures; Lund University: Lund, Sweden, 1976. [Google Scholar]
  12. Kodur, V. Properties of concrete at elevated temperatures. ISRN Civ. Eng. 2014, 2014. [Google Scholar] [CrossRef]
  13. Mohamedbhai, G. Effect of exposure time and rates of heating and cooling on residual strength of heated concrete. Mag. Concr. Res. 1986, 38, 151–158. [Google Scholar] [CrossRef]
  14. ASTM. Standard Test Method for Pulse Velocity through Concrete; Annual Book of ASTM Standards; American Society for Testing and Materials: West Conshohocken, PA, USA, 1999. [Google Scholar]
  15. Malhotra, V.M.; Carino, N.J. Handbook on Nondestructive Testing of Concrete, 2nd ed.; CRC Press: Boca Raton, FL, USA, 2003. [Google Scholar]
  16. Nazarian, S.; Stokoe, K. Evaluation of Moduli and Thicknesses of Pavement Systems by Spectral-Analysis-of-Surface-Waves Method; Research Rep. 256-4; Center for Transportation Research, University of Texas: Austin, TX, USA, 1983; pp. 1–138. [Google Scholar]
  17. Chary, K.; Sarma, L.P.; Lakshmi, K.P.; Vijayakumar, N.A.; Lakshmi, V.N.; Rao, M. Evaluation of engineering properties of rock using ultrasonic pulse velocity and uniaxial compressive strength. In Proceedings of the National Seminar on Non-destructive Evaluation, Hyderabad, India, 7–9 December 2006. [Google Scholar]
  18. Soroush, H.; Qutob, H. Evaluation of rock properties using ultrasonic pulse technique and correlating static to dynamic elastic constants. In Proceedings of the 2nd South Asian Geoscience Conference and Exhibition, GEOIndia, New Delhi, India, 12–14 January 2011. [Google Scholar]
  19. Goodman, R.E. Introduction to Rock Mechanics; John Wiley & Sons: New York, NY, USA, 1989. [Google Scholar]
  20. Hall, M.; Frank, E.; Holmes, G.; Pfahringer, B.; Reutemann, P.; Witte, I.H. The WEKA data mining software: An update. ACM SIGKDD Explor. Newsl. 2009, 11, 10–18. [Google Scholar] [CrossRef]
  21. Witte, I.H.; Frank, E.; Hall, M.A. Data Mining: Practical Machine Learning Tools and Techniques, 3rd ed.; Morgan Kaufmann: Burlington, MA, USA, 2011. [Google Scholar]
  22. Naus, D.J. The Effect of Elevated Temperature on Concrete Materials and Structures—A Literature Review; Oak Ridge National Laboratory (ORNL): Oak Ridge, TN, USA, 2006.
Figure 1. Thermo-induced-damage concrete specimen preparation: (a) concrete specimen; (b) high temperature oven.
Applsci 08 01107 g001
Figure 2. Uniaxial Compressive test with a circumferential extensometer.
Applsci 08 01107 g002
Figure 3. Dry point ultrasonic tester: (a) device; (b) pressure wave transducer of 100 kHz; (c) shear wave transducer of 50 kHz.
Applsci 08 01107 g003
Figure 4. Complete stress-strain curve: (a) definition of stiffness (E), strength (qu), and pre-peak toughness (Tpre); (b) definition of post-peak toughness (Tpost).
Applsci 08 01107 g004
Figure 5. Completed uniaxial compressive curves for concrete subjected to various temperatures.
Applsci 08 01107 g005
Figure 6. Maximum temperature effect on stiffness, strength, and pre-peak toughness.
Applsci 08 01107 g006
Figure 7. Rock failure behavior classification in uniaxial compression adapted from Wawersik (1968).
Applsci 08 01107 g007
Figure 8. Maximum temperature effect on post-peak toughness.
Applsci 08 01107 g008
Figure 9. Correlation of wave velocity ratio (VS/VP) to reduced ratio of (a) maximum temperature; (b) stiffness; (c) strength; (d) and pre-peak toughness, respectively.
Applsci 08 01107 g009
Table 1. Experimental conditions and measurement.
MaterialConcretequ = 70 MPa (designed strength)
Thermal-Solid Damage Methodthermal-inducedheating rateRheat = 5 °C/min
maximum temperatureTmax = 25, 200, 300, 400, 500, 600, 800, 1000, 1200 °C
exposure timeEtime = 300 min
cooling methodMcool:cool down in furnace
stress-induceduniaxial compressive testobtaining the stiffness, strength, and toughness after thermal-induced damage
Measurementultrasonic pulse (UP)measure: VS, VP, VS/VP
Table 2. Correlation coefficient between input and output variables.
Input VariablesOutput Variables
Wave Velocity RatioStiffnessStrengthPre-Peak Toughness Post-Peak Toughness
designed strength−0.140.230.490.370.24
rate of heating--0.19--
maximum temperature0.78−0.87−0.65−0.7−0.73
exposure time0.17−0.42−0.41−0.4−0.22
Table 3. Correlation coefficient between output variables.
Output VariablesStiffnessStrengthPre-Peak ToughnessPost-Peak Toughness
wave velocity ratio−0.91−0.89−0.84−0.67
stiffness 0.990.940.8
strength 0.970.84
pre-peak toughness 0.9

