Article

Qualification of an Ultrasonic Instrument for Real-Time Monitoring of Size and Concentration of Nanoparticles during Liquid Phase Bottom-Up Synthesis

1
The Netherlands Organisation for Applied Scientific Research (TNO), Oude Waalsdorperweg 63, 2597 AK Den Haag, The Netherlands
2
The Netherlands Organisation for Applied Scientific Research (TNO), High Tech Campus 25, 5656 AE Eindhoven, The Netherlands
3
Delft University of Technology, Applied Physics, Lorentzweg 1, 2628 CJ Delft, The Netherlands
4
Hasselt University, Institute for Materials Research, Inorganic and Physical Chemistry, Agoralaan Building D, B-3590 Diepenbeek, Belgium
5
Zuyd University of Applied Sciences, Nieuw Eyckholt 300, Postbus 550, 6400 AN Heerlen, The Netherlands
6
Independent Software Developer, 70140 Montagney, France
7
Philips Innovation Labs, High Tech Campus 11, 5656 AE Eindhoven, The Netherlands
8
Department of Applied Physics, Eindhoven University of Technology, P. O. Box 513, 5600 MB Eindhoven, The Netherlands
*
Author to whom correspondence should be addressed.
Appl. Sci. 2018, 8(7), 1064; https://doi.org/10.3390/app8071064
Submission received: 4 June 2018 / Revised: 25 June 2018 / Accepted: 26 June 2018 / Published: 29 June 2018
(This article belongs to the Section Nanotechnology and Applied Nanosciences)

Abstract

:

Featured Application

The qualification of a unique ultrasonic instrument for real-time monitoring of the size and concentration of nanoparticles during bottom-up liquid phase synthesis is presented in this paper. The presented results of the ultrasonic instrument are verified with a dynamic light scattering device and a transmission electron microscope. Nanoparticles are increasingly used in numerous applications, such as in coatings, paints, cosmetics, etc. Both in the design and the production of nanoparticles there is a need for real-time measurements of their size and concentration. Ultrasound-based instruments are particularly suitable for measuring particle size and concentration, as they are non-destructive, fast, relatively cheap, and can measure in highly concentrated opaque dispersions. Also, the ultrasound sensors are robust enough to be placed inside a chemical reactor, allowing for real-time measurements of the particle size and concentration during synthesis.

Abstract

Both in design and production of nanoparticles and nanocomposites it is of vital importance to have information about their size and concentration. During the formation of nanoparticles, real-time monitoring of particle size and concentration during bottom-up synthesis in liquids allows for a detailed study of nucleation and growth. This provides valuable insights into the formation of nanoparticles that can be used for process optimization and scale up. In the production of nanoparticles, real-time monitoring enables intervention to minimize the number of off-spec batches. In this paper we will qualify an ultrasound nanoparticle sizer (UNPS) as a real-time monitor for the growth of nanoparticles (or sub-micro particles) in the 100 nm–1 µm range. Nanoparticles affect the speed and attenuation of ultrasonic waves in the dispersion. The size of the change depends, amongst other things, on the size and concentration of the nanoparticles. This dependency is used in the UNPS method. The qualification of the UNPS was undertaken in two successful experiments. The first experiment consisted of static measurements on commercially available silica particles, and the second experiment was real-time monitoring of the size and concentration during the growth of silica nanoparticles in Stöber synthesis in a water–alcohol mixture starting from the molecular precursor tetraethyl orthosilicate. The results of the UNPS were verified by measurements of a dynamic light scattering device and a transmission electron microscope.

1. Introduction

Nanoparticles are used in products for a wide variety of applications ranging from performance polymers to pharmaceuticals, food ingredients, cosmetics and coatings and paints [1,2,3,4,5,6]. Very often, tailored nanoparticles of a specific size, shape and architecture are produced in bottom-up liquid phase syntheses [7,8]. A detailed study of the nucleation and growth of such particles would provide valuable information on their mechanism of formation, and could furthermore be used for process optimization and scale up. For such a study, real-time measurements of particle size and concentration are required. Such real-time measurements, when coupled to industrial reactors, could also provide data that enable rational intervention in a production process, hence minimizing the number of off-spec batches and waste.
The methods used in this paper to measure dispersed nanoparticles are ultrasound spectroscopy, electron microscopy and dynamic light scattering. We will discuss each shortly.
An ultrasound method is particularly suitable for measuring the mean diameter and concentration of the nanoparticles [9,10], as it is non-destructive, fast and relatively cheap, and can measure in high concentrations and opaque dispersions. Also, the ultrasound sensors can be placed inside the reactor, allowing for real-time measurements of the actual dispersion instead of samples. Most ultrasound instruments reported to date lack the ability to measure the ultrasound waves with enough precision to attribute the changes in the ultrasound signal to particle growth at a nanometer scale [11,12]. However, the recently developed ultrasound nanoparticle sizer (UNPS) can measure the ultrasound signal with enough precision to relate this to particle growth. We will discuss the theory behind the UNPS in the next section.
A drawback of the ultrasound method is that it is critical to know the material properties of the solvent and the particles (the most important being the speed of sound, density, and viscosity of the solvent, and the speed of sound and density of the particles) in order to relate the ultrasound signal to the particles in the dispersion. Another drawback is that an ultrasound method can measure the mean particle diameter; however, under practical circumstances a (relative) particle size distribution cannot be measured.
Electron microscopy can be used to measure the average size of nanoparticles [13]. Moreover, it can measure the relative particle size distribution. However, samples are measured in dry form, and, therefore, the technique cannot be used as real-time analytics. Furthermore, the technique cannot measure particle concentration and is relatively expensive. Also the skill of the person operating the transmission electron microscope (TEM) is crucial.
Dynamic light scattering (DLS) methods [14,15] can measure the particle size and relative distribution of particles in solvents, and perform especially well on relatively low concentrations. However, measuring high concentrations (>5 w %) and opaque dispersions is still challenging since the method relies on single scattering events, meaning that each photon detected has been scattered only once in the sample. For this reason, dilution is typically necessary for highly scattering and concentrated samples [16]. Furthermore, DLS methods are not able to measure concentration. Recently, we have successfully developed a flow cell coupled DLS set-up that also allows monitoring of the growth of nanoparticles in real time [17]. In the developed DLS set-up, the sensors are not measuring directly in the reactor, but an analytical bypass loop is used for sampling purposes.
As is clear, the three methods discussed above all have pros and cons and, therefore, are often used in combination to complement each other.

Theory behind the Ultrasound Nanoparticle Sizer (UNPS) Method

Nanoparticles change the speed and attenuation of ultrasonic waves in a dispersion. The size of the change depends, amongst other factors, on the particle size and concentration of the nanoparticles [9,10]. This dependency is used in the UNPS measurement method [18]. Figure 1a shows the UNPS probe. The sensing part is located in the gap in the tip of this probe (see blue arrow). In Figure 1b this gap is filled with a dispersion. Figure 1b demonstrates the basics of the UNPS: the left transducer sends an ultrasonic wave through a glass wall, the dispersion, and another glass wall, to the right transducer that records the wave.
It is beneficial to also use the right transducer as a source and the left transducer as a receiver. This results in four signals that are recorded: two transmission signals through the dispersion and two pulse-echo signals that have only travelled in the glass. Volker et al. [19] demonstrate that these four signals make it possible to calculate the ultrasonic wave signal in the dispersion without any detailed knowledge of the wave behavior in the glass and transducers. The attenuation in the dispersion, α, as a function of frequency, f, is obtained from the amplitude of the wave signal. The phase of the wave signal is used to obtain the speed of sound in the dispersion, c. Besides the speed of sound and attenuation, we also measure the temperature in the dispersion.
Epstein et al. [9] and Allegra et al. [10] both give detailed, complex equations that relate the speed of sound and attenuation to the particle size and concentration. We use these equations in our inversion. However, instead of these detailed complex equations we will discuss the first order approximation of these equations for low particle concentrations (<10 w %), as they are a lot more insightful. The speed of sound is given by:
c ( f ) = c 0 + i ½   c 0   L r e ( f , d i )   x ( d i ) ,
where c0 is the frequency independent speed of sound of the solvent, Lre(f,di) is a frequency, f, and diameter, di, dependent scalar, and x(di) is the volume percentage of particles with a diameter that fits in the diameter bin i around d. The diameter bins work such that the sum Σi x(di) equals the total volume percentage of particles in the dispersion. Note that c0 describes the speed of sound in the absence of particles and that the second term on the right hand side adds a frequency and diameter dependent increment to the speed of sound. We will see later that this increment is a lot smaller than c0.
The attenuation is given by:
α ( f ) = β f 2 + i 2 π f c 0   ½   L i m ( f , d i )   x ( d i ) ,
where β is the attenuation coefficient of the acoustic waves in the solvent, and Lim(f, di) is a frequency and diameter dependent scalar. Note that the term βf2 describes the attenuation in the solvent in the absence of particles, and that the second term on the right hand side adds a frequency and diameter dependent increment to the attenuation.
Besides being dependent on frequency and diameter Lre and Lim depend on a few other parameters that depend on the material properties of the solvent and particles. For the silica water and Stöber dispersions in this paper Lre and Lim are mainly depending on the particle density, the speed of sound in the particles, the solvent density, the speed of sound in the solvent and the viscosity of the solvent. The parameters mentioned are all dependent on temperature. Therefore, before the measurements begin Lre and Lim are calculated for a wide temperature range.
In the inversion we estimate x(di), c0, and β by minimizing the difference between the measured speed of sound and attenuation and their estimates based on x(di), c0, and β. Note that by estimating c0 and β, we have incorporated the changes in the speed of sound and attenuation of the solvent during the reaction. A change in temperature is incorporated by selecting a different set of Lre and Lim. However, changes in the material properties of the solvent caused by something other than temperature, e.g., one of the substances in the solvent is reacting, are not taken into account in Lre and Lim. Although we estimate the volume concentration of the particles per diameter bin, we deliberately do not output a particle size distribution. This is done because the accuracy and frequency bandwidth of the measured speed of sound and attenuation is more than enough to determine the mean diameter, but not enough to also estimate an accurate width of the particle size distribution.
The blue circles in Figure 2 show the measured speed of sound and attenuation values for silica particles dispersed in water with a mean diameter around 474 nm and a mass concentration of 5 w %. The blue circles in Figure 3 also show the measured speed and attenuation, but now for silica particles in water with a mean diameter around 794 nm and a mass concentration of 5 w %. Note that the speed of sound and attenuation values in the two figures are frequency dependent, and that they are different in the two figures. E.g., the apex of the speed of sound (i.e., the frequency where the highest speed of sound is measured) is at a different frequency in the two figures. This clearly indicates that the speed of sound as function of frequency is depending on the mean diameter of the particles. Also note that the changes are subtle, for a 5 w % concentration the measured difference in Figure 2 between the highest and the lowest speed of sound values is only 0.7 m/s on a total speed of sound velocity of 1502 m/s. The inversion algorithm has simulated these changes in speed and attenuation (red line in Figure 2) by estimating the mean particle size and concentration of the particles that caused them.
By using the left and right transducers in Figure 1b both as sources and receivers [18], the UNPS can derive the speed of sound and attenuation with great accuracy, allowing it to relate the subtle changes in the speed of sound and attenuation to particle growth. In this paper we investigate whether this would qualify the UNPS as a real-time monitoring instrument for particle growth.
The qualification of the UNPS has three requirements:
  • The UNPS should be able to accurately measure particle diameter.
  • The UNPS should be able to accurately measure particle concentration.
  • The UNPS should be fast enough to follow the reaction.
The qualifications ‘accurately’ and ‘fast enough’ are related to our ability to monitor the particle growth in the liquid phase bottom-up synthesis. An ‘accurately measured diameter’ and an ‘accurately measured concentration’ have values that are close enough to the true diameter for our purposes. Also, the variations in measuring the same sample multiple times should not vary too much to ensure that we see a smooth growth during monitoring. One measurement per minute is ‘fast enough’ to monitor the reaction. It gives us confidence that we can follow the growth, and are able to make a good decision when to act at the right moment.
We test the three requirements with two experiments. Firstly, we perform static measurements on commercially available silica particles to check the accuracy of the UNPS. The particle size measurements are verified with TEM measurements. We consider the TEM and UNPS measurements accurate if they are within a three standard deviations range of each other. Also the variations in measuring the same sample multiple times should not vary too much to ensure that we see a smooth growth during monitoring. The particle density measurements are verified with a drying measurement. We consider the UNPS measurements as accurate if they are within a three standard deviations range of their expected value based on the drying measurement. In the second experiment, we test if the UNPS can monitor the growth of silica particles during a Stöber reaction in real-time. We will compare the results of the real-time monitoring experiment with DLS and TEM results of the same typical experiment. As the circumstances between the UNPS measurement and the TEM-DLS measurement are not the same, we only compare the growth behavior, and not the exact measured particle sizes.

2. Materials and Methods

As said above, we report on two different experiments:
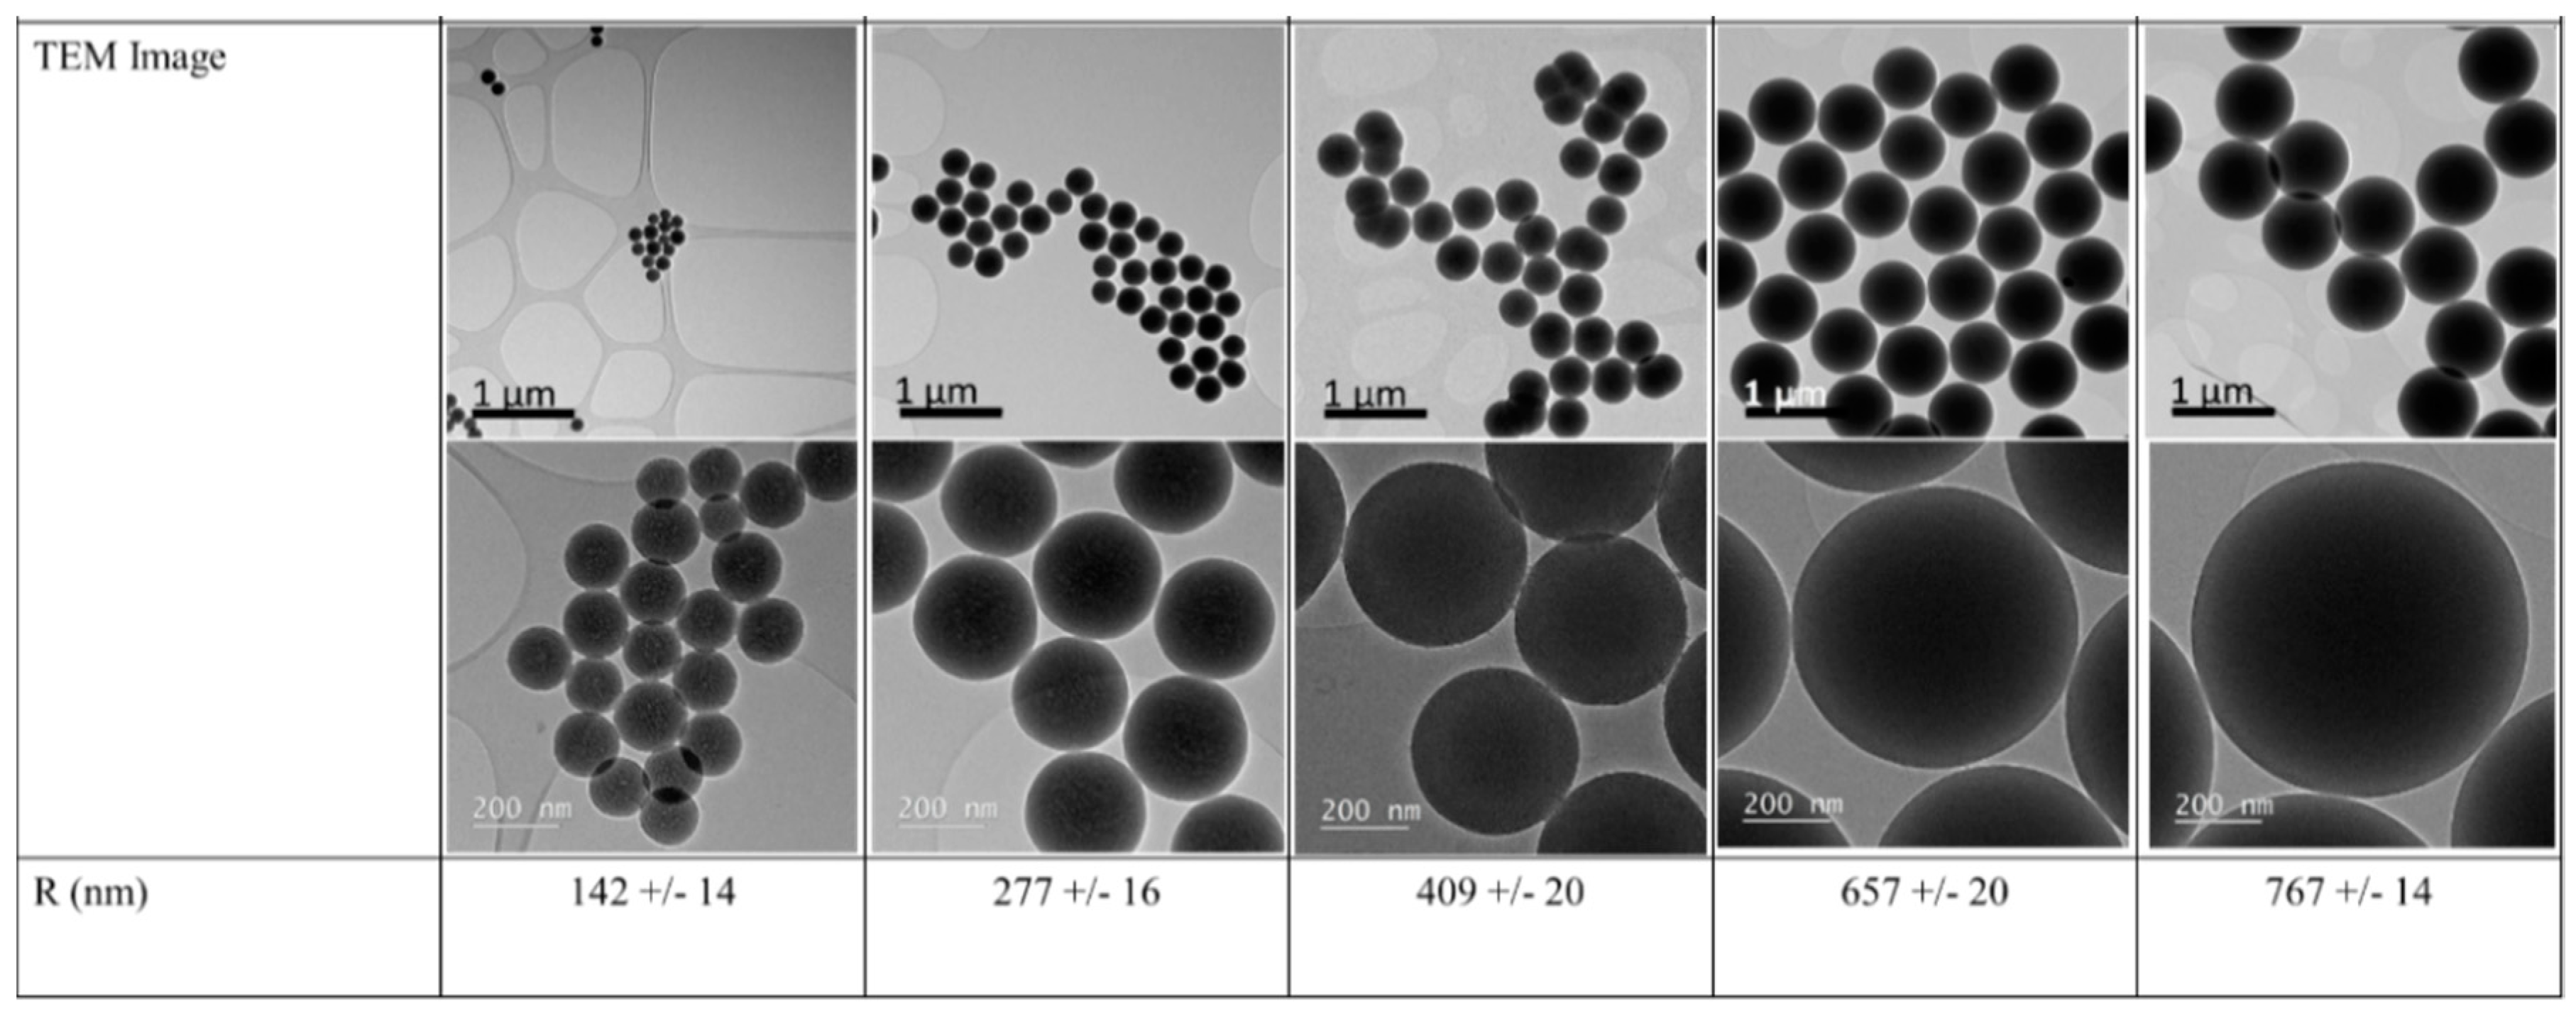
  • The static measurements. These are measurements on samples of commercially obtained silica particles. The particle diameters are measured with the UNPS, and TEM. The particle concentration is measured by the UNPS and by measuring their mass after drying.
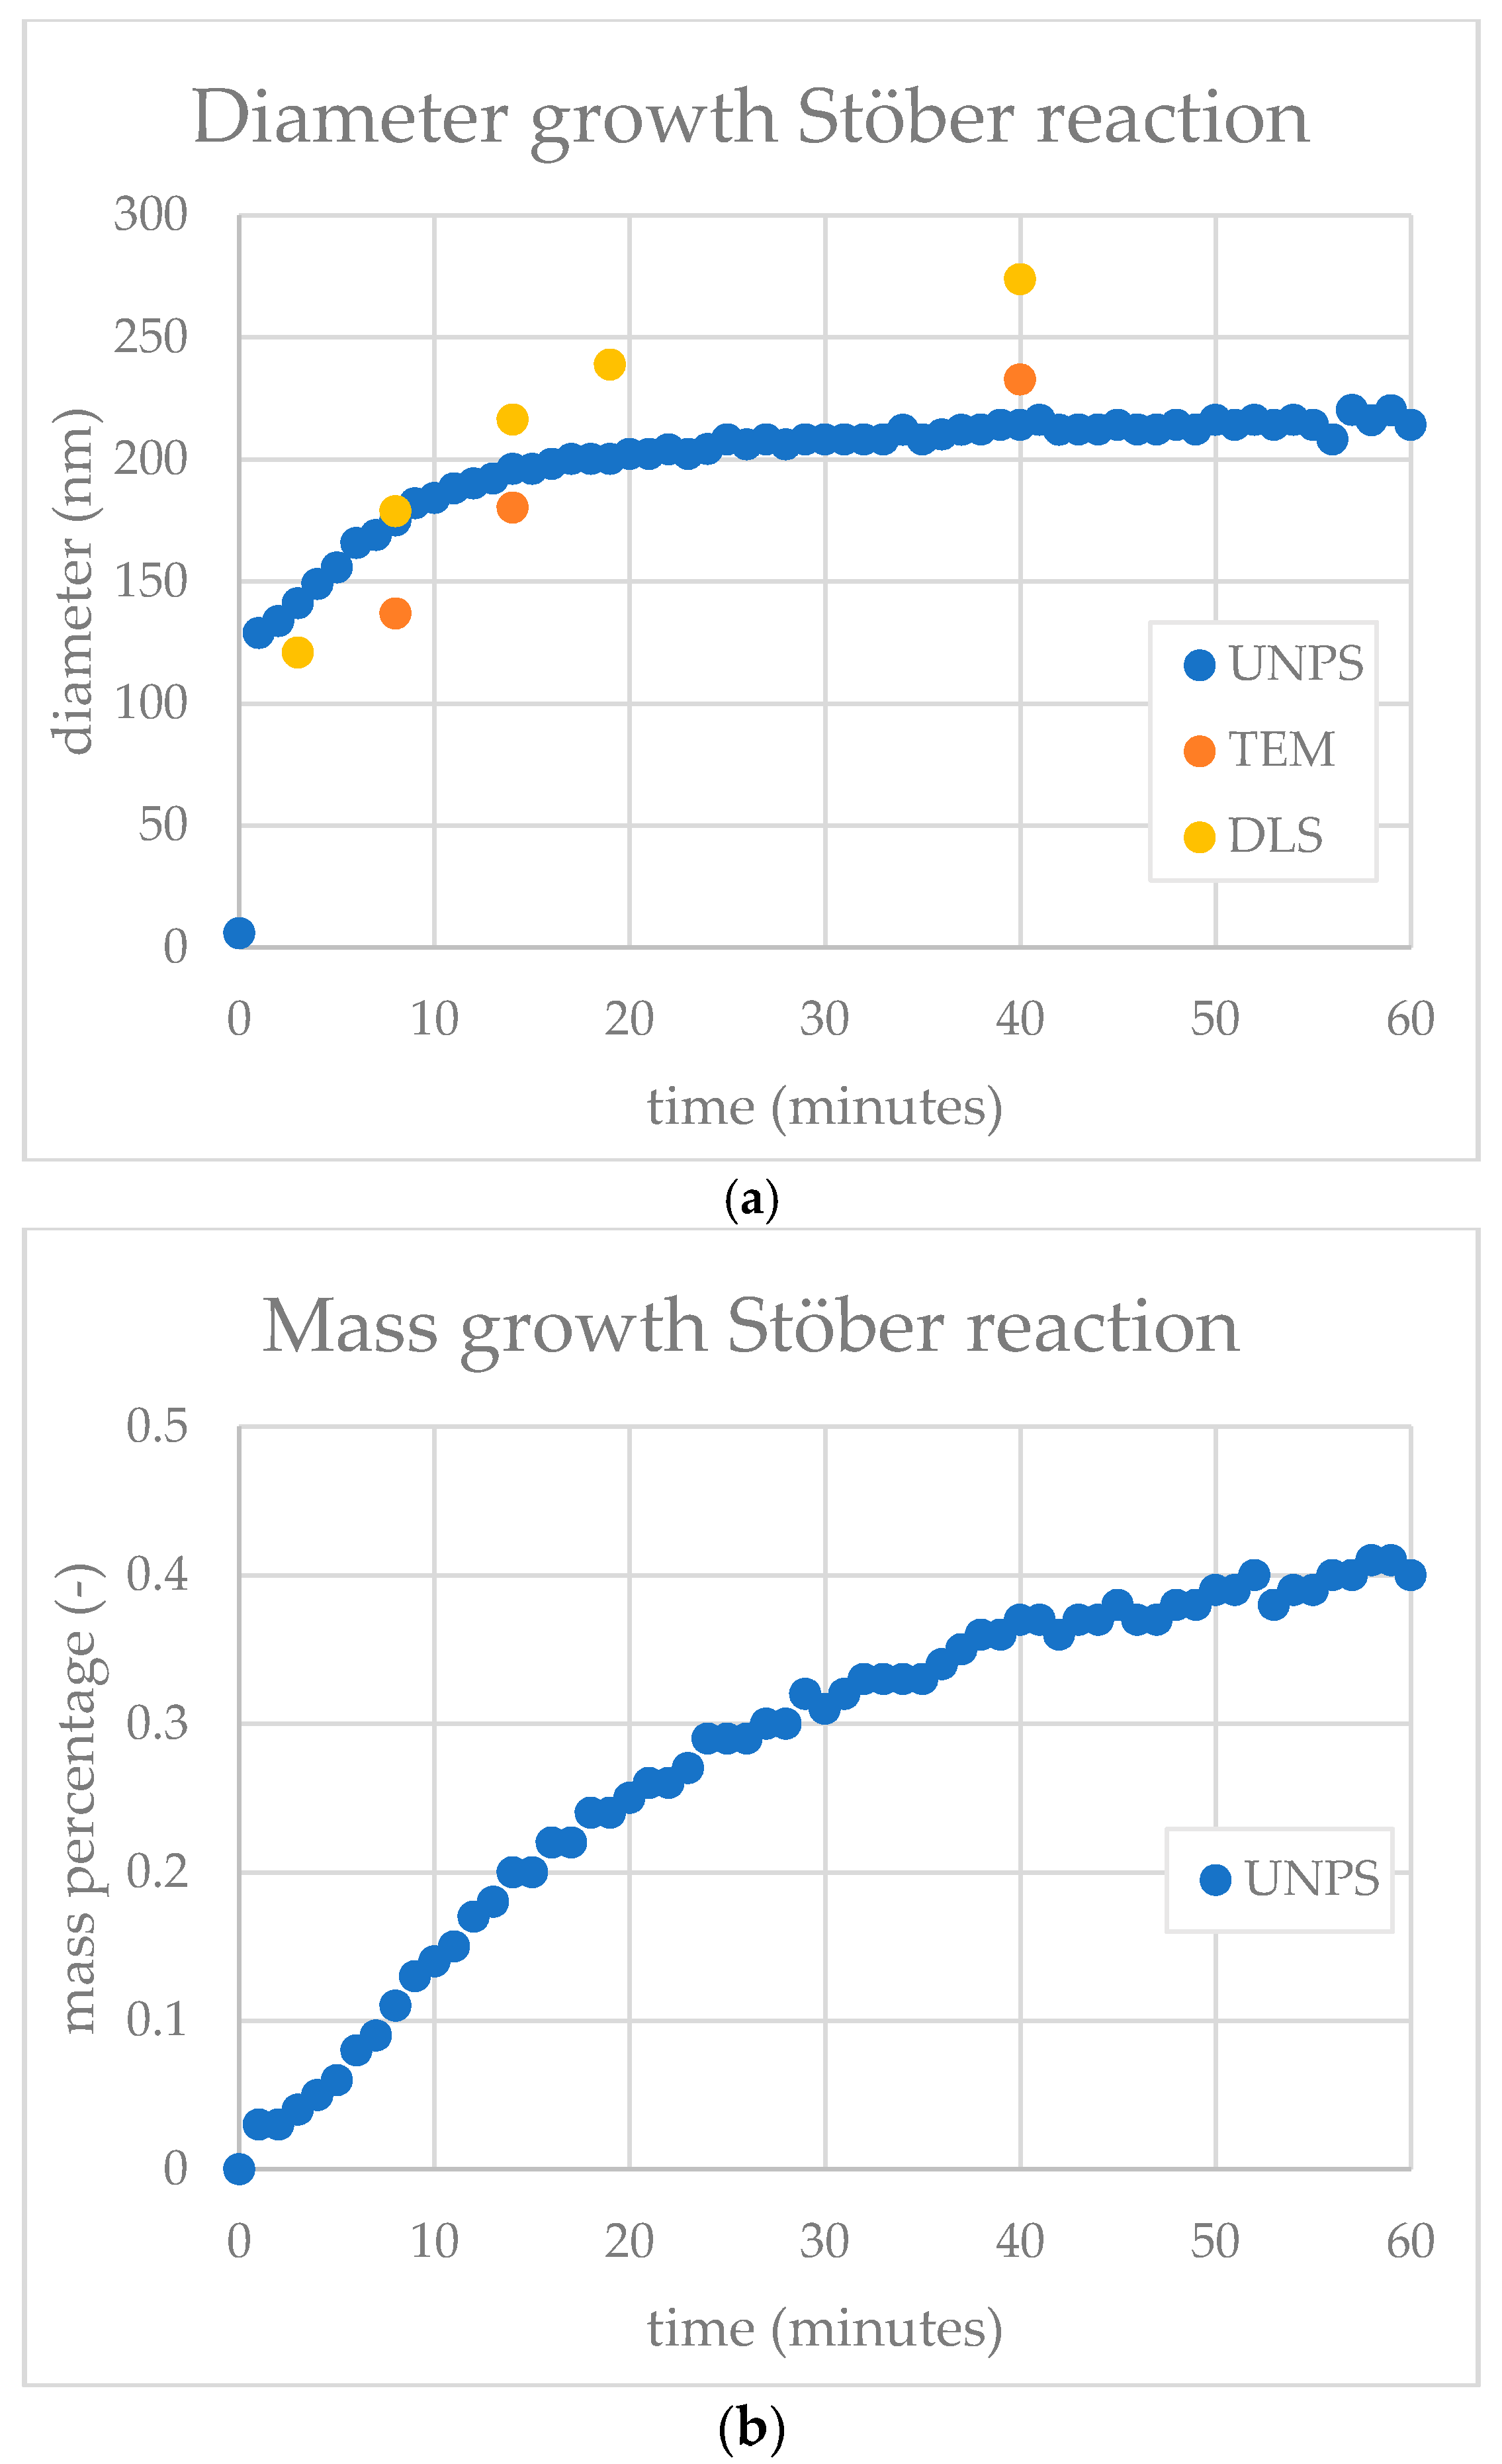
  • The real-time monitoring experiment. During this experiment the UNPS real-time monitors the size and concentration of silica particles during a Stöber synthesis in a water–alcohol mixture, starting from the molecular precursor tetra ethyl orthosilicate.

2.1. The Static Measurements

Materials and Method

A series of silica particles having different particle diameters (referred to as A, B, C, D, and E) Microspheres-Nanospheres (Cold Spring, New York, NY, USA), product numbers 24320-15, 24321-15, 24323-15, 24324-15 and 24325-15 were used for verification purposes. The particles dispersed in water were used as received, and a dilution concentration series was obtained by diluting the particles with MilliQ water in a beaker.

2.2. Real-Time Monitoring

2.2.1. Materials

Ethanol (EtOH) was obtained from Biosolve (Valkenswaard, The Netherlands) and used without further purification. Tetraethyl orthosilicate (TEOS), potassium chloride (KCl) and ammonia (NH3, 30–33% in water) were obtained from Sigma Aldrich (Zwijndrecht, The Netherlands) and used without further purification.

2.2.2. Synthesis

As prototypical liquid phase bottom-up nanoparticle synthesis to test the UNPS, we selected the Stöber synthesis of spherical silica nanoparticles. This sol-gel synthesis is performed in water–alcohol mixtures. Under ambient conditions, the particles are formed through hydrolysis of TEOS and subsequent polycondensation over a period of several hours. The silica nanoparticles were prepared following the procedure reported by Khan et al. [20]. For the preparation of particles with a mean diameter of approximately 150 nm [10], EtOH (45 mL), demineralized water (5.0 mL) and NH3 (3.0 mL) were mixed for 5 min, after which TEOS (1.5 mL) was added. This experiment was carried out at room temperature under magnetic stirring at 500 rpm for 3 h.
This is a prototypical liquid phase synthesis of nanoparticles. In this sol-gel synthesis, TEOS partially hydrolyses, and through subsequent polycondensation silica nanoparticles are formed as shown in the reaction Equations (3)–(5) [21].
Si(OC2H5)4 + xH2O → Si(OC2H5)4−x(OH)x + xC2H5OH (0 ≤ x ≤ 4)
≡Si−O−H + H−O−Si≡ → ≡Si−O−Si≡ + H2O
≡Si−OC2H5 + H−O−Si≡ → ≡Si−O−Si≡ + C2H5OH
This process proceeds according to an aggregation-based kinetic model [22,23]. The size of the silica nanoparticles resulting from this synthesis depends amongst other things on the concentration of ammonia and TEOS. The average particle size increases with increasing concentration of ammonia. The initial concentration of TEOS is inversely proportional to the size of the resulting silica nanoparticles.

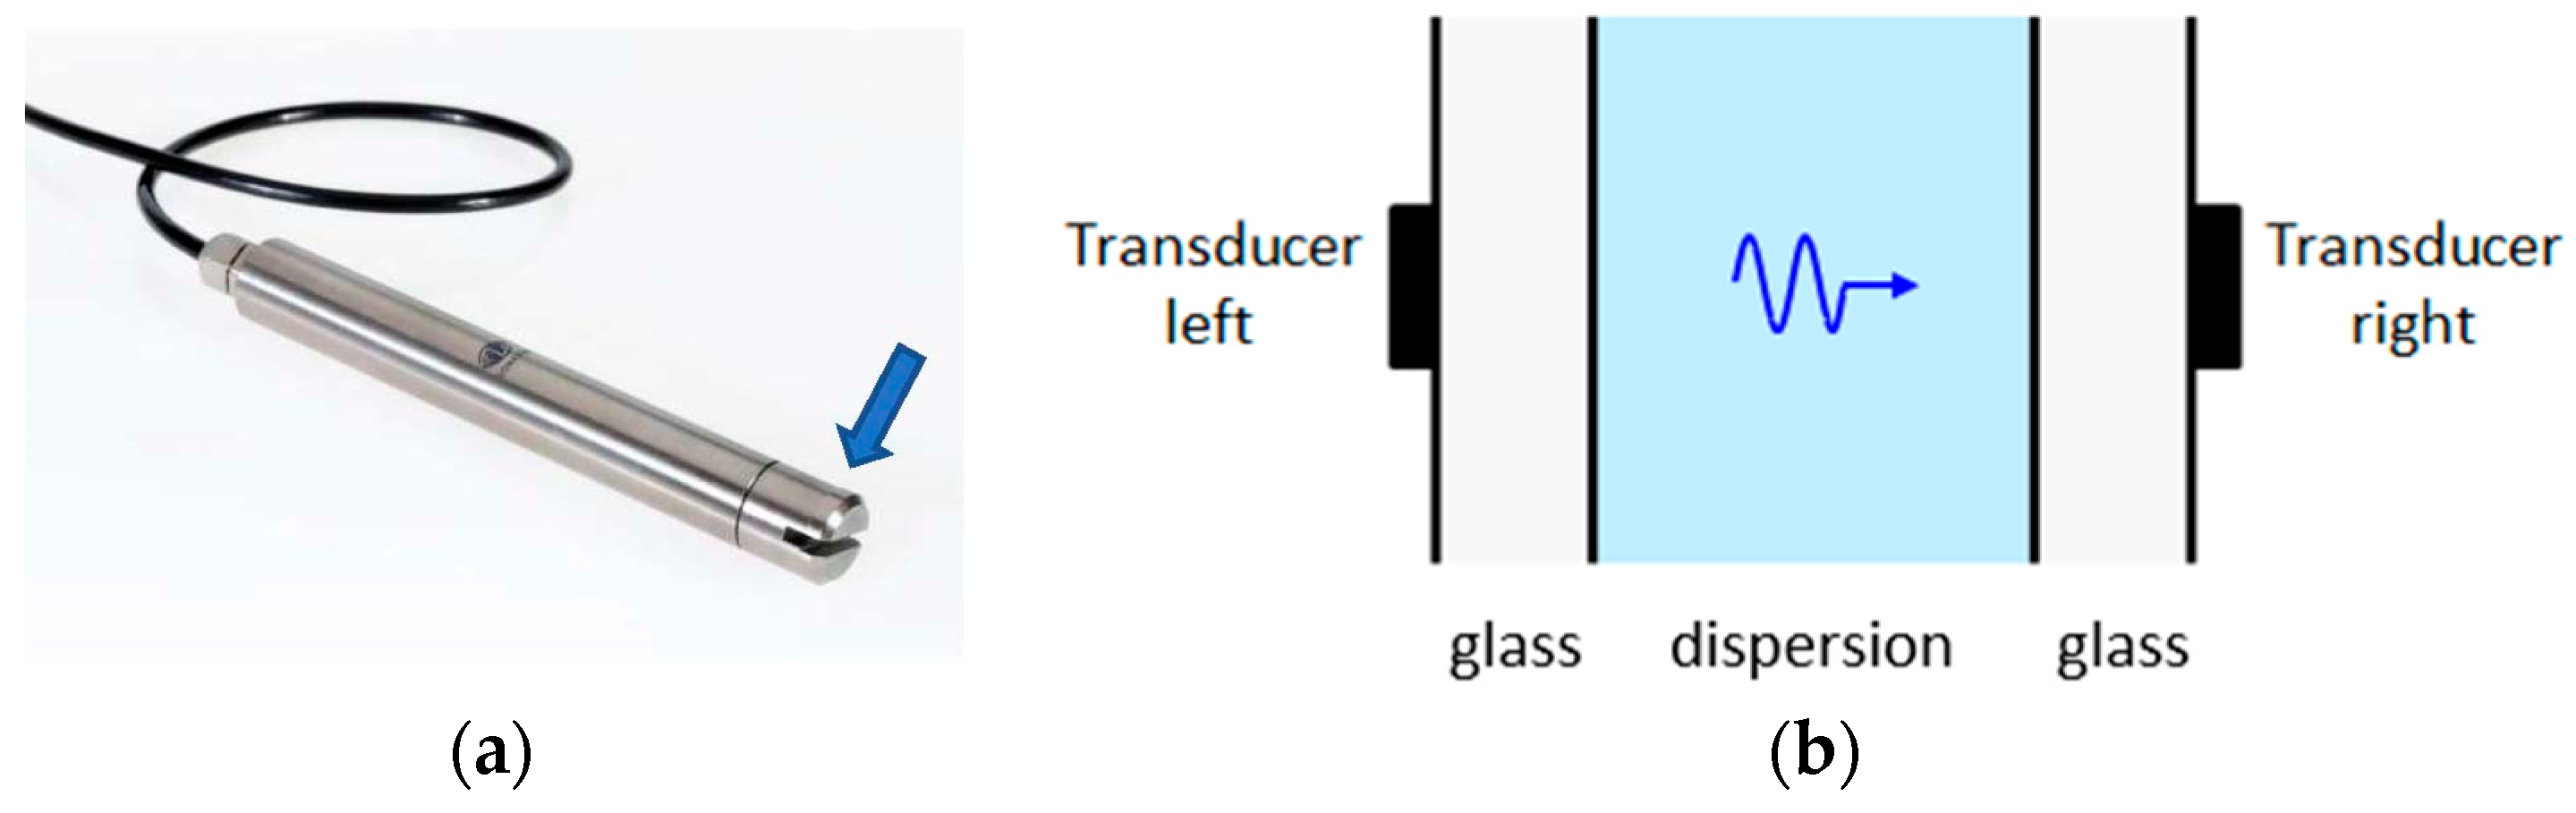
2.3. The UNPS Instrument

Equipment and Method

The probe of the UNPS (Sonaxis SA, France) was designed to send and receive signals in the 50 MHz–300 MHz range. Two thermocouples logged the temperature in the dispersion. In the preparation phase of both experiments the UNPS measured the solvent without particles to calibrate.
In the static experiment, we placed the probe and the thermocouples in the beaker with the sample dispersion. We changed the particle concentration by adding water. After each dilution, we waited for a stabilized temperature for at least three minutes.
In the real-time monitoring experiment we placed the probe and the thermocouples directly in the dispersion. We performed measurements every minute.

2.4. Transmission Electron Microscopy (TEM)

The dimensions and composition of the particles were determined by TEM using a JEOL ARM200F (Tokyo, Japan) operated at 200 kV.
To prepare samples for analysis, 4.0 μL of the commercial particle dispersion in water was placed on a copper grid coated with holey carbon. The grid was placed on a filter paper to absorb liquid flowing through the perforated film, and the sample was left to dry in air for a few minutes. In the real-time monitoring experiment, samples for the TEM were obtained by placing 4.0 μL of the particle dispersion in ethanol on a copper grid coated with carbon. The obtained samples were stored in a plastic container prior to the TEM analysis. All images were acquired in Bright Field TEM mode and in High Angle Annular Dark Field (HAADF)—Scanning TEM mode.

2.5. Off-Line Dynamic Light Scattering (DLS)

In the verification experiments of the commercially available particles and Stöber silica particle synthesis, we used a Malvern Zetasizer Nano ZS (ZEN 3600, λ = 633 nm, θ = 173°, Malvern, UK) as a reference. For the measurement, 2 mL of particle dispersion was inserted in a polymer cuvette, after which the cuvette was directly placed in the DLS instrument and the measurement performed. The temperature was set to 25 °C. For the commercial particles the viscosity and refractive index values used were that of pure water. For the Stöber, silica particle synthesis viscosity and refractive index values used were those of pure ethanol. For each measurement, data were acquired during 30 s in three runs.

3. Results

We first present the results of the static measurements, after which we will do the same for the real-time monitoring experiment.

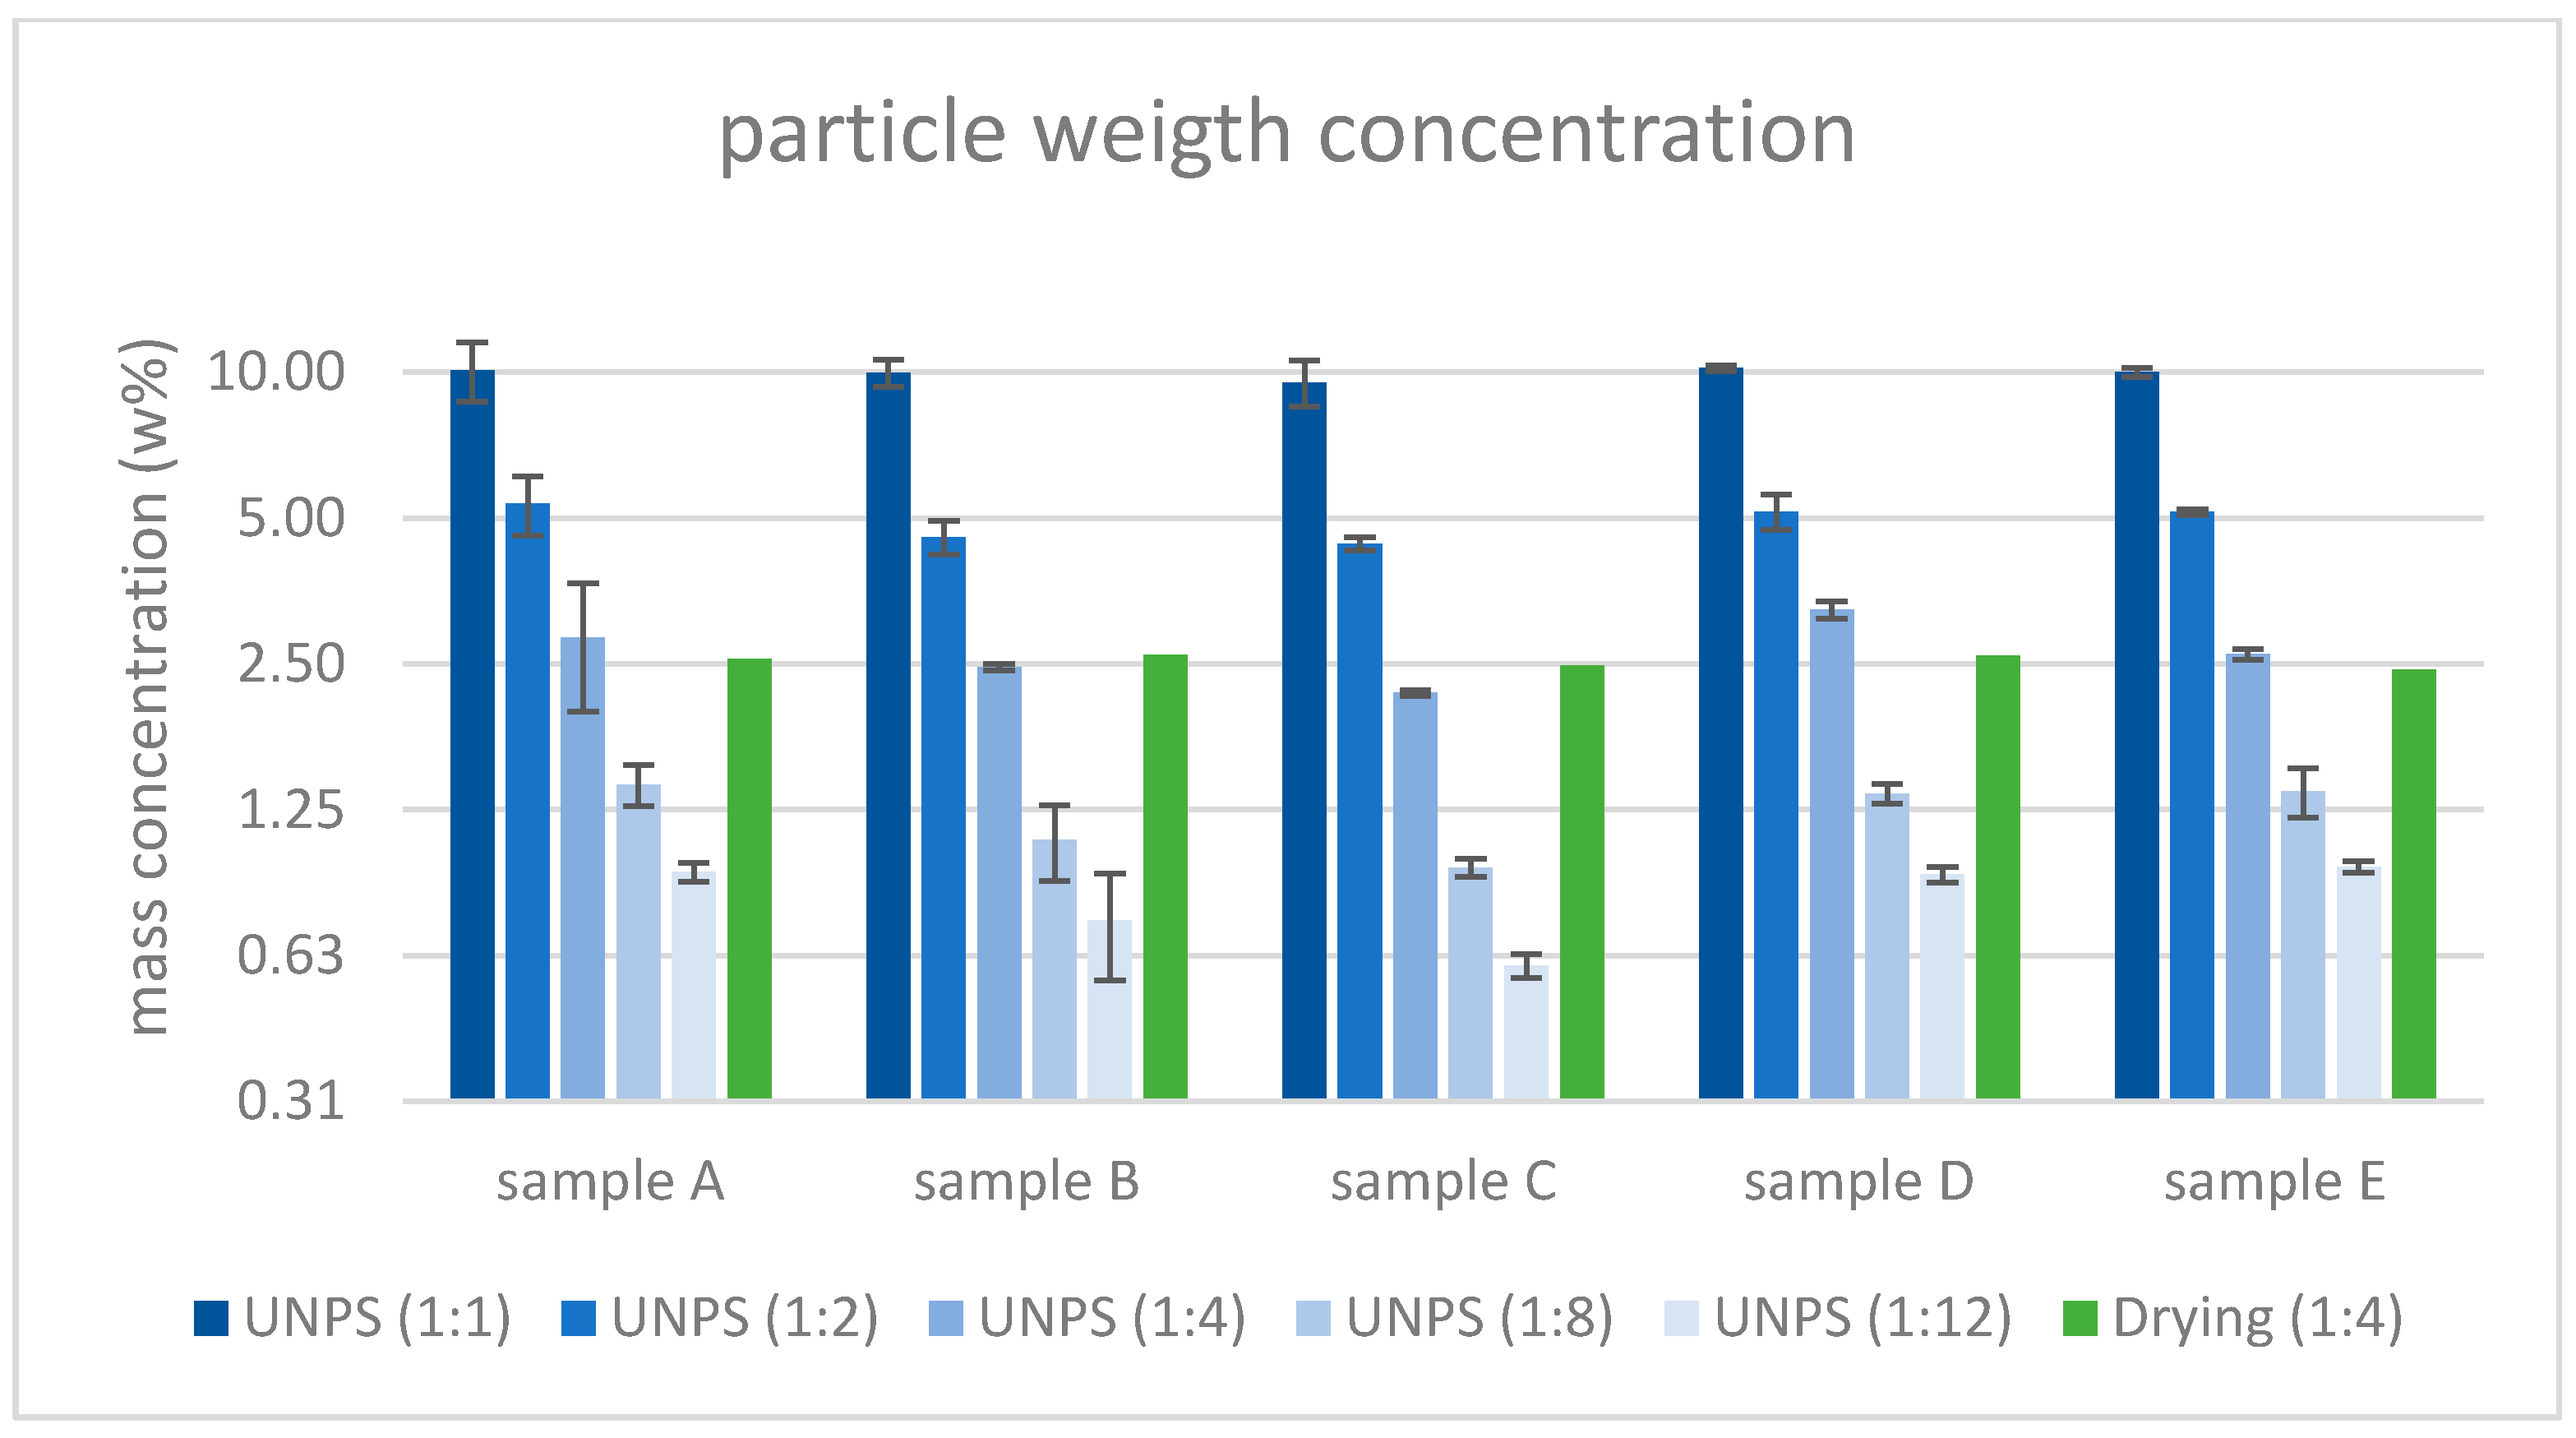
3.1. The Static Measurements Experiment

Figure 2 and Figure 3 show the measured speed of sound and attenuation plots for a verification sample with a mean diameter around 484 nm and 794 nm, respectively. As said before, the apex of the speed of sound (i.e., the frequency where the highest speed of sound measured) is at a different frequency in the two figures. This is because the speed of sound is dependent on the mean diameter of the particles.
Each of the five silica-water samples in five different dilutions was measured a few times (typically 4 to 8) with the UNPS. We refer to the samples as sample A until sample E. We refer to their dilutions as 1:1 (the original undiluted sample) until 1:12 (a dilution of 1 part of the original sample and 11 parts water). The 25 averages of these measurements are plotted in Figure 4 (mean particle diameter) and Figure 5 (particle concentration). The standard deviations of these measurements are used to create error bars, spanning the 3σ interval, on top of these 25 averages in both figures.
The UNPS results of the mean particle diameter (Figure 4) are verified with the TEM measurements. The TEM measurements were performed on the samples with the highest dilution. The measured mean particle diameters by the TEM (see Figure 6) were determined through measurement of at least 70 particles per sample.
We expect that the silica particles do not grow or dissolve in the samples during dilution. Therefore, the UNPS should measure the same mean particle diameter after each dilution. The fact that the variation for the five dilutions within the samples with mean particle diameters above 200 nm (samples B–E) for the UNPS measurements is small (within 6%) in Figure 4, supports that expectation.
We expected that the UNPS would have more difficulty measuring sample A. The particles with a diameter around 130 nm in sample A have an apex in the speed of sound that lies outside the measurement range (>250 MHz) of the UNPS. This makes it harder to estimate their size; still, the variation of the UNPS measurements for the different dilutions of sample A is within 12%.
The results of the two instruments are in good agreement. In particular, when we compare the UNPS measurements with the verification measurements of the TEM, we see that most measurements are within each other’s 3σ range.
The average and the standard deviation for the UNPS and TEM measurements plotted in Figure 4 are concentration based. It is more common to report TEM averages and standard deviations on a number base. However, for a more direct comparison with the UNPS we have recalculated the averages and standard deviations in a concentration base. The effect of this recalculation on the TEM averages is, with less than 3%, small. This is due to the fact that samples A–E all have a narrow particle size distribution. We expect that the drying process of the samples needed for the TEM measurements did not have a great influence (<2 nm) on the diameter of the particles.
Figure 5 is plotted on a logarithmic scale, such that the particle weight concentrations results at different dilution steps should be easier to relate. Besides the UNPS measurements, the weight concentration was also determined by drying the 1:4 samples (the green columns in Figure 5). The UNPS weight concentration measurements showed good consistency between the undiluted (1:1), the half diluted (1:2) samples, and the mass concentration obtained by drying. Concentrations below 2.5 w % (1:4 until 1:12) were less consistent, although most samples were within a 14% distance from their expected value. We expected that the UNPS would perform with higher accuracy at higher concentrations as the change in the speed of sound and the change in attenuation that the UNPS measures increases with mass concentration.

3.2. The Real-Time Monitoring Experiment

The synthesis of silica nanoparticles using a Stöber reaction was monitored by the UNPS for 60 min, performing a measurement every minute.
Figure 7 shows the measured speed of sound and attenuation, and their estimated fit at 30 min after the start of the reaction. In the beginning of the experiment the speed of sound was the same for all frequencies, and the attenuation peaked at 14,400 dB/m for 175 MHz. After 30 min we saw changes in speed of sound and attenuation. These are a consequence of the particles growing in size (blue dots in Figure 8a) and weight concentration (Figure 8b). The changes in the first minute occurred simply too fast to be followed by the UNPS. The rapid change in the first 20 min, however, was nicely captured by the UNPS. This was also true for the more gentle change in the next 40 min.
It is reassuring to see that the particle growth behavior measured by the UNPS, DLS (yellow dots in Figure 8a) and TEM (orange dots in Figure 8a) were to a large extent in agreement: rapid growth in the beginning followed by a more gentle growth. Of course the DLS and TEM were not directly measuring inside the reactor, and needed dilution and respectively drying of samples to measure the diameter. These processes might have influenced the mean diameter.

4. Conclusions

We have qualified the UNPS as an apparatus that can measure particle size and concentration during a liquid phase bottom-up synthesis of silica nanoparticles starting from molecular precursor:
-
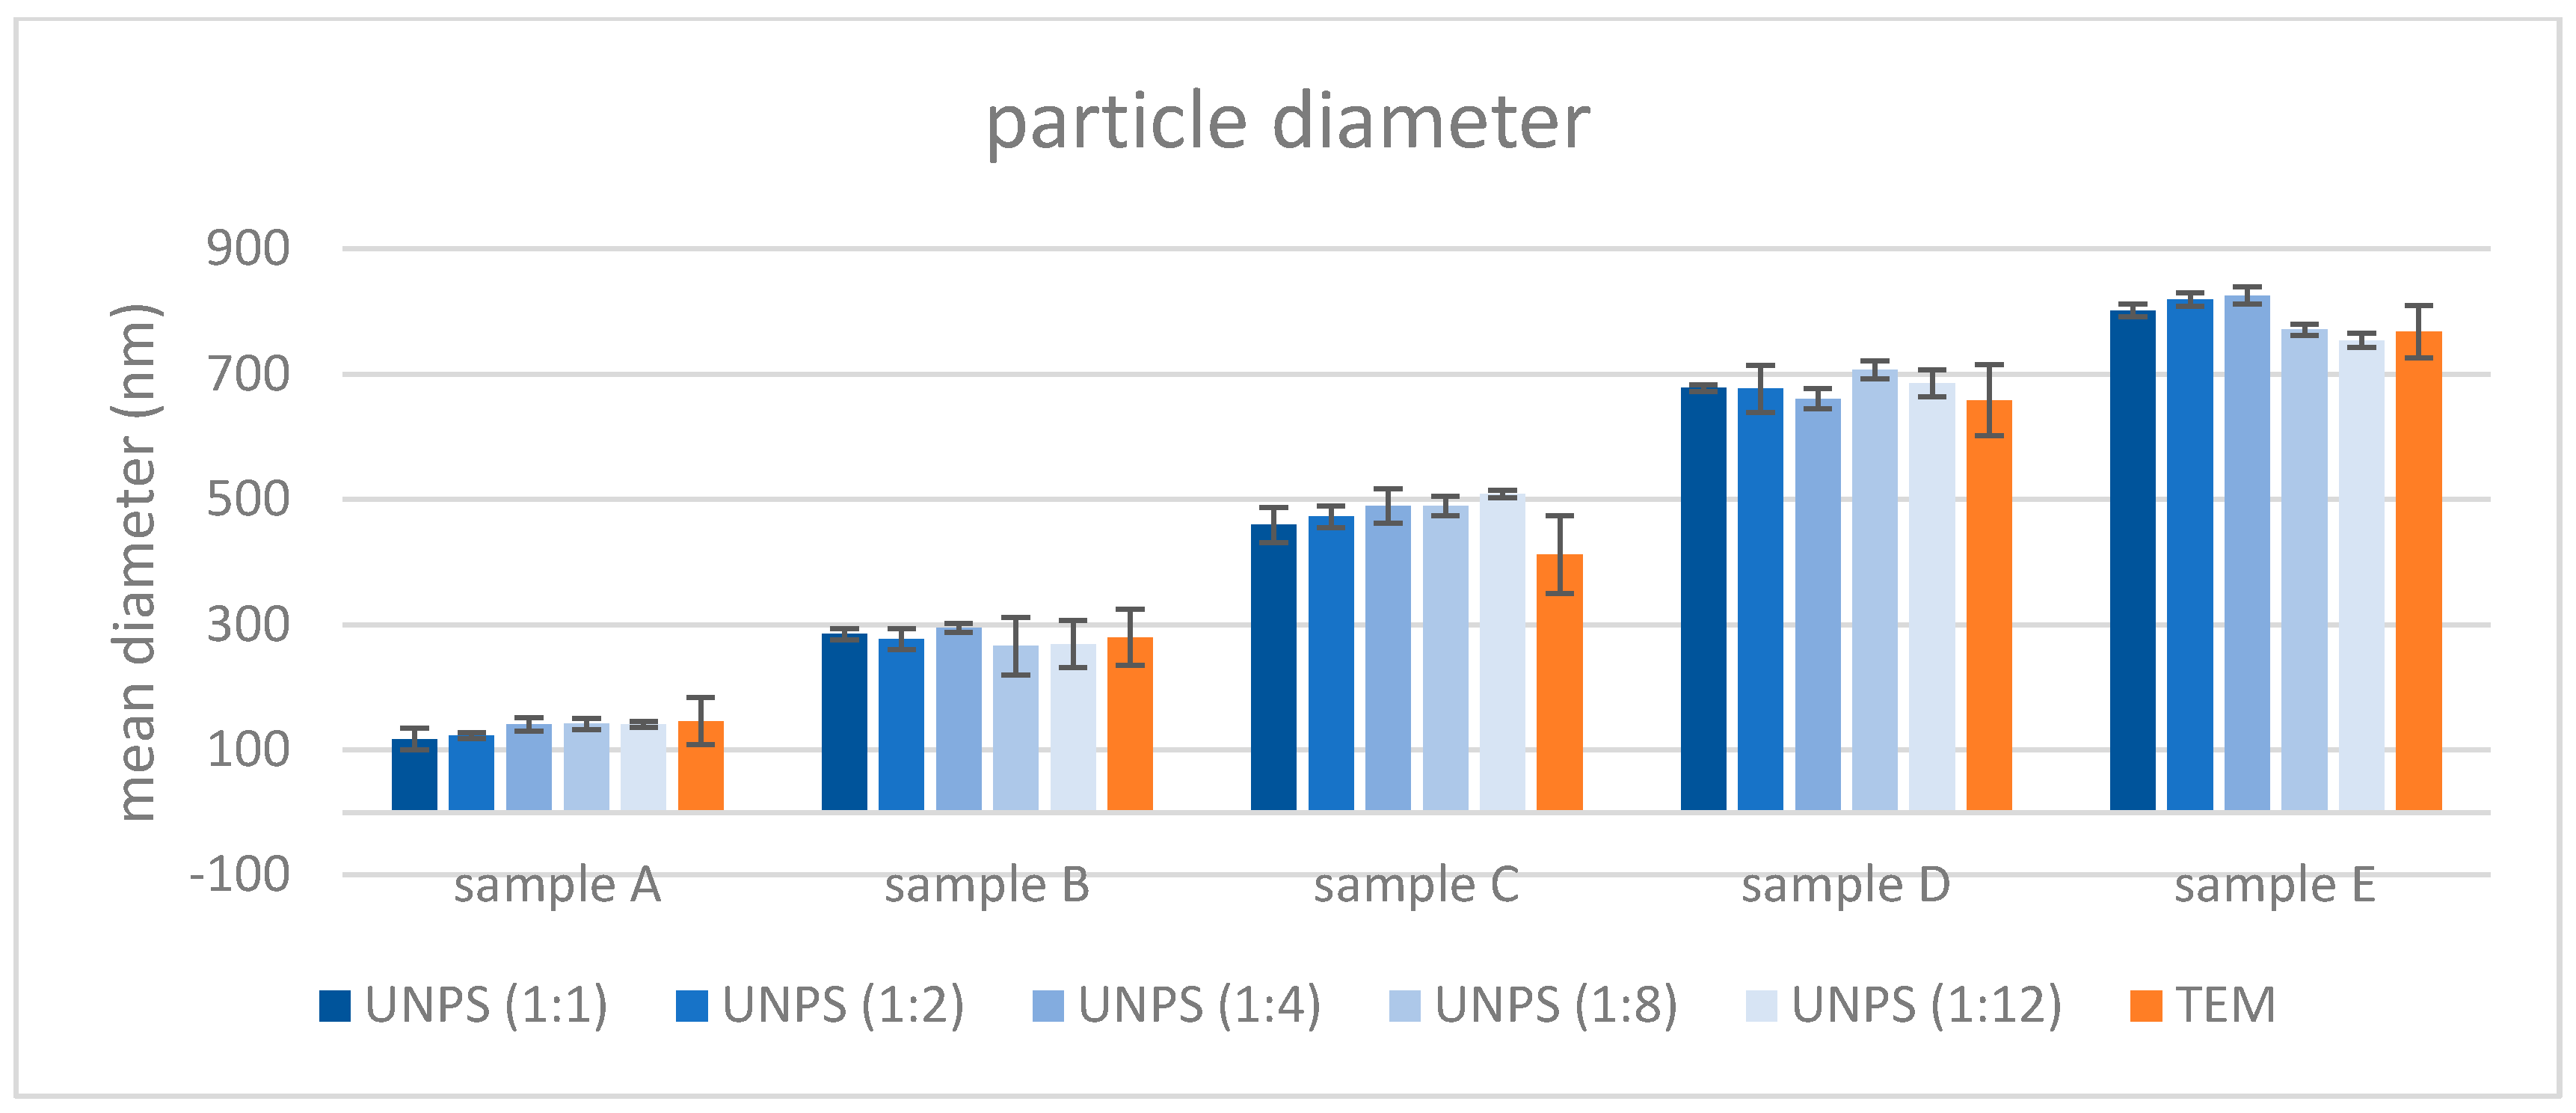
With static measurements we have verified the UNPS’ ability to measure particle size accurately enough by comparing the results of the UNPS and TEM. The UNPS and TEM measurements were mostly in the 3σ ranges.
-
With static measurements we have verified the UNPS’ ability to measure particle concentration accurately enough by comparing the UNPS results with the drying measurements. The mass concentration measurements showed good consistency between the undiluted, the half diluted samples, and the drying measurements. Concentrations below 2.5 w % were less consistent. However, most samples were within 14% of their expected value.
-
One UNPS measurement every minute was fast enough to follow a Stöber reaction for the synthesis of silica nanoparticles in real-time.
We are convinced that with this qualification the UNPS is a good addition to the particle measurement toolset and can be used in a complementary way with currently existing methods. Implementation of the method will help the industry to improve the design and production of nanoparticles.

Author Contributions

G.J.v.G., N.M., P.B., A.V., and P.v.N. conceived and designed the experiments; R.v.E. and G.J.v.G. performed the experiments; G.J.v.G., R.v.E., and N.M. analyzed the data; M.V. contributed to the interpretation of the analyses results; C.J., G.J.v.G., A.V., and P.v.N. built the UNPS software; and N.M. and G.J.v.G. wrote the manuscript. All authors have read and approved the final manuscript.

Funding

This work was supported by the European Commission and is part of the EU project COPILOT which has received funding from the European H2020 program under grant agreement n° 645993. Solliance and the Dutch province of Noord Brabant are acknowledged for funding the TEM facility.

Conflicts of Interest

The authors declare no conflict of interest.

References

  1. Buskens, P.; Burghoorn, M.; Mourad, M.; Vroon, Z. Antireflective coatings for glass and transparent polymers. Langmuir 2016, 32, 678. [Google Scholar] [CrossRef] [PubMed]
  2. Mann, D.; Chattopadhyay, S.; Pargen, S.; Verheijen, M.; Keul, H.; Buskens, P.; Möller, M. Glucose-functionalized polystyrene particles designed for selective deposition of silver on the surface. RSC Adv. 2014, 4, 62878–62881. [Google Scholar] [CrossRef] [Green Version]
  3. Segers, M.; Arfsten, N.; Buskens, P.; Möller, M. A facile route for the synthesis of sub-micron sized hollow and multiporous organosilica spheres. RSC Adv. 2014, 4, 20673–206676. [Google Scholar] [CrossRef]
  4. Mann, D.; Nascimento-Duplat, D.; Keul, H.; Möller, M.; Verheijen, M.; Xu, M.; Urbach, H.P.; Adam, A.J.L.; Buskens, P. The influence of particle size distribution and shell imperfections on the plasmon resonance of Au and Ag nanoshells. Plasmonics 2017, 12, 929–945. [Google Scholar] [CrossRef] [PubMed]
  5. Mann, D.; Voogt, S.; van Zandvoort, R.; Keul, H.; Möller, M.; Verheijen, M.; Nascimento-Duplat, D.; Xu, M.; Urbach, H.P.; Adam, A.J.L.; et al. Protecting patches in colloidal synthesis of Au semishells. Chem. Commun. 2017, 53, 3898–3901. [Google Scholar] [CrossRef] [PubMed]
  6. Buskens, P.; Mourad, M.; Meulendijks, N.; van Ee, R.; Burghoorn, M.; Verheijen, M.; van Veldhoven, E. Ultra-Low Refractive Index Coatings Produced through Random Packing of Silicated Cellulose Nanocrystals. Colloids Surf. A 2015, 487, 1–8. [Google Scholar] [CrossRef]
  7. Mann, D.; Voogt, S.; Keul, H.; Möller, M.; Verheijen, M.; Buskens, P. Synthesis of Polystyrene-Polyphenylsiloxane Janus Particles through Colloidal Assembly with Unexpected High Selectivity: Mechanistic Insights and Their Application in the Design of Polystyrene Particles with Multiple Polyphenylsiloxane Patches. Polymers 2017, 9, 475. [Google Scholar] [CrossRef]
  8. Segers, M.; Vermeer, I.; Möller, M.; Verheijen, M.; Buskens, P. Synthesis and Characterization of Hybrid Particles Obtained in a One-Pot Process through Simultaneous Sol-Gel Reaction of (3-Mercaptopropyl) trimethoxysilane and Emulsion Polymerization of Styrene. Colloids Interfaces 2018, 1, 7. [Google Scholar] [CrossRef]
  9. Epstein, P.S.; Carhart, R.R. The absorption of sound in suspensions and emulsions. I. Water fog in air. J. Acoust. Soc. Am. 1953, 25, 553–565. [Google Scholar] [CrossRef]
  10. Allegra, J.R.; Hawley, S.A. Attenuation of sound in suspensions and emulsions: Theory and experiments. J. Acoust. Soc. Am. 1972, 51, 1545–1564. [Google Scholar] [CrossRef]
  11. Geers, H.; Witt, W. Extinction for In-line Measurement of Particle Size and Concentration of Suspensions and Emulsions. In Particulate Systems Analysis; Harrogate, UK, 2003; Available online: https://archive.sympatec.com/docs/UltrasonicExtinction/publications/UE_2003_UltrasonicExtinction.pdf (accessed on 29 June 2018).
  12. Hartmann, U.; Behrens, C. Simultaneous on-line analysis of solid concentration and particle size distribution of Gypsum Slurries applying Ultrasonic Extinction. ZKG Int. 2006, 59, 17–21. [Google Scholar]
  13. Meli, F.; Klein, T.; Buhr, E.; Frase, C.G.; Gleber, G.; Krumrey, M.; Duta, A.; Duta, S.; Korpelainen, V.; Bellotti, R.; et al. Traceable size determination of nanoparticles, a comparison among European metrology institutes. Meas. Sci. Technol. 2012, 23, 125005. [Google Scholar] [CrossRef]
  14. Berne, B.J.; Pecora, R. Dynamic Light Scattering: With Applications to Chemistry, Biology, and Physics; Courier Corporation: Mineola, NY, USA, 2000. [Google Scholar]
  15. Brown, W. Dynamic Light Scattering: The Method and Some Applications; Clarendon Press: Oxford, NY, USA, 1993; ISBN 9780198539421. [Google Scholar]
  16. Dhont, J.; Dekruif, C.; Vrij, A. Light scattering in colloidal dispersions: Effects of multiple scattering. J. Colloid Interface Sci. 1985, 105, 539–551. [Google Scholar] [CrossRef] [Green Version]
  17. Meulendijks, N.; van Ee, R.; Stevens, R.; Mourad, M.; Verheijen, M.; Kambly, N.; Armenta, R.; Buskens, P. Flow cell coupled dynamic light scattering for real-time monitoring of nanoparticle size during liquid phase bottom-up synthesis. Appl. Sci. 2018, 8, 108. [Google Scholar] [CrossRef]
  18. Van Neer, P.L.M.J.; Volker, A.W.F.; Pierre, G.L.G.; Bouvet, F.L.D.M.; Crozat, S. Ultrasound transmission spectroscopy: In-line sizing of nanoparticles. In Proceedings of the IEEE International Ultrasonics Symposium, Chicago, IL, USA, 3–6 September 2014; pp. 2454–2457. [Google Scholar]
  19. Volker, A.W.F.; van Neer, P.L.M.J.; Pierre, G.L.G.; Bouvet, F.L.D.M.; Crozat, S. Method and Apparatus for Characterizing a Medium Using Ultrasound Measurements. US20170023532A1, 31 March 2014. [Google Scholar]
  20. Khan, M.F.; Dong, H.; Chen, Y.; Brook, M.A. Low Discrimination of Charged Silica Particles at T4 Phage Surfaces. Biosens. J. 2015, 4, 125. [Google Scholar] [CrossRef]
  21. Ibrahim, I.A.M.; Zikry, A.A.F.; Sharaf, M.A. Preparation of spherical silica nanoparticles: Stober silica. J. Am. Sci. 2010, 6, 985–989. [Google Scholar]
  22. Stöber, W.; Fink, A.; Bohn, E. Controlled Growth of Monodisperse Silica Spheres in the Micron Size Range. J. Colloid Interface Sci. 1968, 26, 62–69. [Google Scholar] [CrossRef]
  23. Giesche, H. Synthesis of Monodispersed Silica Powders; I. Particle Properties and kinetics. J. Eur. Ceram. Soc. 1994, 14, 189–204. [Google Scholar] [CrossRef]
Figure 1. (a) The ultrasound nanoparticle sizer (UNPS) probe with a diameter of 18 mm (image published with permission of Sonaxis); (b) sketch of the basics of the method to measure the speed of sound and attenuation of ultrasonic waves in a dispersion.
Applsci 08 01064 g001
Figure 2. (a) Measured and estimated fit of the speed of sound and (b) attenuation for a dispersion containing standardized silica particles with a mean diameter around 484 nm and a weight concentration of 5 w %.
Applsci 08 01064 g002
Figure 3. (a) Measured and estimated fit of the speed of sound and (b) attenuation for a dispersion containing standardized silica particles with a mean diameter around 794 nm and a weight concentration of 5 w %.
Applsci 08 01064 g003
Figure 4. UNPS and transmission electron microscope (TEM) measurements of the mean particle diameter of the silica samples.
Applsci 08 01064 g004
Figure 5. UNPS and drying measurements of the particle concentration of the Silica samples.
Applsci 08 01064 g005
Figure 6. TEM images of the silica samples. From left to right: sample A, B, C, D, E.
Applsci 08 01064 g006
Figure 7. (a) Measured and estimated fit of the speed of sound and (b) attenuation, 30 min after the start of the Stöber reaction.
Applsci 08 01064 g007
Figure 8. (a) The mean diameter of the Silica particles measured by the UNPS (blue), TEM (red), and dynamic light scattering (DLS) (yellow), during the Stöber reaction. (b) The mass percentage of the Silica particles measured by the UNPS during the Stöber reaction.
Applsci 08 01064 g008

