Featured Application
This work can be applied to track mobile users, manage indoor navigations, provide alarms in secured areas, such as unacceptable hospital areas, military systems and mass rapid transit (MRT) inside enclosed areas. In general, this work is applicable to inside enclosed areas where the specific location is mandatory.
Abstract
In the Internet of Things (IoT) era, indoor localization plays a vital role in academia and industry. Wi-Fi is a promising scheme for indoor localization as it is easy and free of charge, even for private networks. However, Wi-Fi has signal fluctuation problems because of dynamic changes of environments and shadowing effects. In this paper, we propose to use a deep neural network (DNN) to achieve accurate localization in Wi-Fi environments. In the localization process, we primarily construct a database having all reachable received signal strengths (RSSs), and basic service set identifiers (BSSIDs). Secondly, we fill the missed RSS values using regression, and then apply linear discriminant analysis (LDA) to reduce features. Thirdly, the 5-BSSIDs having the strongest RSS values are appended with reduced RSS vector. Finally, a DNN is applied for localizing Wi-Fi users. The proposed system is evaluated in the classification and regression schemes using the python programming language. The results show that 99.15% of the localization accuracy is correctly classified. Moreover, the coordinate-based localization provides 50%, 75%, and 93.10% accuracies for errors less than 0.50 m, 0.75 m, and 0.90 m respectively. The proposed method is compared with other algorithms, and our method provides motivated results. The simulation results also show that the proposed method can robustly localize Wi-Fi users in hierarchical and complex wireless environments.
1. Introduction
Currently, human daily life is becoming highly integrated with the Internet of Things (IoT), as the Internet attracts much attention with respect to the outlook of future life and rapidly increasing communication networks. One of the key technologies of IoT is localization, as it is a means to develop keen environments and situation-awake services [1,2]. Additionally, the rapid developments of technologies have demands to increase localization services. According to [3], localization plays important roles by providing information about the position of mobile users. Location mindfulness is one of the empowering tools for the coming smart and green cities, by notifying people of occupied places and times. Moreover, localizations add value and offer various services, such as healthcare monitoring, emergency management, personal tracking, context-dependent information services, and advertisements. Localization can be applied to different areas, such as universities, military systems, and hospitals. Therefore, an accurate location scheme is a key issue for realizing the localization applications in various areas.
In indoor environments; Global Positioning System (GPS), Global Navigation Satellite System (GLONASS), and Galileo are not practical because they lack line of sight (LoS) between the satellites and the receivers, which is easily affected by the physical layout of equipment and is sensitive to occlusion [3,4,5]. Therefore, indoor localization becomes common in indoor environments to offer convenient services. According to [2,5], one of the enabling key factors for the future IoT archetype is applying accurate indoor localization. As pointed out in [6], indoor localization can be applied for robotics, ambient assisted living, health applications, location-based services (LBS), and to address challenges in 5G networks. Hence, indoor localization should be applied carefully to provide high accuracy, low complexity, and short operational time.
Based on the dependency of range measurements, indoor localization can be classified as range-based and range-free localization schemes [7]. Range-based localization uses the measured distance or angle to estimate the location. Under these schemes, received signal strength (RSS), time-of-arrival (ToA), time-difference-of-arrival (TDoA), or angle-of-arrival (AoA) are common approaches. On the other hand, the range-free schemes use connectivity or pattern matching methods to estimate one’s location. Range-free schemes include the centroid algorithm, the Distance Vector Hope (DV-hop) algorithm, the Multi-dimensional Scaling-MAP (MDS-MAP) algorithm, and convex programming approaches. Generally, range-based schemes are more accurate [8], simple, and low-cost [7] than range free schemes.
In wireless communication, indoor localization can be applied using technologies such as wireless local area network (WLAN) or Wi-Fi, infrared (IR), radio frequency identification (RFID), ultrasound, Bluetooth, or a combination of these technologies [3]. Wi-Fi is predominantly used for indoor location because it can be installed in different areas without any new infrastructure. It is also easy to measure the required data from cheap Wi-Fi devices like Access Points (APs) [9]. Wi-Fi-based localization is required for location awareness services in places such as large shopping malls and university campuses. Such complex and hierarchical environments require mountable system designs for indoor localization.
Wi-Fi based localization is commonly adopted based on RSS, ToA, TDoA, and AoA. RSS-based indoor localization in a Wi-Fi environment is characterized by minimum cost, less complexity for the localization system, and ease of characterizing and mapping the indoor environment into distinguishable areas [9]. Additionally, almost every Android mobile is equipped with a Wi-Fi adapter, so it is easy to find required information from APs. Thus, it is possible to obtain basic localization information to provide specific position estimations without additional costs of expensive sensors.
Based on discussions in [10], there are two methods to estimate Wi-Fi-based localization: Wi-Fi ranging and Wi-Fi fingerprinting. In Wi-Fi ranging, estimation is done directly with the distance towards the APs, which is impractical inside buildings due to multiple signal occlusions, wall reflections, and the overall influence of people. On the other hand, Wi-Fi fingerprinting methods focus on efficiently comparing achieved Wi-Fi scans to the prerecorded database. However, Wi-Fi fingerprinting still has problem as it is difficult to tune in the case of hierarchical buildings, floors, and rooms, since it requires a larger number of available datasets. Continuous Wi-Fi signal fluctuations are another problem to tackle for accurate localization using Wi-Fi fingerprinting approaches.
To alleviate localization problems of fingerprinting approaches, machine-learning methods were proposed [1,5,8,11,12]. In [1], a radial basis function network was used to estimate location, and a particle filter was used to track the user’s path in an indoor environment. RFID and IR were used as the source of data from sensors, which creates a high cost as it requires additional hardware and requires offensive calibration processes. In [5], support vector regression (SVR) and an artificial neural network (ANN) were used for indoor localization. The data was generated by propagation model in 2 GHz band. This work focused on locating APs in indoor environments, rather than localizing mobile users.
In [11], authors used an ANN algorithm for indoor localization using ToA and AoA as data sources. However, this type of approach has operational complexity and is difficult to accurately localize because of lacks of LoS. In [13], K-nearest neighbors (KNN) was used to estimate the current position of a mobile user. They used historical data to estimate the current position of mobile users. Here, the time dependency of RSS values was not considered. In [12], KNN and a Kalman filter were used for localization performance using APs and other sensors. The accuracy was evaluated using mean square error. This work required extra hardware for data collection, and did not show system performances at different testing points.
In this paper, we propose to use a deep neural network (DNN) with linear discriminate analysis (LDA) to accurately localize by cleaning noise and utilizing the benefits of a large number of datasets. In DNN, we focused on classification- and regression-based indoor localization schemes using real data collected from three buildings. In this particular work, we used the multilayer perceptron (MLP) algorithm using a rectified linear activation function in four hidden layers. Before applying localization in both schemes, we apply regression to fill the missed RSS values and LDA for dimensionality reduction. The proposed system is evaluated in different scenarios at both schemes. The performances of our proposed method are also compared with other algorithms in each scenario to validate our proposed approach. The proposed system is evaluated at extinctive datasets collected from 802.11 standards in our own institution.
The main contribution of this paper is to apply integrations of LDA and MLP algorithms to improve localization accuracies and computational complexities. Moreover, to collect large and heterogeneous datasets from hierarchical and complex environments. We prepare class-independent projected vector to convert any complex features into smaller features without affecting information contents. Additionally, we practice the parallel implementation of classification and regression schemes in Graphical Processing Unit (GPU), which helps to improve performance rates in Wi-Fi environments. This helps to provide both bounded and specific positioning of Wi-Fi users in hierarchical and complex environments at the same instance.
The integration of LDA and MLP has benefits of the usage of larger datasets and more accurate localization. It also improves computational times by reducing from complex into simpler features. To the best of authors’ knowledge, this article is the first to present the integration of LDA and MLP algorithms to localize Wi-Fi users in complex and hierarchical environments.
The rest of this paper is organized as follows: In Section 2, we describe relevant works to show the gap of our contributions. In Section 3, the working environment and experimental data collection approaches are discussed. Details of the proposed technique are described in Section 4. Section 5 presents the results and discussion. Finally, conclusions of the work and possible future directions are given in Section 6.
2. Related Works
It is difficult to use traditional learning approaches for scalable localization in different complex and hierarchical environments because shallow learning has limitations of localization accuracy due to data size and the learning performance of the algorithms. It is highly affected by different environmental factors, such as multipath fading and the attenuation of objects.
Currently, DNN is applied to handle shallow learning problems by avoiding the needs of hand engineering for extracting feature representations, and easily learning high-level features from a large set of noise samples. As discussed in [9], DNN shows immunity against signal fluctuations, noise effects, device dependency, and the elimination of time-consuming manual parameter tuning. According to [10,14], DNN helps to lower the workforce burden of localization. DNN can provide accurate Wi-Fi-based indoor localization due to the ability to learn signal fluctuations through time and environmental dynamicity because of its deeper functions that map the input to the output [4,9,10,15,16]. In [4], a stacked denoising auto-encoder (SDA) was used to reduce the dimensions, and then the hidden Markov model (HMM) was applied to refine the localization. The root mean square (RMS) was compared with respect to different sample sizes, and shows that using SDA and HMM has better accuracy than using DNN and HMM alone. They showed that it is possible to boost the localization time complexity using SDA and HMM. However, scholars evaluate their system in different data samples rather than comparing their proposed system with other algorithms. In [9], DNN was used for building and floor label positioning using RSS values. The classification accuracy is only 92% for floor-level localization. The proposed system was evaluated in terms of various epoch sizes.
In [10], a DNN system was used for building and floor classification on the publicly-available UJIIndoorLoc dataset. This work used a stacked auto-encoder for feature reduction. Researchers reached the conclusion that the deep learning paradigm can provide a global location recognition solution from Wi-Fi data at a significantly reduced effort in hierarchical problem types. Nevertheless, the work did not consider localization accuracy evaluation at each testing point. In [15], channel state information was used for indoor localization. Researchers compared the accuracy of the proposed system performance in laboratories and living rooms and found that the system performs differently, even in environments which are nearly the same. This work has no way to determine the performance of the system in different scenarios and testing points.
In [16], a feedforward neural network (FFNN) classifier was used for multi-building and multi-floor indoor localization, and could achieve 99.82% and 91.27% accuracy, respectively. The experimental scenario was performed in a building, while their system was evaluated through a simulation in a multi-building setting. However, in real world situations, it is very difficult to evaluate a system through datasets collected from different environments in different approaches. In [17], building-level classification was done by selecting the strongest RSS values from the measured fingerprints. Here, it is difficult for the system to discriminate buildings whenever there is similar signal strength. In [18], a deep-learning-based indoor fingerprinting system using channel state information (CSI) was used for indoor localization. In this technique, the system performance was evaluated through clustering, which has a lack of target values making it difficult to evaluate the system performance.
In [19], MLP was used for indoor localization using the mitigation of the ground reflection effect for position estimation. This work was done through the aid of a wireless sensor networks. The localization has been done through AoA data sources that have LoS problems. The work focused on locating the position of each AP no matter the position of the Wi-Fi users in the environment. It describes the relationship between the RSSI signals sent by the APs and the distance between such an AP and a set of mobile device users. In [20], scholars used an artificial synaptic network, an MLP network, and a generalized radial basis function network through ToA measurements to localize sensors rather than localizing Wi-Fi users. MLP was applied to effectively reduce the uncertainty in the location estimation system [21]. Authors suggest that MLP is a commonly applicable method for pattern recognition in deep learning technologies. However, the work was implemented in only eight APs and 42 target locations in a building. In [22], MLP and KNN were compared using data collected from a 17 × 10 m2 area of the environment. The system performance was evaluated as a range-free approach in each mobile node by comparing the system performance at each RSS value obtained.
From revised works, the integration of LDA, and MLP in classification and regression schemes was not adapted to accurately localization in the Wi-Fi environments. In this article, we propose to use LDA and MLP to enhance the localization accuracy, and improve computational time complexity in Wi-Fi environments.
3. Experimental Data Acquisition
For this paper, we used real data collected from National Taipei University of Technology (NTUT), found at 25°02′51.94″ N latitude and121°31′54.66″ E longitude. The working environment’s internal structures are illustrated in Figure 1. Data sources are assessed from three buildings: the second teaching building (building-1), the complex building (building-2), and the academic building (building-3) during working times. In the first building, we used four lecture rooms and one lecture hall on the third floor. In building-2, we used two floors (floor 2 and floor 3) having laboratories, meeting halls, and offices. In building-3, lecture rooms and a training room are considered. Each floor has a corridor, gates, and/or exits. The RSS and BSSID values are measured from each AP and stored in the computer, which has the following specifications: ASUS Intel® core i7-6700 Duo CPU @ 3.40 GHz with 16.0 GB RAM. We used the graphical processing unit (GPU) card to handle large numbers of datasets for parallel implementation of the classification and regression schemes.
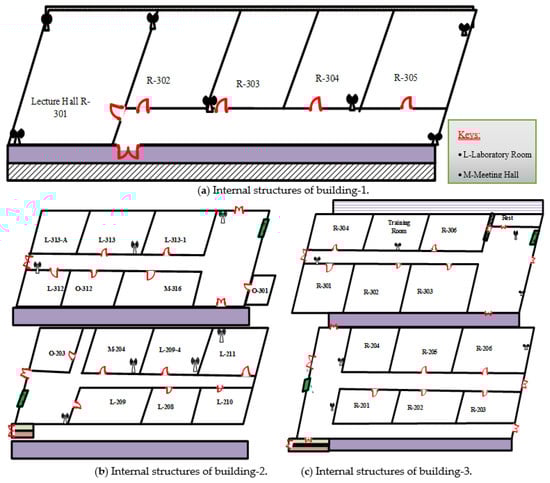
Figure 1.
Structures of the indoor environments.
For data collection, we divide the working environment into 1 m × 1 m grids for manageability of the collected datasets. We also select a 1 m distance between grids to collect more Wi-Fi signals and to make the proposed system adapt easily signal fluctuations through distance. The majority of the experimental works for data collection in indoor environments are done between 1 m × 1 m to 2.5 m × 2.5 m grids. In [1], authors compared the performance of their proposed method at 1 m × 1 m, 1 m × 2 m, 1 m × 1.5 m, 2 m × 2 m, and 2 m × 2.5 m grids. They assured that data collected from 1 m × 1 m grids helps to achieve better localization accuracy with errors less than 1 m compared to others. Authors of [4] used 1.8 m × 1.8 m grids to collect required data. In [5], authors used 2.5 m × 2.5 m grids. In [6], 1 m × 1 m grids were used for data collection, and accurate results were found. In [23], data was collected in 1.7 m × 1.7 m grids experimentally.
The datasets are collected through experiment in a real-world environment. From each grid, we collected 35 RSS values through 5-s intervals, periodically. Discussions in [24,25] showed that using numerous signal values at each grid helps to make the machine easily adapt to the Wi-Fi signal fluctuations. During RSS collections, we also record BSSIDs, which help to identify the RSS values uniquely. BSSID is the Media Access Control (MAC) address of the AP. A total of 36,660 RSS values and 36,660 BSSIDs are recorded from 1047 grids. In the data collection stage, the APs are not moved or changed from their original locations. We used smartphones for data collection in each grid, because it is easy and more available.
Since the working environment consists of multiple buildings, and each building has different services, users in different rooms can use both private and public Wi-Fi network services. Public AP locations are determined by the university. There are also private APs that are controlled by individuals in offices or laboratories. Usually the private APs are placed in the room, while the public APs are placed in corridors for laboratories and offices. In the lecture halls and lecture rooms, we observed that the APs are seated inside, as well as outside, the room. The use of numbers of APs is because of the complexity of the building and numbers of users. For this work, we used all reachable APs for data collection purposes to make the system is inclusive. Additionally, we used our own APs deployed in selected locations as shown in Figure 1. Wi-Fi users in different rooms or classes are not restricted as the nature of Wi-Fi is unlimited, except for assigning the private password to protect Wi-Fi usage from the APs.
In the data collection stage, we use seven APs from predefined locations, and the other reachable APs are used from unknown locations because, in real-world situations, specifically in complex and hierarchical buildings, it is difficult to know all of the APs’ location. However, signals from unknown locations may be important. During data collection, we have seen that there are up to 53 reachable APs. Hence, considering APs from unknown locations is very important to obtain important information. The RSS values and BSSIDs are the collected features, and the X-Y coordinates are Wi-Fi users’ locations that are recorded during data collection. Table 1 indicates the structure of the recorded database containing the ranges of RSS values and the corresponding BSSIDs, and the position of the collecting grids.

Table 1.
Dataset structure.
At the beginning, the scanned database is recorded in the form of [(, …….…), (……………..), (,)], where (, …….…) indicates the RSS values from to at record k ≤ N, (……………..) are the recorded BSSIDs from to at record k ≤ N, (,) are the locations of where RSSs and the BSSIDs are scanned, p is the number of reachable APs, k indicates the number of records, and i and j indicate the X-coordinate and the Y-coordinate of mobile users. In the experiment, we have seen that p ranges up to 53, and k runs from 1 to 36,660. For each observation, both RSS values and BSSID vectors are recorded from reachable APs in the same orders in each recording. Whenever an AP is unable to reach to the smartphone, the corresponding recording space will be empty. Hence, we preprocessed the data to obtain a complete vector before proceeding with other processes like dimensional reductions and localizing.
4. Proposed System
In this paper, we proposed to use DNN; more specifically, a multilayer perceptron (MLP) algorithm for Wi-Fi-based indoor localization using RSSs and BSSIDs as data sources. The majority of the collected RSS values after the 26th AP have the same value (−100 dBm), and there are large numbers of missing RSS values. Therefore, for this work, we used the first 26 reachable features only. In [26,27], missed values were filled using average values. However, it is unrealistic to represent all missed APs with similar values when there will be more than one missed AP. In [28], the authors used selective APs for localization. However, in this type of approach, it is very difficult to implement whenever larger numbers of APs are missed. Therefore, in our case, we filled the missed RSS values using regression, and then applied LDA for dimensional reductions.
As discussed in [29,30], high dimensionality has problems, such as requiring a large amount of time, high space complexity, and high over-fitting problems. Through appropriate application of dimensionality reduction techniques, it is possible to project a set of high-dimensional vector samples into much lower dimensionality while preserving the relevant global structure information of the data [31]. This also makes it easy to visualize and manipulate the intrinsic structure of the projected samples. According to [30], LDA is used for supervised approaches of dimensional reductions. The main goal of the dimensionality reduction techniques is to reduce the redundant and dependent features by transforming the higher dimensional feature space, which may lead to the curse of dimensionality problem, to a space with lower dimensions. Discussions in [32] suggest that LDA has been used to extract the most discriminative location features by maximizing the between-class scatter under the constraint of keeping within-class scatter value. LDA is fast training approach for dimension reduction, so that it helps to improve computational complexity [31]. According to [30,31], there are two types of LDA technique: class-dependent and class-independent. In class-dependent types, the lower dimensional space is calculated for each class to project its data on it. In this type, there will be a number of projections depending on the numbers of classes, because both eigenvalues and eigenvectors are calculated for each transformation matrix separately. However, class-independent LDA operations are performed by considering each class as a separate class against the other classes in the whole projection. In this type, there will only be one lower dimensional space for all classes. Due to the computational simplicity, we prefer to use the class-independent LDA method.
For the simplicity of our work, we coded the datasets into classes based on different parameters, such as LoS, geographical settlements, and reference point with related RSS samples. For example, a room is considered as one class. A corridor found on a floor having the same structure and same LoS is coded as a class. Therefore, before applying LDA, we divide the datasets into 15 classes. In class representations, each class will be considered as a distinct class alongside the other classes. We used LDA as a preprocessor stage, as it is more appropriate to our datasets and helps to optimize by maximizing the between-class separations, and minimizing within-class variability [29,30]. In the LDA technique, we have calculated the mean of each class, the total mean of the datasets, the between-class matrix, and the within-class matrix step by step, and then we constructed the lower dimensional spaces as a final step. Then, any data can be projected with the final lower dimensional space to find the reduced and simpler vector. We applied LDA according to Equations (1)–(6) to reduce N to M features where M ≤ N. Let the collected RSS values be denoted as , where n is the total number of records, and N is the number of features.
- Separate the RSS values to each class . From larger datasets, we assign each vector to the corresponding class:where r is numbers of records in class , c is the class number (in our case c ε [1,15] and r ≤ n).
- Calculate the mean of each class. This is used to show the effect of features in each class. The computation is done from the assigned data to each class and then, finally, we obtained a 1 × M matrix, where M is the total number of classes. In our case, we have a total of 1 × 15 mean vectors:where is the matrix in class i ε c, is the mean of class c.
- Compute the global mean (µ) of all data (. This is calculated from all datasets:
- Calculate variances of the between-class matrix. This is calculated through computing the distance between the individual class mean and the global mean. This mainly uses lower-dimensional space and maximizes the between-class variance:
- Calculate the variances of the within-class matrix. This is conducted by minimizing the difference between the projected mean and the projected samples of each class, as shown in Equation (5):where is the ith sample in the cth class.
- Construct a transformed matrix by combining Equations (4) and (5):
- Calculate the eigenvalues and eigenvectors of the transformed matrix (W), and then sort the eigenvectors in descending order based on the eigenvalues to select M eigenvectors. M is the number of dimensions of the new feature space (M ≤ N). Feature selections are handled as shown in Figure 2, where the larger variance ratio indicates the more important feature to represent the whole of the features. According to [33], the selected features should contain greater than 90% of the original data content. In our case, the selected features comprise the first top six features, which cover more than 95% of the information of the total features. Hence, our LDA application does not affect the information content of the original data.
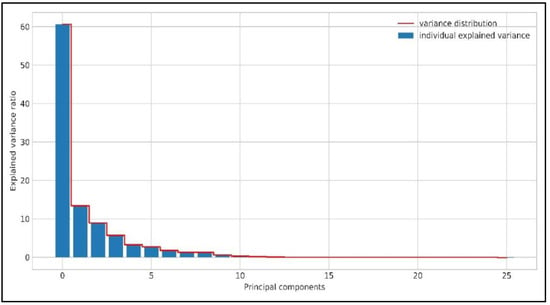 Figure 2. Feature distributions for linear discriminant analysis (LDA)-based feature selections.
 - Transform the original data, , through the lower M-dimensional space. The result will be the selected features that can represent the whole data to apply the proposed system in indoor localizations.
In addition to reduced RSS features, we used 5-BSSIDs having maximum RSS values, because we observed that 5-APs giving the strongest RSS values in a grid are also continuing in a class. Moreover, each BSSID is unique for each AP, and the strength of the RSS values in different classes varies for APs. Hence, the selected BSSIDs help our prediction be more precise.
To evaluate the system performances, the preprocessed data has been divided into training and testing sets through random selection. From the total working locations, 889 grids are used for training, and 158 grids are used for testing in both classification and regression schemes. In each dataset, the corresponding BSSIDs were appended as illustrated in Figure 3. The proposed system, MLP, has an I_365_365_365_365_ structure, where I indicates the input vector, and refers estimated numbers of outputs. Training and testing are operated after LDA-based dimensional reduction is accomplished, and then 5-BSSID values are appended to them.
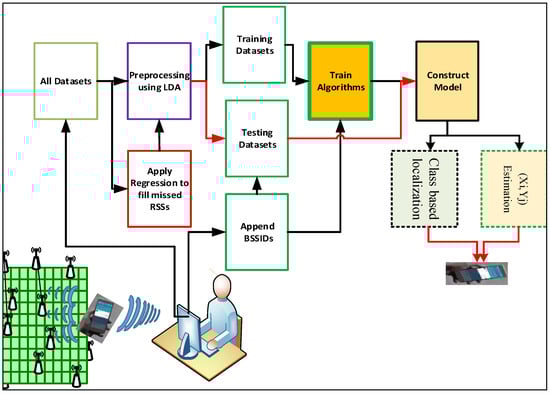
Figure 3.
Proposed system structure.
In the classification scheme, we compared MLP with Support Vector Machine (SVM) and KNN algorithms to evaluate our proposed system’s performance. The comparisons are done in three scenarios: using original datasets (Scenario 1), reduced features only (Scenario 2), and reduced data having appended BSSIDs (Scenario 3). To carry out the proposed system, we used the Python 3.6 programming language with the Tensorflow framework because of the ease of use of the language for the researchers.
For coordinate-based localizations, errors are computed as root mean square errors (RMSE), and error distributions in each testing point are also shown graphically. The RMSE is mathematically calculated by Equation (7):
where and are the real and estimated distance at the ith testing point, respectively, and k is the number of tested points. The error at each distinct testing point is evaluated in terms of position estimation errors by Equation (8):
where is proposed system’s estimated error, and are the ith actual and estimated X-coordinates, and and are the corresponding jth actual and estimated Y-coordinates, respectively. The test results and extensive explanations are given in Section 5.
5. Results and Discussions
In this section, we conduct simulations in both classification and regression schemes to analyze the performance of the proposed algorithm. The simulation is done using real data collected from a wireless environment. In the classification scheme, we compared MLP performances with SVM and KNN algorithms in different scenarios; more specifically, we used original datasets (Scenario 1), reduced feature only (Scenario 2), and reduced data having appended 5-BSSID features (Scenario 3). In the regression scheme, testing is performed in similar scenarios to prove the effectiveness of the proposed approach.
Table 2 shows the localization performance in the classification scheme at different scenarios. The result shows that localization accuracies in Scenario 1 are 82.10%, 90.11%, and 93.67% using KNN, SVM-polynomial (SVM-poly), and MLP classifiers, respectively. The localization accuracies in Scenario 2 are 92.17%, 95.63%, and 98.00% using KNN, SVM-poly, and MLP, respectively. The whole algorithms’ localization accuracies are improved in Scenario 2 than in Scenario 1, since LDA resolved outliers and removed noise to localize accurately. In Scenario 3, the localization accuracy of MLP is highly improved, with splendid accuracy. MLP offers 99.15% localization accuracy. Thus, the location errors are improved on the projected data vector with appended BSSIDs. The performance of SVM-poly is also improved, while it is lower compared to MLP. The reason MLP outperforms in each scenario is due to the high learning endurances in large and complex datasets than others. Moreover, MLP outperforms with better localization accuracy than KNN and SVM-poly because it has a nonlinear activation function to easily operate and understand nonlinear datasets.
Table 2.
Localization performance through classification.
Therefore, the results in Table 2 show that the proposed approach has better localization accuracy, as it integrates reduced data and selected BSSIDs since LDA helps to remove noise and other irrelevant information, and makes the complex datasets simpler to operate. Additionally, BSSIDs give additional information about each class to enhance the localization accuracy. BSSIDs help to easily differentiate each class whenever there will be similar signal distribution in different locations. Generally, MLP offers maximum accuracy compared to KNN and SVM-poly in the proposed data types, because MLP is more flexible with respect to accurate localization of datasets with complex natures.
Table 3 shows the computational complexity comparisons of classier algorithms in different scenarios. The results clearly show that it is possible to improve computational time complexity of MLP using the LDA algorithm. The computational times of MLP in each scenario are better than other algorithms, since the data nature is not linear, so that computing localization using KNN and SVM-poly is more difficult than using the MLP algorithm. After LDA is applied, the computational times are improved in each algorithm.
Table 3.
Classification-based computational complexities.
In Table 4, the MLP performances in three scenarios are presented. The MLP performance shows that there are variations of accuracies in various scenarios. The accuracies are evaluated in the range performances at each scenario. The MLP achieves 51.00%, 59.72%, and 93.10% for errors less than 0.90 m in Scenario 1, Scenario 2, and Scenario 3, respectively. Their localization accuracies also achieve 48.61%, 38.89, and 75% for errors less than 0.75 m in Scenario 1, Scenario 2, and Scenario 3, respectively. For errors less than 0.5 m, the proposed system localizes 23.61% in Scenario 1, 19.44% in Scenario 2, and 50% in Scenario 3. MLP performs 2.75% in Scenario 1, 11.11% in Scenario 2, and 29.17% in Scenario 3 for estimation errors less than 0.25 m. These differences in the results show that the system learning rates highly depend on the quality of the input features. From each scenario, MLP provides better localization accuracy at Scenario 3 in each localization range. The RMSE also indicates that MLP performs better in Scenario 3 than in the other scenarios.
Table 4.
Regression-based localization accuracies.
Figure 4 presents the mean, maximum, and minimum estimation error of MLP in three scenarios. The maximum errors of the proposed method are 1.29 m, 1.22 m, and 0.98 m in Scenario 1, Scenario 2, and Scenario 3, respectively. Moreover, the minimum localization error is 0.12 m for the first two scenarios, while it is 0.01 m in the third scenario. The error mean of the proposed algorithm in Scenario 3 is lower than in Scenario 1 and Scenario 2, as illustrated in Figure 4. The majority of the error distributions in the first two scenarios are also much greater than the mean values of the proposed method in Scenario 3. However, the majority of localization errors of the proposed method in Scenario 3 are lower than 0.7 m, which is a motivated performance compared to other scenarios. The errors also changed slowly in the third scenario, because most of the errors range between 0.2 and 0.7 m. The RMSE and the mean of estimation errors are also smaller in Scenario 3 than in Scenario 1 and Scenario 2.
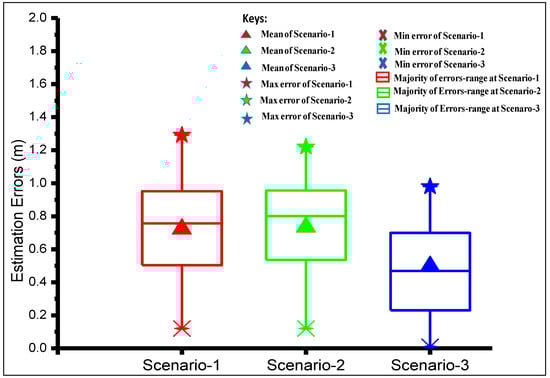
Figure 4.
Multilayer perceptron (MLP) localization performance in different scenarios.
As shown in Table 5, the computational time of MLP in Scenario 2 and Scenario 3 are better than Scenario 1, since LDA reduced complex features into simpler features. Additionally, the appended BSSIDs help to provide extra information without affecting computational time. In general, the training stage of regression scheme required high computational time, while the testing stage needs very little computational time, and is relatively straightforward.
Table 5.
Regression-based computational complexity.
The proposed method shows that it can be applied in indoor environments to provide better and steady localization accuracy. Applying LDA for feature reduction and the appended BSSIDs having the five strongest RSS values help the proposed algorithm achieve the best localization accuracies. Additionally, collecting numbers of signal values from a 1 m by 1 m grid helps the proposed system adapt to the environment easily for better localization. Filling the missed RSS values using regression is also used to improve localization performances, rather than filling them manually.
Above all, the MLP network outperforms with respect to indoor localization accuracy because of tuning with back-propagation, which helps to update the widespread, and control overfitting problems. MLP has several parameters or features that could be updated according to the nature of the data [34]. MLP also has good performance in pattern recognition in deep and complex studies. The projected data from complex to lower dimensions can be more easily understood by MLP than KNN and SVM-poly because MLP has a nonlinear activation function over the others. Therefore, MLP can distinguish data that is not linearly separable, easily using its nonlinear activation function. Moreover, MLPs are fully connected so that each node in one layer connects with the following nodes with a certain weight , which allows MLP to learn better.
Generally, the simulation result shows that the proposed technique can provide accurate indoor localization in complex and hierarchical environments. The results also indicate that the location estimation errors changed very calmly between consecutive tested points, due to the superior robustness of MLPs in uncertain, as well as complex, situations.
6. Conclusions and Future Works
In this paper, DNN-based indoor localization schemes are presented. We use LDA for preprocessing the RSS data sources, and then BSSIDs having the five strongest RSS values were appended with filtered RSS values for training and testing. The proposed system is evaluated with respect to classification- and regression-based indoor localization. Our proposed method is also compared with KNN and SVM-Poly in different scenarios to evaluate its localization accuracy. The proposed system has 99.15% localization accuracy with respect to the classification scheme. For regression-based localization, 100% of the estimation accuracy has an error less than 0.98 m in the proposed approach. Additionally, our method was performed with lower error mean and variance, which implies the error distributions in each set of testing points are low and slow. The computational time complexities are also improved in the proposed method, compared to other algorithms, in each scenario. Thus, the integration of MLP and LDA gives state-of-the-art performance on indoor localization in hierarchical and multi-buildings environments. For indoor localization, LDA jointly working with kernel methods is proposed as a future work, since the datasets transformed into a projection function may not be always linear. The application of a DNN for indoor-outdoor localization using an unmanned aerial vehicle in urban areas is also a potential future work.
Author Contributions
A.B.A. contributed to the performance of the experiment, analyzed the data, wrote the program, and wrote the manuscript. H.-P.L. suggested the problem, gave suggestions, and gave full instructions regarding the work. G.B.T performed the experiment, and wrote the program with A.B.A. S.-S.J. collected related references and gave comments. Finally, all mentioned authors read and approved the final version of the manuscript.
Funding
This research was funded by Ministry of Science and Technology (MoST) in Taiwan (Grant No: 107-2634-F-009-006).
Acknowledgments
This research is partially supported by Ministry of science and Technology, Taiwan government 2018.
Conflicts of Interest
The authors declare no conflict of interest.
References
- Moreno-Cano, M.V.; Zamora-Izquierdo, M.A.; Santa, J.; Skarmeta, A.F. An indoor localization system based on artificial neural networks and particle filters applied to intelligent buildings. Neucomputing 2013, 122, 116–125. [Google Scholar] [CrossRef]
- Macagnano, D.; Destino, G.; Abreu, G. Indoor positioning: A key enabling technology for IoT applications. In Proceedings of the 2014 IEEE World Forum on Internet of Things (WF-IoT), Seoul, Korea, 6–8 March 2014; IEEE: Piscataway, NJ, USA, 2014; pp. 117–118. [Google Scholar] [CrossRef]
- Bozkurt, S.; Elibol, G.; Gunal, S.; Yayan, U. A Comparative Study on Machine Learning Algorithms for Indoor Positioning. In Proceedings of the 2015 International Symposium on Innovations in Intelligent SysTems and Applications (INISTA), Madrid, Spain, 2–4 September 2015; IEEE: Piscataway, NJ, USA, 2015; pp. 1–8. [Google Scholar] [CrossRef]
- Zhang, W.; Liu, K.; Zhang, W.; Zhang, Y.; Gu, J. Deep neural networks for wireless localization in indoor and outdoor environments. Neucomputing 2016, 194, 279–287. [Google Scholar] [CrossRef]
- Cheng, Y.K.; Chou, H.J.; Chang, R.Y. Machine-Learning Indoor Localization with Access Point Selection and Signal Strength Reconstruction. In Proceedings of the 2016 IEEE 83rd Vehicular Technology Conference (VTC Spring), Nanjing, China, 15–18 May 2016; IEEE: Piscataway, NJ, USA, 2016; pp. 1–5. [Google Scholar] [CrossRef]
- Mehmood, H.; Tripathi, N.K.; Tipdecho, T. Indoor positioning system using artificial neural network. J. Conput. Sci. 2010, 6, 1219–1225. [Google Scholar] [CrossRef]
- Paul, A.K.; Sato, T. Localization in Wireless Sensor Networks: A Survey on Algorithms, Measurement Techniques, Applications and Challenges. J. Sens. Actuator Netw. 2017, 6, 24. [Google Scholar] [CrossRef]
- Yassin, A.; Nasser, Y.; Awad, M.; Al-Dubai, A.; Liu, R.; Yuen, C.; Raulefs, R.; Aboutanios, E. Recent advances in indoor localization: A survey on theoretical approaches and applications. IEEE Commun. Surv. Tutor. 2016, 19, 1327–1346. [Google Scholar] [CrossRef]
- Kim, K.S.; Wang, R.; Zhong, Z.; Tan, Z.; Song, H.; Cha, J.; Lee, S. Large-scale location-aware services in access: Hierarchical building/floor classification and location estimation using Wi-Fi fingerprinting based on deep neural networks. Fiber Integr. Opt. 2018, 1–13. [Google Scholar] [CrossRef]
- Nowicki, M.; Wietrzykowski, J. Low-Effort Place Recognition with Wi-Fi Fingerprints Using Deep Learning. In International Conference Automation; Springer: Cham, Switzerland, 2017; pp. 575–584. [Google Scholar] [CrossRef]
- Chen, C.S. Artificial neural network for location estimation in wireless communication systems. Sensors 2012, 12, 2798–2817. [Google Scholar] [CrossRef] [PubMed]
- Zargoun, F.; Henawy, I.M.; Ziedan, N.I. Effects of Walls and Floors in Indoor Localization Using Tracking Algorithm. Int. J. Adv. Comput. Sci. Appl. 2016, 7, 34–39. [Google Scholar] [CrossRef]
- Ezpeleta, S.; Claver, J.M.; Pérez-Solano, J.J.; Martí, J.V. Rf-based location using interpolation functions to reduce fingerprint mapping. Sensors 2015, 15, 27322–27340. [Google Scholar] [CrossRef] [PubMed]
- Goodfellow, I.; Bengio, Y.; Courville, A.; Bengio, Y. Deep Learning, 1st ed.; MIT Press: Cambridge, MA, USA, 2016; pp. 1–775. ISBN 978-0262035613. [Google Scholar]
- Wang, X.; Gao, L.; Mao, S.; Pandey, S. DeepFi: Deep learning for indoor fingerprinting using channel state information. In Proceedings of the 2015 IEEE Wireless Communications and Networking Conference (WCNC), New Orleans, LA, USA, 9–12 March 2015; pp. 1666–1671. [Google Scholar] [CrossRef]
- Kim, K.S.; Lee, S.; Huang, K. A scalable deep neural network architecture for multi-building and multi-floor indoor localization based on Wi-Fi fingerprinting. Big Data Anal. 2018, 3, 4. [Google Scholar] [CrossRef]
- Moreira, A.; Nicolau, M.J.; Meneses, F.; Costa, A. Wi-Fi fingerprinting in the real world-RTLS@ UM at the EvAAL competition. In Proceedings of the International Conference on Indoor Positioning and Indoor Navigation (IPIN), Banff, AB, Canada, 13–16 October 2015; pp. 1–10. [Google Scholar] [CrossRef]
- Wang, X.; Gao, L.; Mao, S.; Pandey, S. CSI-based fingerprinting for indoor localization: A deep learning approach. IEEE Trans. Veh. Technol. 2017, 66, 763–776. [Google Scholar] [CrossRef]
- Tapia, D.I.; Bajo, J.; De Paz, J.F.; Alonso, R.S.; Rodríguez, S.; Corchado, J.M. Using multi-layer perceptrons to enhance the performance of indoor RTLS. In Proceedings of the Progress in Artificial Intelligence Workshop: EPIA 2011, Lisbon, Portugal, 10–13 October 2011; ISBN 978-989-95618-4-7. [Google Scholar]
- Vaghefi, S.Y.M.; Vaghefi, R.M. A novel multilayer neural network model for TOA-based localization in wireless sensor networks. In Proceedings of the 2011 International Joint Conference on Neural Networks (IJCNN), San Jose, CA, USA, 31 July–5 August 2011; IEEE: Piscataway, NJ, USA, 2011; pp. 3079–3084. [Google Scholar] [CrossRef]
- Ahmad, U.; Gavrilov, A.; Lee, S.; Lee, Y.K. Modular multilayer perceptron for WLAN based localization. In Proceedings of the 2006 IEEE International Joint Conference on Neural Network Proceedings, Vancouver, BC, Canada, 16–21 July 2006; IEEE: Piscataway, NJ, USA, 2006; pp. 3465–3471. [Google Scholar] [CrossRef]
- Dakkak, M.; Daachi, B.; Nakib, A.; Siarry, P. Multi-layer perceptron neural network and nearest neighbor approaches for indoor localization. In Proceedings of the 2014 IEEE International Conference on Systems, Man, and Cybernetics (SMC), San Diego, CA, USA, 5–8 October 2014; IEEE: Piscataway, NJ, USA, 2014; pp. 1366–1373. [Google Scholar] [CrossRef]
- Celik, G.; Celebi, H.; Partal, H.P.; Zeydan, E.; Karatepe, I.A.; Er, A.S. An experimental study of indoor RSS-based RF fingerprinting localization using GSM and Wi-Fi signals. Turk. J. Electr. Eng. Comput. Sci. 2017, 25, 2727–2736. [Google Scholar] [CrossRef]
- Belay, A.; Yen, L.; Renu, S.; Lin, H.P.; Jeng, S.S. Indoor localization at 5GHz using Dynamic machine learning approach (DMLA). In Proceedings of the 2017 International Conference on Applied System Innovation (ICASI), Sapporo, Japan, 13–17 May 2017; pp. 1763–1766. [Google Scholar] [CrossRef]
- Feng, C.; Au, W.S.A.; Valaee, S.; Tan, Z. Compressive sensing based positioning using RSS of WLAN access points. In Proceedings of the 2010 Proceedings IEEE INFOCOM, San Diego, CA, USA, 14–19 March 2010; pp. 1–9. [Google Scholar] [CrossRef]
- Maneerat, K.; Kaemarungsi, K.; Prommak, C. Robust Floor Determination Algorithm for Indoor Wireless Localization Systems under Reference Node Failure. Mob. Inf. Syst. 2016, 2016, 4961565. [Google Scholar] [CrossRef]
- Laoudias, C.; Michaelides, M.P.; Panayiotou, C.G. Fault tolerant positioning using WLAN signal strength fingerprints. In Proceedings of the 2010 International Conference on Indoor Positioning and Indoor Navigation, Zurich, Switzerland, 15–17 September 2010; pp. 1–8. [Google Scholar] [CrossRef]
- Jeon, S.; Jeong, J.P.; Suh, Y.J.; Yu, C.; Han, D. Selective AP probing for indoor positioning in a large and AP-dense environment. J. Netw. Comput. Appl. 2017, 99, 47–57. [Google Scholar] [CrossRef]
- Tao, D.; Li, X.; Wu, X.; Maybank, S.J. General tensor discriminant analysis and gabor features for gait recognition. IEEE Trans. Pattern Anal. Mach. Intell. 2007, 29, 1700–1715. [Google Scholar] [CrossRef] [PubMed]
- Tharwat, A.; Gaber, T.; Ibrahim, A.; Hassanien, A.E. Linear discriminant analysis: A detailed tutorial. AI Cummun. 2017, 30, 169–190. [Google Scholar] [CrossRef]
- Lopez-de-Teruel, P.E.; Canovas, O.; Garcia, F.J. Using dimensionality reduction techniques for refining passive indoor positioning systems based on radio fingerprinting. Sensors 2017, 17, 871. [Google Scholar] [CrossRef] [PubMed]
- Deng, Z.A.; Xu, Y.; Chen, L. Localized local fisher discriminant analysis for indoor positioning in wireless local area network. In Proceedings of the 2013 IEEE Wireless Communications and Networking Conference (WCNC), Shanghai, China, 7–10 April 2013; pp. 4795–4799. [Google Scholar] [CrossRef]
- Alpaydin, E. Introduction to Machine Learning, 2nd ed.; The MIT Press: Cambridge, MA, USA; London, UK, 2014; pp. 1–527. ISBN 978-0-262-01243-0. [Google Scholar]
- Souza, F.A.; Araújo, R.; Matias, T.; Mendes, J. A multilayer-perceptron based method for variable selection in soft sensor design. J. Process Control 2013, 23, 1371–1378. [Google Scholar] [CrossRef]
© 2018 by the authors. Licensee MDPI, Basel, Switzerland. This article is an open access article distributed under the terms and conditions of the Creative Commons Attribution (CC BY) license (http://creativecommons.org/licenses/by/4.0/).