1. Introduction
The excellent performance of cement-treated aggregate mixture (CTAM) in terms of, for example, workability, strength, durability and load spreading capacity [
1], makes it widely used in China [
2], Netherlands [
3], Egypt [
4], Spain [
5] and Australia [
6], etc. Its properties are greatly influenced by the compaction method and the corresponding level [
7]. On the one hand, the cement dosage and moisture content, which influence the strength and modulus of the mixture, are highly dependent on the compaction method and level [
8]. On the other hand, the in-situ compaction degree is always calculated by the maximum dry density derived from the laboratory compaction.
The Proctor compaction method is commonly used to compact cement-treated material. In different countries, the specific criteria for this method differ significantly in terms of hammer weight, blow number and mold geometry, etc. [
9,
10,
11]. The Proctor test uses impact loads to compact material in a stiff nonyielding mold [
12], which increases the content of fine aggregate [
13]. The vibration compaction method was developed to simulate the in-situ compaction process of CTAM in China. The serious inconsistencies regarding some key parameters such as static pressure, vibrating frequency and eccentric angle make it difficult to be used widely [
14,
15,
16,
17]. In addition, the strong vibration energy during operation may endanger the structural safety of the laboratory, and the vibration noise can have negative effects on the hearing of test operators. With the wide applications of cement-treated materials, such as cement-treated aggregate [
1,
16], cement-treated waste [
2,
18], cement-treated soil [
11], cement-treated recycled material [
19,
20], cement–asphalt-treated material [
21], and cement-treated material with reclaimed asphalt mixture [
9,
17,
22,
23], it is quite necessary to develop an alternative method to design cement-treated mixtures.
Nowadays, the contribution of cement-based materials to sustainability is a topic of study [
24,
25,
26,
27] and as a result, the performance of several additions that could also be suitable for use in cement-treatment materials has been analyzed. This fact also makes it necessary to study new methods for the design of cement-treated mixtures.
In many countries, Superpave gyratory compactors (SGC) have been widely used to design asphalt mixtures [
28], as well as to compact unbound material [
29] and soil [
12,
30]. A compaction curve is automatically drawn in the compaction process, which can be used to evaluate the relative density of the mixture. In addition, a 150 mm-diameter cylindrical mold allows mixtures with maximum particle size over 26 mm to be compacted.
2. Objective and Scope
The objective of this study is to take CTAM as an example of cement-treated materials and to explore the feasibility of using SGC to design CTAM.
Two types of aggregate with different moisture absorptions, referred to as Aggregate A and Aggregate B, were used in this study. The designed level of gyratory compaction was determined by introducing the concept of a locking point, which is equal to the first compaction number when the specimen has the same height in three continuous compaction cycles. By using the design procedure presented in this study, the compaction method and criteria for other cement-treated materials can be easily derived. The aggregate degradation after SGC compaction was then conducted and compared with those under Proctor and vibration compaction. Also, five indexes, including optimal moisture content, maximum dry density, unconfined compressive strength, and dry/temperature shrinkage coefficient, were performed for these three compaction methods. According to the comparison of the results of the above indexes, the feasibility of using SGC to design CTAM and the compaction level determined in this study was evaluated.
3. Materials and Methods
3.1. Materials
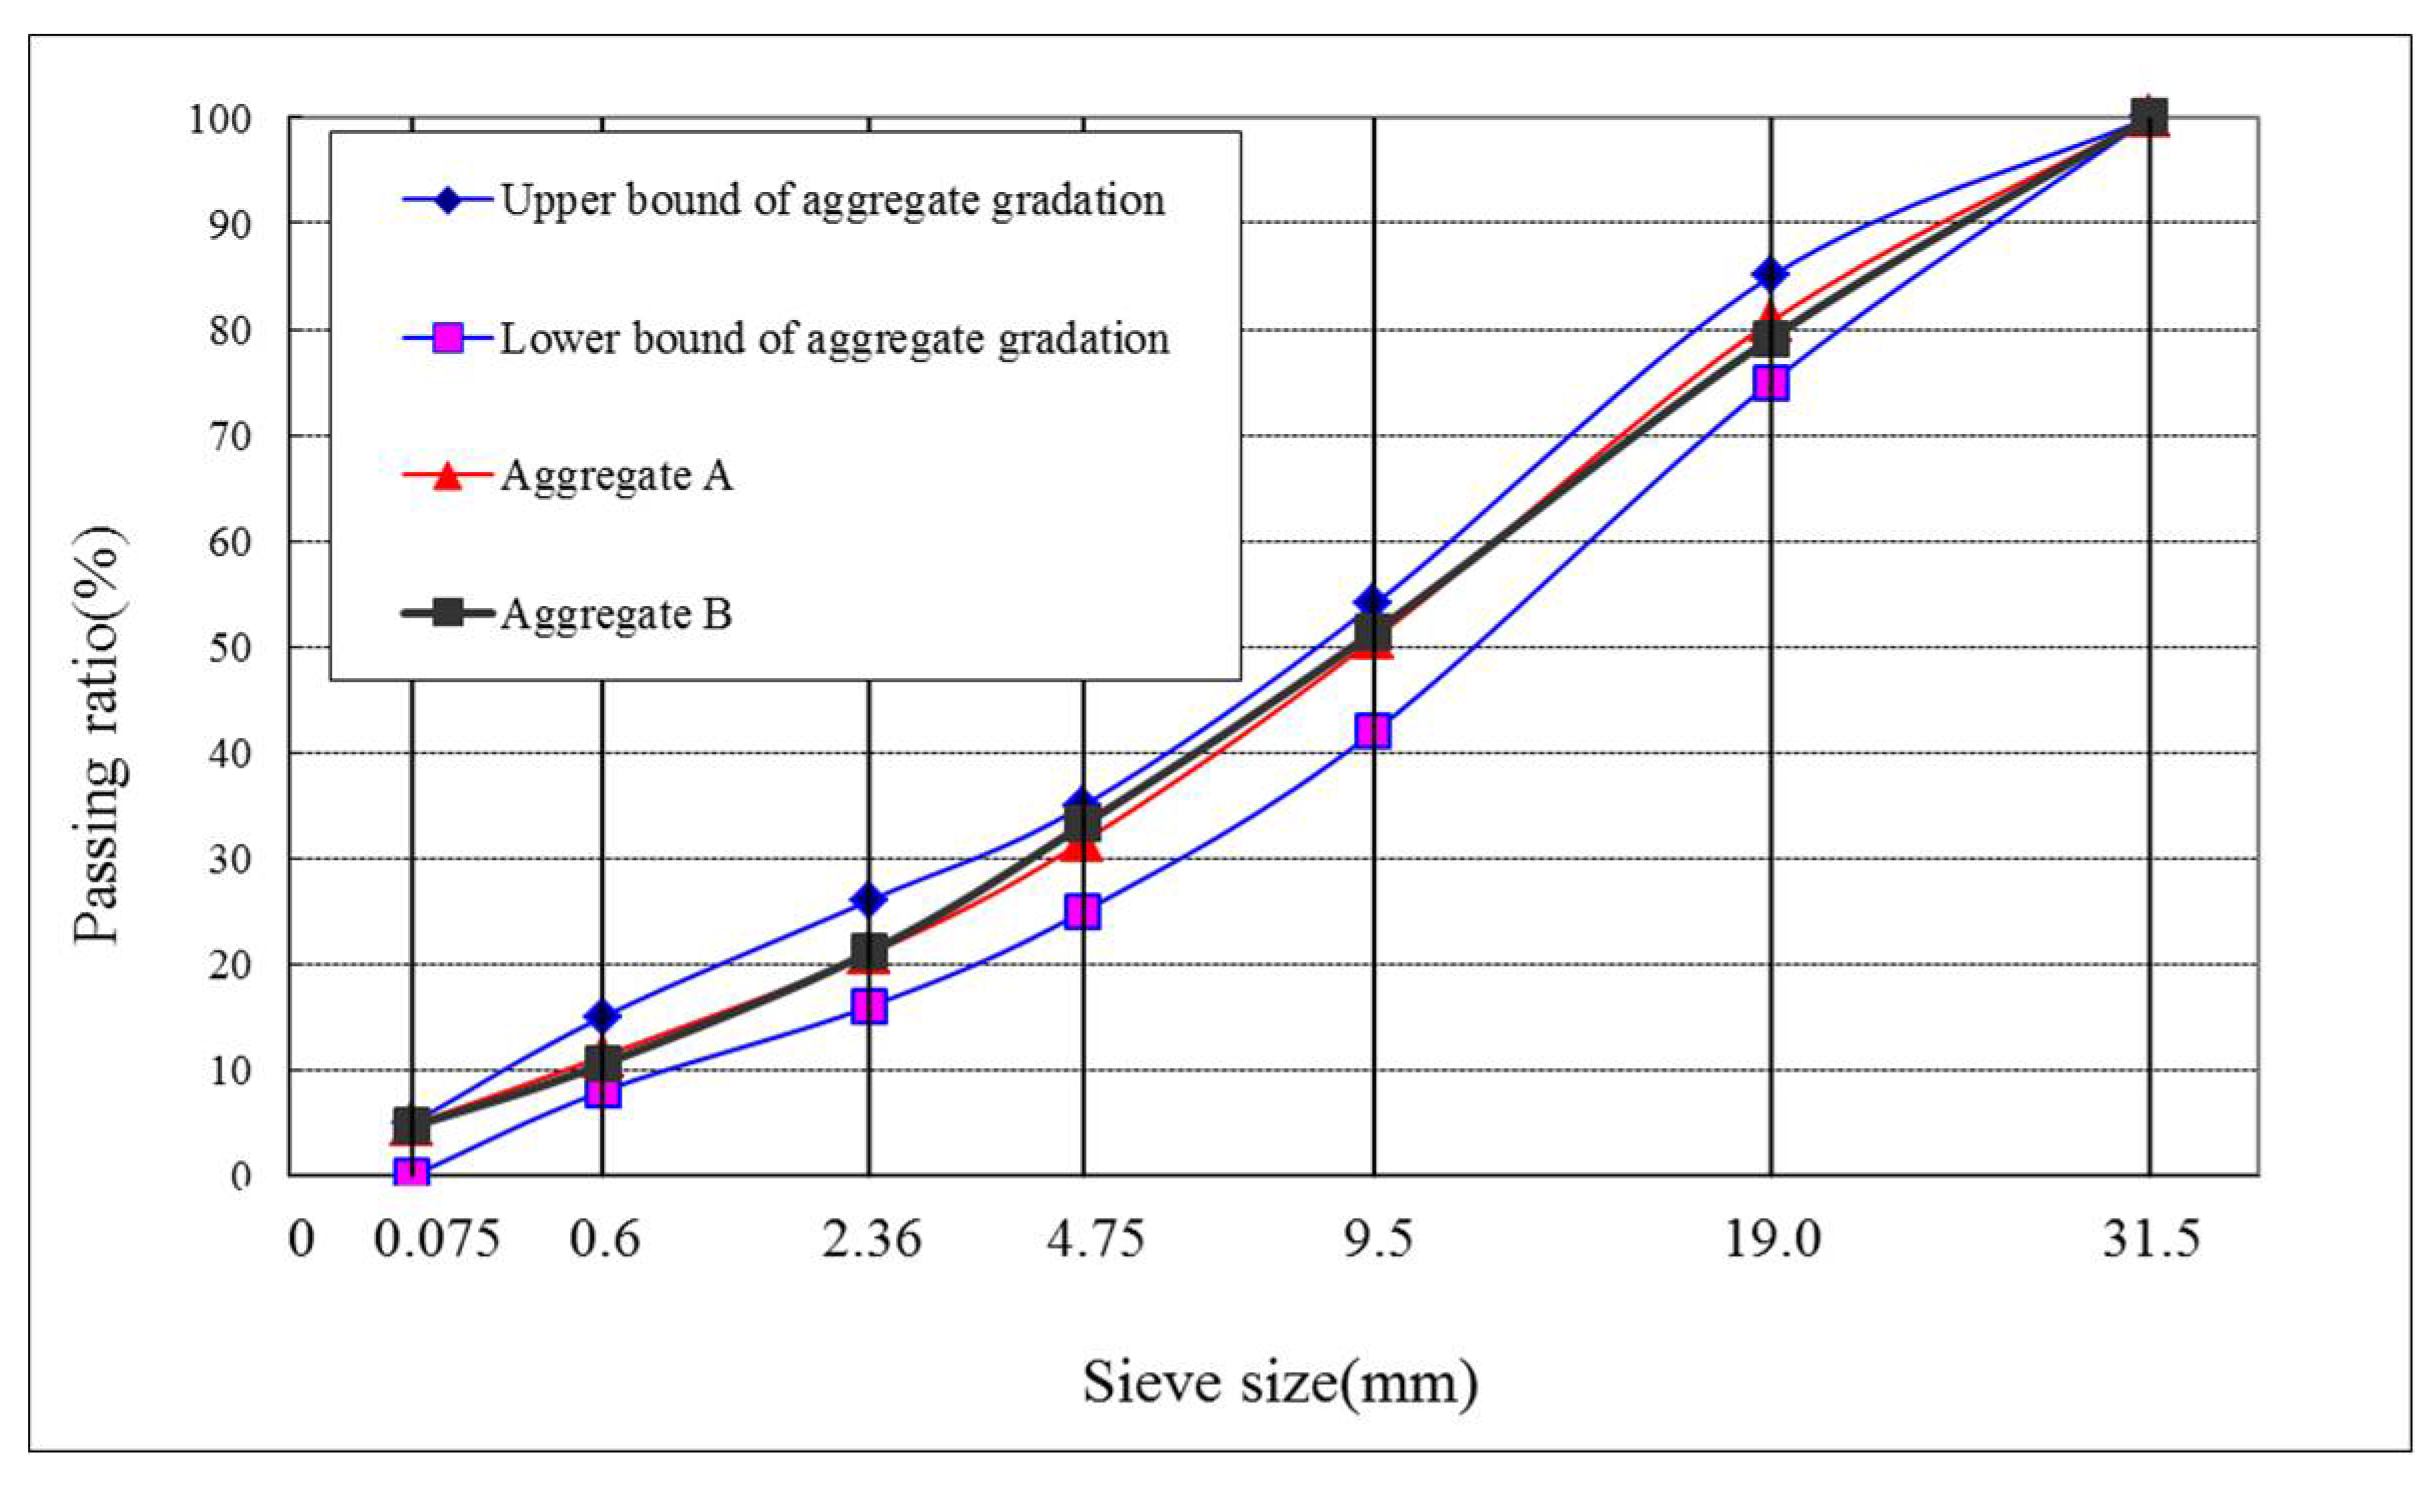
In order to improve the reliability of the test results, two kinds of aggregate that have different air voids were used. The aggregates were made of limestone. The density and moisture absorption are listed in
Table 1, respectively. The gradations of the two kinds of aggregate are shown in
Figure 1. ASTM Type I Ordinary Portland cement was employed in the experiments; the properties are shown in
Table 2.
3.2. Design Indicator
By using the CTAM specimen with the maximum dry density and optimal moisture content, the cement dosage was determined according to the requirement of unconfined compressive strength. Therefore, the maximum dry density and optimal moisture content, which are closely related to the design level, are key indicators for the design of this mixture.
Using the concept of a locking point in the Superpave gyratory compactor can avoid over-compaction and possible damage to the aggregate skeleton [
31]. It was reported that the mixtures designed using a locking point maintained high resistance to permanent deformation and had high durability levels [
32]. Therefore, the locking point was referenced as an alternative to the Superpave N
design.
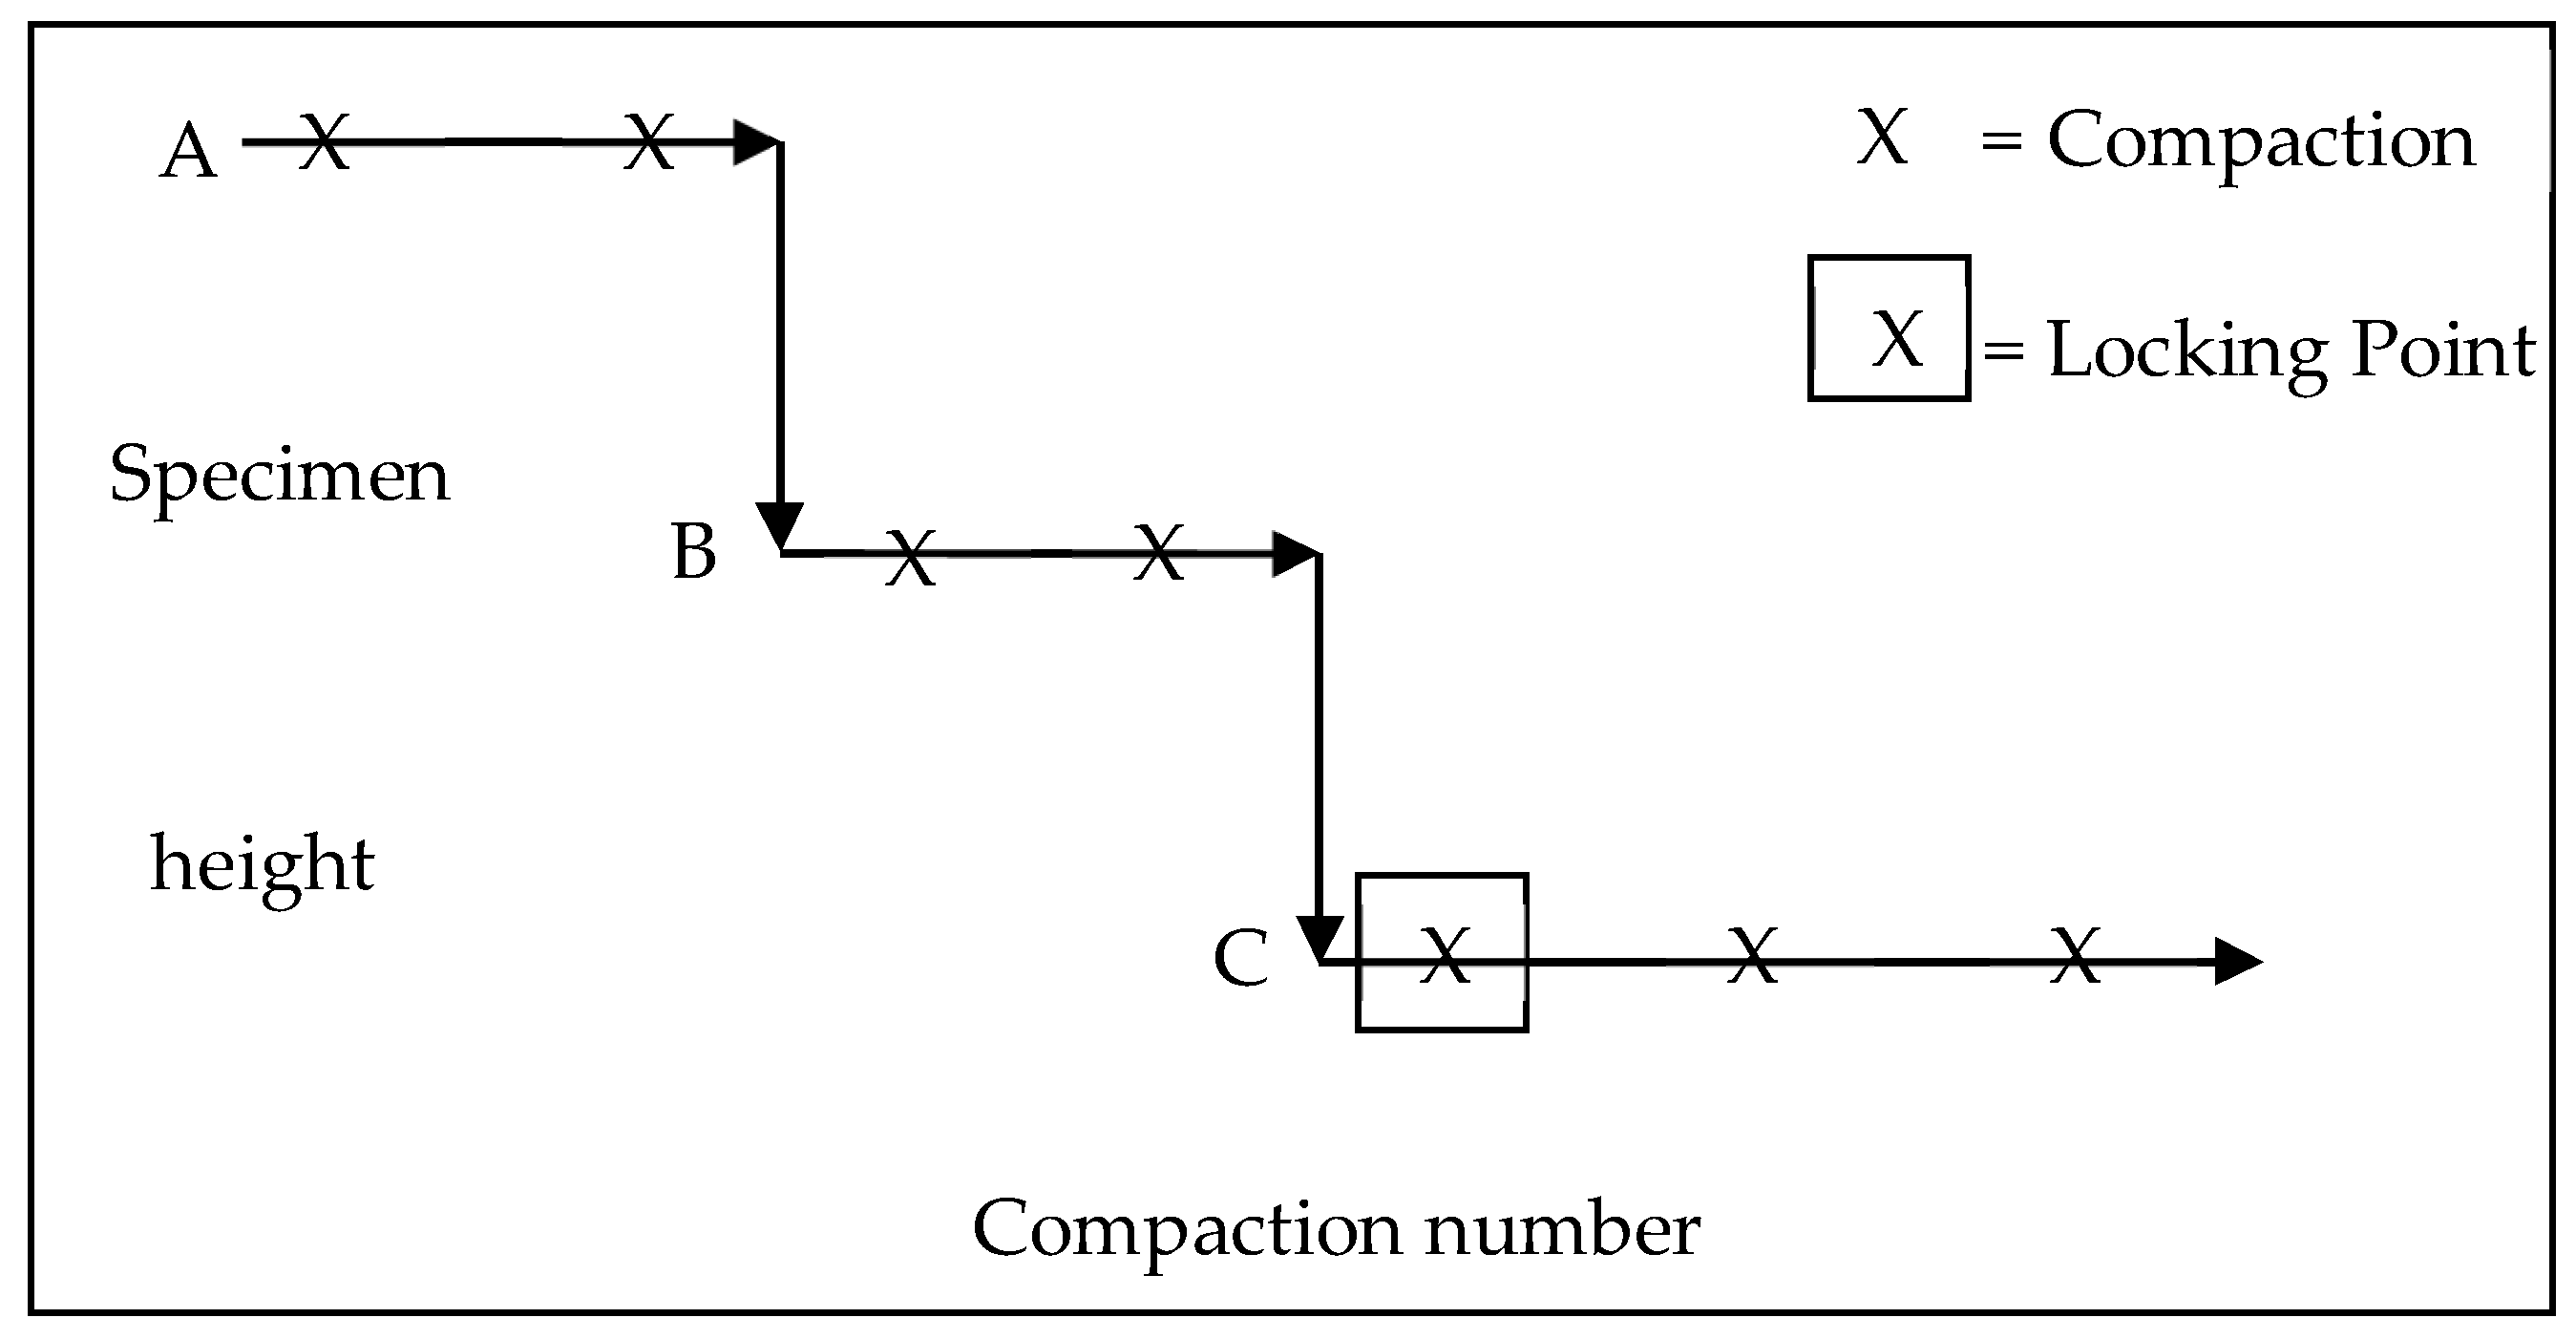
In this paper, the locking point refers to the first compaction number when the specimen has the same height in three continuous compaction cycles. Before the locking point, the specimen must have the same height for two continuous compaction cycles. There was only 0.1 mm difference in specimen height between the processes A and B or the processes B and C. The concept of the locking point is described in
Figure 2.
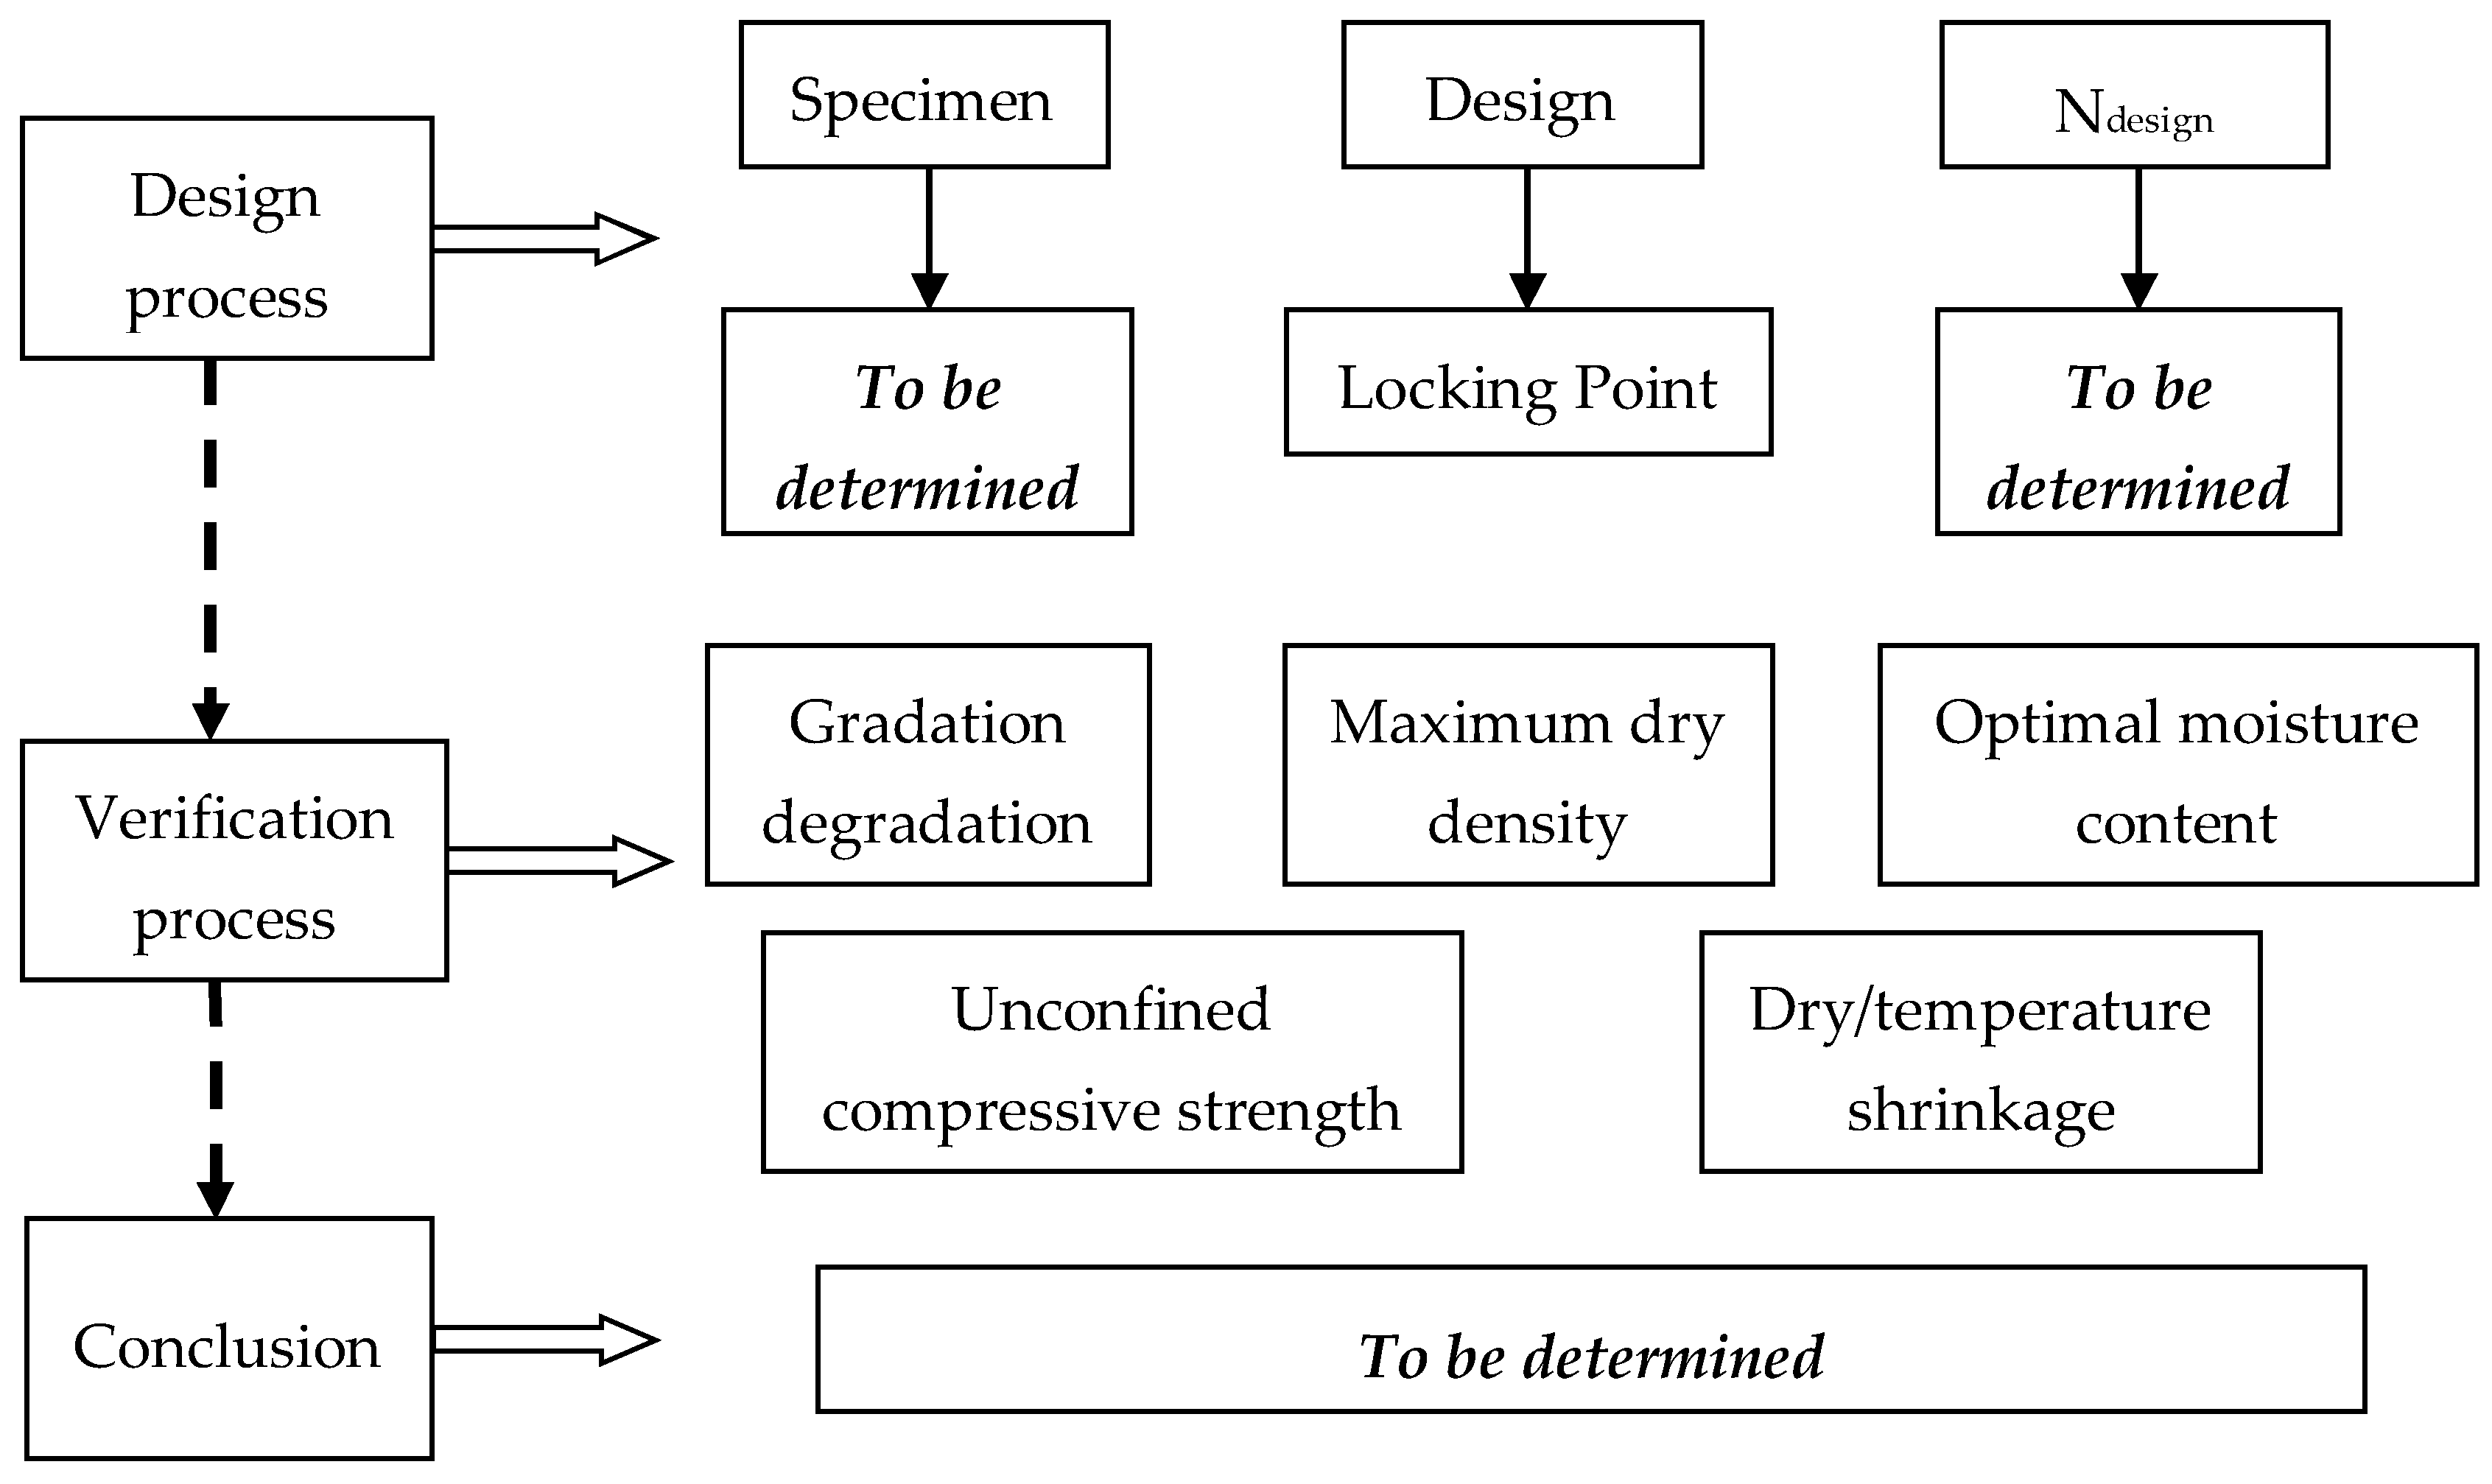
3.3. Research Procedure
In the design process, the specimen height, design indicator and design compaction number N
design were determined. Subsequently, in the verification process, five indexes were conducted, including gradation and degradation, maximum dry density, optimal moisture content, unconfined compressive strength and dry/temperature shrinkage coefficient. The detailed research procedure is shown in
Figure 3.
3.4. Test Methods
3.4.1. Aggregate Degradation
Aggregate particles tend to be crushed under compaction, causing a phenomenon of aggregate degradation. Due to the addition of cement, it is difficult to measure the particles in small sizes. Therefore, the weight of particles with a size over 0.6 mm was measured by washing and drying the compacted mixtures. The degradation of the
ith mesh
Pi was calculated using Equation (1).
where
mib = the weight of the aggregate particles on the
ith mesh before mixture compaction, g; and
mia = the weight of the aggregate particles on the
ith mesh after mixture compaction, g. The positive value means that more aggregate particles on the
ith mesh were crushed and passed this mesh than the aggregate particles larger than the
ith mesh that were crushed and left on the
ith mesh, and vice versa.
3.4.2. Compaction Test
All the aggregates were fully saturated before each compaction test. The Proctor and vibration compaction tests were performed according to the specification of JTG E51-2009 [
14]. The gyration compaction test was performed according to the method determined in
Section 4. By calculating the relationship between the moisture content and dry density, the maximum dry density and the corresponding optimal moisture content of each mixture could be determined.
3.4.3. Dry Shrinkage Test
A total of thirty-six specimens (three compaction methods and two aggregates, i.e., six groups) were cured for seven days under standard conditions (temperature of 20 ± 2 °C and a relative humidity of 95%). For each group of specimens, strain gauges were bonded on the central side surfaces of three specimens, and the other three specimens were used to measure moisture loss. The testing data, including dry shrinkage strain and moisture loss, were recorded at a constant temperature of 40 °C at the time of 0 h, 2 h, 4 h, 6 h, 8 h, 10 h, 12 h, 24 h and 48 h.
The dry shrinkage coefficient was calculated by Equation (2).
where
εi and
εj were the strain values of the
ith and
jth measurement; and
με;
ωi and
ωj were the moisture content of the specimen of the
ith and
jth measurements, %.
3.4.4. Temperature Shrinkage Test
Eighteen specimens (three compaction methods, two aggregates) were cured for 28 days under standard conditions and then completely dried to eliminate the effect of moisture loss on dry shrinkage. This complete dry was selected in agreement with other studies in which testing dried cement-based materials was required [
33,
34,
35]. Strain gauges were pasted on the central side surfaces of these specimens. Temperature shrinkage strain was recorded at the temperatures −15 °C, −5 °C, 5 °C, 15 °C, 25 °C, 35 °C and 45 °C, respectively. The temperature changed at a speed of 1 °C/min.
The temperature shrinkage coefficient was calculated using Equation (3).
where
εi and
εj were the strain values of the
ith and
jth measurement; and
με;
ti and
tj were the temperature of the
ith and
jth measurements, °C.
4. Results and Discussion
4.1. Determination of the Design Compaction Level
4.1.1. Determination of Specimen Weight
It is necessary to specify a certain mixture weight in a mold or a specimen height, because the compaction energy applied to the specimen is not uniformly distributed [
36], resulting in some differences in mixture performance in the height direction [
37].
To test hot mix asphalt, AASHTO T312 specifies placing 4500 g to 4700 g of asphalt mixture into the gyratory mold in one lift [
38]. Supposing the Marshall density of the asphalt mixture to be 2.45 g/cm
3, the ultimate height of the asphalt mixture specimen was calculated to be approximately 108 mm. Therefore, the SGC specimen height was controlled at 110 mm to reduce the vertical difference of the compaction energy.
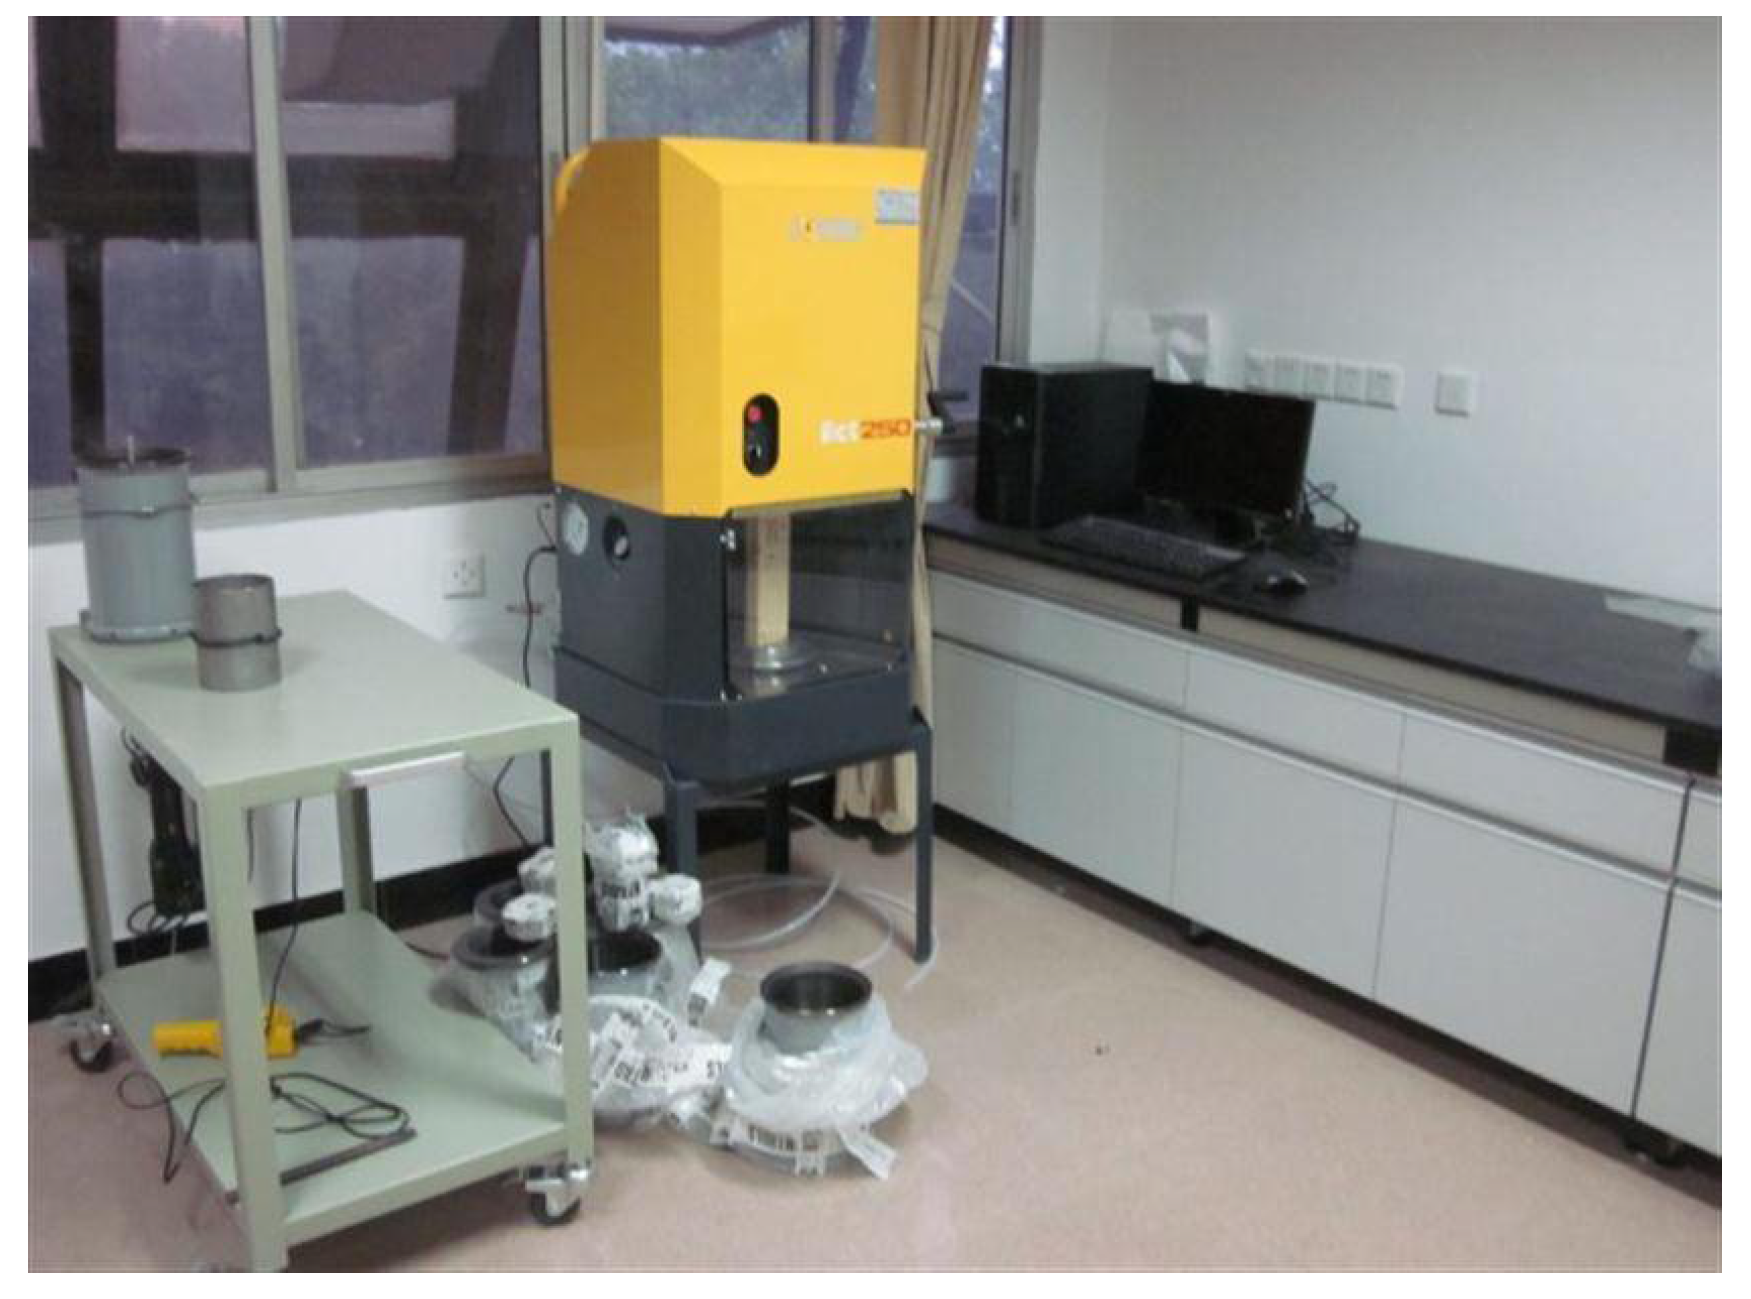
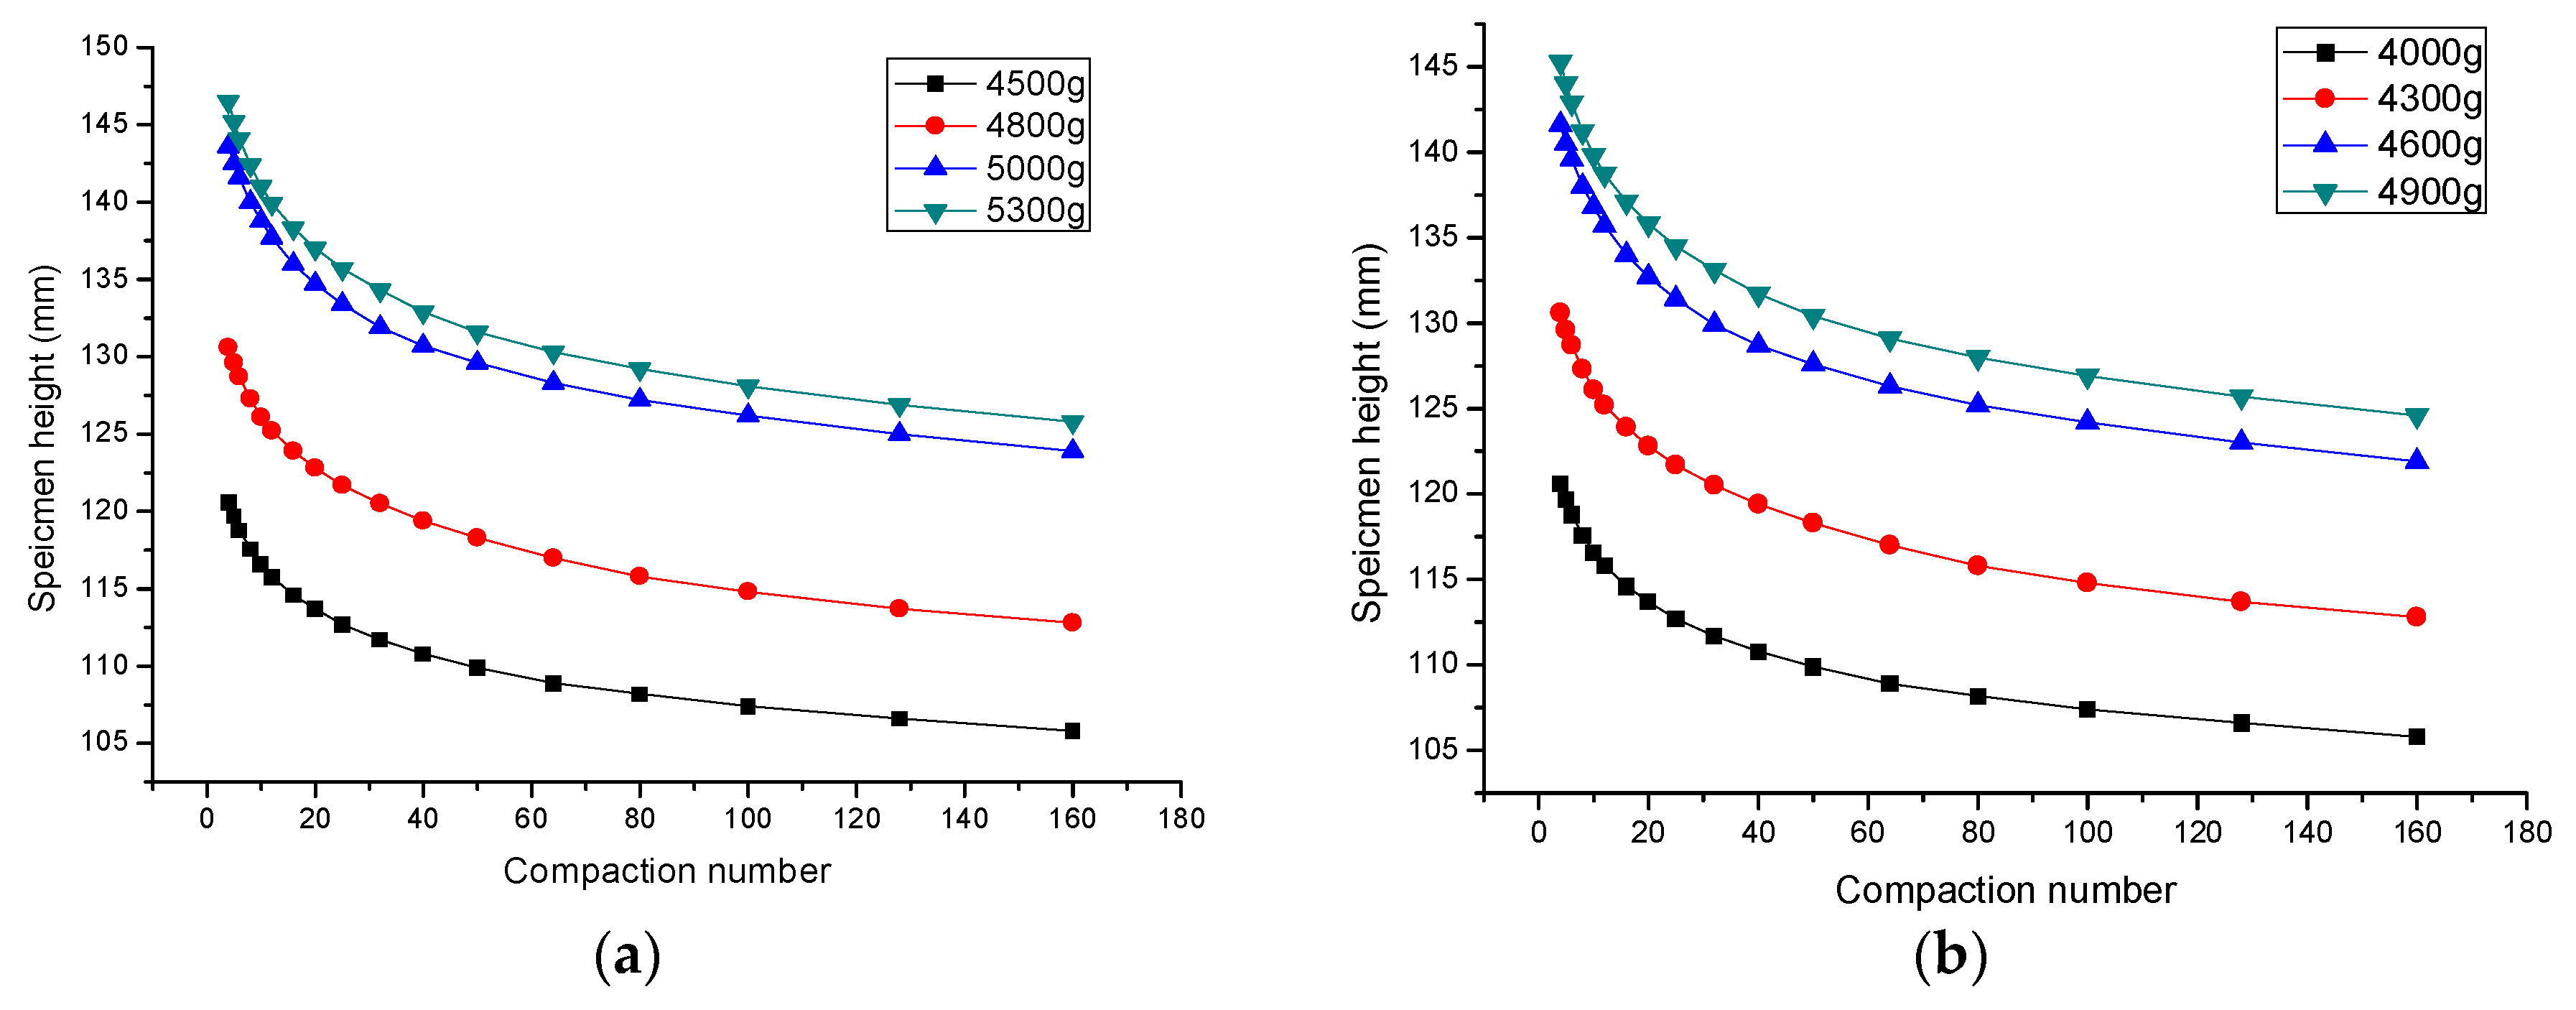
The mixtures of Aggregate A with different weights were compacted for 160 cycles by SGC (TB-047/02 CONTROLS, made in Italy (
Figure 4)). The compaction curves are shown in
Figure 5.
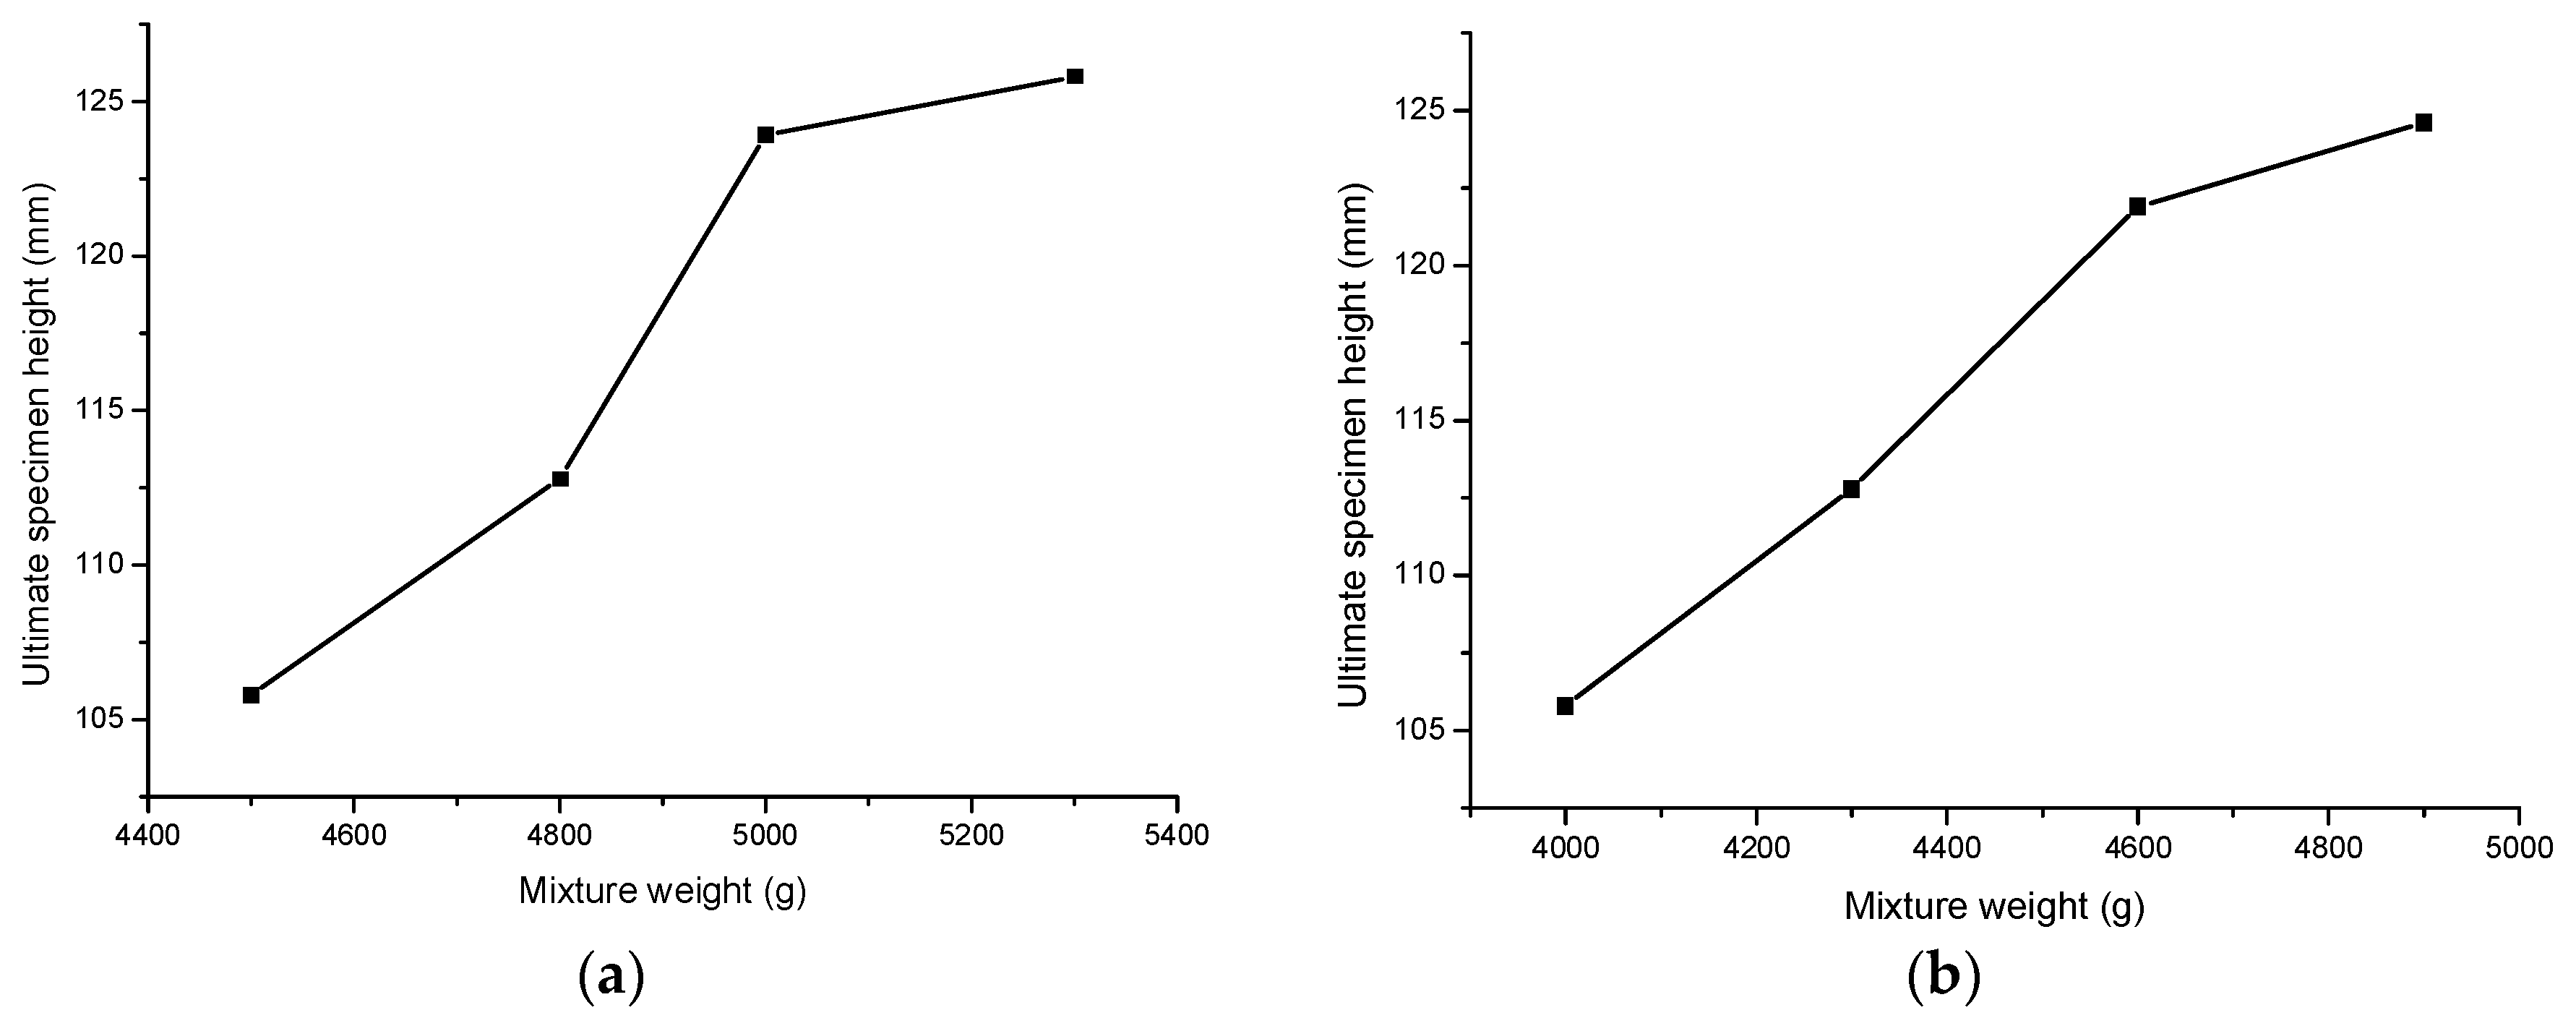
According to
Figure 5, the ultimate specimen height was calculated, and its variation with mixture weight is shown in
Figure 6.
As the specimen height was determined to be 110 mm, the mixture weight in one specimen for Aggregate A was determined to be 4700 g. In the same way, the mixture weight in one specimen for Aggregate B was determined to be 4200 g.
4.1.2. Variation of Compacted Specimen Height
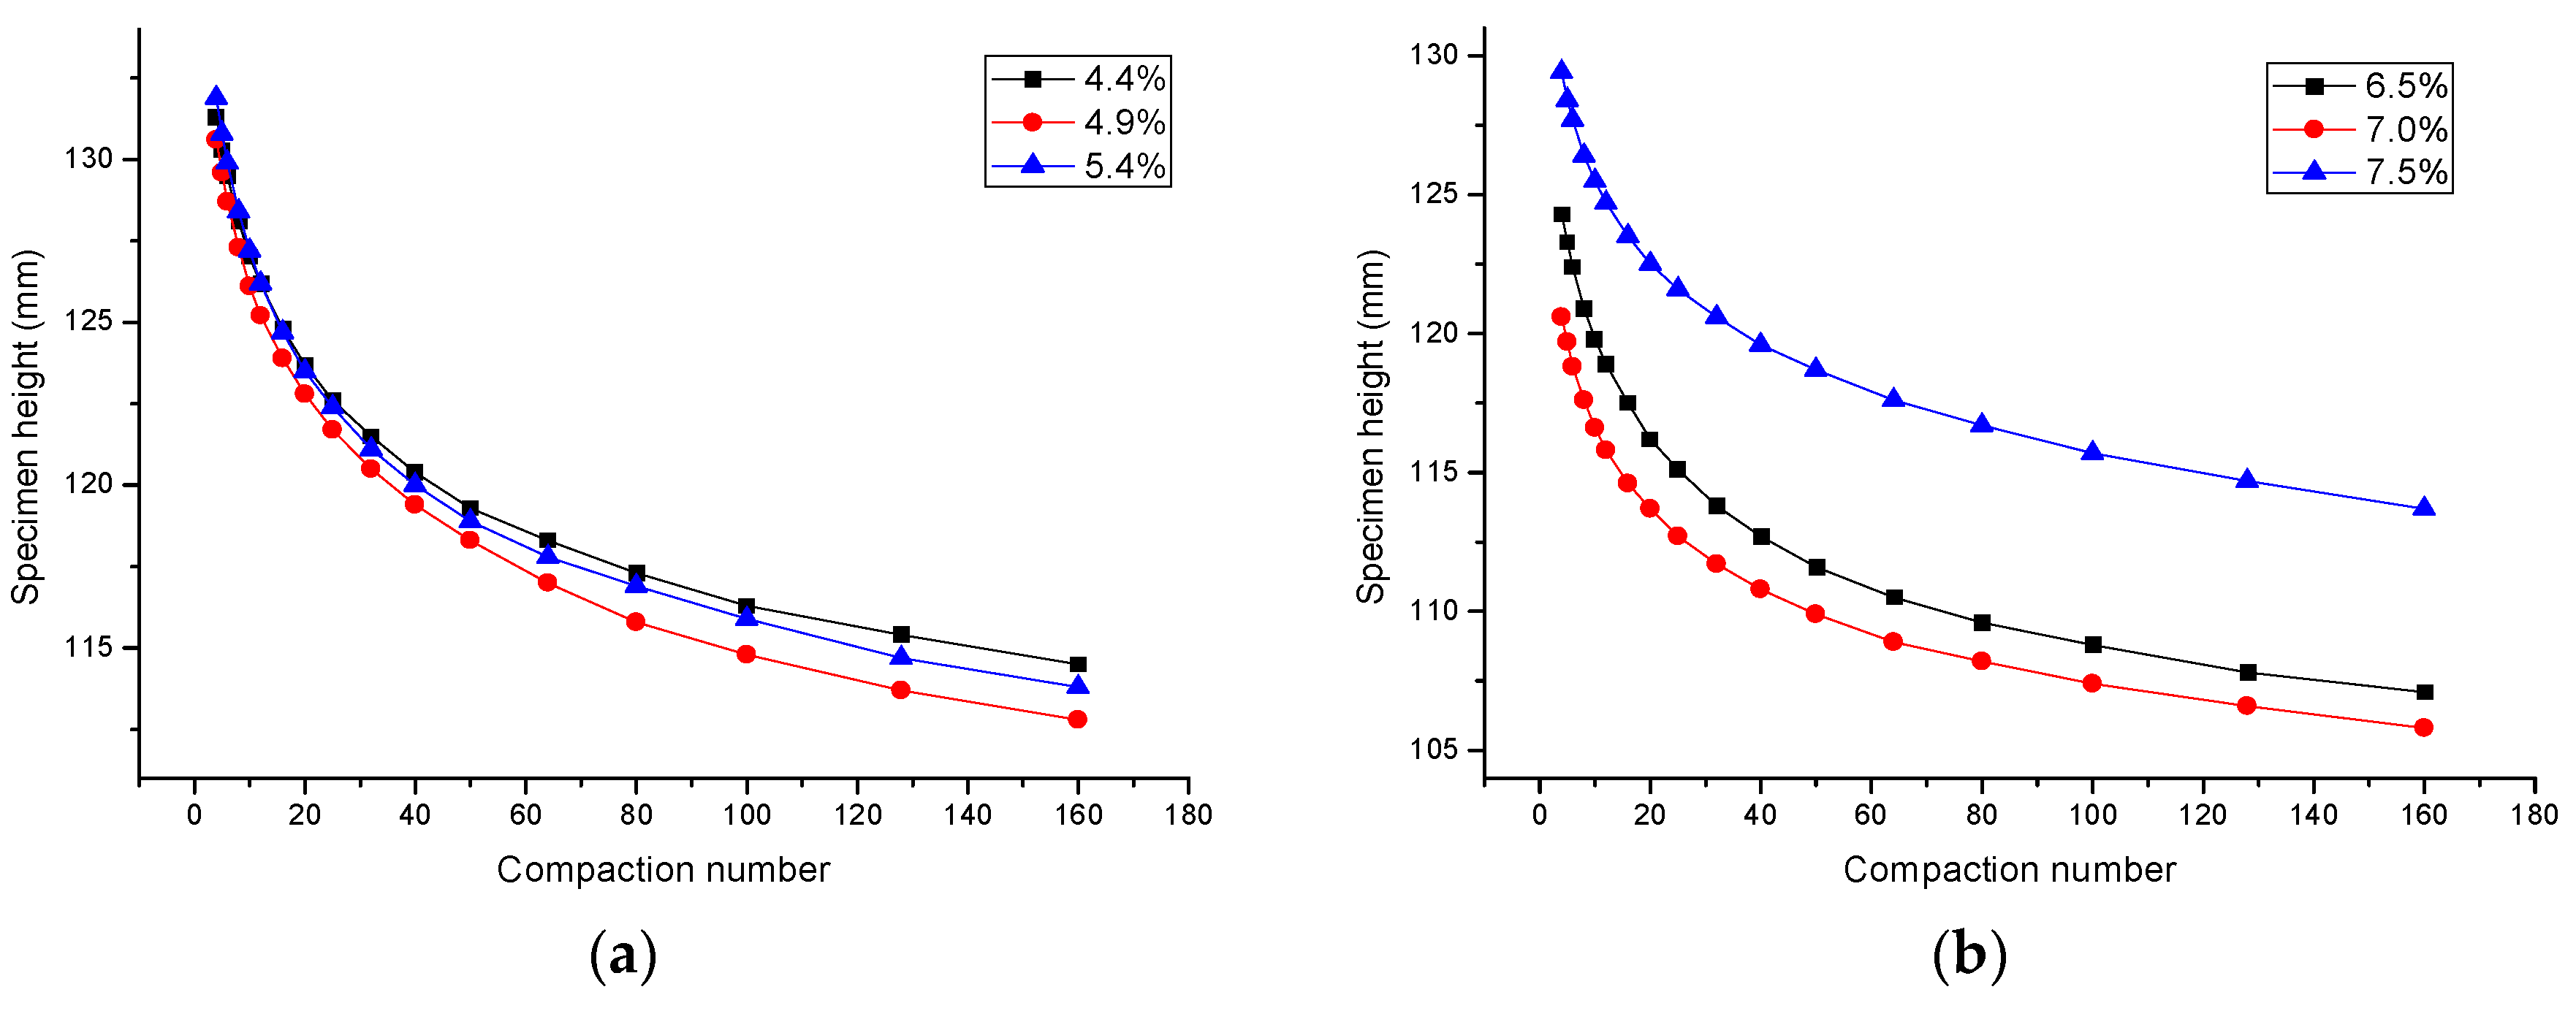
The mixture was compacted under three different moisture contents. The middle moisture content was slightly higher than the optimal moisture content achieved in the vibration compaction test. It should be noted that the optimal moisture content was determined by performing the vibration compaction test according to the specified compaction level in reference [
15]. The relationships between the compaction number and specimen height under different moisture contents are shown in
Figure 7.
It was found that the relationships between the compaction number and specimen height for both Aggregate A and B fit the logarithmic curves well. These fitting formulas were used to back calculate the specimen height under each compaction number.
4.1.3. Determination of Compaction Level
The formulas in
Table 3 were used to back calculate the specimen heights between compaction cycle 1 and 160. The heights were retained until 0.1 mm. According to the definition of locking point shown in
Figure 2, the locking points of the two aggregates under different moisture contents are shown in
Table 4.
According to
Table 4, the design gyratory compaction number N
design was approximately taken to be 105. It can be found that the locking points of Aggregate A were generally equal to those of Aggregate B, indicating that N
design is applicable to different CTAMs that have different aggregate gradations and moisture contents.
4.2. CTAM Performances under Different Compaction Methods
After the determination of the gyration compaction number N
design, the feasibility of using SGC to design CTAM was evaluated by comparing the performance of CTAM under Proctor, vibration and gyration compactions, including aggregate degradation, maximum dry density, optimal moisture content, unconfined compressive strength and dry/temperature shrinkage coefficient. The Proctor and vibration compaction tests were conducted according to the specification of JTG E51-2009 [
14] and reference [
15], respectively.
4.2.1. Aggregate Degradation
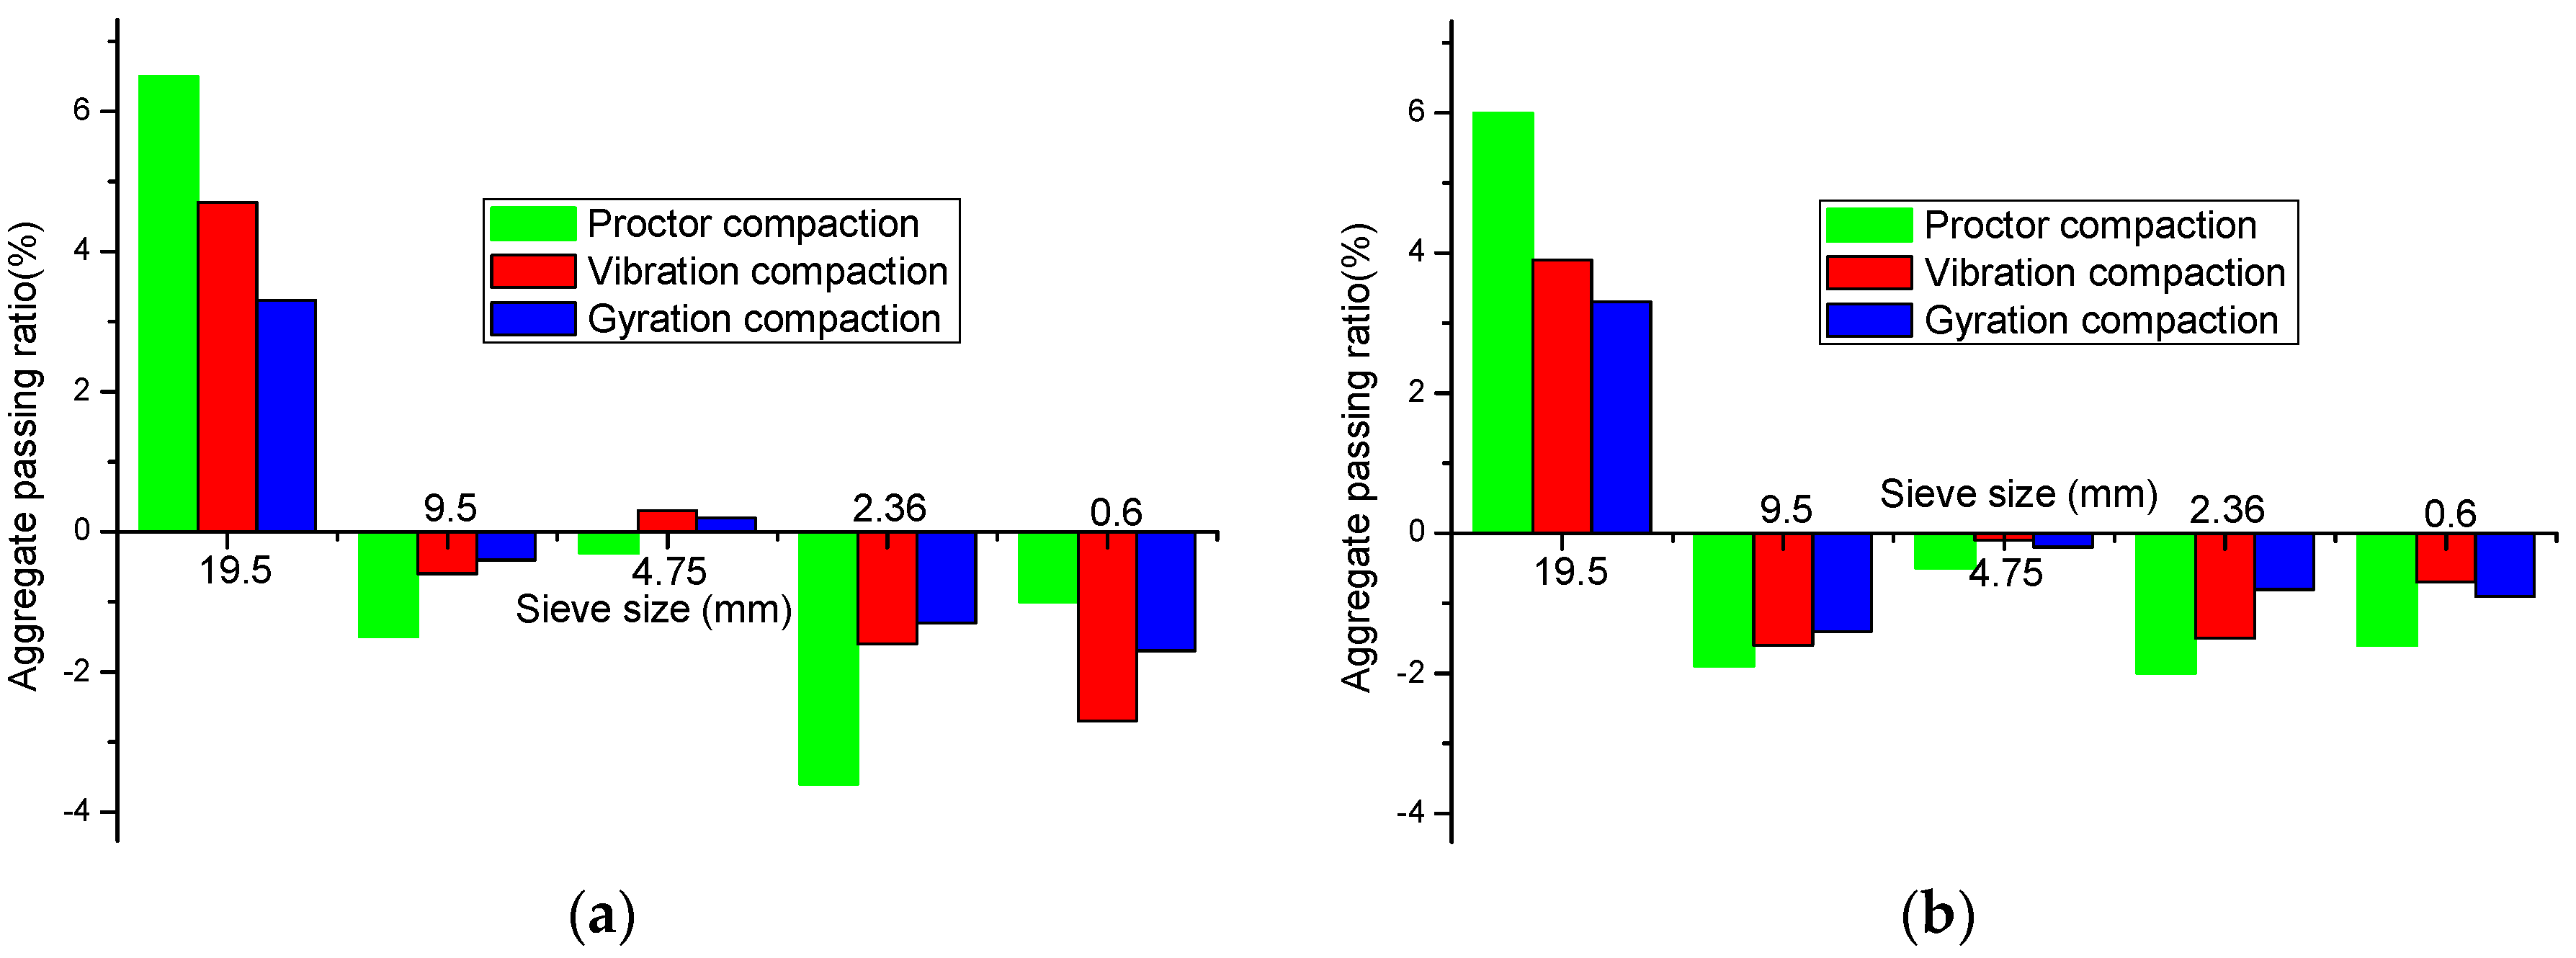
Aggregate gradation has a significant influence on the performance of CTAM. Thus, in this section the aggregate degradation after the Proctor, vibration and gyration compactions were compared. The detailed aggregate degradations of Aggregate A and Aggregate B are shown in
Figure 8.
Both
Figure 8a,b indicate that aggregate particles with a size over 19 mm degraded the most seriously. This was because large-sized particles, which generally undertook skeleton effects, were crushed more easily when subjected to impact energy. Due to the combined effect of increasing particles passing a larger-sized mesh and decreasing the crushed particles with a small size, the aggregates passing 9.5 mm and the smaller mesh decreased, indicating that the small-sized aggregate particles were harder to crush.
On the whole, the aggregates after gyration compaction degraded the least, indicating that gyration compaction could better maintain the skeleton of CTAM.
4.2.2. Maximum Dry Density and Optimal Moisture Content
Aggregate A (moisture content of 4.0%, 4.5%, 5.0%, 5.5% and 6.0%) and Aggregate B (moisture content of 6.0%, 6.5%, 7.0%, 7.5% and 8.0%) with a constant cement content of 4.0% were compacted using a Proctor, vibration and gyration compactor, respectively. It should be noted that all the aggregates were saturated before the test. The optimal moisture content and maximum dry densities of Aggregate A and Aggregate B are shown in
Figure 9 and
Figure 10, respectively.
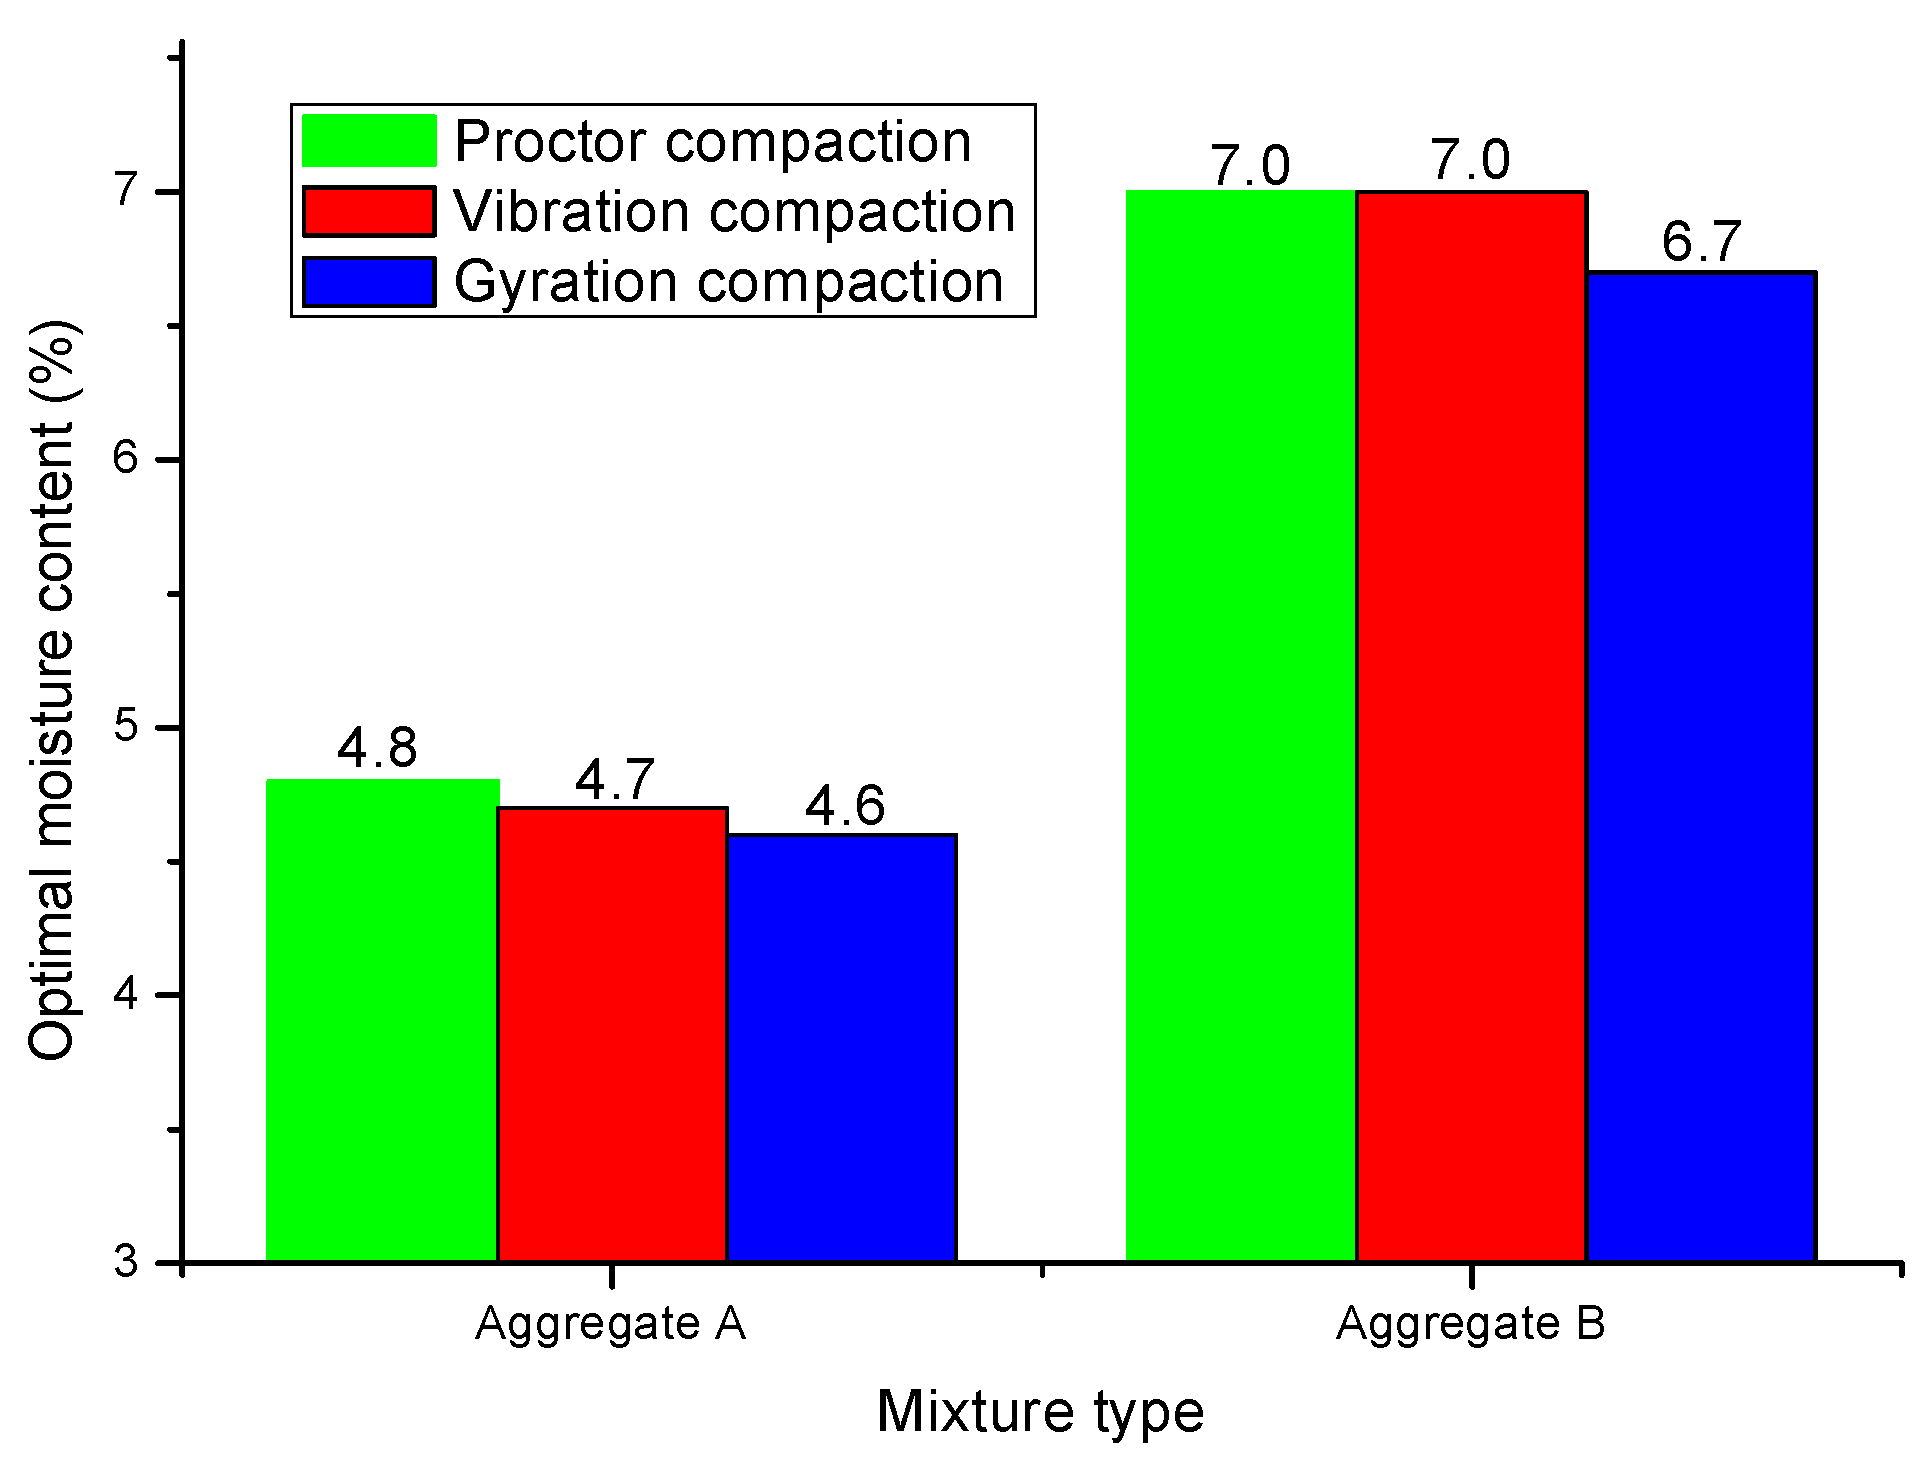
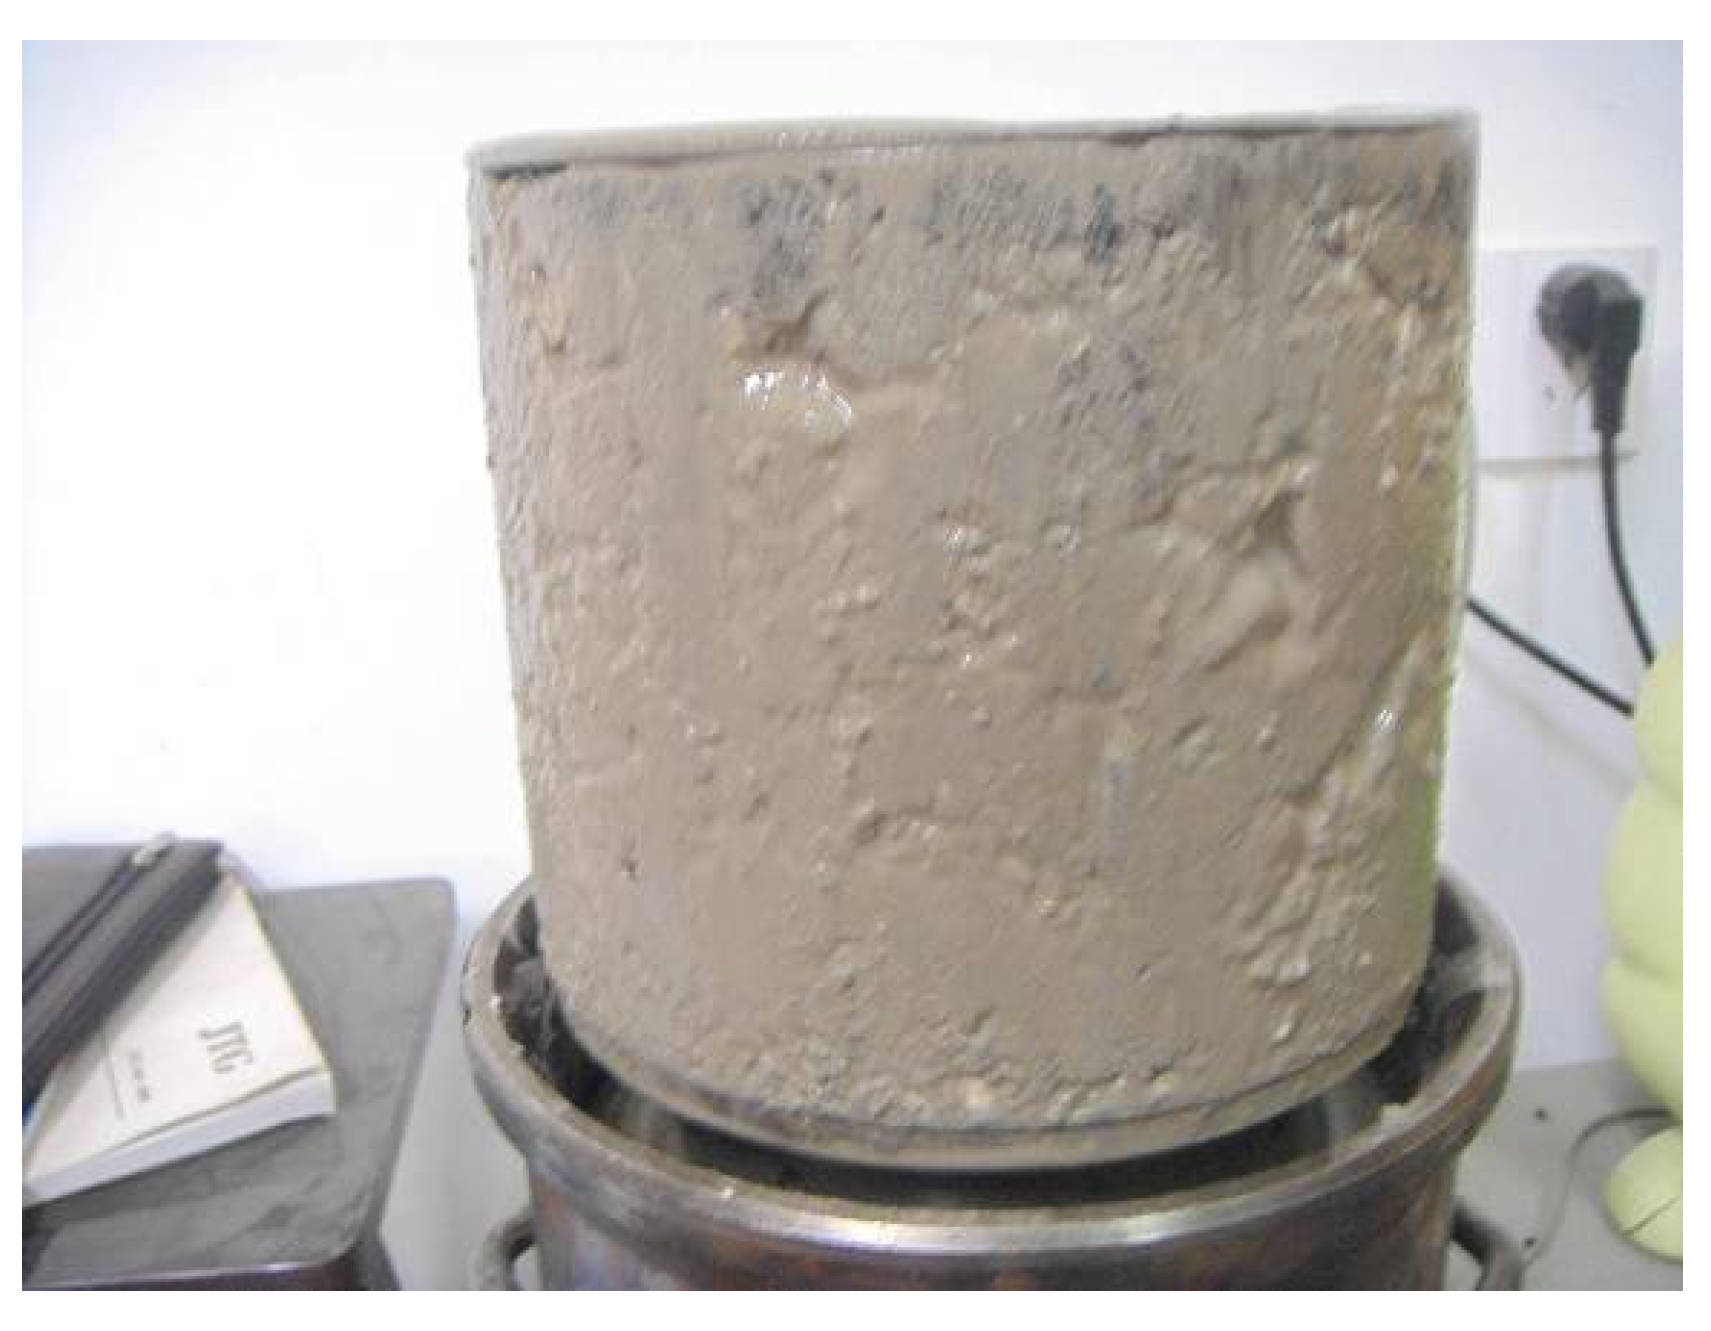
Figure 9 shows that the optimal moisture contents of Aggregate A and Aggregate B under gyration compaction were both lower than those under Proctor and vibration compaction. This is because during gyration compaction more cement grout was extruded from the specimen (
Figure 11), which led to a lower measured moisture content of the mixture. It was also found that due to the lower moisture absorption of Aggregate A than of Aggregate B, the optimal moisture content of Aggregate A was lower than that of Aggregate B.
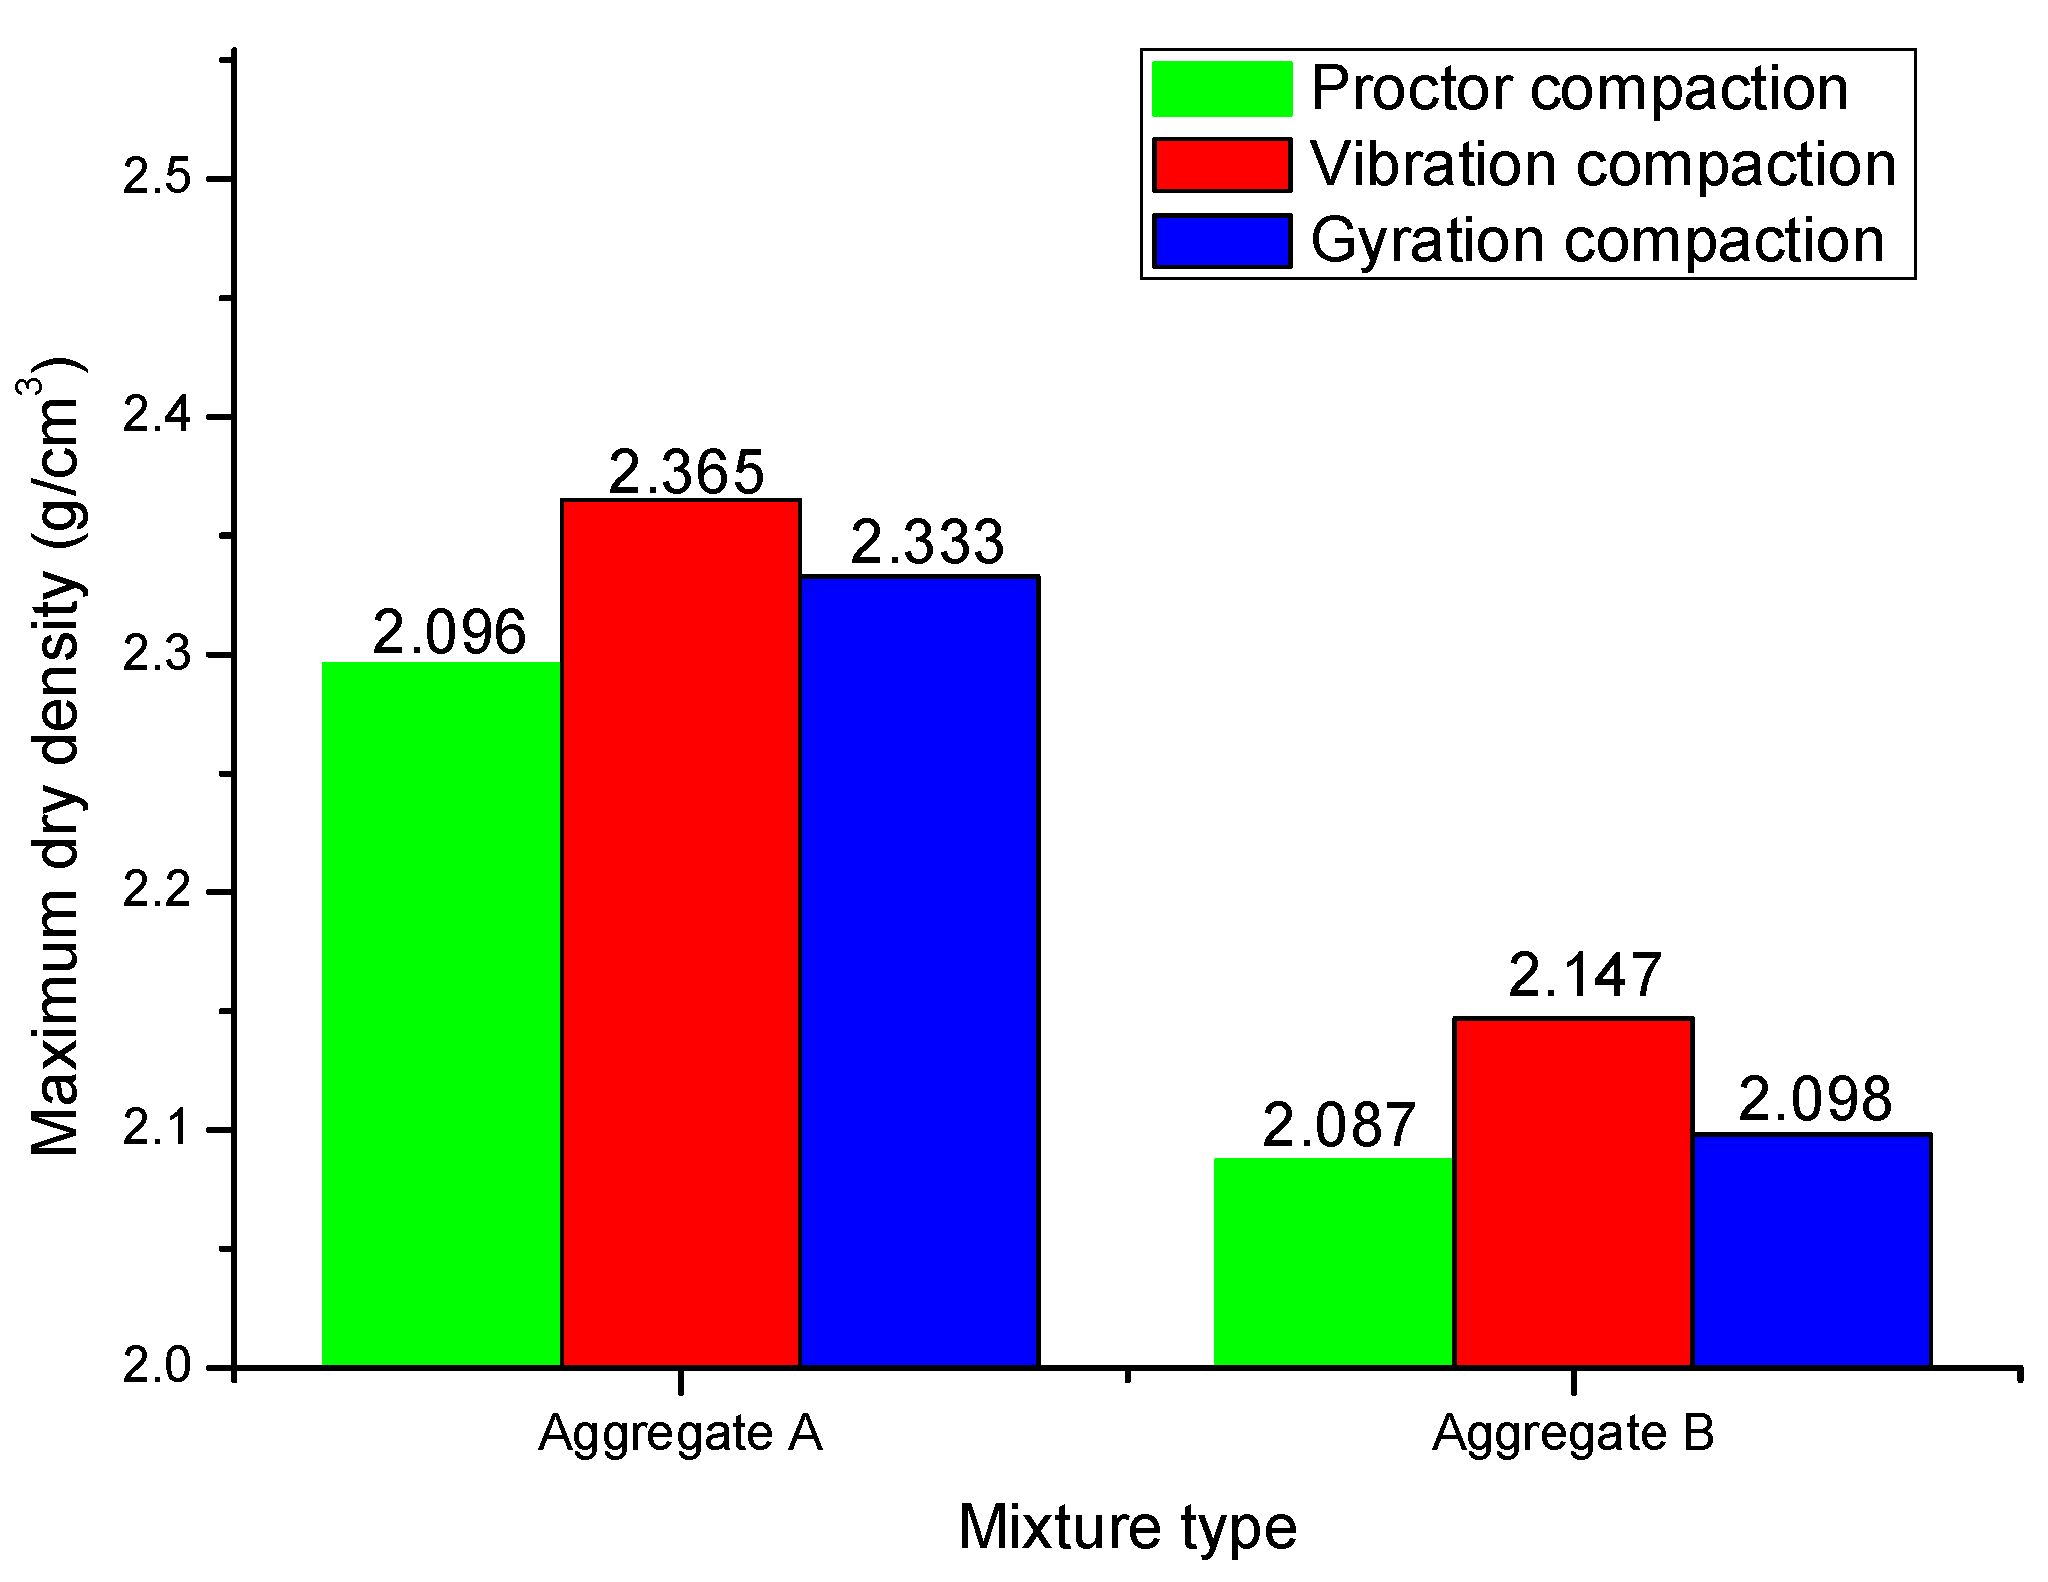
The maximum dry densities of Aggregate A and Aggregate B under gyration compaction were both higher than those under Proctor compaction, but lower than those under vibration compaction, as can be seen in
Figure 10. A greater compaction effort, on the one hand, was applied to the specimen by SGC than by the Proctor tester. On the other hand, the cement grout extruded from the specimen reduced the possibility of aggregate redistribution, thus the specimen under gyration compaction was more difficult to compact than that under vibration compaction.
In addition, we also found that the maximum dry density of Aggregate A was higher than that of Aggregate B, and the optimal moisture content of Aggregate A was lower than that of Aggregate B. The phenomenon was attributed to the lower void content (or lower moisture absorption) and higher density of Aggregate A than of Aggregate B.
4.2.3. Unconfined Compressive Strength
The specimens were cured under standard conditions (temperature of 20 ± 2 °C and relative humidity over 95%) for six days and immersed in water for one day. After that, the specimens were compressed using a pavement strength tester (Cangzhou Luyi experiment instrument Co., Ltd., Cangzhou, China). The unconfined compressive strength results of Aggregate A and B are shown in
Figure 12.
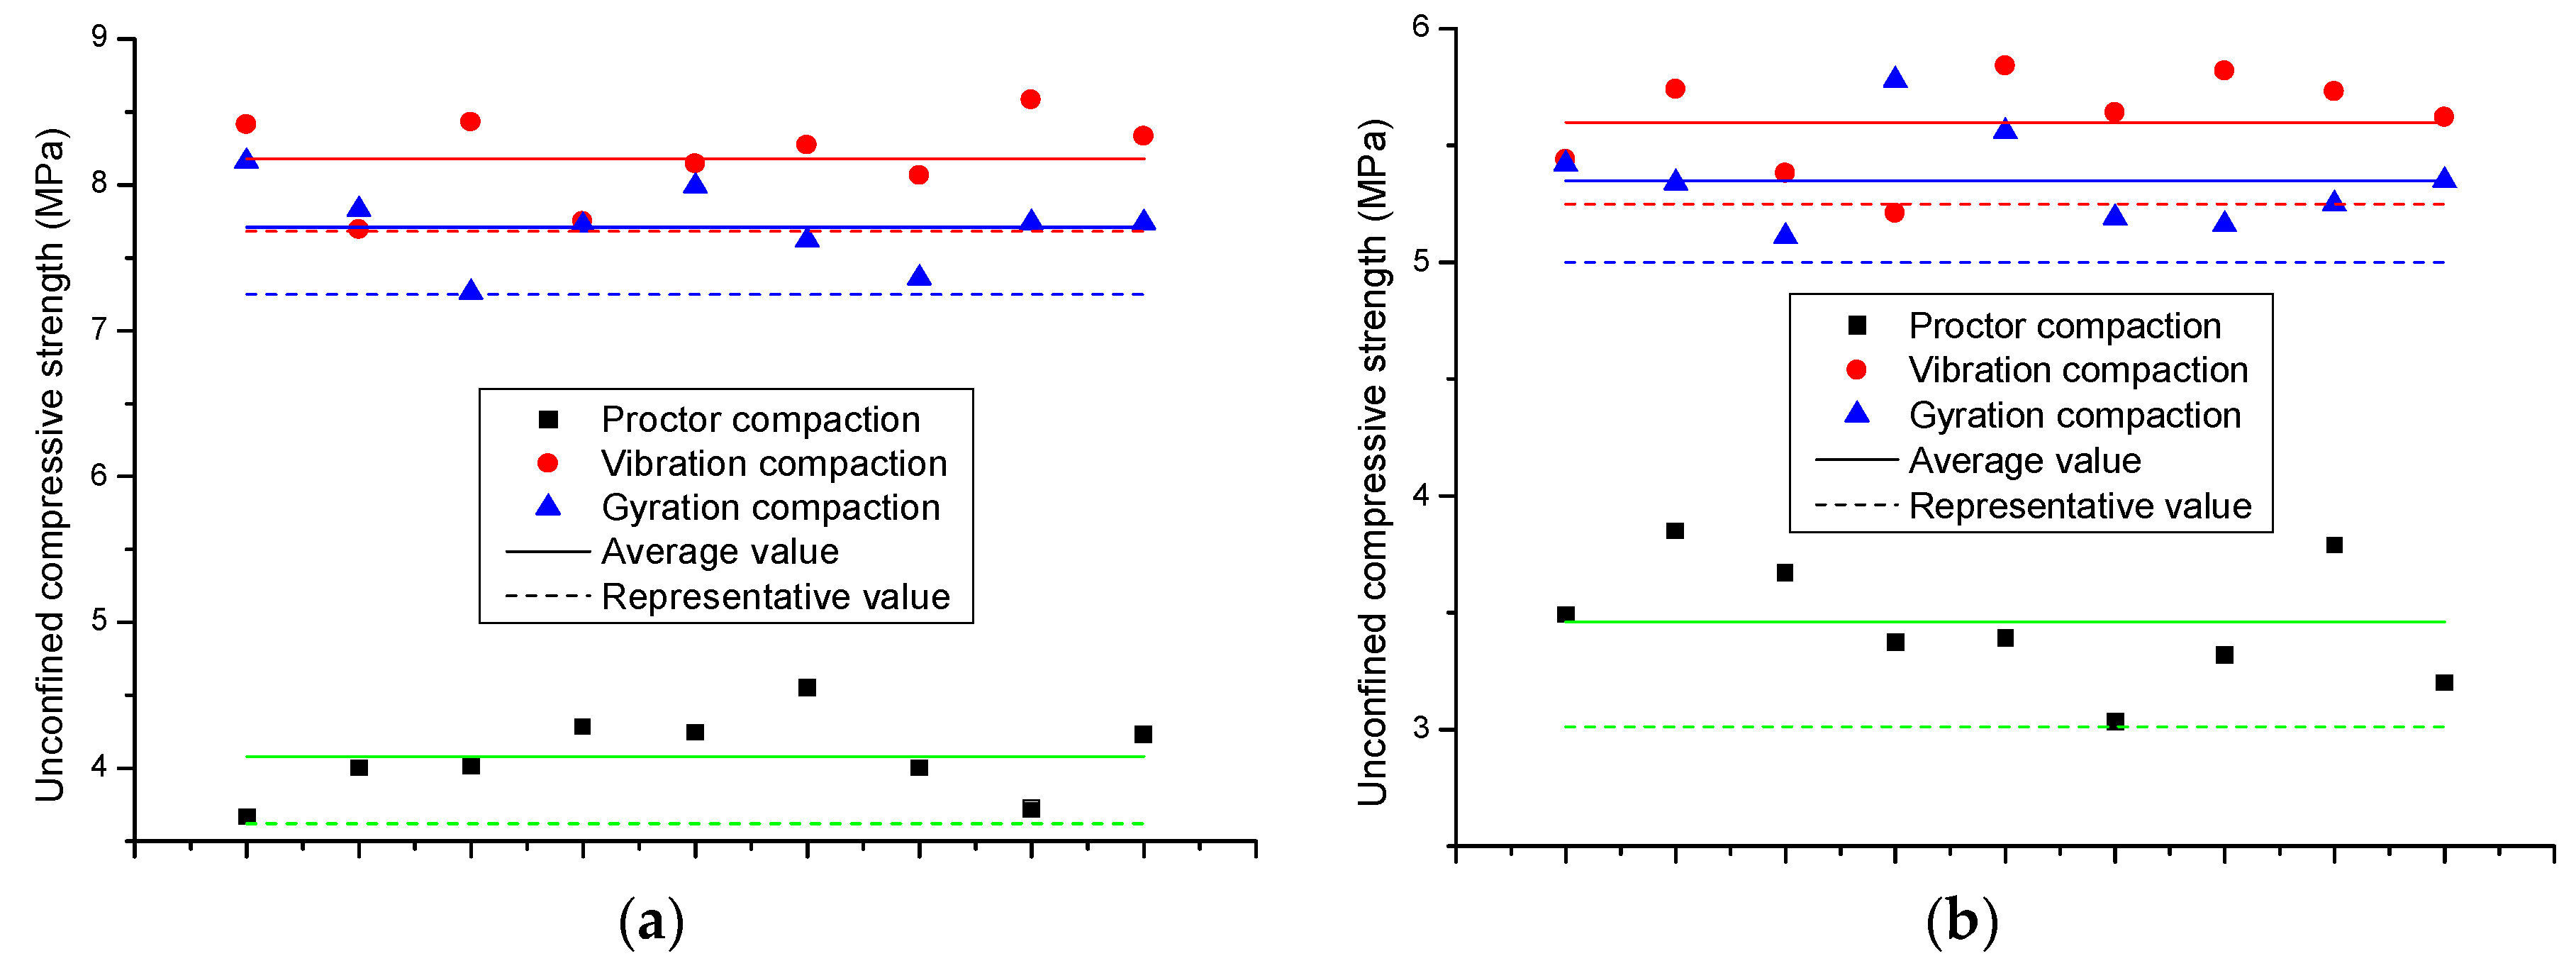
It was found that the results of the two aggregates under each compaction method had consistent variation trends. The average and representative strength values under vibration compaction were the highest, followed by those under gyration and Proctor compaction, respectively. Despite the two aggregate gradations having the same cement dosage, the strength values of Aggregate A were generally higher than those of Aggregate B, which was in part attributed to the different aggregate strengths and void contents of the two gradations.
According to the results in
Section 4.2.1 and
Section 4.2.2, there were three reasons for the above strength results. First, the gyration compaction had the least influence on the aggregate degradation, indicating that the aggregate structure under gyration compaction was better able to keep the skeleton. The fracture face in the aggregate became a new weak point. Second, the extruded cement grout reduced the possibility of aggregate bonding. Third, Proctor compaction had the minimum compaction energy, which was proven by its minimum and maximum dry density. With this mixture under this compaction level it was thus difficult to achieve a high degree of compaction.
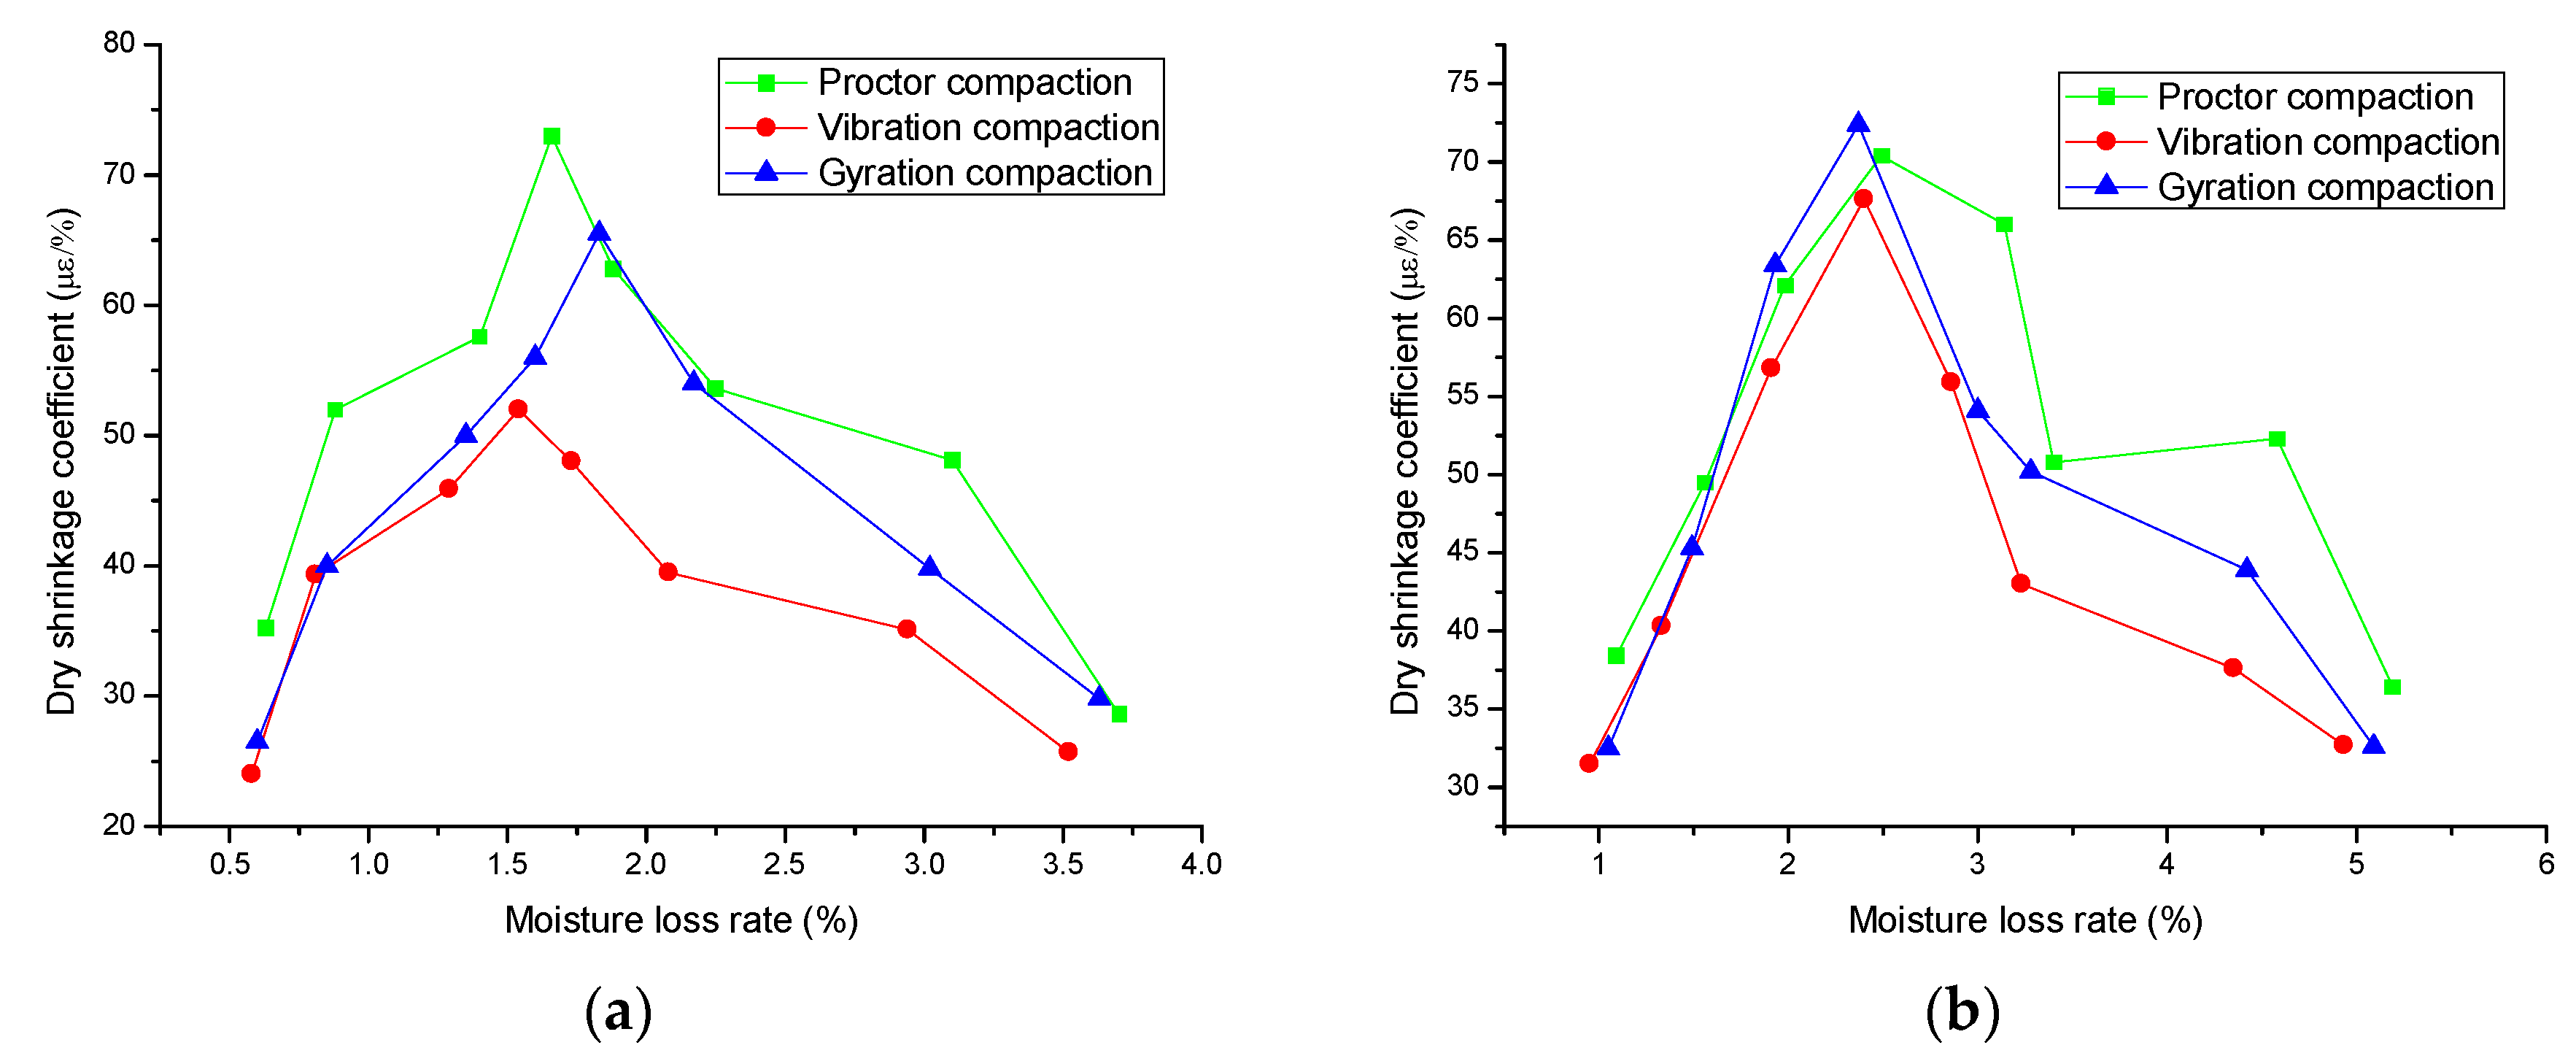
4.2.4. Dry Shrinkage Coefficient
The variations of the dry shrinkage coefficients of Aggregate A and B are shown in
Figure 13.
Figure 13a,b shows that the dry shrinkage coefficients of Aggregate A and Aggregate B both presented parabola variations with increasing moisture loss rates. The maximum dry shrinkage coefficients under the different compaction methods happened between 6–8 h. Compared with Aggregate A, Aggregate B had higher moisture absorption, which led to higher aggregate shrinkage. Thus, Aggregate A had a higher dry shrinkage resistance than Aggregate B.
The specimen under the vibration compaction method had the minimum moisture loss rate and shrinkage strain, resulting in the minimum dry shrinkage coefficient. The shrinkage coefficient difference under three compaction methods gradually enlarged with the increasing moisture loss rate, and was then reduced to a small extent.
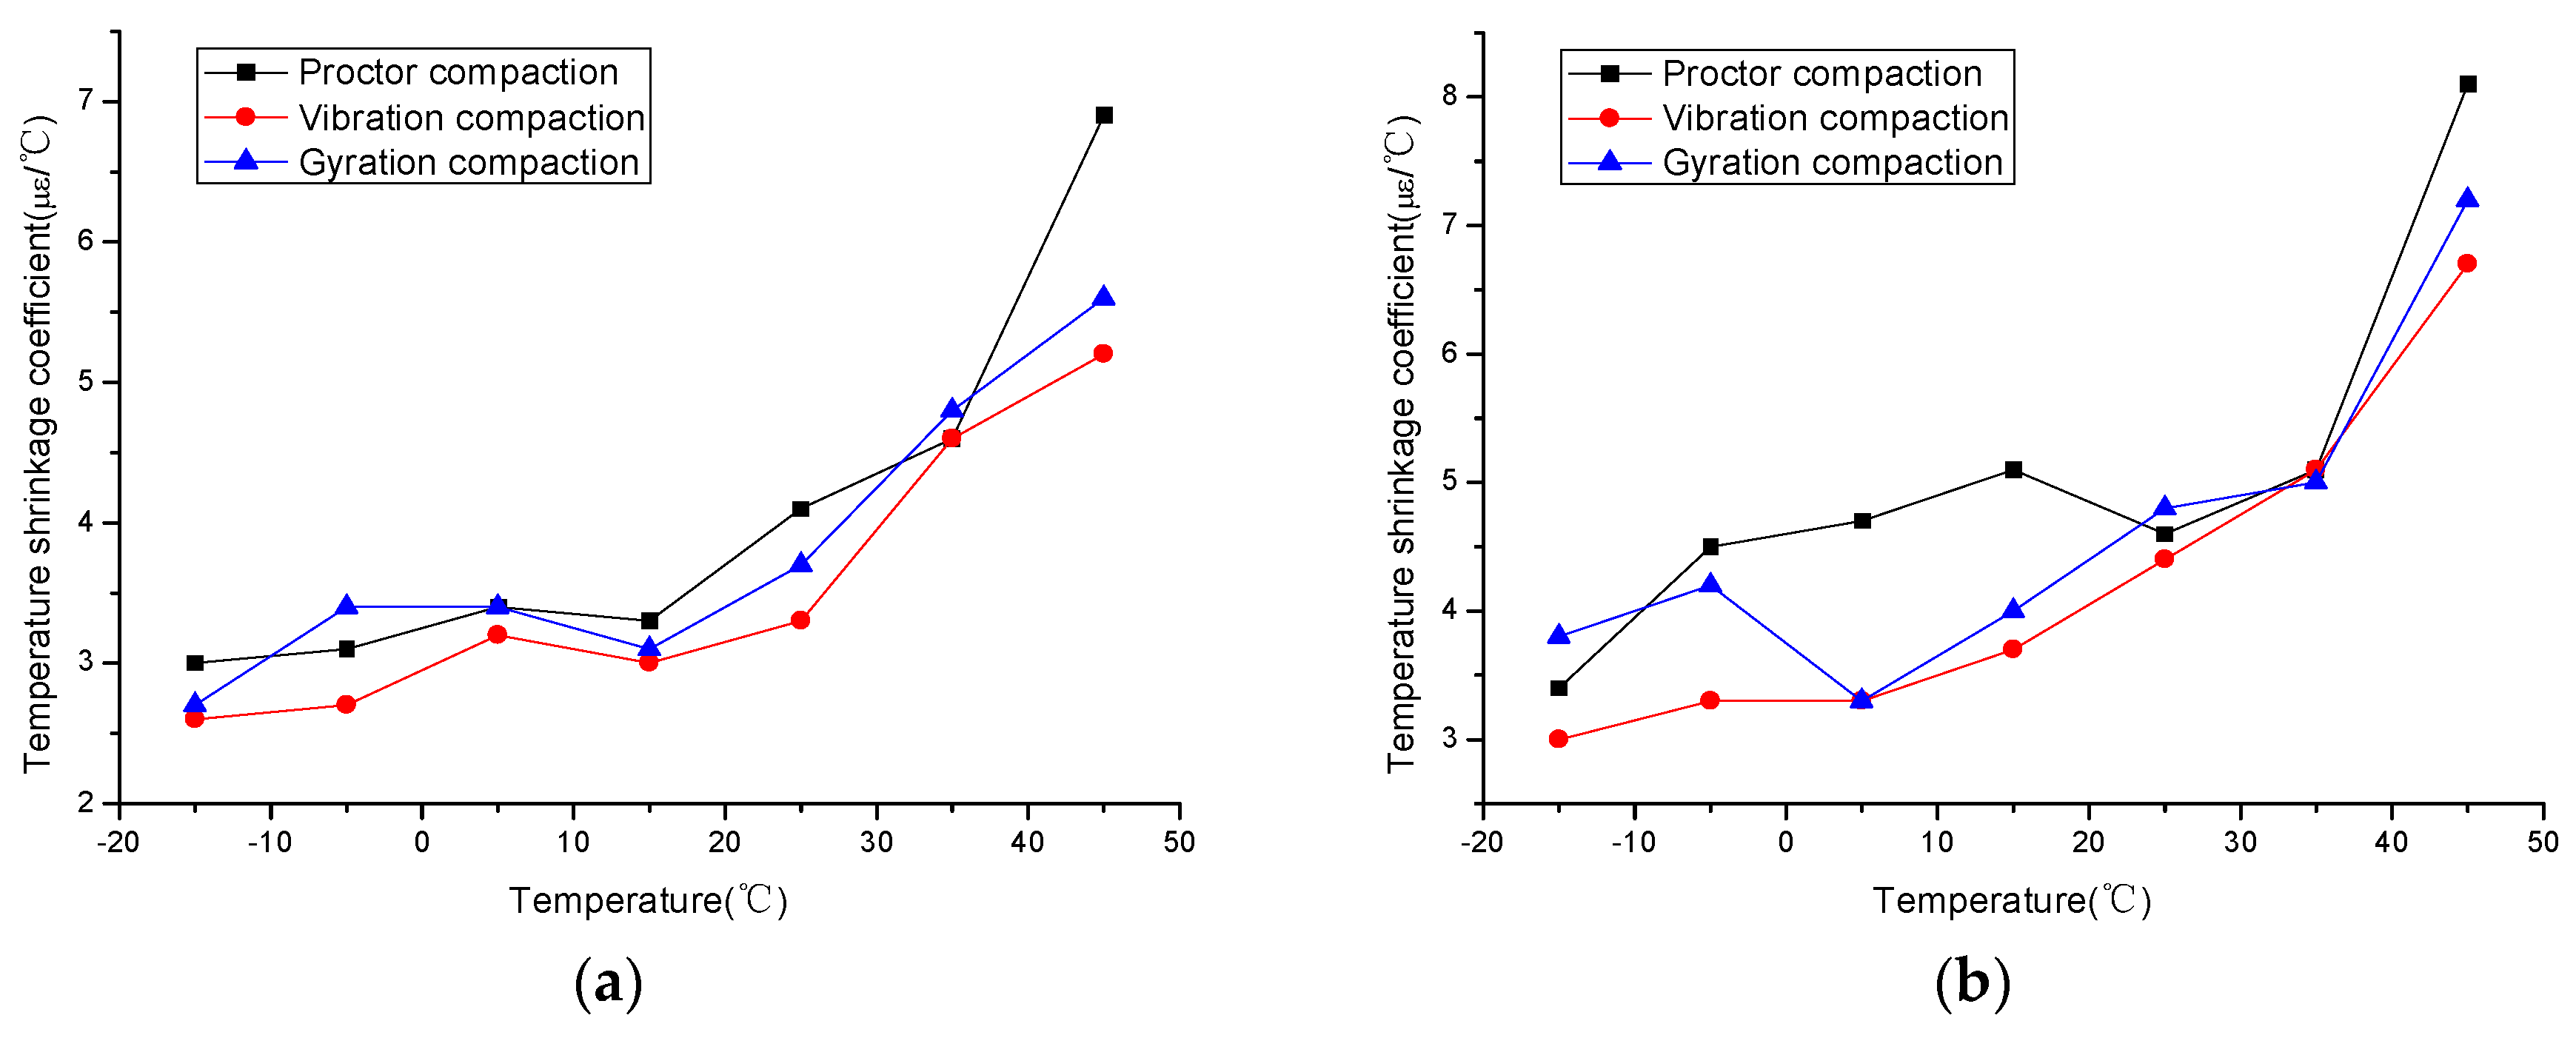
4.2.5. Temperature Shrinkage Coefficient
The variations of the temperature shrinkage coefficients of Aggregates A and B are shown in
Figure 14.
The temperature shrinkage coefficients shown in
Figure 14 increased with increasing temperature. The temperature shrinkage coefficient under Proctor compaction was generally the highest, followed by those under gyration and vibration compaction, which was in part attributed to the results of the aggregate degradation shown in
Section 4.2.1, because finer aggregates were easier to shrink under the same conditions. In addition, the temperature shrinkage coefficient of Aggregate B was higher than that of Aggregate A, because Aggregate B had a higher air void, resulting in easier temperature shrinkage of the aggregate.
5. Conclusions
Proctor compaction uses impact loads to compact cement-treated material in a stiff, non-yielding mold, and then significantly increases the fine aggregate content. The criteria for vibration compaction has been a controversial issue. Thus, this paper proposed a new method for the design of CTAM using SGC. In order to improve the reliability of the test results in this paper, two kinds of aggregate that have rather different air voids were used.
The concept of a locking point was used to determine the design gyration compaction number Ndesign. After the processes of fitting and the back calculation of the compaction curves, the Ndesign was determined to be 105, according to the 3-2-2 mode of the locking point.
The performance of CTAM under gyration compaction was compared to that under Proctor and vibration compaction. The results showed that gyration compaction could better maintain the initial gradation structure and had a smaller influence on aggregate degradation. Also, the optimal moisture content under gyration compaction was smaller than that under Proctor and vibration compaction. In addition, gyration compaction was superior to Proctor compaction but inferior to vibration compaction in terms of maximum dry density, unconfined compressive strength, and dry/temperature shrinkage coefficient. The performance of the two aggregate gradations differed from each other, especially in terms of moisture content, dry density and dry shrinkage coefficient, due to the significant difference in air void. However, all the performance variations of the two types of aggregate maintained consistent trends.
This paper only presents some simple test results for the use of SGC to design CTAM. In further studies, it will be necessary to apply the X-ray method to explore the aggregate distributions in CTAM under different compaction method. Using other indexes, such as elastic modulus and freezing resistance, to better evaluate the feasibility of the method is also essential.
Author Contributions
Y.D. and J.Z. designed the experiment procedures. Y.D., P.L. and J.T. performed the experiments. Y.D., P.L. and J.Z. analyzed the data. Y.D. wrote the original draft of this paper. J.Z. and Y.Z. gave some suggestions to polish the paper.
Acknowledgments
The work was financially supported by Joint Funds of the National Natural Science Foundation of China (Grant No. U1734208), Guangdong Science and Technology Planning (Grant No. 2016A010103045), and Innovation Research Project by Department of Education of Guangdong Province (Grant No. 2015KTSCX141).
Conflicts of Interest
The authors declare no conflict of interest.
References
- Xuan, D.X.; Houben, L.J.M.; Molenaar, A.A.A.; Shui, Z.H. Mechanical properties of cement-treated aggregate material—A review. Mater. Des. 2012, 33, 496–502. [Google Scholar] [CrossRef]
- Hu, L.Q.; Hao, J.X.; Wang, L.B. Laboratory evaluation of cement treated aggregate containing crushed clay brick. J. Traffic Transp. Eng. 2014, 5, 371–382. [Google Scholar] [CrossRef]
- Xuan, D.X.; Houben, L.J.M.; Molenaar, A.A.A.; Shui, Z.H. Mixture optimization of cement treated demolition waste with recycled masonry and concrete. Mater. Struct. 2012, 45, 143–151. [Google Scholar] [CrossRef]
- Behiry, E.M. Utilization of cement treated recycled concrete aggregates as base or subbase layer in Egypt. Ain Shams Eng. J. 2013, 4, 661–673. [Google Scholar] [CrossRef]
- Agrela, F.; Barbudo, A.; Ramírez, A.; Ayuso, J.; Carvajal, M.D.; Jiménez, J.R. Construction of road sections using mixed recycled aggregates treated with cement in Malaga, Spain. Resour. Conserv. Recycl. 2012, 58, 98–106. [Google Scholar] [CrossRef]
- Chummuneerat, S.; Jitsangiam, P.; Nikraz, H. Performances of hydrated cement treated crushed rock base for Western Australian roads. J. Traffic Transp. Eng. 2014, 1, 432–438. [Google Scholar] [CrossRef]
- Xuan, D.X.; Molenaar, A.A.A.; Houben, L.J.M. Deformation behavior of cement treated demolition waste with recycled masonry and concrete subjected to drying and temperature change. Cem. Concr. Comp. 2016, 68, 27–34. [Google Scholar] [CrossRef]
- Barišić, I.; Dimter, S.; Rukavina, T. Elastic properties of cement-stabilised mixes with steel slag. Int. J. Pavement Eng. 2016, 17, 753–762. [Google Scholar] [CrossRef]
- Isola, M.; Betti, G.; Marradi, A.; Tebaldi, G. Evaluation of cement treated mixtures with high percentage of reclaimed asphalt pavement. Constr. Build. Mater. 2013, 48, 238–247. [Google Scholar] [CrossRef]
- Pasetto, M.; Baldo, N. Experimental analysis of hydraulically bound mixtures made with waste foundry sand and steel slag. Mater. Struct. 2015, 48, 1–15. [Google Scholar] [CrossRef]
- Bahmani, S.H.; Farzadnia, N.; Asadi, A.; Huat, B.B.K. The effect of size and replacement content of nanosilica on strength development of cement treated residual soil. Constr. Build. Mater. 2016, 118, 294–306. [Google Scholar] [CrossRef]
- Mokwa, R.; Cuelho, E.; Browne, M. Laboratory Testing of Soil Using the Superpave Gyratory Compactor. In Proceedings of the Transportation Research Board 87th Annual Meeting, Washington, DC, USA, 13–17 January 2008. [Google Scholar]
- Cetin, A.; Kaya, Z.; Cetin, B.; Aydilek, A.H. Influence of laboratory compaction method on mechanical and hydraulic characteristics of unbound granular base materials. Road Mater. Pavement Des. 2014, 15, 220–235. [Google Scholar] [CrossRef]
- Test Methods of Materials Stabilized with Inorganic Binders for Highway Engineering; JTG E51-2009; Ministry of Transport of the People’s Republic of China: Beijing, China, 2009.
- Li, M.J.; Jiang, Y.J.; Zhang, J.J.; Wang, S.; Dai, J.L. Vibration test method of semi-rigid base course material. J. Traffic Transp. Eng. 2010, 10, 6–11. [Google Scholar]
- Jiang, Y.J.; Fan, L.F. An investigation of mechanical behavior of cement-stabilized crushed rock material using different compaction methods. Constr. Build. Mater. 2013, 48, 508–515. [Google Scholar] [CrossRef]
- Ji, X.P.; Jiang, Y.J.; Liu, Y.J. Evaluation of the mechanical behaviors of cement-stabilized cold recycled mixtures produced by vertical vibration compaction method. Mater. Struct. 2016, 49, 2257–2270. [Google Scholar] [CrossRef]
- Xuan, D.X.; Molenaar, A.A.A.; Houben, L.J.M. Shrinkage cracking of cement treated demolition waste as a road base. Mater. Struct. 2016, 49, 631–640. [Google Scholar] [CrossRef]
- Pablo, P.; Foerster, A.; Rosario, H.; Javier, O. Application of cement-treated recycled materials in the construction of a section of road in Malaga, Spain. Constr. Build. Mater. 2013, 44, 593–599. [Google Scholar] [CrossRef]
- Cabrera, M.; Agrela, F.; Ayuso, J.; Galvin, A.P.; Rosales, J. Feasible use of biomass bottom ash in the manufacture of cement treated recycled materials. Mater. Struct. 2016, 49, 3227–3238. [Google Scholar] [CrossRef]
- Cardone, F.; Grilli, A.; Bocci, M.; Graziani, A. Curing and temperature sensitivity of cement–bitumen treated materials. Int. J. Pavement Eng. 2015, 16, 868–880. [Google Scholar] [CrossRef]
- Grilli, A.; Bocci, M.; Tarantino, A.M. Experimental investigation on fibre-reinforced cement-treated materials using reclaimed asphalt. Constr. Build. Mater. 2013, 38, 491–496. [Google Scholar] [CrossRef]
- Yuan, D.; Nazarian, S.; Hoyos, L.; Puppala, A. Evaluation and mix design of cement-treated base materials with high content of reclaimed asphalt pavement. Transp. Res. Rec. J. Transp. Res. Board 2011, 2212, 110–119. [Google Scholar] [CrossRef]
- Joshaghani, A.; Balapour, M.; Ramezanianpour, A.A. Effect of controlled environmental conditions on mechanical, microstructural and durability properties of cement mortar. Constr. Build. Mater. 2018, 164, 134–149. [Google Scholar] [CrossRef]
- Sánchez, I.; Antón, C.; Vera, G.D.; Ortega, J.M.; Climent, M.A. Moisture distribution in partially saturated concrete studied by impedance spectroscopy. J. Nondestruct. Eval. 2013, 32, 362–371. [Google Scholar] [CrossRef]
- Ortega, J.M.; Esteban, M.D.; Rodríguez, R.R.; Pastor, J.L.; Ibanco, F.J.; Sánchez, F.; Climent, M.A. Long-term behaviour of fly ash and slag cement grouts for micropiles exposed to a sulphate aggressive medium. Materials 2017, 10, 598. [Google Scholar] [CrossRef] [PubMed]
- Ramezanianpour, A.A.; Malhotra, V.M. Effect of curing on the compressive strength, resistance to chloride-ion penetration and porosity of concretes incorporating slag, fly ash or silica fume. Cem. Concr. Comp. 1995, 17, 125–133. [Google Scholar] [CrossRef]
- Georgiou, P.; Sideris, L.; Loizos, A. Evaluation of the effects of gyratory and field compaction on asphalt mix internal structure. Mater. Struct. 2016, 177. [Google Scholar] [CrossRef]
- Lambert, N.; Denny, K.; Sukumaran, B.; Mehta, Y. Evaluation of the compaction characteristics of unbound material using the superpave gyratory compactor. In Proceedings of the GeoHunan International Conference, Changsha, China, 3–6 August 2009; pp. 65–71. [Google Scholar]
- Lee, K.; Prezzi, M.; Kim, N. Subgrade design parameters from samples prepared with different compaction methods. J. Transp. Eng. 2007, 133, 82–89. [Google Scholar] [CrossRef]
- Li, X.J.; Gibson, N.H. Mechanistic characterization of aggregate packing to assess gyration levels during HMA mix design. J. Assoc. Asph. Paving Technol. 2011, 80, 33–64. [Google Scholar]
- Transportation Research Board. Practical approaches to hot-mix asphalt mix design and production quality control testing. In Transportation Research E-Circular; Transportation Research Board: Washington, DC, USA, 2007. [Google Scholar]
- Punkki, J.; Sellevold, E.J. Capillary Suction in Concrete: Effects of Drying Procedure; No. 15, 2/94; Nordic Concrete Research Publication: Oslo, Norway, 1994. [Google Scholar]
- Sánchez, I. Influence of environment on durability of fly ash cement mortars. ACI Mater. J. 2012, 109, 647–656. [Google Scholar]
- Galle, C. Effect of drying on cement-based materials pore structure as identified by mercury intrusion porosimetry. A comparative study between oven, vacuum and freeze-drying. Cem. Concr. Res. 2001, 31, 1467–1477. [Google Scholar] [CrossRef]
- Tashman, L.; Masad, E.; D’Angelo, J.; Bukowski, J.; Harman, T. X-ray tomography to characterize air void distribution in superpave gyratory compacted specimens. Int. J. Pavement Eng. 2002, 3, 19–28. [Google Scholar] [CrossRef]
- Thyagarajan, S.; Tashman, L.; Masad, E.; Bayomy, F. The heterogeneity and mechanical response of hot mix asphalt laboratory specimens. Int. J. Pavement Eng. 2010, 11, 107–121. [Google Scholar] [CrossRef]
- AASHTO T 312. Preparing and Determining the Density of Hot-Mix Asphalt (HMA) Specimens by Means of the Superpave Gyratory Compactor; American Association of State Highway and Transportation Officials: Washington, DC, USA, 2012. [Google Scholar]
Figure 1.
Aggregate gradation.
Figure 1.
Aggregate gradation.
Figure 2.
Schematic diagram of the locking point.
Figure 2.
Schematic diagram of the locking point.
Figure 3.
Schematic diagram of the research procedure.
Figure 3.
Schematic diagram of the research procedure.
Figure 4.
Diagram of the Superpave gyratory compactor used in this paper.
Figure 4.
Diagram of the Superpave gyratory compactor used in this paper.
Figure 5.
Compaction curves of (a) Aggregate A and (b) Aggregate B of different mixture weights.
Figure 5.
Compaction curves of (a) Aggregate A and (b) Aggregate B of different mixture weights.
Figure 6.
Variation of ultimate specimen height with mixture weight: (a) Aggregate A; (b) Aggregate B.
Figure 6.
Variation of ultimate specimen height with mixture weight: (a) Aggregate A; (b) Aggregate B.
Figure 7.
Relationship between compaction number and specimen height for (a) Aggregate A under a moisture content of 4.4%, 4.9% and 5.4% and (b) Aggregate B under a moisture content of 6.5%, 7.0% and 7.5%.
Figure 7.
Relationship between compaction number and specimen height for (a) Aggregate A under a moisture content of 4.4%, 4.9% and 5.4% and (b) Aggregate B under a moisture content of 6.5%, 7.0% and 7.5%.
Figure 8.
Schematic diagrams of aggregate degradation for (a) Aggregate A and (b) Aggregate B.
Figure 8.
Schematic diagrams of aggregate degradation for (a) Aggregate A and (b) Aggregate B.
Figure 9.
Optimal moisture contents of Aggregate A and Aggregate B.
Figure 9.
Optimal moisture contents of Aggregate A and Aggregate B.
Figure 10.
Maximum dry densities of Aggregate A and Aggregate B.
Figure 10.
Maximum dry densities of Aggregate A and Aggregate B.
Figure 11.
Specimen appearance under gyration compaction.
Figure 11.
Specimen appearance under gyration compaction.
Figure 12.
Unconfined compressive strength of (a) Aggregate A and (b) Aggregate B.
Figure 12.
Unconfined compressive strength of (a) Aggregate A and (b) Aggregate B.
Figure 13.
Dry shrinkage coefficients of (a) Aggregate A and (b) Aggregate B.
Figure 13.
Dry shrinkage coefficients of (a) Aggregate A and (b) Aggregate B.
Figure 14.
Temperature shrinkage coefficients of (a) Aggregate A and (b) Aggregate B.
Figure 14.
Temperature shrinkage coefficients of (a) Aggregate A and (b) Aggregate B.
Table 1.
Density and moisture absorption of aggregate.
Table 1.
Density and moisture absorption of aggregate.
| Aggregate Size (mm) | Bulk Density (g/cm3) | Moisture Absorption (%) |
|---|
| Aggregate A | Aggregate B | Aggregate A | Aggregate B |
|---|
| 9.5~31.5 | 2.695 | 2.514 | 0.26 | 2.61 |
| 4.75~9.5 | 2.686 | 2.498 | 0.34 | 2.78 |
| 2.36~4.75 | 2.678 | 2.505 | 0.49 | 2.34 |
| 0~2.36 | 2.661 | 2.489 | 1.16 | 2.94 |
Table 2.
Properties of the cement.
Table 2.
Properties of the cement.
| Density/(g/cm3) | Setting Time/min | Compressive Strength/MPa | Flexural Strength/MPa |
|---|
| Initial | Final | 3 days | 28 days | 3 days | 28 days |
|---|
| 3.05 | 105 | 152 | 22.3 | 43.6 | 5.1 | 8.8 |
Table 3.
Fitting results of compaction curves.
Table 3.
Fitting results of compaction curves.
| Moisture Content/% | Fitting Formula | R2 |
|---|
| Aggregate A | 4.4 | y = −4.6339Ln(x) + 137.67 | 0.9993 |
| 4.9 | y = −4.8936Ln(x) + 137.43 | 0.9998 |
| 5.4 | y = −4.971Ln(x) + 138.61 | 0.9986 |
| Aggregate B | 6.5 | y = −4.7127Ln(x) + 130.82 | 0.9973 |
| 7.0 | y = −4.6543Ln(x) + 125.97 | 0.9981 |
| 7.5 | y = −4.7429Ln(x) + 135.26 | 0.9998 |
Table 4.
Locking points under different moisture contents.
Table 4.
Locking points under different moisture contents.
| Type of Mixture | Aggregate A under Moisture Content of | Aggregate B under Moisture Content of |
|---|
| 4.4% | 4.9% | 5.4% | 6.5% | 7.0% | 7.5% |
|---|
| Compaction number | 103 | 104 | 107 | 106 | 103 | 106 |
| Average compaction number | 105 |
© 2018 by the authors. Licensee MDPI, Basel, Switzerland. This article is an open access article distributed under the terms and conditions of the Creative Commons Attribution (CC BY) license (http://creativecommons.org/licenses/by/4.0/).


