Class Imbalance Ensemble Learning Based on the Margin Theory


Abstract
1. Introduction
- Sampling methods: The objective of these non-heuristic methods is to provide a balanced distribution by considering the representative proportions of class examples. They are carried out before training starts. These methods will be presented in detail in Section 2.1.
- Cost-sensitive methods: These methods incorporate both data level transformations (by adding costs to instances) and algorithm level modifications (by modifying the learning process to accept costs). They generally use the cost matrix to consider the costs associated with misclassifying samples [11]. Cost-sensitive neural network [15] with threshold-moving technique was proposed to adjust the output threshold toward inexpensive classes, such that high-cost samples are unlikely to be misclassified. Three cost-sensitive methods, AdaC1, AdaC2, and AdaC3 were proposed [16] and cost items were used to weight the updating strategy in the boosting algorithm. The disadvantage of these approaches is the need to define misclassification costs, which are not usually available in the data sets [5].
- Kernel-based methods: The principles of kernel-based learning are centered on the theories of statistical learning and Vapnik-Chervonenkis dimensions [17,18]. In kernel-based methods, there have been many works to apply sampling and ensemble techniques to the support vector machine (SVM) concept [19]. Different error costs [20] were suggested for different classes to bias the SVM to shift the decision boundary away from positive instances and make positive instances more densely distributed.
- Active learning methods: Traditional active learning methods were used to solve the imbalanced training data problem. Recently, various approaches on active learning from imbalanced data sets were proposed [14]. Active learning effectively selects the instances from a random set of training data, therefore significantly reducing the computational costs when dealing with large imbalanced data sets. The major drawback of these approaches is large computation costs for large datasets [14].
2. Related Works
2.1. Sampling Methods for Learning from Imbalanced Data
2.1.1. Oversampling Techniques
2.1.2. Undersampling Techniques
2.1.3. Oversampling versus Undersampling
2.2. Ensemble-Based Imbalanced Data Classification Methods
2.2.1. Boosting Based Ensemble Learning
2.2.2. Bagging Based Ensemble Learning
2.2.3. Hybrid Combined Ensembles
3. Ensemble Margin for Imbalance Learning
3.1. Ensemble Margin Definitions
- A popular ensemble margin, which has been introduced by Shapire et al. [27], is defined by Equation (1), where is the number of votes for the true class y and is the number of votes for any other class c. This ensemble margin is in the range [, +1] and the examples which are correctly classified have positive margin values. A large positive ensemble margin can be interpreted as a confident correct classification.where L represents the number of classes.
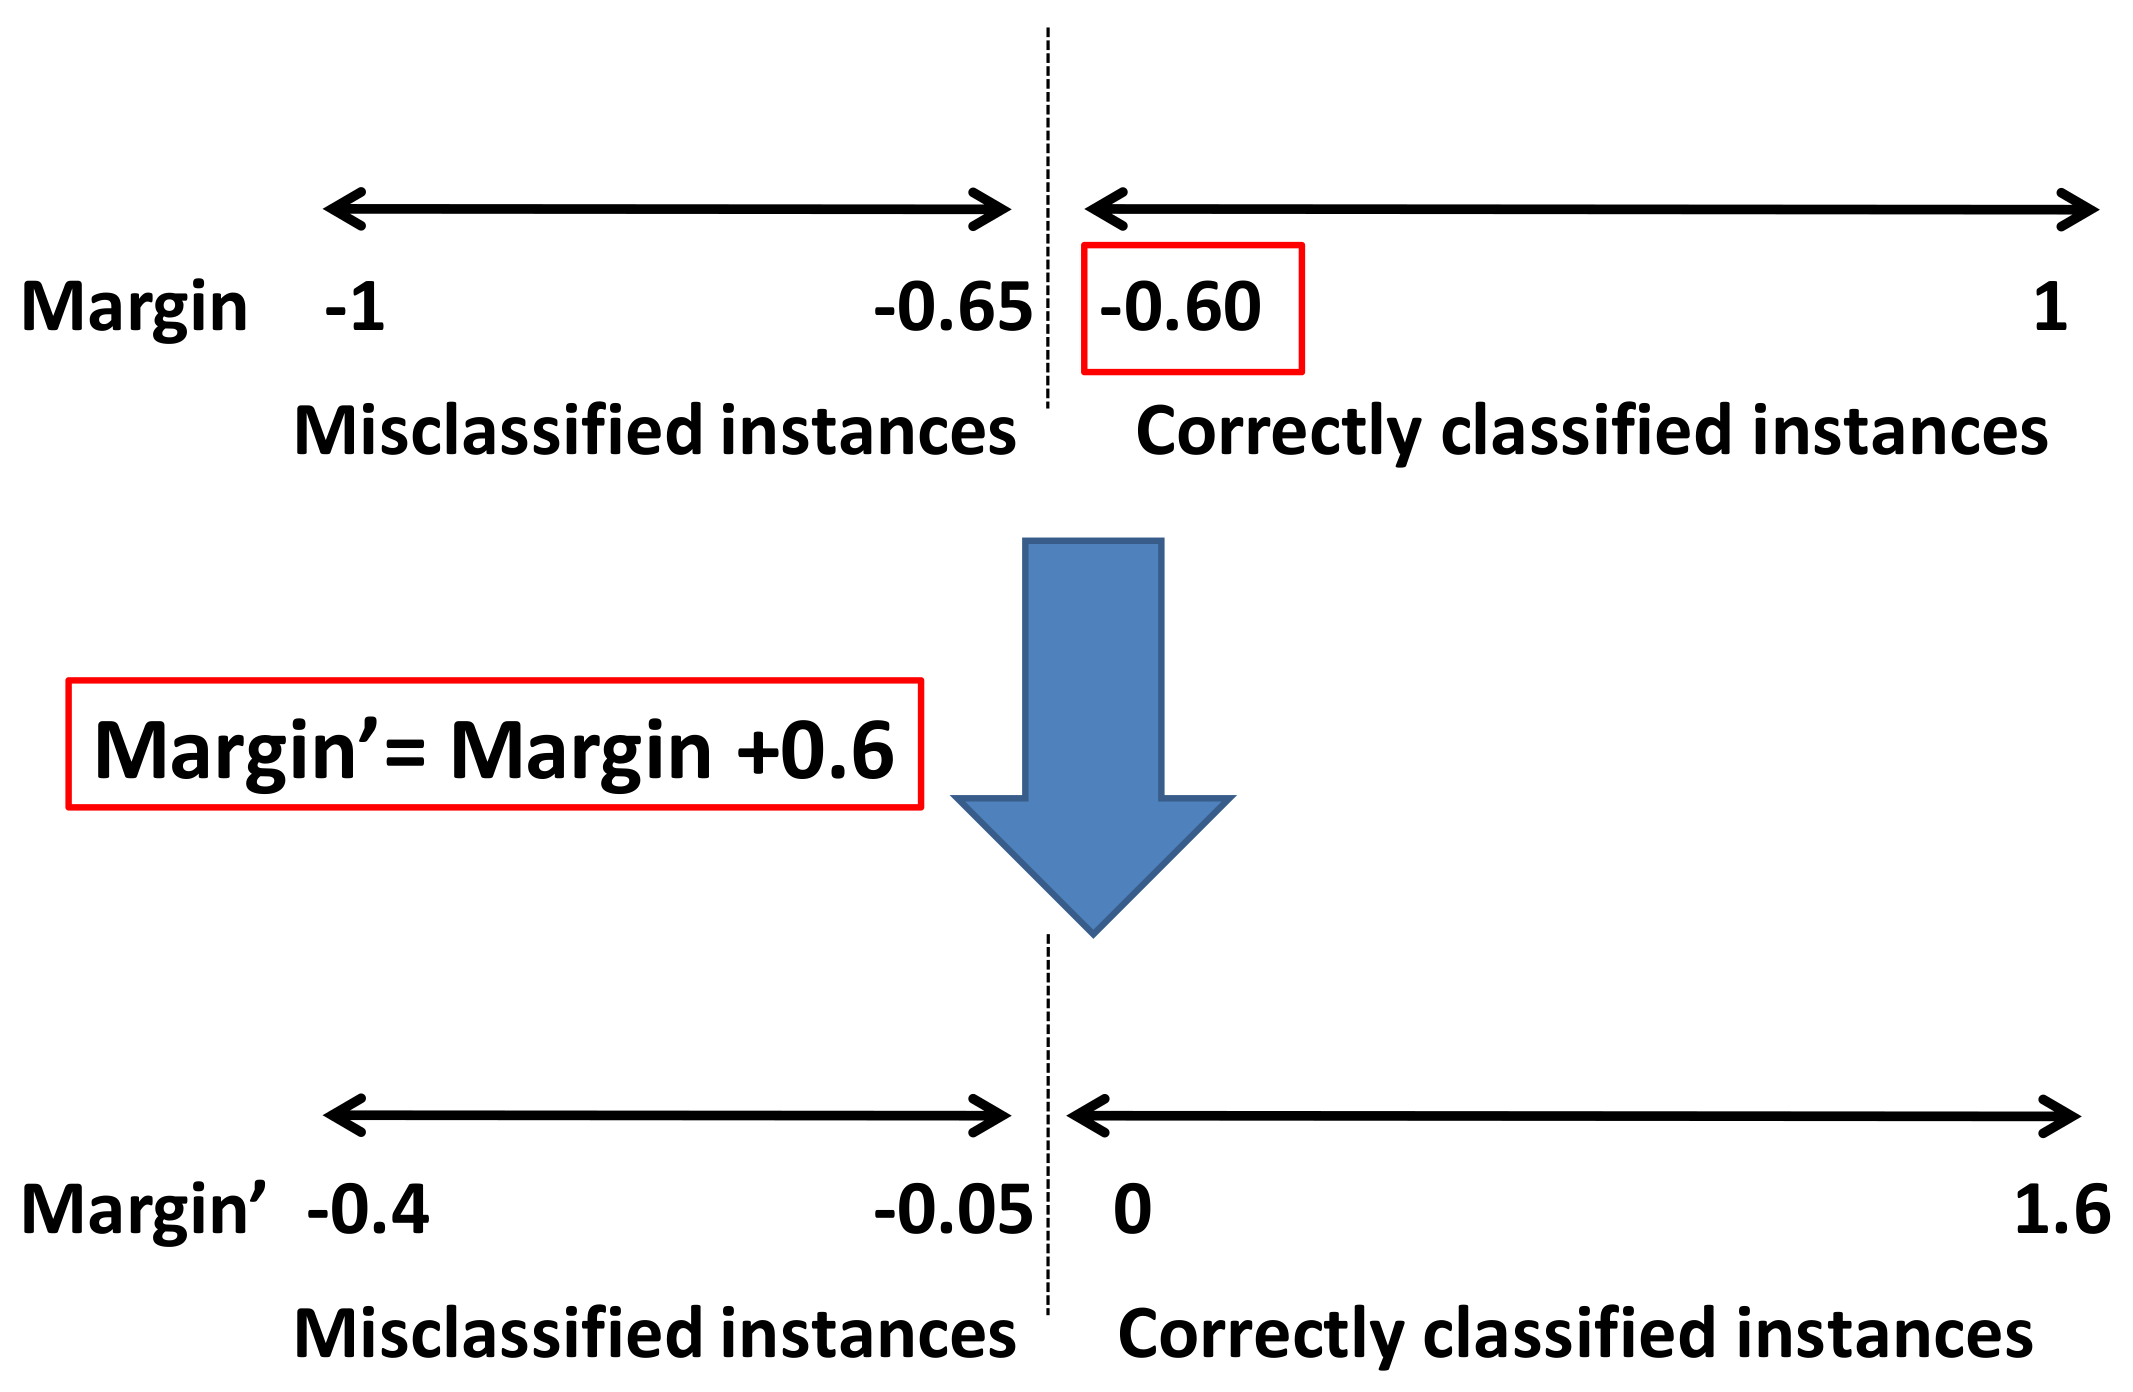
- The ensemble margin of a sample can also be obtained by the difference between the fraction of classifiers voting correctly and incorrectly, as in Equation (2) [69]. This second popular ensemble margin definition follows the same idea introduced by Schapire [27] but instead of using a max operation, it uses a sum operation [69].This ensemble margin is also in the range [, +1]. However, correctly classified samples do not necessarily have positive margin values.
- In this paper, we propose an unsupervised ensemble margin alternative defined as Equation (4), where is the votes number of the most voted class for sample x and T represents the number of base classifiers in the ensemble. The proposed margin is an unsupervised version of the classic sum-margin referred to as Equation (2); it does not require the true class label of instance x. Hence, it is potentially more robust to class noise. This new margin will be named as unsupervised sum-margin.The proposed margin also has the advantage of being considered as a classifier evaluation function or adopted for classifier design in unsupervised or semi-supervised ensemble learning.
3.2. Effect of Class Imbalance on Ensemble Margin Distribution
4. A Novel Bagging Method Based on Ensemble Margin
4.1. Ensemble Margin Based Data Ordering
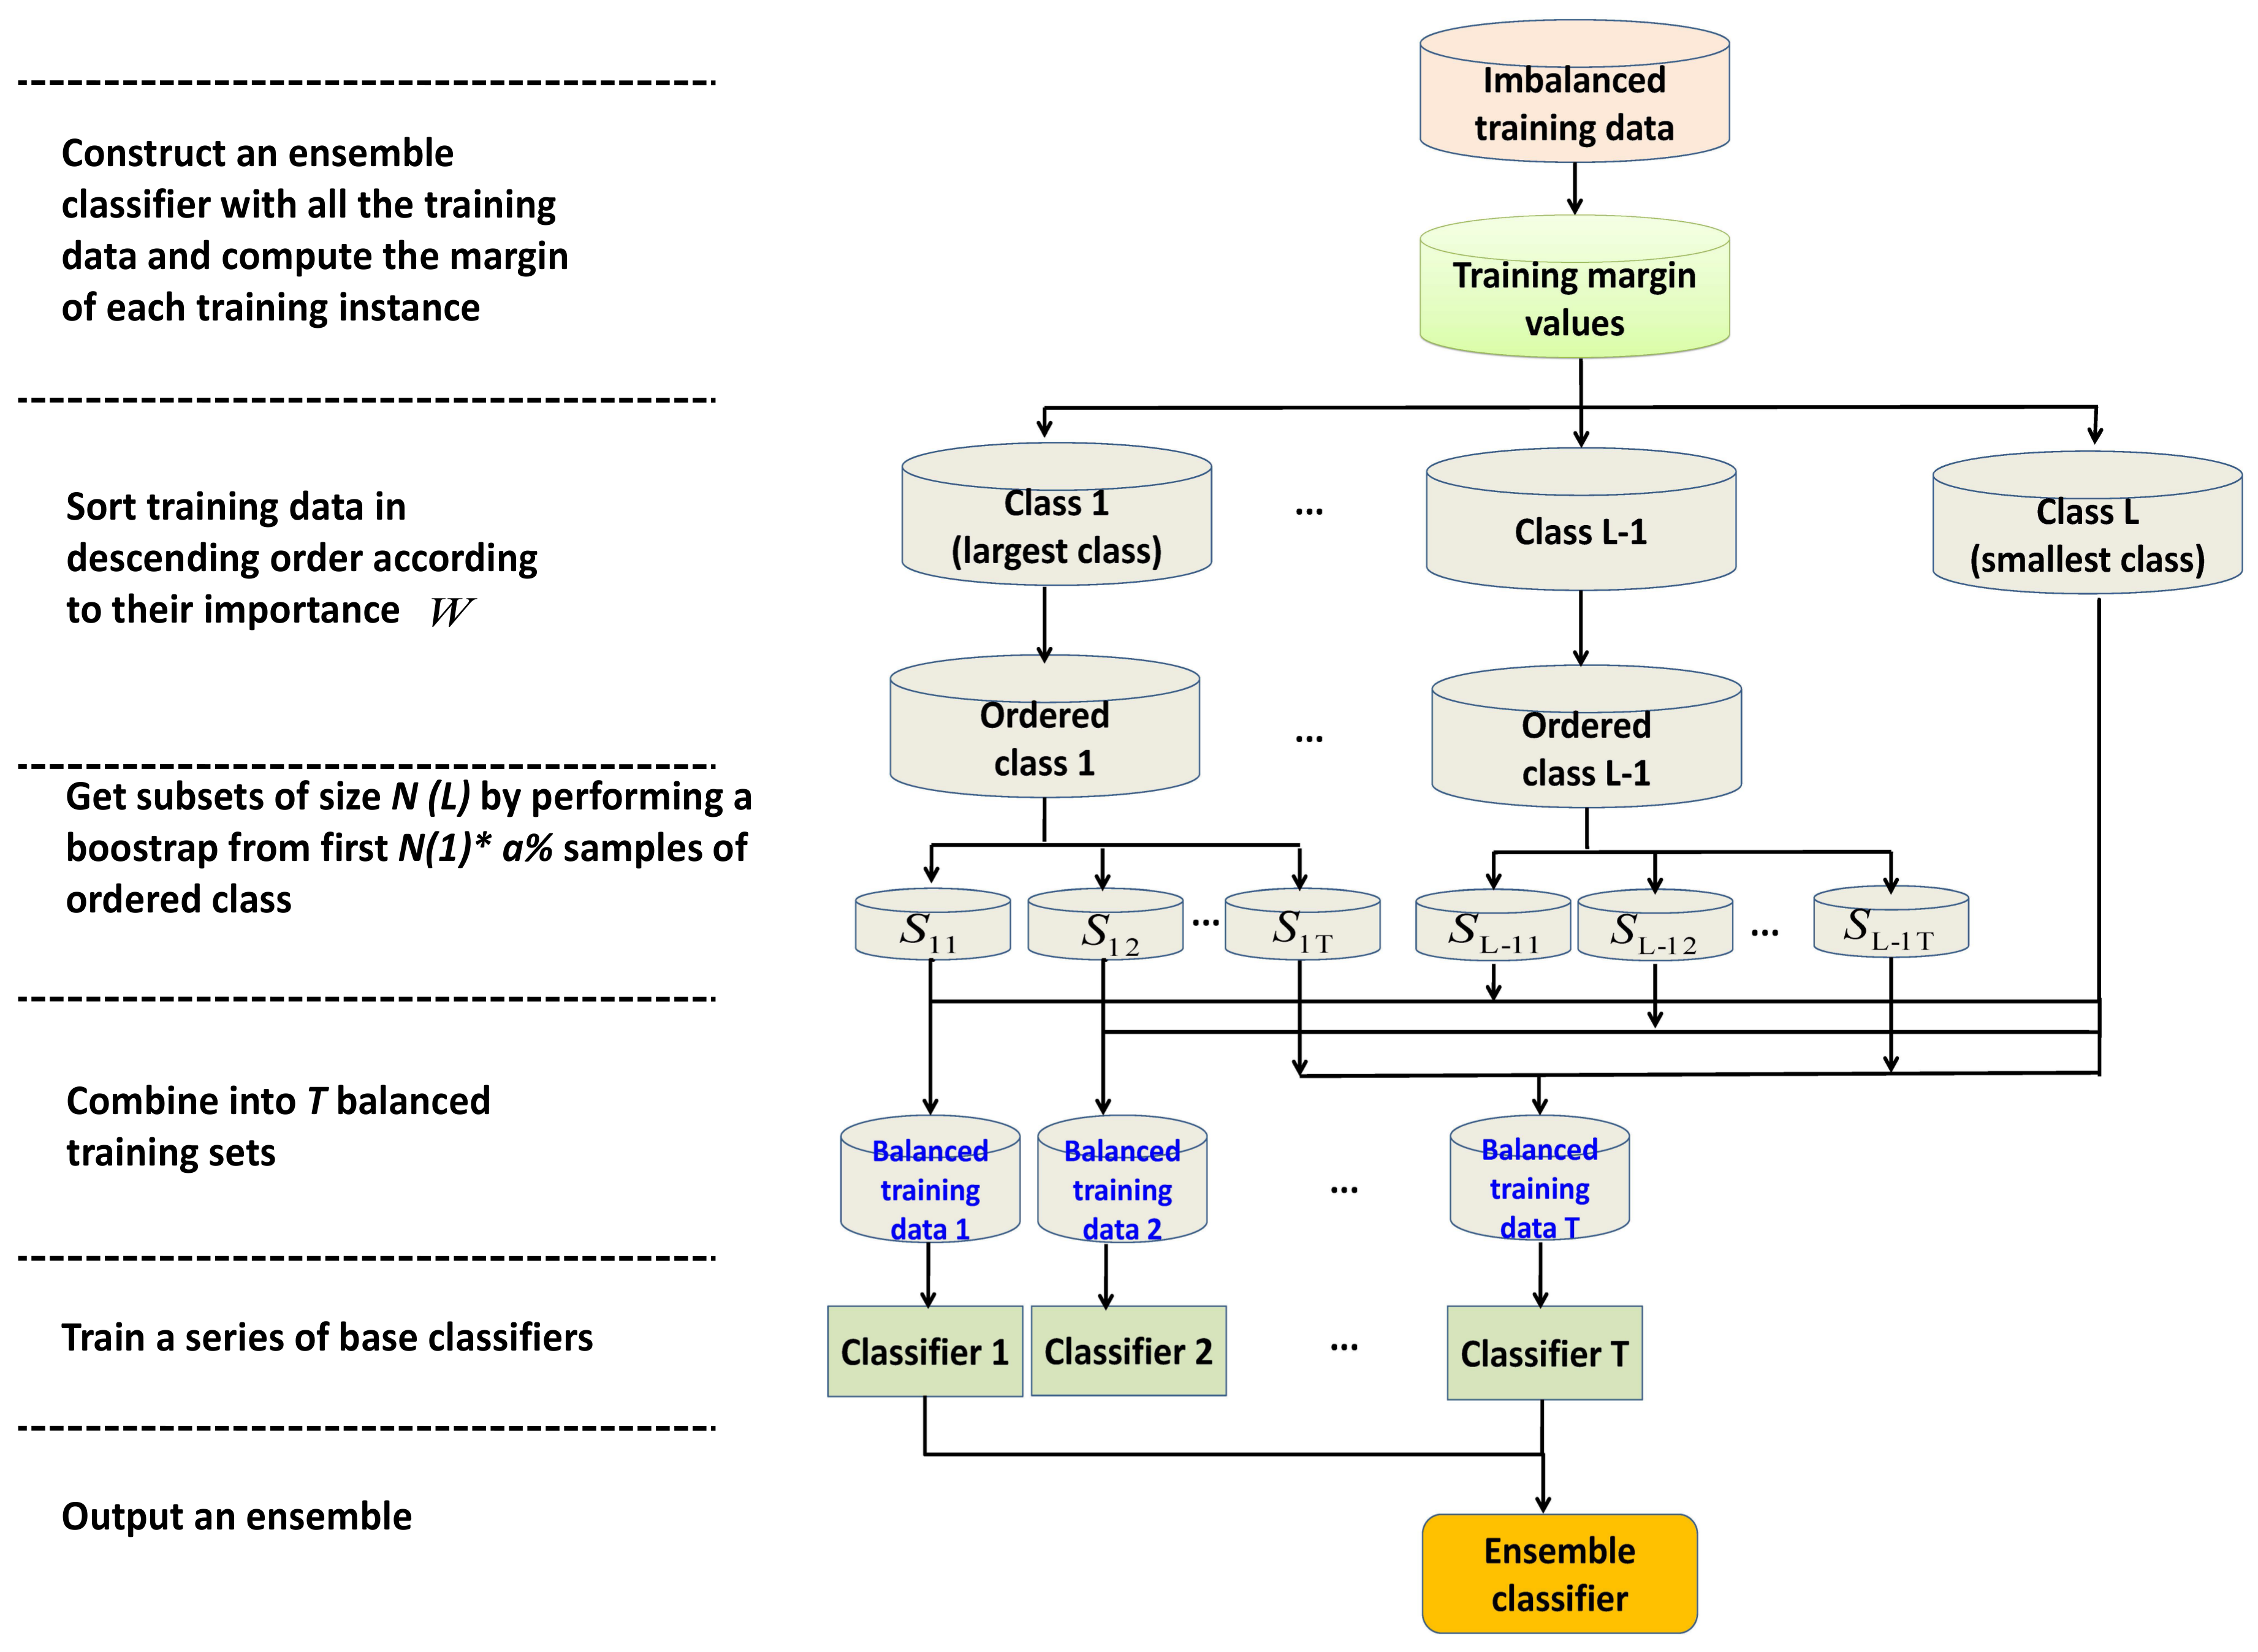
4.2. A Novel Bagging Method Based on Ensemble Margin
- Computing the ensemble margin values of the training samples via an ensemble classifier.
- Constructing balanced training subsets by focusing more on small margin instances.
- Training base classifiers on balanced training subsets and constructing a new ensemble with a better capability for imbalance learning.
| Algorithm 1: A novel ensemble margin based bagging method (MBagging). |
Training phase Inputs:
|
| Prediction phase Inputs:
|
5. Experimental Results
5.1. Data Sets
5.2. Experimental Setup
5.3. Evaluation Methods
- Recall, also called per class accuracy, is the percentage of instances correctly classified in each class. [10] strongly recommends using the dedicated performance measure to evaluate classification algorithms, especially when dealing with multi class imbalance problems. Let and represent the true prediction of the ith class and the false prediction of the ith class into jth class respectively. The per class accuracy for class i can be defined as (6).where L stands for the number of classes
- Average accuracy is a performance metric that gives the same weight to each of the classes of the problem, independently of the number of examples it has. It can be calculated as the following equation:
- F-Measure is one of the most frequently used measurements to evaluate the performance of an algorithm for imbalance data classification. It is a family of metrics that attempts to measure the trade-offs between precision, which measures how often an instance that was predicted as positive is actually positive, and recalls by outputting a single value that reflects the goodness of a classifier in the presence of rare classes [72].where can be computed by .
- KW Diversity [73] is a performance metric that gives the same weight to each of the classes of the problem, independently of the number of examples it has. It can be calculated as the following equation [69]:where diversity increases with KW variance, T is the size of the ensemble of classifiers, is the number of classifiers that correctly recognize sample , and N represents the number of samples.
5.4. Imbalance Learning Performance Comparative Analysis
5.4.1. Average Accuracy
5.4.2. F-Measure
5.4.3. Minimum Accuracy Per Class
5.4.4. Statistical Analysis of Results
5.4.5. Diversity
5.4.6. Time Complexity and Space Complexity
5.5. Influence of Model Parameters on Classification Performance
5.5.1. Influence of the Ensemble Size
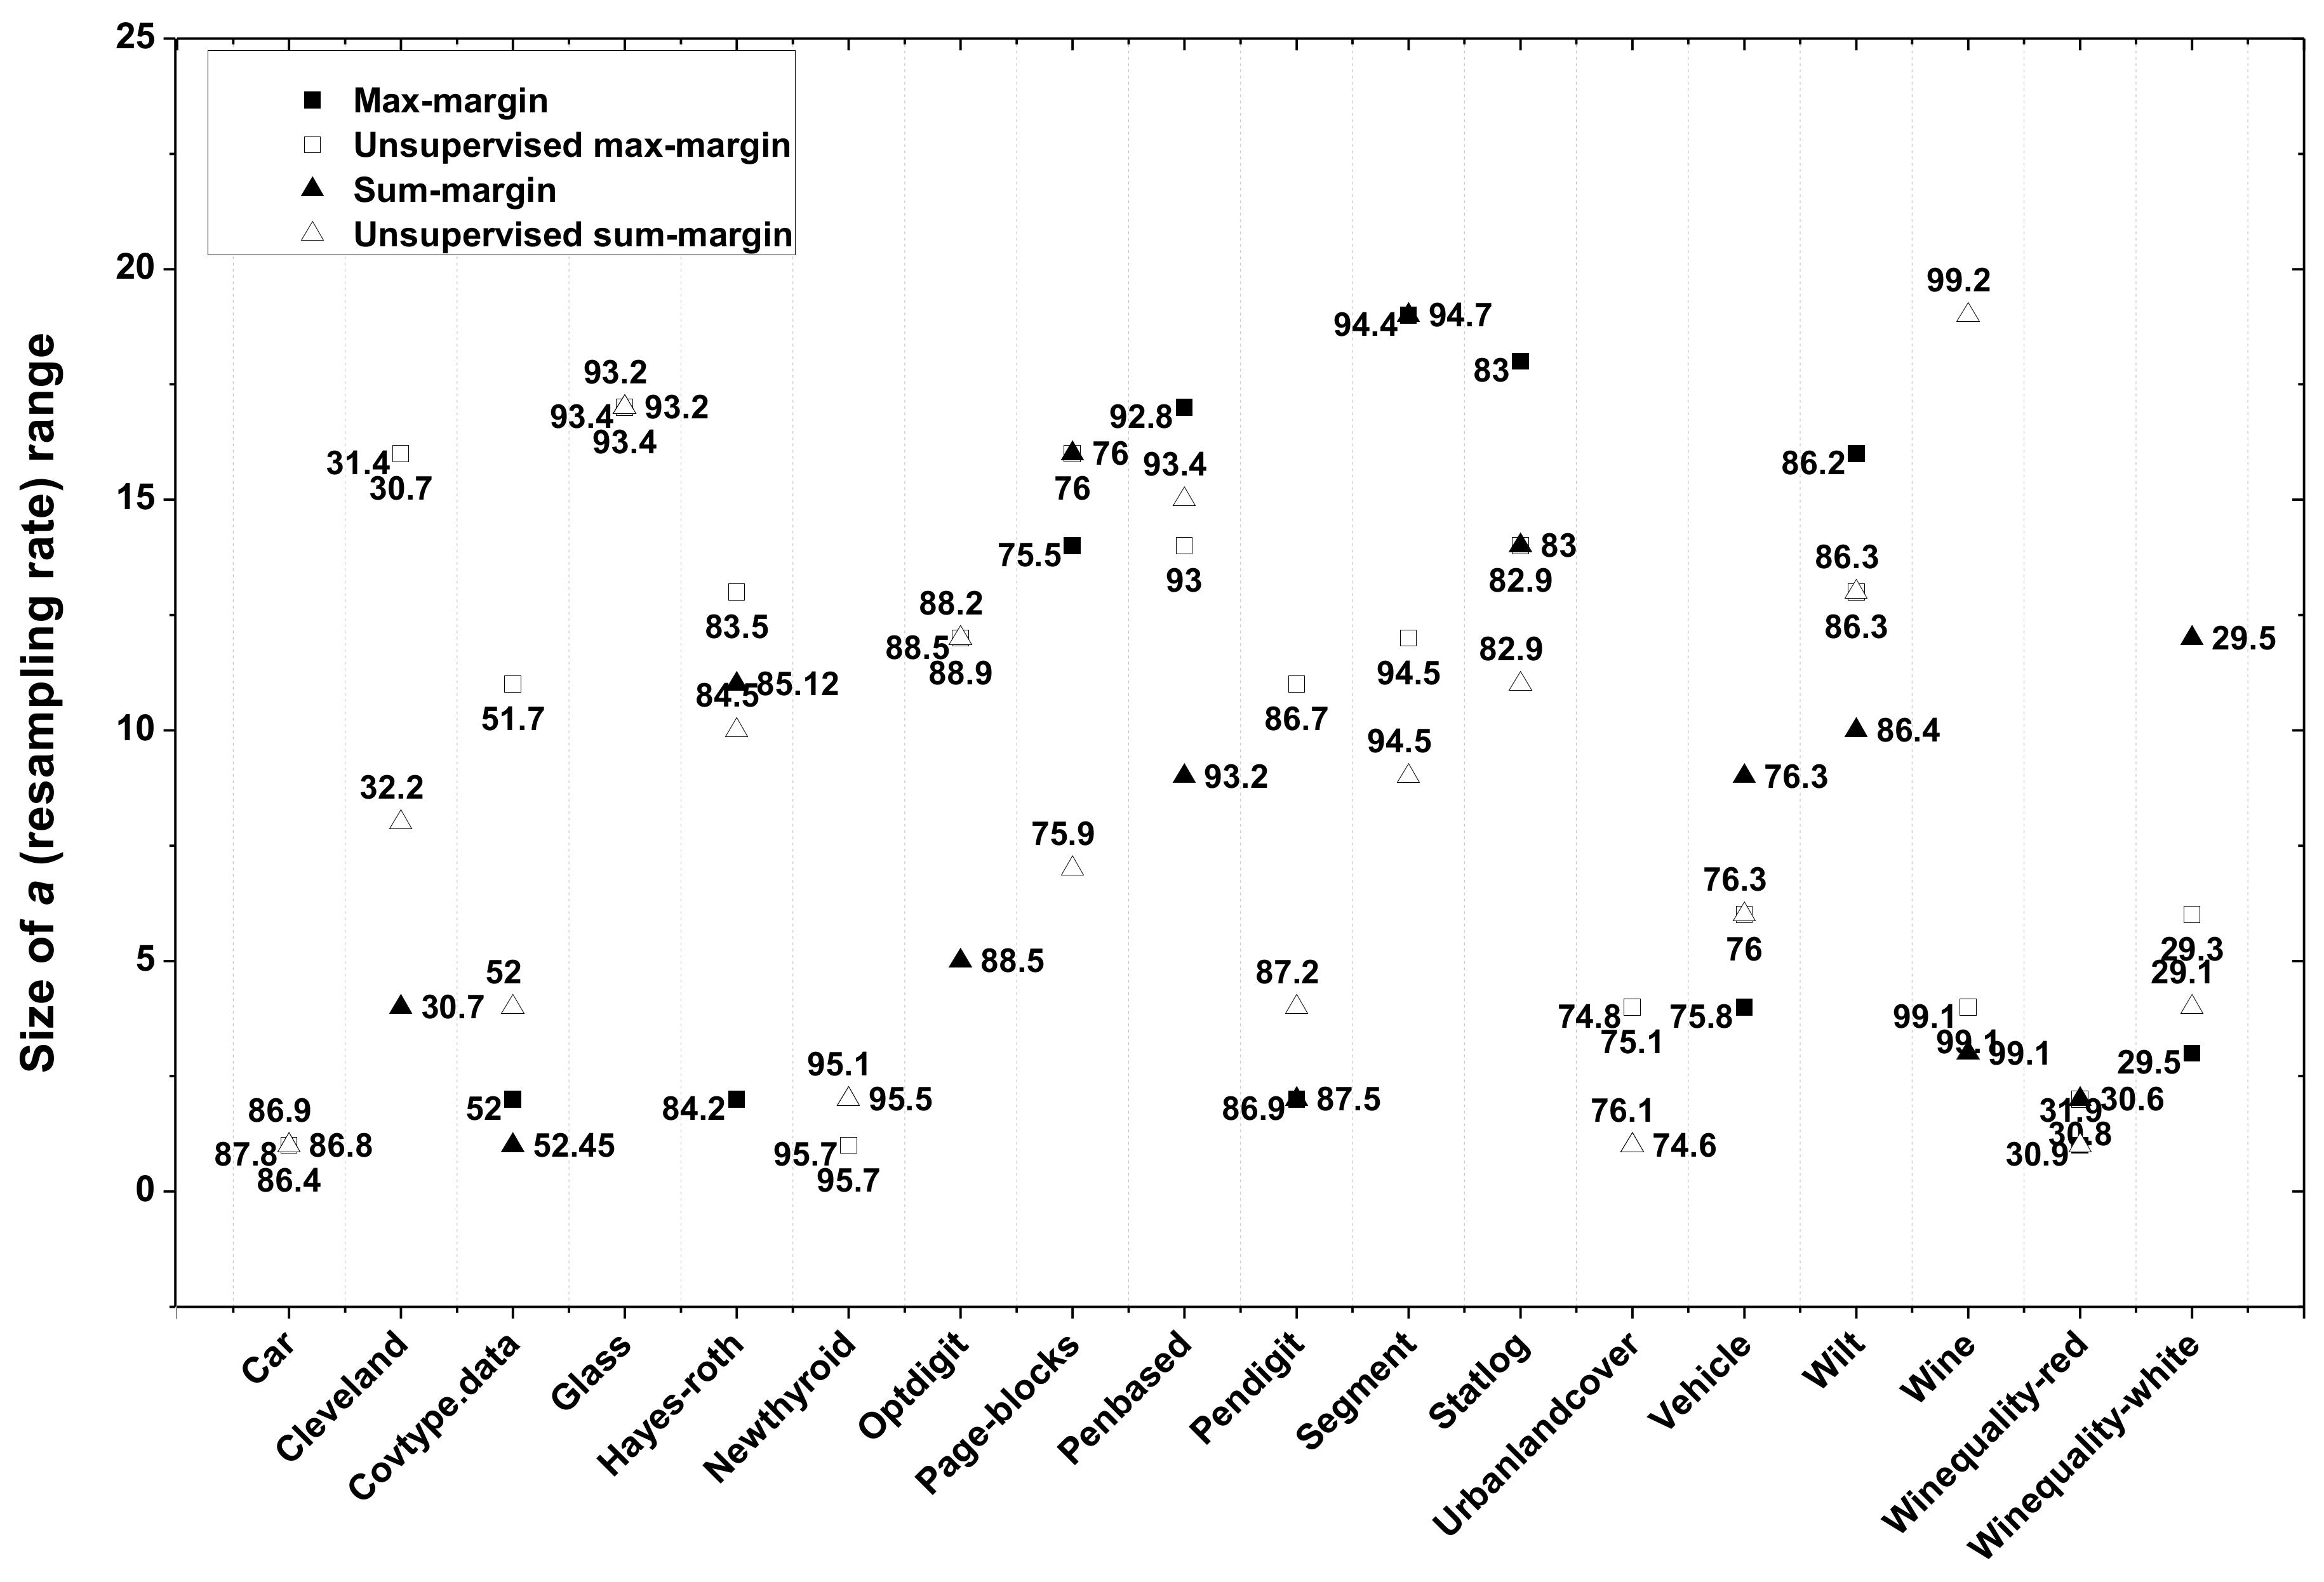
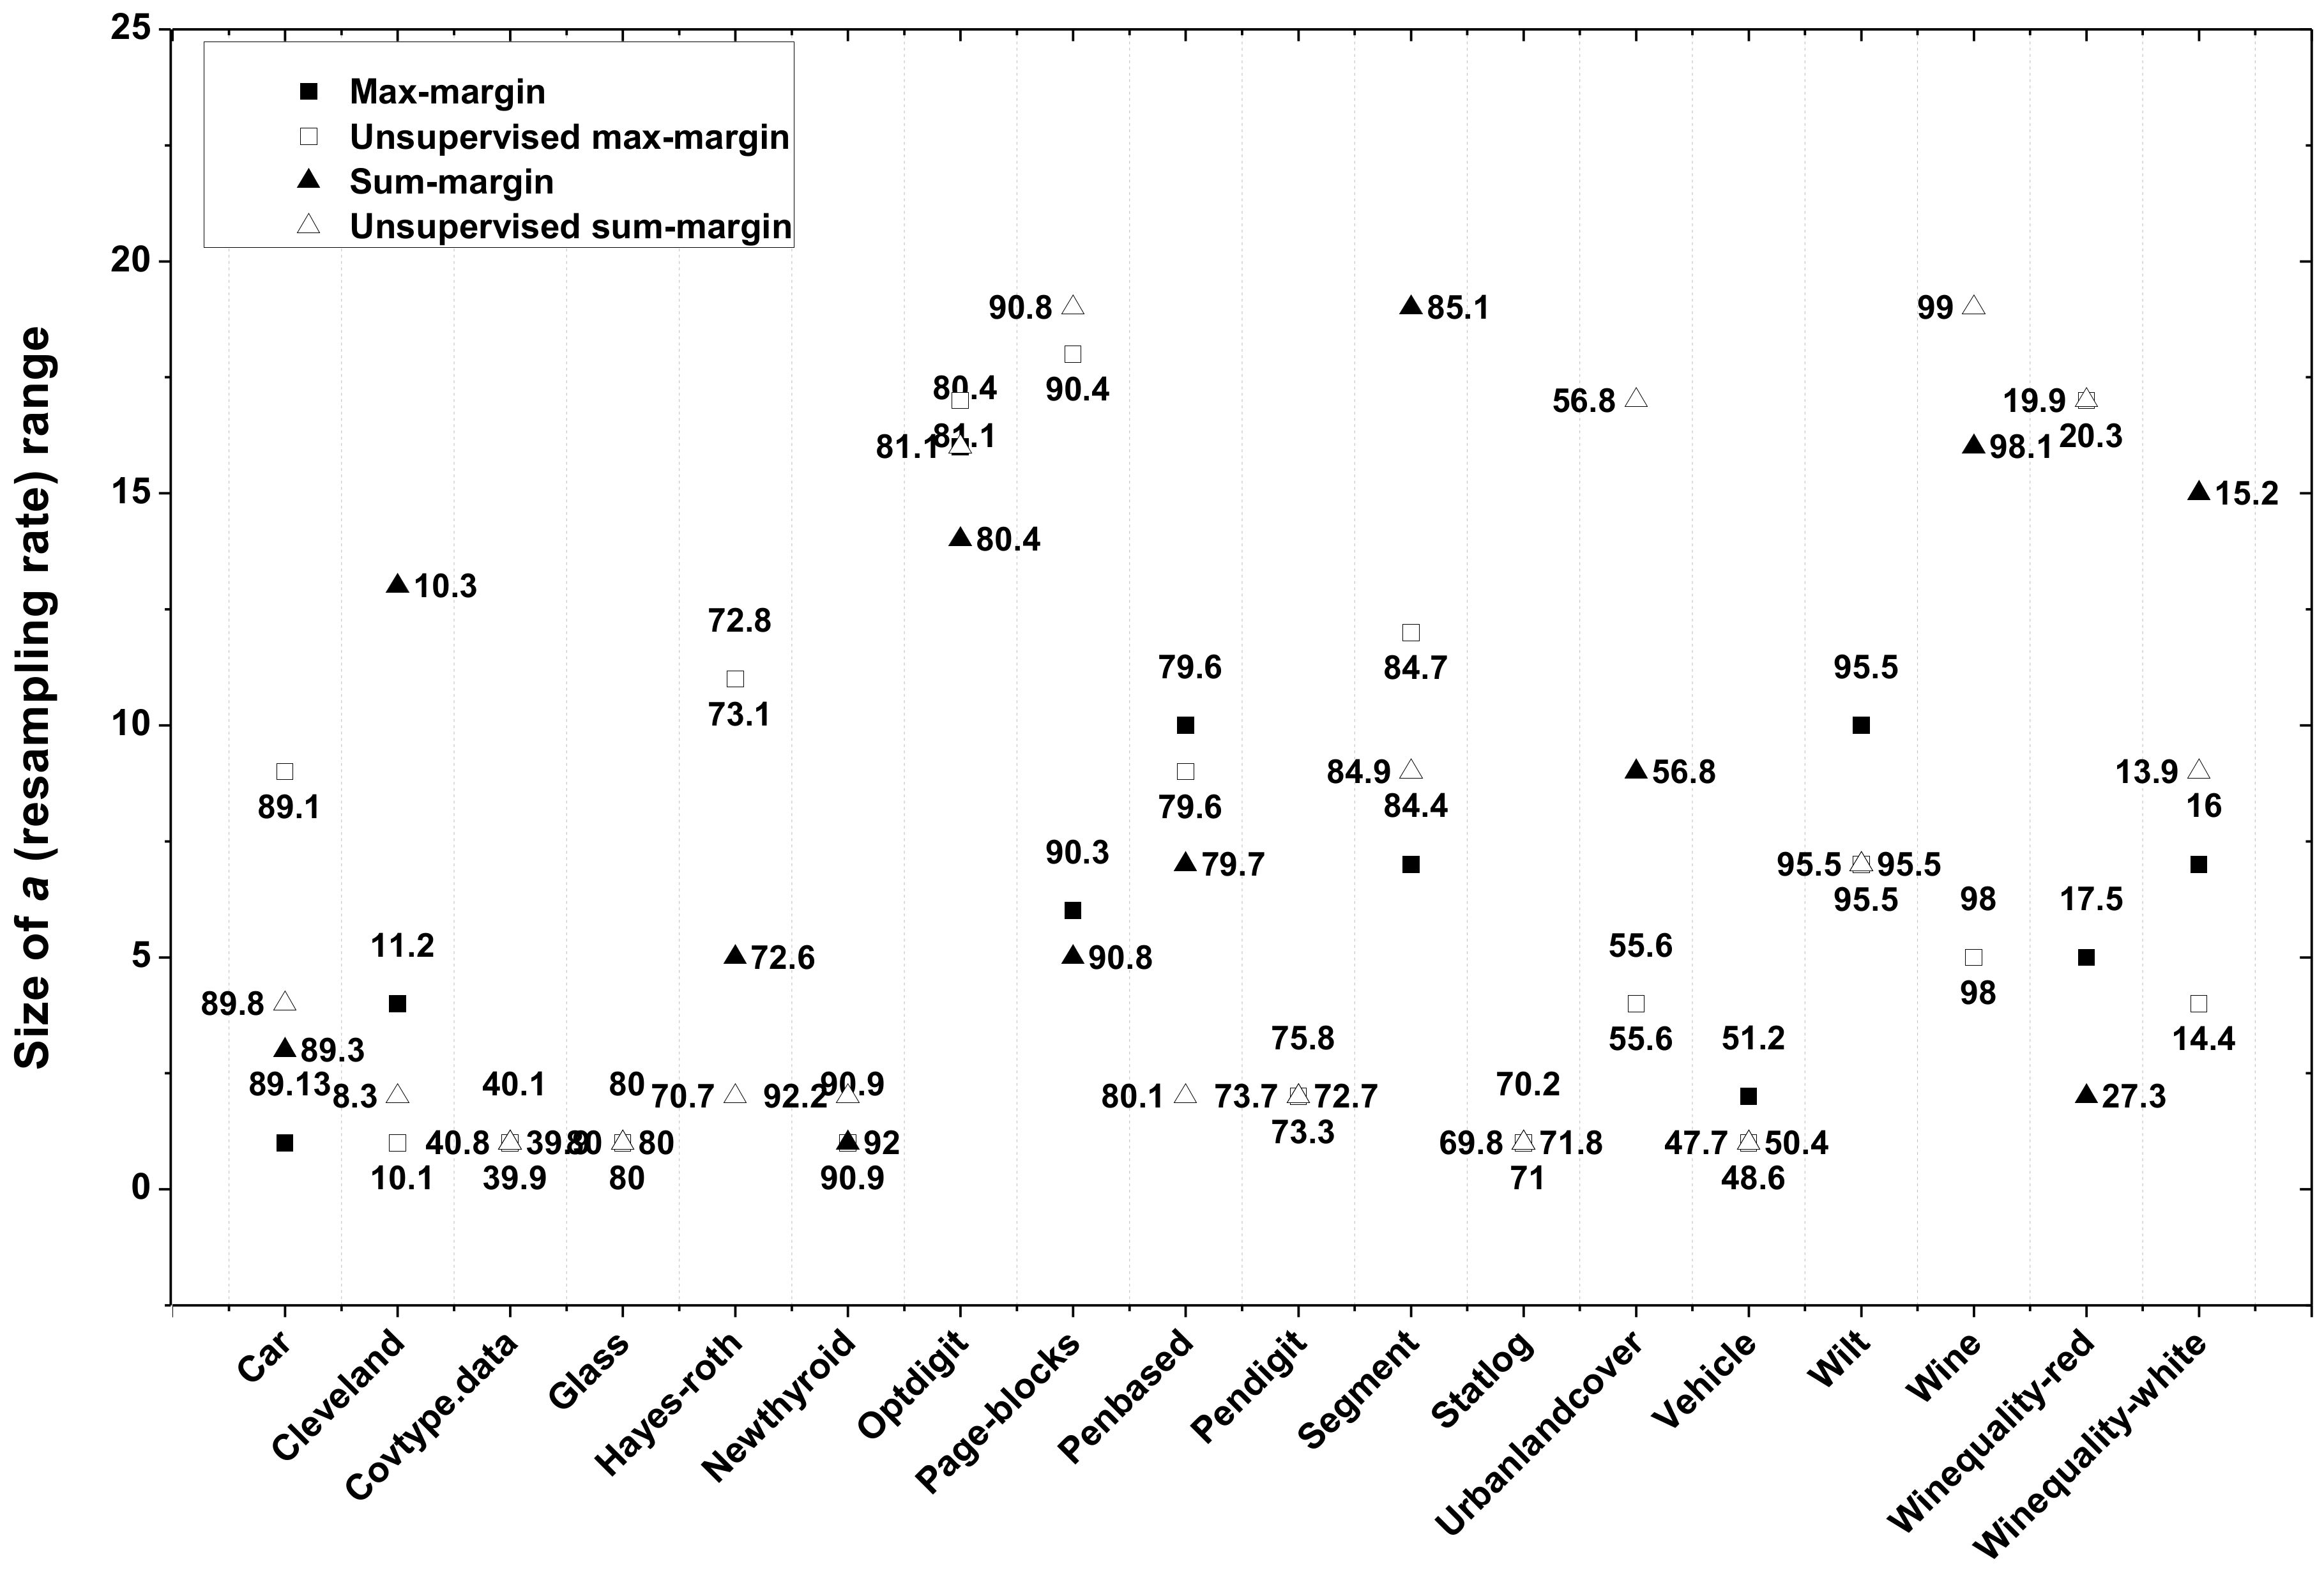
5.5.2. Influence of the Resampling Rate
6. Discussion
- Imbalanced classification can not be simply treated as a data redundancy problem. While our imbalance learning algorithm tries its utmost to achieve the main objective of imbalanced classification, improving a classifier’s recognition on minority class instances meanwhile keeping the accuracy of majority class from decreasing, it does not need to remove any instances from training set as in training data reduction algorithms.
- We have mentioned in the previous section that classic undersampling based ensemble approaches [56,77], such as UnderBagging [38], samples instances randomly from majority classes to achieve a balance ratio. However, in imbalance learning, not only the imbalance ratio needs to be considered, but also the quality of the sampled instances. Our method focuses more on class decision boundary and difficult instances (lower margin instances) which are more informative for imbalance learning while safe samples (higher margin instances) give less contribution.
- Most methods presented in the previous section such as [51,57] deal with binary imbalanced problems. Due to the difficult extension of these methods, class decomposition, such as One-vs-One (OVO) [48] or One-vs-All (OVA) [49], is the way to extend these methods to multi-class classification. However, those class decomposition based schemes are not suitable when a large number of classes is considered. The novel proposed method trains each base classifier with the most important instances selected from each class; hence, this method has better generalization ability for addressing both binary and multi-class imbalance problems.
- The change in ensemble diversity [78] depends on many factors, such as ensemble learning algorithm, size of training data set and training data complexity. Both the size and the distribution of the training set for constructing a base classifier are different in the margin ordering based bagging ensemble with respect to the original training set. Hence, our algorithm can result in increased diversity compared with the bagging built on original imbalanced data. Furthermore, under the condition of training base classifiers with a fixed amount of the training set, the employment of low margin instances can provide more diversity compared with random sampling involved in UnderBagging.
- Our algorithm selects important instances from each class according to their margin values and does not produce additional instances in the training process. Therefore, our method avoids the potential noise effect induced by new interpolated samples (SMOTE) which is difficultly addressed in SMOTEBagging [8].
7. Conclusions
Author Contributions
Acknowledgments
Conflicts of Interest
References
- Liu, Y.H.; Chen, Y.T. Total margin based adaptive fuzzy support vector machines for multiview face recognition. In Proceedings of the 2005 IEEE International Conference on Systems, Man and Cybernetics, Waikoloa, HI, USA, 10–12 October 2005; Volume 2, pp. 1704–1711. [Google Scholar]
- Munkhdalai, T.; Namsrai, O.E.; Ryu, K.H. Self-training in significance space of support vectors for imbalanced biomedical event data. BMC Bioinform. 2015, 16, 1–8. [Google Scholar] [CrossRef] [PubMed]
- Siers, M.; Islam, M.Z. Software defect prediction using a cost sensitive decision forest and voting, and a potential solution to the class imbalance problem. Inf. Syst. 2015, 51, 62–71. [Google Scholar] [CrossRef]
- Sun, T.; Jiao, L.; Feng, J.; Liu, F.; Zhang, X. Imbalanced Hyperspectral Image Classification Based on Maximum Margin. IEEE Geosci. Remote Sens. Lett. 2015, 12, 522–526. [Google Scholar] [CrossRef]
- Galar, M.; Fernandez, A.; Barrenechea, E.; Bustince, H.; Herrera, F. A Review on Ensembles for the Class Imbalance Problem: Bagging-, Boosting-, and Hybrid-Based Approaches. IEEE Trans. Syst. Man Cybern. Part C Appl. Rev. 2012, 42, 463–484. [Google Scholar] [CrossRef]
- Hu, S.G.; Liang, Y.F.; Ma, L.T.; He, Y. MSMOTE: Improving Classification Performance When Training Data is Imbalanced. In Proceedings of the 2009 Second International Workshop on Computer Science and Engineering, WCSE ’09, Washington, DC, USA, 28–30 October 2009; Volume 2, pp. 13–17. [Google Scholar]
- Japkowicz, N.; Stephen, S. The Class Imbalance Problem: A Systematic Study. Intell. Data Anal. 2002, 6, 429–449. [Google Scholar]
- Wang, S.; Yao, X. Diversity analysis on imbalanced data sets by using ensemble models. In Proceedings of the IEEE Symposium on Computational Intelligence and Data Mining, Nashville, TN, USA, 30 March–2 April 2009; pp. 324–331. [Google Scholar]
- Krawczyk, B. Learning from imbalanced data: Open challenges and future directions. Prog. Artif. Intell. 2016, 5, 221–232. [Google Scholar] [CrossRef]
- Sáez, J.A.; Krawczyk, B.; Woźniak, M. Analyzing the oversampling of different classes and types of examples in multi-class imbalanced datasets. Pattern Recognit. 2016, 57, 164–178. [Google Scholar] [CrossRef]
- He, H.B.; Garcia, E.A. Learning from Imbalanced Data. IEEE Trans. Knowl. Data Eng. 2009, 21, 1263–1284. [Google Scholar]
- García, S.; Herrera, F. Evolutionary Undersampling for Classification with Imbalanced Datasets: Proposals and Taxonomy. Evol. Comput. 2009, 17, 275–306. [Google Scholar] [CrossRef] [PubMed]
- Ling, C.X.; Sheng, V.S. Cost-sensitive Learning and the Class Imbalanced Problem. In Encyclopedia of Machine Learning; Sammut, C., Ed.; Springer: Berlin, Germany, 2008. [Google Scholar]
- Ertekin, S.; Huang, J.; Bottou, L.; Giles, C.L. Learning on the border: Active learning in imbalanced data classification. In Proceedings of the Sixteenth ACM Conference on Conference on Information and Knowledge Management, Lisbon, Portugal, 6–10 November 2007; pp. 127–136. [Google Scholar]
- Zhou, Z.; Liu, X.Y. Training cost-sensitive neural networks with methods addressing the class imbalance problem. IEEE Trans. Knowl. Data Eng. 2006, 18, 63–77. [Google Scholar] [CrossRef]
- Sun, Y.; Kamel, M.S.; Wong, A.K.; Wang, Y. Cost-sensitive boosting for classification of imbalanced data. Pattern Recognit. 2007, 40, 3358–3378. [Google Scholar] [CrossRef]
- Vapnik, V. The Nature of Statistical Learning Theory; Springer: New York, NY, USA, 1995. [Google Scholar]
- Ding, S.; Mirza, B.; Lin, Z.; Cao, J.; Lai, X.; Nguyen, T.V.; Sepulveda, J. Kernel based online learning for imbalance multiclass classification. Neurocomputing 2018, 277, 139–148. [Google Scholar] [CrossRef]
- Burges, C.J.C. A Tutorial on Support Vector Machines for Pattern Recognition. Data Min. Knowl. Discov. 1998, 2, 121–167. [Google Scholar] [CrossRef]
- Akbani, R.; Kwek, S.; Japkowicz, N. Applying Support Vector Machines to Imbalanced Datasets. In Machine Learning: ECML 2004: 15th European Conference on Machine Learning, Pisa, Italy, September 20–24, 2004, Proceedings; Boulicaut, J.F., Esposito, F., Giannotti, F., Pedreschi, D., Eds.; Springer: Berlin/Heidelberg, Germany, 2004; pp. 39–50. [Google Scholar]
- Fan, X.N.; Tang, K.; Weise, T. Margin-Based Over-Sampling Method for Learning from Imbalanced Datasets. In Advances in Knowledge Discovery and Data Mining; Springer: Berlin/Heidelberg, Germany, 2011; Volume 6635, pp. 309–320. [Google Scholar]
- Qian, Y.; Liang, Y.; Li, M.; Feng, G.; Shi, X. A resampling ensemble algorithm for classification of imbalance problems. Neurocomputing 2014, 143, 57–67. [Google Scholar] [CrossRef]
- Liu, T.Y. EasyEnsemble and Feature Selection for Imbalance Data Sets. In Proceedings of the 2009 International Joint Conference on Bioinformatics, Systems Biology and Intelligent Computing, IJCBS ’09, Washington, DC, USA, 3–5 August 2009; pp. 517–520. [Google Scholar]
- Feng, W.; Bao, W. Weight-Based Rotation Forest for Hyperspectral Image Classification. IEEE Geosci. Remote Sens. Lett. 2017, 14, 2167–2171. [Google Scholar] [CrossRef]
- Khoshgoftaar, T.M.; Fazelpour, A.; Dittman, D.J.; Napolitano, A. Ensemble vs. Data Sampling: Which Option Is Best Suited to Improve Classification Performance of Imbalanced Bioinformatics Data? In Proceedings of the IEEE 27th International Conference on Tools with Artificial Intelligence (ICTAI), Vietri sul Mare, Italy, 9–11 November 2015; pp. 705–712. [Google Scholar]
- Blaszczyński, J.; Stefanowski, J. Neighbourhood sampling in bagging for imbalanced data. Neurocomputing 2015, 150, 529–542. [Google Scholar] [CrossRef]
- Schapire, R.E.; Freund, Y.; Bartlett, P.; Lee, W.S. Boosting the Margin: A New Explanation for the Effectiveness of Voting Methods. Ann. Stat. 1998, 26, 1651–2080. [Google Scholar] [CrossRef]
- Hu, Q.; Li, L.; Wu, X.; Schaefer, G.; Yu, D. Exploiting diversity for optimizing margin distribution in ensemble learning. Knowl. Based Syst. 2014, 67, 90–104. [Google Scholar] [CrossRef]
- Cantador, I.; Dorronsoro, J. Boosting Parallel Perceptrons for Label Noise Reduction in Classification Problems. In Artificial Intelligence and Knowledge Engineering Applications: A Bioinspired Approach; Springer: Berlin/Heidelberg, Germany, 2005; Volume 3562, pp. 586–593. [Google Scholar]
- Feng, W. Investigation of Training Data Issues in Ensemble Classification Based on Margin Concept: Application to Land Cover Mapping. Ph.D. Thesis, University of Bordeaux Montaigne, Pessac, France, 2017. [Google Scholar]
- Feng, W.; Boukir, S. Class noise removal and correction for image classification using ensemble margin. In Proceedings of the 2015 IEEE International Conference on Image Processing (ICIP), Quebec City, QC, Canada, 27–30 September 2015; pp. 4698–4702. [Google Scholar]
- Feng, W.; Boukir, S.; Guo, L. Identification and correction of mislabeled training data for land cover classification based on ensemble margin. In Proceedings of the IEEE International, Geoscience and Remote Sensing Symposium (IGARSS), Milan, Italy, 26–31 July 2015; pp. 4991–4994. [Google Scholar]
- Marchiori, E. Class Conditional Nearest Neighbor for Large Margin Instance Selection. IEEE Trans. Pattern Anal. Mach. Intell. 2010, 32, 364–370. [Google Scholar] [CrossRef] [PubMed]
- Alshawabkeh, M. Hypothesis Margin Based Weighting for Feature Selection Using Boosting: Theory, Algorithms and Applications. Ph.D. Thesis, Northeastern University, Boston, MA, USA, 2013. [Google Scholar]
- Gao, W.; Zhou, Z.H. The kth, Median and Average Margin Bounds for AdaBoost. CoRR (Comput. Res. Repos.) arXiv, 2010; arXiv:abs/1009.3613. [Google Scholar]
- Li, L.J.; Zou, B.; Hu, Q.H.; Wu, X.Q.; Yu, D.R. Dynamic classifier ensemble using classification confidence. Neurocomputing 2013, 99, 581–591. [Google Scholar] [CrossRef]
- Xie, Z.X.; Xu, Y.; Hu, Q.H.; Zhu, P.F. Margin distribution based bagging pruning. Neurocomputing 2012, 85, 11–19. [Google Scholar] [CrossRef]
- Barandela, R.; Sánchez, J.S.; Valdovinos, R.M. New Applications of Ensembles of Classifiers. Pattern Anal. Appl. 2003, 6, 245–256. [Google Scholar] [CrossRef]
- Estabrooks, A.; Jo, T.; Japkowicz, N. A Multiple Resampling Method for Learning from Imbalanced Data Sets. Comput. Intell. 2004, 20, 18–36. [Google Scholar] [CrossRef]
- Chawla, N.V.; Bowyer, K.W.; Hall, L.O.; Kegelmeyer, W.P. SMOTE: Synthetic Minority Over-sampling Technique. J. Artif. Int. Res. 2002, 16, 321–357. [Google Scholar]
- Batista, G.E.A.P.A.; Prati, R.C.; Monard, M.C. A Study of the Behavior of Several Methods for Balancing Machine Learning Training Data. SIGKDD Explor. Newsl. 2004, 6, 20–29. [Google Scholar] [CrossRef]
- Fernández, A.; García, S.; Herrera, F. Addressing the Classification with Imbalanced Data: Open Problems and New Challenges on Class Distribution. In Hybrid Artificial Intelligent Systems: Proceedings of the HAIS 2011 6th International Conference, Wroclaw, Poland, 23–25 May 2011; Corchado, E., Kurzyński, M., Woźniak, M., Eds.; Springer: Berlin/Heidelberg, Germmany, 2011; Part I; pp. 1–10. [Google Scholar]
- Zhang, J.; Mani, I. KNN Approach to Unbalanced Data Distributions: A Case Study Involving Information Extraction. In Proceedings of the ICML’2003 Workshop on Learning from Imbalanced Datasets, Washington, DC, USA, 21 August 2003. [Google Scholar]
- Mease, D.; Wyner, A.J.; Buja, A. Boosted Classification Trees and Class Probability/Quantile Estimation. J. Mach. Learn. Res. 2007, 8, 409–439. [Google Scholar]
- Fernández, A.; López, V.; Galar, M.; del Jesus, M.J.; Herrera, F. Analysing the classification of imbalanced data-sets with multiple classes: Binarization techniques and ad-hoc approaches. Knowl. Based Syst. 2013, 42, 97–110. [Google Scholar] [CrossRef]
- Mellor, A.; Boukir, S.; Haywood, A.; Jones, S. Exploring issues of training data imbalance and mislabelling on random forest performance for large area land cover classification using the ensemble margin. J. Photogramm. Remote Sens. 2015, 105, 155–168. [Google Scholar] [CrossRef]
- Wang, S.; Yao, X. Multiclass Imbalance Problems: Analysis and Potential Solutions. IEEE Trans. Syst. Man Cybern. Part B (Cybern.) 2012, 42, 1119–1130. [Google Scholar] [CrossRef] [PubMed]
- Hastie, T.; Batista, G.E. Classification by pairwise coupling. Ann. Stat. 1998, 26, 451–471. [Google Scholar] [CrossRef]
- Rifkin, R.; Klautau, A. In Defense of One-Vs-All Classification. J. Mach. Learn. Res. 2004, 5, 101–141. [Google Scholar]
- Liu, X.Y.; Zhou, Z.H. Ensemble Methods for Class Imbalance Learning. In Imbalanced Learning: Foundations, Algorithms, and Applications; He, H., Ma, Y., Eds.; Wiley: New York, NY, USA, 2013; pp. 61–82. [Google Scholar]
- Chawla, N.V.; Lazarevic, A.; Hall, L.O.; Bowyer, K.W. SMOTEBoost: Improving Prediction of the Minority Class in Boosting. In Knowledge Discovery in Databases: PKDD 2003; Springer: Berlin/Heidelberg, 2003; Volume 2838, pp. 107–119. [Google Scholar]
- Thanathamathee, P.; Lursinsap, C. Handling imbalanced data sets with synthetic boundary data generation using bootstrap re-sampling and AdaBoost techniques. Pattern Recognit. Lett. 2013, 34, 1339–1347. [Google Scholar] [CrossRef]
- Wattanachon, U.; Lursinsap, C. SPSM: A new hybrid data clustering algorithm for nonlinear data analysis. Int. J. Pattern Recognit. Artif. Intell. 2009, 23, 1701–1737. [Google Scholar] [CrossRef]
- Efron, B.; Tibshirani, R. Bootstrap Methods for Standard Errors, Confidence Intervals, and Other Measures of Statistical Accuracy. Stat. Sci. 1986, 1, 54–75. [Google Scholar] [CrossRef]
- Haykin, S. Neural Networks: A Comprehensive Foundation, 2nd ed.; Prentice Hall PTR: Upper Saddle River, NJ, USA, 1998. [Google Scholar]
- Seiffert, C.; Khoshgoftaar, T.M.; Hulse, J.V.; Napolitano, A. RUSBoost: A Hybrid Approach to Alleviating Class Imbalance. IEEE Trans. Syst. Man Cybern. Part A Syst. Hum. 2010, 40, 185–197. [Google Scholar] [CrossRef]
- Díez-Pastor, J.; Rodríguez, J.; García-Osorio, C.; Kuncheva, L.I. Random Balance: Ensembles of variable priors classifiers for imbalanced data. Knowl. Based Syst. 2015, 85, 96–111. [Google Scholar] [CrossRef]
- Díez-Pastor, J.F.; Rodríguez, J.J.; García-Osorio, C.I.; Kuncheva, L.I. Diversity Techniques Improve the Performance of the Best Imbalance Learning Ensembles. Inf. Sci. 2015, 325, 98–117. [Google Scholar] [CrossRef]
- Galar, M.; Fernández, A.; Barrenechea, E.; Herrera, F. EUSBoost: Enhancing ensembles for highly imbalanced data-sets by evolutionary undersampling. Pattern Recognit. 2013, 46, 3460–3471. [Google Scholar] [CrossRef]
- Nikulin, V.; McLachlan, G.J.; Ng, S.K. Ensemble Approach for the Classification of Imbalanced Data. In AI 2009: Advances in Artificial Intelligence: Proceedings of the 22nd Australasian Joint Conference, Melbourne, Australia, 1–4 December 2009; Nicholson, A., Li, X., Eds.; Springer: Berlin/Heidelberg, Germany, 2009; pp. 291–300. [Google Scholar]
- Jin, R.; Zhang, J. Multi-Class Learning by Smoothed Boosting. Mach. Learn. 2007, 67, 207–227. [Google Scholar] [CrossRef]
- Khoshgoftaar, T.M.; Hulse, J.V.; Napolitano, A. Comparing Boosting and Bagging Techniques with Noisy and Imbalanced Data. IEEE Trans. Syst. Man Cybern. Part A Syst. Hum. 2011, 41, 552–568. [Google Scholar] [CrossRef]
- Blaszczyński, J.; Stefanowski, J.; Idkowiak, L. Extending Bagging for Imbalanced Data. In Proceeding of the Eighth CORES (Core Ordering and Reporting Enterprise System), Springer Series on Advances in Intelligent Systems and Computing; Springer: Berlin/Heidelberg, Germany, 2013; Volume 226, pp. 269–278. [Google Scholar]
- Nejatian, S.; Parvin, H.; Faraji, E. Using sub-sampling and ensemble clustering techniques to improve performance of imbalanced classification. Neurocomputing 2018, 276, 55–66. [Google Scholar] [CrossRef]
- Hido, S.; Kashima, H.; Takahashi, Y. Roughly Balanced Bagging for Imbalanced Data. Stat. Anal. Data Min. 2009, 2, 412–426. [Google Scholar] [CrossRef]
- Nanni, L.; Fantozzi, C.; Lazzarini, N. Coupling different methods for overcoming the class imbalance problem. Neurocomputing 2015, 158, 48–61. [Google Scholar] [CrossRef]
- Park, Y.; Ghosh, J. Ensembles of (alpha)-Trees for Imbalanced Classification Problems. IEEE Trans. Knowl. Data Eng. 2014, 26, 131–143. [Google Scholar] [CrossRef]
- Crammer, K.; Gilad-bachrach, R.; Navot, A.; Tishby, N. Margin Analysis of the LVQ Algorithm. Advances in Neural Information Processing Systems; MIT Press: Cambridge, MA, USA, 2002; pp. 462–469. [Google Scholar]
- Kapp, M.; Sabourin, R.; Maupin, P. An empirical study on diversity measures and margin theory for ensembles of classifiers. In Proceedings of the 10th International Conference on Information Fusion, Quebec City, QC, Canada, 9–12 July 2007; pp. 1–8. [Google Scholar]
- Guo, L.; Boukir, S. Margin-based ordered aggregation for ensemble pruning. Pattern Recognit. Lett. 2013, 34, 603–609. [Google Scholar] [CrossRef]
- Breiman, L. Bias, Variance, and Arcing Classifiers; Technical Report 460; Statistics Department, University of California at Berkeley: Berkeley, CA, USA, 1996. [Google Scholar]
- Davis, J.; Goadrich, M. The Relationship Between Precision-Recall and ROC Curves. In Proceedings of the 23rd International Conference on Machine Learning, ICML ’06, Pennsylvania, PA, USA, 25–29 June 2006; pp. 233–240. [Google Scholar]
- Kohavi, R.; Wolpert, D.H. Bias Plus Variance Decomposition for Zero-One Loss Functions. In Proceedings of the Thirteenth International on Machine Learning; Morgan Kaufmann Publishers: San Mateo, CA, USA, 1996; pp. 275–283. [Google Scholar]
- Demsar, J. Statistical comparisons of classifiers over multiple data sets. J. Mach. Learn. Res. 2006, 7, 1–30. [Google Scholar]
- Garcia, S.; Herrera, F. An Extension on “Statistical Comparisons of Classifiers over Multiple Data Sets” for all Pairwise Comparisons. J. Mach. Learn. Res. 2008, 9, 2677–2694. [Google Scholar]
- Karimi, H.A. (Ed.) Big Data: Techniques and Technologies in Geoinformatics; CRC Press: Boca Raton, FL, USA, 2014. [Google Scholar]
- Tahir, M.A.; Kittler, J.; Yan, F. Inverse random under sampling for class imbalance problem and its application to multi-label classification. Pattern Recognit. 2012, 45, 3738–3750. [Google Scholar] [CrossRef]
- Kuncheva, L.I.; Whitaker, C.J. Measures of Diversity in Classifier Ensembles and Their Relationship with the Ensemble Accuracy. Mach. Learn. 2003, 51, 181–207. [Google Scholar] [CrossRef]


| Class | Balanced Data | Imbalanced Data |
|---|---|---|
| Class 1 | 218 | 218 |
| Class 2 | 212 | 50 |
| Class 3 | 217 | 217 |
| Class 4 | 199 | 199 |
| Total samples | 846 | 684 |
| Data | EX | AT | CL | ||||||||||
|---|---|---|---|---|---|---|---|---|---|---|---|---|---|
| Car | 1600 | 6 | 4 | 62 | 66 | 359 | 1113 | ||||||
| Cleveland | 297 | 13 | 5 | 13 | 35 | 35 | 54 | 160 | |||||
| Covtype.data | 8000 | 54 | 7 | 33 | 139 | 241 | 278 | 481 | 2985 | 3843 | |||
| Glass | 214 | 10 | 6 | 9 | 13 | 17 | 29 | 70 | 76 | ||||
| Hayes-roth | 160 | 4 | 3 | 31 | 64 | 65 | |||||||
| Newthyroid | 215 | 5 | 3 | 30 | 35 | 150 | |||||||
| Optdigit | 1642 | 64 | 10 | 20 | 40 | 180 | 187 | 191 | 196 | 197 | 197 | 210 | 224 |
| Page-blocks | 5472 | 10 | 5 | 28 | 87 | 115 | 329 | 4913 | |||||
| Penbased | 1100 | 16 | 10 | 105 | 105 | 106 | 106 | 106 | 114 | 114 | 114 | 115 | 115 |
| Pendigit | 3239 | 16 | 10 | 20 | 20 | 362 | 379 | 394 | 396 | 397 | 408 | 426 | 437 |
| Segment | 2000 | 19 | 7 | 279 | 280 | 281 | 286 | 289 | 291 | 294 | |||
| Statlog | 5000 | 36 | 6 | 485 | 539 | 540 | 1061 | 1169 | 1206 | ||||
| Urbanlandcover | 300 | 147 | 9 | 11 | 13 | 19 | 28 | 30 | 45 | 46 | 47 | 61 | |
| Vehicle | 684 | 17 | 4 | 50 | 199 | 217 | 218 | ||||||
| Wilt | 4839 | 5 | 2 | 261 | 4578 | ||||||||
| Wine | 178 | 13 | 3 | 48 | 59 | 71 | |||||||
| Wine quality-red | 1599 | 11 | 6 | 10 | 18 | 53 | 199 | 638 | 681 | ||||
| Wine quality-white | 4898 | 11 | 7 | 5 | 20 | 163 | 175 | 880 | 1457 | 2198 |
| Data | Bagging | Under-Bagging | SMOTE-Bagging | Max-Margin | Unsupervised Max-Margin | Sum-Margin | Unsupervised Max-Margin |
|---|---|---|---|---|---|---|---|
| Car | 79.7 (7) | 91.9 (5) | 84.0 (6) | 93.4 (1) | 92.6(3) | 92.7(2) | 92.3 (4) |
| Cleveland | 28.1 (6) | 29.2 (2.5) | 28.9 (4) | 29.2 (2.5) | 28.0 (7) | 29.5 (1) | 28.4 (5) |
| Covtype.data | 32.0 (7) | 67.9 (3) | 65.7 (6) | 67.4 (5) | 67.6 (4) | 67.9 (3) | 68.1 (1) |
| Glass | 91.6 (6) | 92.9 (5) | 91.2 (7) | 93.4 (1) | 93.4 (1) | 93.1 (3) | 93.1 (3) |
| Hayes-roth | 77.3 (5) | 76.8 (6) | 76.1 (7) | 79.2 (4) | 79.9 (2.5) | 82.9 (1) | 79.9 (2.5) |
| Newthyroid | 81.7 (7) | 93.6 (5) | 85.6 (6) | 94.0 (3.5) | 94.0 (3.5) | 94.2 (2) | 94.3 (1) |
| Optdigit | 69.4 (7) | 87.5 (5) | 80.4 (6) | 89.7 (3) | 90.5 (1) | 89.6 (4) | 90.0 (2) |
| Page-blocks | 81.3 (7) | 94.5 (2.5) | 91.8 (6) | 94.0 (5) | 94.5 (2.5) | 95.0 (1) | 94.3 (4) |
| Penbased | 90.6 (5) | 88.4 (7) | 88.7 (6) | 92.5 (2.5) | 92.5 (2.5) | 92.6 (1) | 92.2 (4) |
| Pendigit | 62.4 (7) | 88.0 (5) | 76.9 (6) | 90.2 (3) | 90.3 (2) | 90.4 (1) | 90.0 (4) |
| Segment | 91.4 (7) | 92.5 (6) | 93.3 (5) | 93.8 (3) | 93.9 (1) | 93.9 (1) | 93.8 (3) |
| Statlog | 78.7 (7) | 81.5 (5) | 81.4 (6) | 82.3 (2.5) | 82.3 (2.5) | 82.8 (1) | 82.2 (4) |
| Urbanlandcover | 75.0 (2) | 68.9 (7) | 81.8 (1) | 72.2 (5) | 73.2 (3) | 71.5 (6) | 72.4 (4) |
| Vehicle | 71.2 (7) | 72.8 (6) | 73.4 (5) | 76.1 (4) | 76.4 (2) | 76.2 (3) | 76.6 (1) |
| Wilt | 87.2 (7) | 94.7 (6) | 95.0 (5) | 95.5 (3) | 95.5 (3) | 95.6 (1) | 95.5 (3) |
| Wine | 98.2 (5) | 96.9 (7) | 98.0 (6) | 98.3(4) | 98.5 (3) | 98.8 (2) | 99.2 (1) |
| Wine quality-red | 27.9 (7) | 33.8 (2) | 36.7 (1) | 33.3 (3) | 31.6 (5) | 30.6 (6) | 33.1 (4) |
| Wine quality-white | 21.8 (7) | 34.7 (4) | 31.3 (6) | 36.9 (3) | 37.5 (2) | 34.2 (5) | 40.1 (1) |
| Mean accuracy | 69.2 | 77.0 | 75.6 | 78.4 | 78.5 | 78.4 | 78.6 |
| Average rank | 6.2 | 4.9 | 5.3 | 3.2 | 2.8 | 2.4 | 2.9 |
| Data | Bagging | Under-Bagging | SMOTE-Bagging | Max-Margin | Unsupervised Max-Margin | Sum-Margin | Unsupervised Max-Margin |
|---|---|---|---|---|---|---|---|
| Car | 81.8 (3) | 87.1 (1) | 79.9 (7) | 82.4 (2) | 81.5 (5) | 81.6 (4) | 81.4 (6) |
| Cleveland | 26.7 (7) | 28.6 (3) | 27.6 (6) | 29.3 (2) | 28.2 (5) | 29.4 (1) | 28.5 (4) |
| Covtype.data | 36.4 (7) | 53.7 (1) | 52.0 (2) | 51.2 (6) | 51.5 (4.5) | 51.5 (4.5) | 51.8 (3) |
| Glass | 91.1 (5.5) | 91.1 (5.5) | 90.6 (7) | 91.8 (1) | 91.8 (1) | 91.6 (2.5) | 91.6 (2.5) |
| Hayes-roth | 77.9 (5) | 77.1 (7) | 77.3 (6) | 79.2 (4) | 80.0 (2) | 82.9 (1) | 79.9 (3) |
| Newthyroid | 87.5 (7) | 94.5 (1) | 90.5 (6) | 94.0 (3.5) | 94.0 (3.5) | 94.1 (5) | 94.3 (2) |
| Optdigit | 68.8 (7) | 85.2 (5) | 78.3 (6) | 87.3 (3) | 87.9 (1) | 87.1 (4) | 87.6 (2) |
| Page-blocks | 82.8 (1) | 72.9 (6) | 73.0 (5) | 72.9 (7) | 74.1 (3) | 74.4 (2) | 73.9 (4) |
| Penbased | 90.7 (5) | 88.5 (7) | 88.8 (6) | 92.3 (3) | 92.4 (2) | 92.5 (1) | 92.1 (4) |
| Pendigit | 69.0 (7) | 84.9 (5) | 76.0 (6) | 86.3 (3) | 86.7 (1) | 86.6 (2) | 86.2 (4) |
| Segment | 92.0 (7) | 93.0 (6) | 93.6 (5) | 94.2 (3) | 94.3 (1) | 94.2 (3) | 94.2 (3) |
| Statlog | 80.6 (7) | 81.9 (5) | 81.7 (6) | 82.6 (2.5) | 82.6 (2.5) | 82.8 (1) | 82.4 (4) |
| Urbanlandcover | 75.8 (2) | 67.5 (7) | 81.7 (1) | 71.1 (5) | 72.0 (3) | 70.0 (6) | 71.2 (4) |
| Vehicle | 73.1 (5) | 72.4 (7) | 73.0 (6) | 74.7 (4) | 75.0 (2) | 74.9 (3) | 75.1 (1) |
| Wilt | 91.8 (1) | 85.3 (5) | 85.1 (7) | 85.6 (2) | 85.3 (5) | 85.4 (3) | 85.3 (5) |
| Wine | 98.3 (4) | 96.7 (7) | 98.1 (6) | 98.2 (5) | 98.4 (3) | 98.7 (2) | 99.2 (1) |
| Winequality-red | 28.7 (5) | 30.6 (2) | 31.8 (1) | 29.4 (3) | 27.9 (6) | 26.6 (7) | 29.0 (4) |
| Winequality-white | 22.7 (7) | 27.6 (4) | 25.2 (6) | 28.3 (2) | 27.8 (3) | 27.3 (5) | 28.4 (1) |
| Mean | 70.9 | 73.2 | 72.5 | 73.9 | 74.0 | 74.0 | 74.0 |
| Average rank | 5.1 | 4.7 | 5.3 | 3.4 | 3.0 | 3.2 | 3.2 |
| Data | Bagging | Under-Bagging | SMOTE-Bagging | Max-Margin | Unsupervised Max-Margin | Sum-Margin | Unsupervised Max-Margin |
|---|---|---|---|---|---|---|---|
| Car | 59.3 (7) | 87.0 (4) | 68.5 (6) | 88.8 (1) | 88.4 (2) | 87.9 (3) | 86.8 (5) |
| Cleveland | 0.0 (7) | 0.0 (7) | 0.0 (7) | 7.4 (1) | 4.4 (3) | 5.7(1) | 3.4 (4) |
| Covtype.data | 0.0 (7) | 41.2 (2) | 46.4 (1) | 31.4 (4) | 30.8 (6) | 31.8 (3) | 31.0(5) |
| Glass | 80.0 (3.5) | 79.8 (7) | 80.0 (3.5) | 80.0 (3.5) | 80.0 (3.5) | 79.8 (7) | 79.8 (7) |
| Hayes-roth | 47.6 (6) | 53.5 (5) | 41.1 (7) | 68.1 (2) | 69.2 (1) | 67.8 (3) | 64.4 (4) |
| Newthyroid | 61.8 (7) | 87.8 (1) | 72.4 (6) | 85.0 (2.5) | 85.0 (2.5) | 84.2 (4.5) | 84.2 (4.5) |
| Optdigit | 0.0 (7) | 71.4 (5) | 61.3 (6) | 78.1 (3) | 79.6 (1) | 76.7 (4) | 79.3 (2) |
| Page-blocks | 54.2 (7) | 89.4 (3) | 80.8 (6) | 88.8 (5) | 89.8 (2) | 90.9 (1) | 88.9 (4) |
| Penbased | 79.4 (2.5) | 76.9 (7) | 76.9 (6) | 78.8 (5) | 79.4 (2.5) | 79.7 (1) | 79.1 (4) |
| Pendigit | 0.0 (7) | 77.8 (5) | 33.3 (6) | 72.8 (1) | 71.9 (2) | 71.0 (3) | 70.9 (4) |
| Segment | 79.3 (7) | 79.3 (7) | 79.7 (5) | 82.5 (4) | 83.3 (2) | 83.4 (1) | 82.8 (3) |
| Statlog | 45.8 (7) | 69.2 (1) | 67.7 (2) | 59.1 (6) | 59.2 (4.5) | 62.8 (3) | 59.2 (4.5) |
| Urbanlandcover | 37.3 (7) | 40.9 (6) | 66.7 (1) | 49.9 (3) | 52.7 (2) | 49.2 (4) | 46.8 (5) |
| Vehicle | 31.3 (7) | 43.9 (2) | 47.0 (1) | 40.8 (4) | 39.1 (6) | 41.7 (3) | 39.3 (5) |
| Wilt | 74.0 (7) | 92.8 (6) | 94.4 (5) | 95.4 (1) | 95.3 (2.5) | 95.2 (4) | 95.3 (2.5) |
| Wine | 94.7 (5) | 94.1 (7) | 94.1 (7) | 96.7 (4) | 97.3 (3) | 97.7 (2) | 98.2(1) |
| Winequality-red | 0.0 (7) | 15.9 (4) | 0 (7) | 15.9 (4) | 19.6 (1) | 14.2 (6) | 16.9 (2) |
| Winequality-white | 0.0 (7) | 9.7 (5) | 0.0 (7) | 13.0 (1) | 11.9 (3) | 10.7 (4) | 12.3 (2) |
| Mean accuracy | 41.4 | 61.3 | 56.1 | 62.9 | 63.1 | 62.8 | 62.1 |
| Average rank | 6.4 | 4.7 | 5.0 | 3.1 | 2.8 | 3.2 | 3.8 |
| Data | Bagging | Under-Bagging | SMOTE-Bagging | Max-Margin | Unsupervised Max-Margin | Sum-Margin | Unsupervised Max-Margin |
|---|---|---|---|---|---|---|---|
| Car | 0.0162 | 0.0787 | 0.0243 | 0.1151 | 0.1153 | 0.1134 | 0.1144 |
| Cleveland | 0.1195 | 0.1642 | 0.1172 | 0.1770 | 0.1793 | 0.1773 | 0.1789 |
| Covtype.data | 0.0155 | 0.0859 | 0.0560 | 0.0958 | 0.0977 | 0.0975 | 0.0981 |
| Glass | 0.0316 | 0.0667 | 0.0209 | 0.0623 | 0.0623 | 0.0618 | 0.0618 |
| Hayes-roth | 0.0675 | 0.0783 | 0.0769 | 0.0760 | 0.0760 | 0.0830 | 0.0853 |
| Newthyroid | 0.0432 | 0.0860 | 0.0554 | 0.0997 | 0.0997 | 0.0997 | 0.0997 |
| Optdigit | 0.0899 | 0.1531 | 0.1110 | 0.1699 | 0.1702 | 0.1730 | 0.1729 |
| Page-blocks | 0.0099 | 0.0983 | 0.0171 | 0.1093 | 0.1055 | 0.1099 | 0.1067 |
| Penbased | 0.0183 | 0.0201 | 0.0230 | 0.0292 | 0.0291 | 0.0281 | 0.0290 |
| Pendigit | 0.0101 | 0.0300 | 0.0180 | 0.0405 | 0.0360 | 0.0378 | 0.0391 |
| Segment | 0.0033 | 0.0037 | 0.0072 | 0.0128 | 0.0128 | 0.0133 | 0.0128 |
| Statlog | 0.0137 | 0.0198 | 0.0207 | 0.0259 | 0.0271 | 0.0312 | 0.0272 |
| Urbanlandcover | 0.0692 | 0.0903 | 0.0618 | 0.1115 | 0.1116 | 0.1111 | 0.1119 |
| Vehicle | 0.0586 | 0.1298 | 0.1079 | 0.1596 | 0.1606 | 0.1580 | 0.1640 |
| Wilt | 0.0118 | 0.0474 | 0.0182 | 0.0421 | 0.0460 | 0.0457 | 0.0460 |
| Wine | 0.0714 | 0.0738 | 0.0890 | 0.0822 | 0.0820 | 0.0818 | 0.0802 |
| Winequality-red | 0.0511 | 0.0992 | 0.0599 | 0.1035 | 0.1023 | 0.1051 | 0.1047 |
| Winequality-white | 0.0348 | 0.1167 | 0.0566 | 0.1165 | 0.1175 | 0.1165 | 0.1148 |
| Mean | 0.0409 | 0.0801 | 0.0523 | 0.0905 | 0.0906 | 0.0913 | 0.0915 |
| Max-Margin | Unsupervised Max-Margin | Sum-Margin | Unsupervised Sum-Margin | |
|---|---|---|---|---|
| Car | 94.1 | 93.7 | 93.8 | 93.9 |
| Cleveland | 30.6 | 28.0 | 31.0 | 29.4 |
| Covtype.data | 67.8 | 68.1 | 67.9 | 68.1 |
| Glass | 94.3 | 94.3 | 94.3 | 94.3 |
| Hayes-roth | 84.3 | 83.8 | 84.3 | 83.4 |
| Newthyroid | 95.8 | 95.7 | 95.9 | 95.1 |
| Optdigit | 90.5 | 90.9 | 90.9 | 90.9 |
| Page-blocks | 94.9 | 95.0 | 95.0 | 95.0 |
| Penbased | 93.0 | 93.2 | 93.3 | 93.6 |
| Pendigit | 91.8 | 91.5 | 91.8 | 91.3 |
| Segment | 94.1 | 94.2 | 94.4 | 94.1 |
| Statlog | 82.7 | 82.8 | 83.0 | 82.8 |
| Urbanlandcover | 75.7 | 76.1 | 75.7 | 77.0 |
| Vehicle | 77.1 | 77.5 | 77.0 | 77.5 |
| Wilt | 96.0 | 96.0 | 95.6 | 96.0 |
| Wine | 99.0 | 99.0 | 99.1 | 99.4 |
| Winequality-red | 34.0 | 34.4 | 34.5 | 34.8 |
| Winequality-white | 41.3 | 40.6 | 42.4 | 42.0 |
| Mean accuracy | 79.8 | 79.7 | 80.0 | 79.9 |
| Max-Margin | Unsupervised Max-Margin | Sum-Margin | Unsupervised Sum-Margin | |
|---|---|---|---|---|
| Car | 87.8 | 86.4 | 86.8 | 86.9 |
| Cleveland | 31.4 | 30.7 | 30.7 | 32.2 |
| Covtype.data | 52.0 | 51.7 | 52.5 | 52.0 |
| Glass | 93.4 | 93.4 | 93.2 | 93.2 |
| Hayes-roth | 84.2 | 83.5 | 85.2 | 84.5 |
| Newthyroid | 95.7 | 95.7 | 95.5 | 95.1 |
| Optdigit | 88.5 | 88.9 | 88.5 | 88.2 |
| Page-blocks | 75.5 | 76.0 | 76.0 | 75.9 |
| Penbased | 92.8 | 93.0 | 93.2 | 93.4 |
| Pendigit | 86.9 | 86.7 | 87.5 | 87.2 |
| Segment | 94.4 | 94.5 | 94.7 | 94.5 |
| Statlog | 83.0 | 82.9 | 83.0 | 82.9 |
| Urbanlandcover | 74.8 | 75.1 | 74.6 | 76.1 |
| Vehicle | 75.8 | 76.0 | 76.3 | 76.3 |
| Wilt | 86.2 | 86.3 | 86.4 | 86.3 |
| Wine | 99.1 | 99.1 | 99.1 | 99.2 |
| Winequality-red | 30.9 | 30.8 | 30.6 | 31.9 |
| Winequality-white | 29.5 | 29.3 | 29.5 | 29.1 |
| Mean | 75.7 | 75.6 | 75.7 | 75.8 |
| Max-Margin | Unsupervised Max-Margin | Sum-Margin | Unsupervised Sum-Margin | |
|---|---|---|---|---|
| Car | 89.1 | 89.1 | 89.3 | 89.8 |
| Cleveland | 11.2 | 10.1 | 10.3 | 8.3 |
| Covtype.data | 40.1 | 39.9 | 39.9 | 40.8 |
| Glass | 80.0 | 80.0 | 80.0 | 80.0 |
| Hayes-roth | 72.8 | 73.1 | 72.6 | 70.7 |
| Newthyroid | 90.9 | 90.9 | 92.0 | 92.2 |
| Optdigit | 80.4 | 81.1 | 80.4 | 81.1 |
| Page-blocks | 90.3 | 90.4 | 90.8 | 90.8 |
| Penbased | 79.6 | 79.6 | 79.7 | 80.1 |
| Pendigit | 75.8 | 73.3 | 72.7 | 73.7 |
| Segment | 84.4 | 84.7 | 85.1 | 84.9 |
| Statlog | 70.2 | 71.0 | 71.8 | 69.8 |
| Urbanlandcover | 55.6 | 55.6 | 56.8 | 56.8 |
| Vehicle | 51.2 | 48.6 | 50.4 | 47.7 |
| Wilt | 95.5 | 95.5 | 95.5 | 95.5 |
| Wine | 98.0 | 98.0 | 98.1 | 99.0 |
| Winequality-red | 17.5 | 20.3 | 27.3 | 19.9 |
| Winequality-white | 16.0 | 14.4 | 15.2 | 13.9 |
| Mean | 66.6 | 66.4 | 67.1 | 66.4 |
© 2018 by the authors. Licensee MDPI, Basel, Switzerland. This article is an open access article distributed under the terms and conditions of the Creative Commons Attribution (CC BY) license (http://creativecommons.org/licenses/by/4.0/).
Share and Cite
Feng, W.; Huang, W.; Ren, J. Class Imbalance Ensemble Learning Based on the Margin Theory. Appl. Sci. 2018, 8, 815. https://doi.org/10.3390/app8050815
Feng W, Huang W, Ren J. Class Imbalance Ensemble Learning Based on the Margin Theory. Applied Sciences. 2018; 8(5):815. https://doi.org/10.3390/app8050815
Chicago/Turabian StyleFeng, Wei, Wenjiang Huang, and Jinchang Ren. 2018. "Class Imbalance Ensemble Learning Based on the Margin Theory" Applied Sciences 8, no. 5: 815. https://doi.org/10.3390/app8050815
APA StyleFeng, W., Huang, W., & Ren, J. (2018). Class Imbalance Ensemble Learning Based on the Margin Theory. Applied Sciences, 8(5), 815. https://doi.org/10.3390/app8050815