Article

Simulation Analysis and Experimental Study of the Cooker Hoods of High-Rise Residential Buildings

1
School of Mechanical Instrumental Engineering, Xi’an University of Technology, Xi’an 710048, China
2
Kitchenware Technology Center, Ningbo Fotile Kitchenware Co., Ltd., Ningbo 315336, China
*
Author to whom correspondence should be addressed.
Appl. Sci. 2018, 8(5), 777; https://doi.org/10.3390/app8050777
Submission received: 29 March 2018 / Revised: 30 April 2018 / Accepted: 10 May 2018 / Published: 14 May 2018

Abstract

:
Fuel combustion will release harmful gases such as CO , CO 2 , SO 2 , and   NO x during cooking, and cooking oil fumes also contain acids, aldehydes, and other harmful particulate matters. Clinical diagnosis confirmed that some tiny particulate matters in oil fumes can induce many kinds of cancer. High-rise buildings of multi-dwelling units have been widely used as residential buildings with increasing worldwide population, especially in China. Therefore, air pollution in kitchens of high-rise residential buildings is attracting more and more attention in academic circles and engineering fields, especially the exhaust effectiveness and influencing factors of cooker hoods. This study focused on key influence factors of exhaust effectiveness such as the centralized flue system of high-rise residential buildings, the operating rate, the floor, the exhaust volume, and the vent opening. Commercial software Fluent was adopted to build the calculation model of cooker hoods for high-rise buildings. The temperature distribution, concentration distribution, and main escape path of oil fumes were analyzed and compared with experimental measurements. The results showed that the side and the front edge of the cooker hood close to the cooker are the main escape paths of oil fumes; the maximum escape concentrations of oil fumes are 0.247 mg/m3 and 0.265 mg/m3, respectively, under the condition of ventilation and non-ventilation; the error is only 5.0% and 11.7% compared with the experimental results. This paper is valuable for the improvement of air quality in kitchens in high-rise residential buildings, and the design and installation of cooker hoods.

1. Introduction

Indoor air quality is getting more and more attention, especially the pollution of oil fumes in kitchens that have an important influence on indoor air quality [1,2]. A case study indicated that cooking contribution produced an impact on indoor air quality greater than that of the biomass heating system [3]. The cooking oil fumes also contain acids, aldehydes, and other harmful particulate matters, and clinical diagnosis confirmed that some tiny particulate matters in oil fumes that diffuse indoors can induce many kinds of cancers [4,5,6]. Recently, a majority of studies have focused on the exhaust effect in the design of the cooker hood. However, the influencing factors of exhaust effectiveness in high-rise residential buildings are very complicated. Many factors, such as the structure of centralized flue, operation rate of the cooker hood, the installed floor of cooker hood, the displacement of cooker hood and the ventilation state of kitchen, affect the exhaust effectiveness of the cooker hood [7,8,9,10]. Therefore, considering the influencing factors of the exhaust performance of the cooker hood, it is necessary to construct an analysis method of exhaust effectiveness of cooker hoods for the design and selection of cooker hoods.
Furthermore, there has been much research of the centralized flue of high-rise buildings, the sources of kitchen pollution, and the design and exhaust characteristics of cooker hoods, which has provided an important reference for improving the exhaust effectiveness. Zhu et al. carried out a concentration field analysis of home kitchens and compared the concentration distribution of sunken and side-suction cooker hoods [11,12]. Li et al. analyzed the composition, the size of particulate matters, and the diffusion velocity of kitchen oil fumes, and the exhaust effectiveness of cooker hoods. The results show that small particulate matters had obvious diffusion characteristics, and the overall exhaust efficiency was about 90% [13,14]. Chen et al. carried out structural design and optimization research for cooker hoods, and the effect of structure improved on the exhaust effectiveness of cooker hoods is analyzed [15,16,17]. Wang et al. studied the exhaust effectiveness of high-rise buildings from the structure of centralized flues and carried out a simulation analysis of exhaust characteristics in centralized flues of high-rise building [7,18]. The above research results provide important theoretical and engineering references for improving the exhaust effectiveness of kitchens in high-rise building. However, the comprehensive consideration of the above-mentioned influencing factors in the exhaust effectiveness analysis and the cooker hood design study is still lacking. For indoor air quality or the selection and structure design of the cooker hood, it is necessary to carry out research on the exhaust effectiveness of cooker hoods in high-rise residential buildings based on the real environment or similar conditions.
In the current research, taking into account the impact of the installed floor and the operation rate of cooker hoods, the boundary parameters of cooker hood outlets are obtained according to a high-rise residential building laboratory, and a simulation calculation model of standard kitchens with cooker hoods for high-rise residential buildings is established based on CFD fluid simulation technology. The characteristics of the exterior flow field and the exhaust effectiveness of cooker hoods are simulated and analyzed.

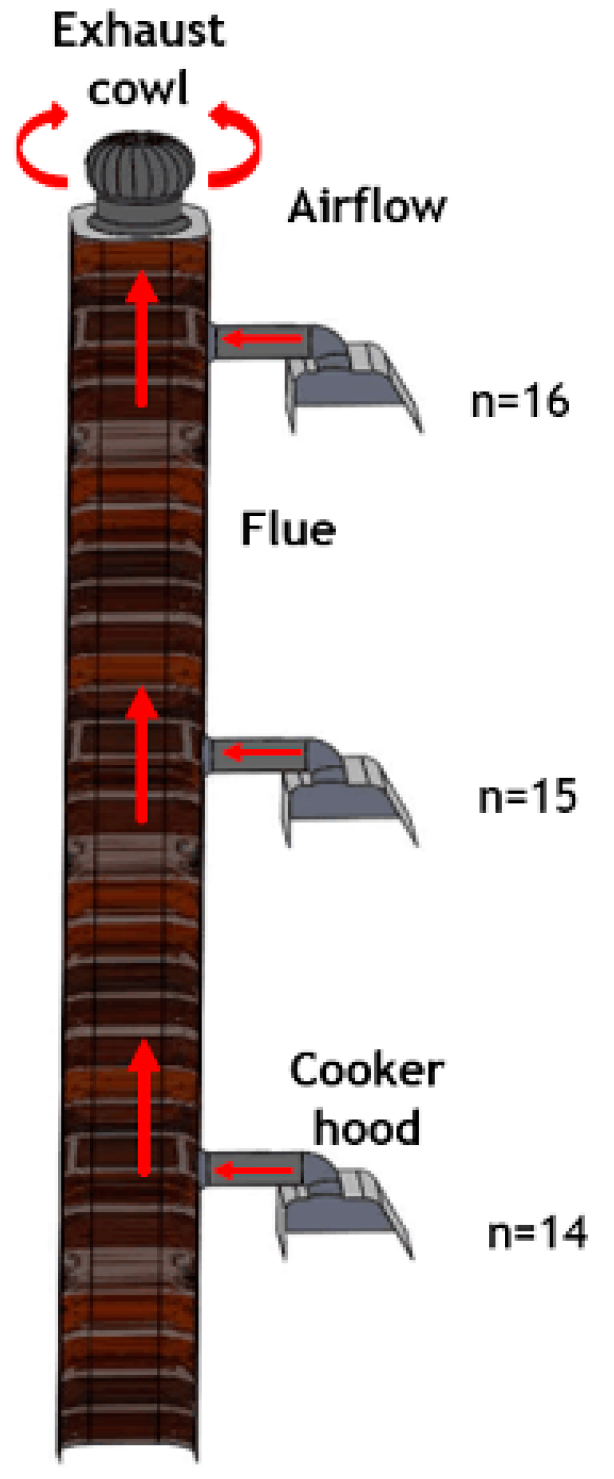
2. Simulation of Centralized Flue System in High-Rise Residential Buildings

2.1. Simulation Theory of Centralized Flue System

When simulating the centralized flue system of a high-rise residential building, it is necessary to undertake a pre-theoretical analysis for the structure of centralized flue in high-rise residential building, and then the simulation system is built under the guidance of theoretical analysis to ensure the reliability of simulation of centralized flue environment. The centralized flue system is shown Figure 1; it consists of centralized flue, branch exhaust flues, exhaust cowl, and cooker hoods. The exhaust cowl is located at the top of the centralized flue, which promotes effluent removal through natural ventilation.
In this work, the calculation model of the centralized flue system is constructed based on the energy equations and the flow continuity equation of fluid mechanics. For m-storey residential buildings, the energy equation of oil fumes flow from the i th floor to the centralized flue can be expressed as
p a i + ρ y v a i 2 2 + Δ p e i = p i + ρ y v i 2 2 + ξ 1 ρ y 2 ( q i A y ) 2
in which p a i is the pressure of indoor air, p i is the pressure of centralized flue, ρ y is the density of oil fumes, v a i is the flow velocity of oil fumes in cooker hood inlet, v i is the average flow velocity of oil fumes in centralized flue, Δ p e i is the full pressure of cooker hood, q i is the flow rate of cooker hood, ξ 1 is the resistance coefficient of check valve (including local resistance coefficient of oil fumes from exhaust pipe of cooker hood into the centralized flue), and A y is the cross-sectional area of exhaust pipe of cooker hood.
The energy equation of oil fumes flow from the i th floor to the exhaust cowl outlet can be expressed as
p i + ρ y v i 2 2 + i H 0 ρ y g = p a 0 + ρ y v a 2 2 + N H 0 ρ y g + j = i N λ H 0 d e ρ y v j 2 2 + j = i n ξ h 2 ρ y v j 2 2 + ξ f ρ y v a 2 2
in which H 0 is the height of single floor, d e is the equivalent diameter of centralized flue, g is the gravity acceleration, p a 0 is the air pressure of the exhaust cowl outlet, v a is the flow velocity of oil fumes in the exhaust cowl outlet, N is the total floors of high-rise residential buildings, n is the total operation number of cooker hood in high-rise residential building, λ is the frictional resistance coefficient when oil fumes flow through the centralized flue, ξ h 2 is the local resistance coefficient after mixing oil fumes in the centralized flue with oil fumes from the exhaust pipe of cooker hood, and ξ f is the resistance coefficient of exhaust cowl in high-rise residential building.
The continuity equation of oil fumes in the centralized flue system of high-rise residential building can be expressed as
v i A = i = 1 m q i
Equations (1)–(3), the flow rate, total pressure, fumes pressure, and flow velocity of cooker hoods installed on different floors can be calculated; they can provide important references for designers of cooker hoods and provide a theoretical basis for the simulation of centralized flue systems in high-rise residential buildings.

2.2. Simulation of Centralized Flue System

To simulate the centralized flue system of high-rise residential building, the simulation system of centralized flues is built and shown in Figure 2, under the guidance of numerical calculation theory of the centralized flue system; the construction is shown in Figure 3. The system is mainly used to simulate the pressure of the centralized flue system and the flow rate of oil fumes in a high-rise residential building. The flue simulation system consists of a measurement, an air supply system, a control system, and a test module; it provides a real environment for the performance test of cooker hoods and achieves an environment simulation of centralized flue system in high-rise residential building. The air supply system consists of 20 fans and 2 throttle valves; the flow rate of oil fumes is controlled by the operation number of fans and the opening degree of throttle valve installed on the air inlet pipe, and the pressure of the centralized flue system is controlled by the opening degree of throttle valve installed on the flue outlet. The air supply system and the flue are connected by a hose to isolate the vibration of the system. The whole system is controlled by computer and special software.

2.3. Performance Parameters of Range Hoods

In the simulation analysis of cooker hoods for high-rise residential buildings, the pressure-flow curve of the cooker hood is an important input parameter, especially the correlation of back pressure and flow parameters with the floor. For this purpose, the calculation method of the centralized flue system in high-rise residential buildings is used to analyze the pressure and flow of the cooker hood, and the correlation between the two key parameters and the floor. Figure 4 and Figure 5 show the analysis results of the relationship between the performance of cooker hood and floor, and different types of cooker hoods are adopted in the analysis: (1) the rated volumetric air flow rate is 14 mg/m3, and the rated pressure is 300 Pa; (2) the rated volumetric air flow rate is 15 mg/m3, and the rated pressure is 500 Pa.

3. Exterior Flow Field of Cooker Hood

3.1. Analysis Theory of Exterior Flow Field

When the simulation calculation of the exterior flow field of cooker hood for a kitchen depends on the nature of the air and oil fumes, the Reynolds-averaged incompressible continuous equation, momentum equation, energy equation, species transport equation, and standard k-epsilon turbulence model form closed equations. To simulate the turbulent motion of exterior flow field of cooker hood, and the motion of oil fumes, the heat transfer, and the mixing diffusion of oil fumes and air are analyzed; the basic equations can be expressed as equations of (4)–(7) [19]
The continuity equation:
( ρ u ) x + ( ρ v ) y + ( ρ w ) z = 0
The momentum equations:
( ρ u ) t + d i v ( p u u ) = p x + τ x x x + τ y x y + τ z x z + F x
( ρ v ) t + d i v ( p v u ) = p y + τ x y x + τ y y y + τ z y z + F y
( ρ w ) t + d i v ( p w u ) = p z + τ x z x + τ y z y + τ z z z + F z
The energy equation:
( ρ c s u ) x + ( ρ c s v ) y + ( ρ c s w ) z = x ( k c p K x ) + y ( k c p K y ) +   z ( k c p K z ) + d T
The species transport equation:
( ρ c s ) t + d i v ( ρ u c s ) = d i v ( D s g r a d ( ρ c s ) ) + S s
in which u , v , w are the velocity components of in the x , y , z directions; ρ is the density; p is the pressure of the micro-unit; τ x x , τ x y , τ x z are the components of the shear stress on the surface of the micro-unit due to molecular viscosity; F x , F y   , F z are the body force of micro-unit; c p is the specific heat capacity; K is the heat transfer coefficient of fluid;   d T is the temperature gradient; c s is the component volume concentration; ρ c s is the component mass concentration; D s is the component diffusion coefficient; and S s is the quality of the components produced per unit volume per unit time in the system, also known as incidence.

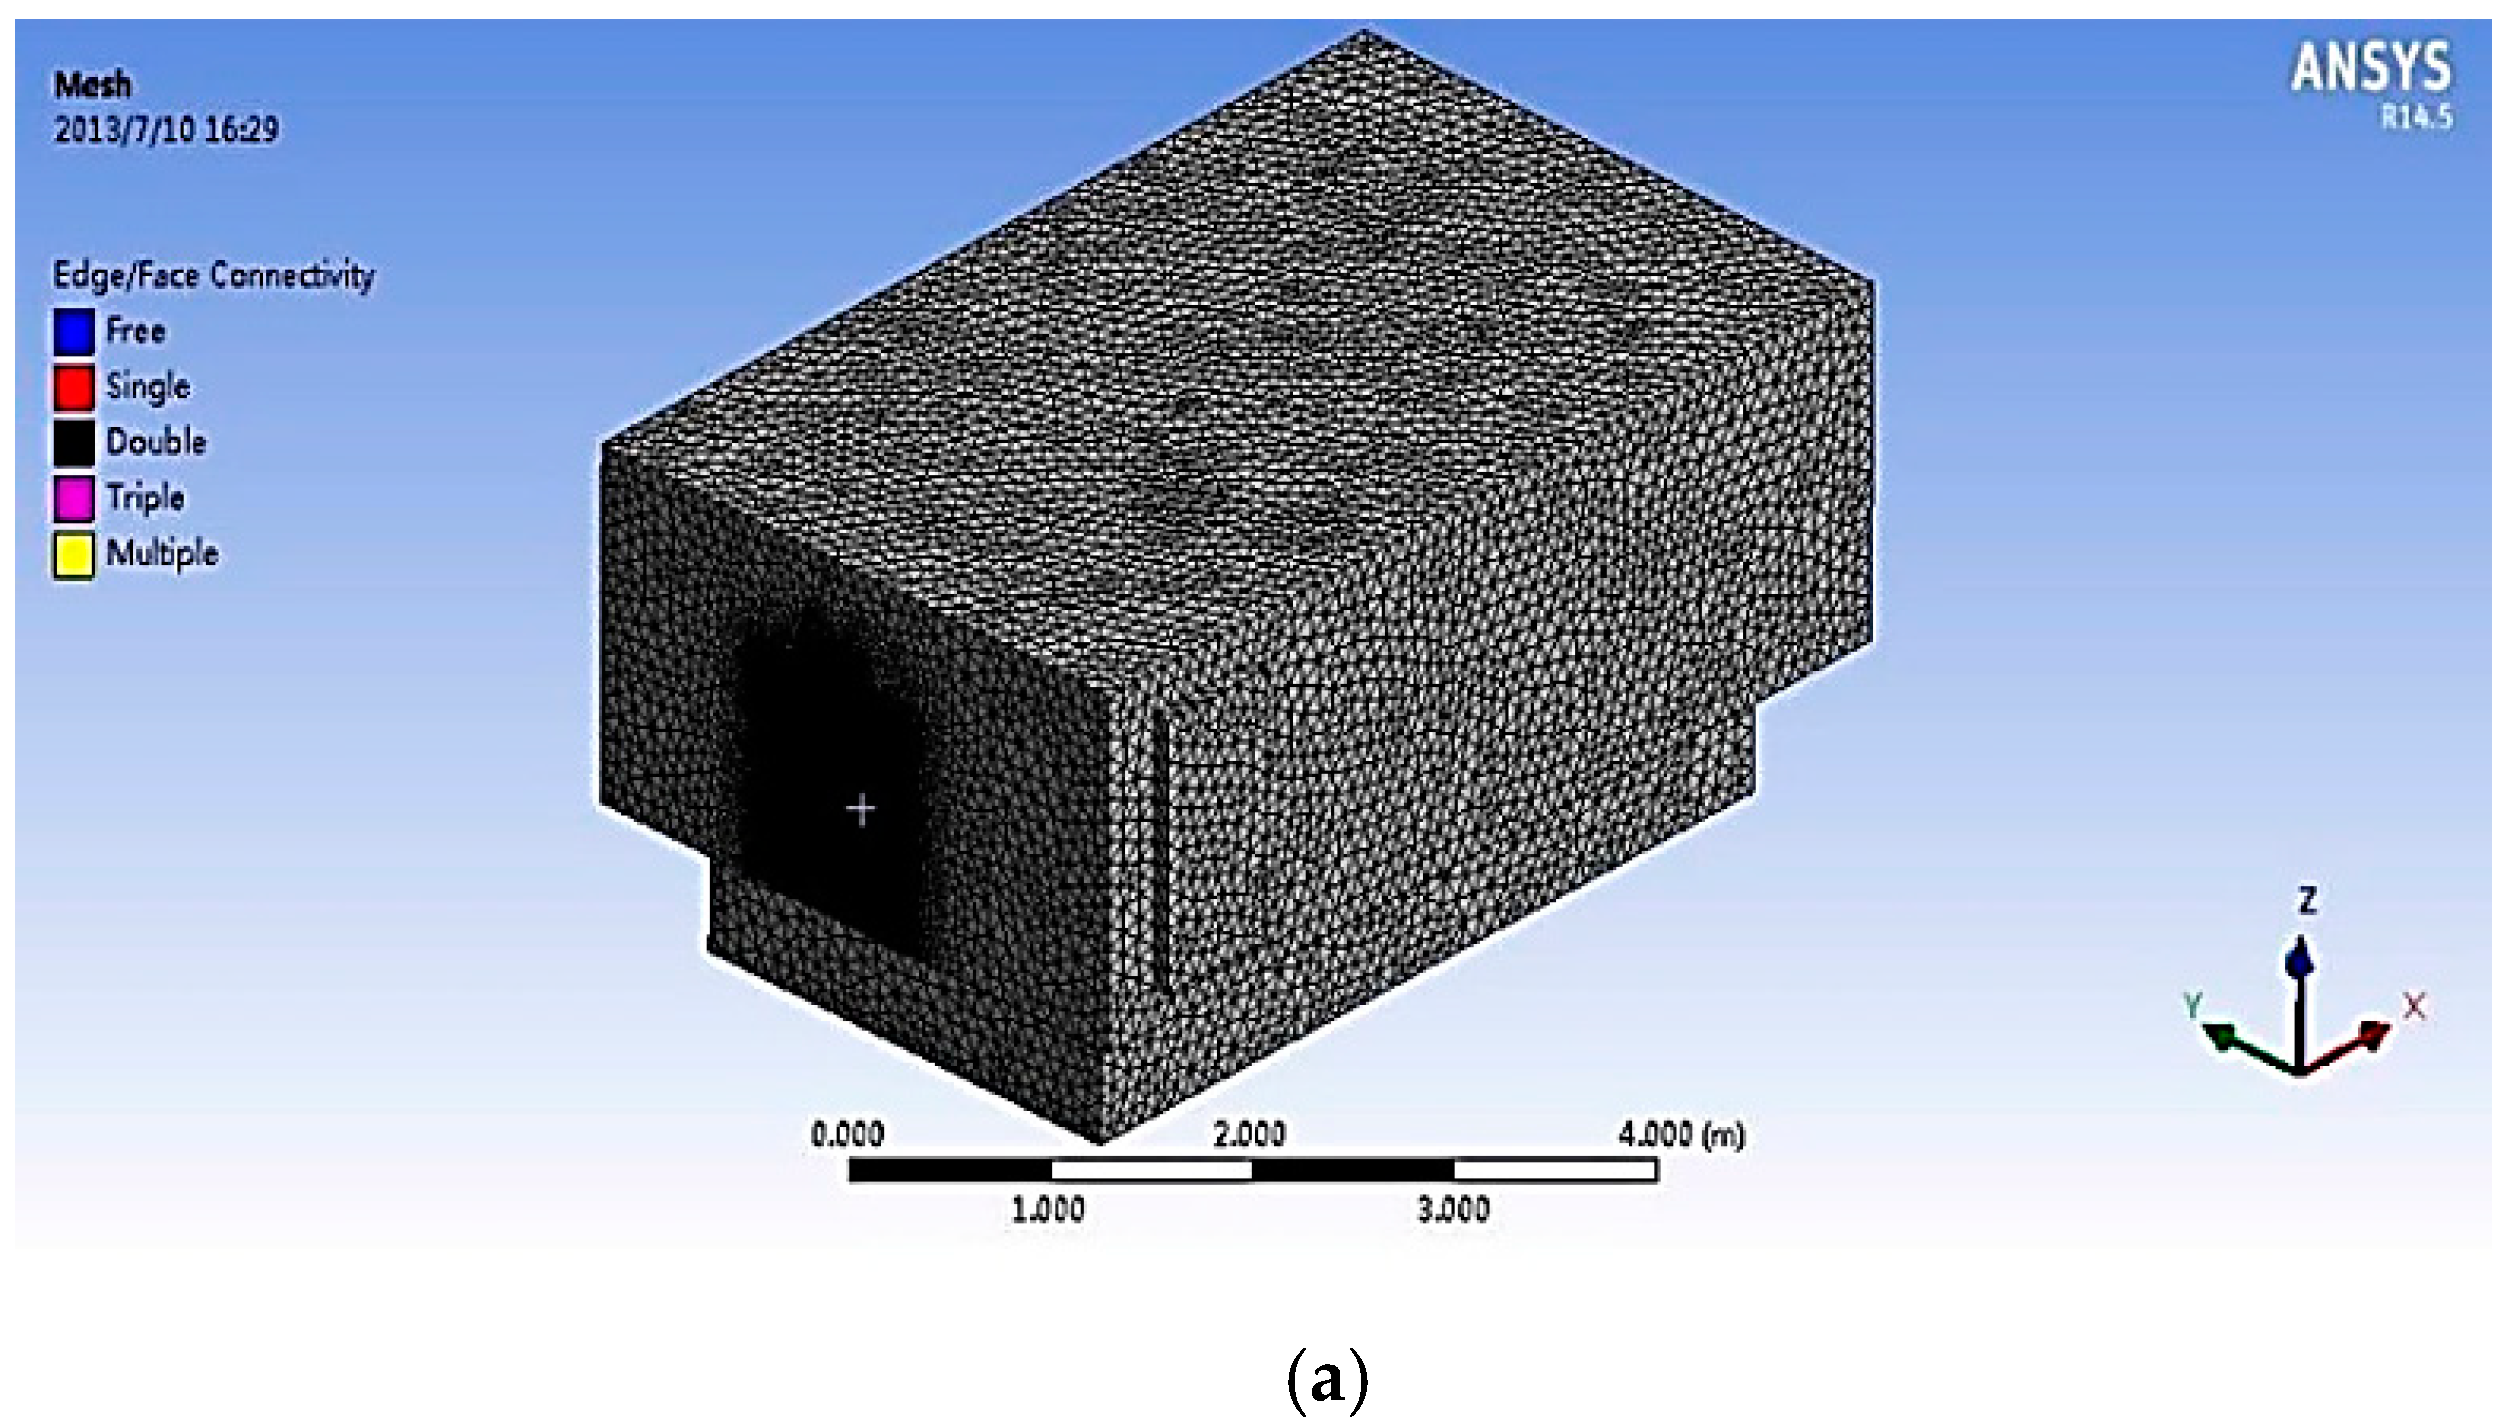
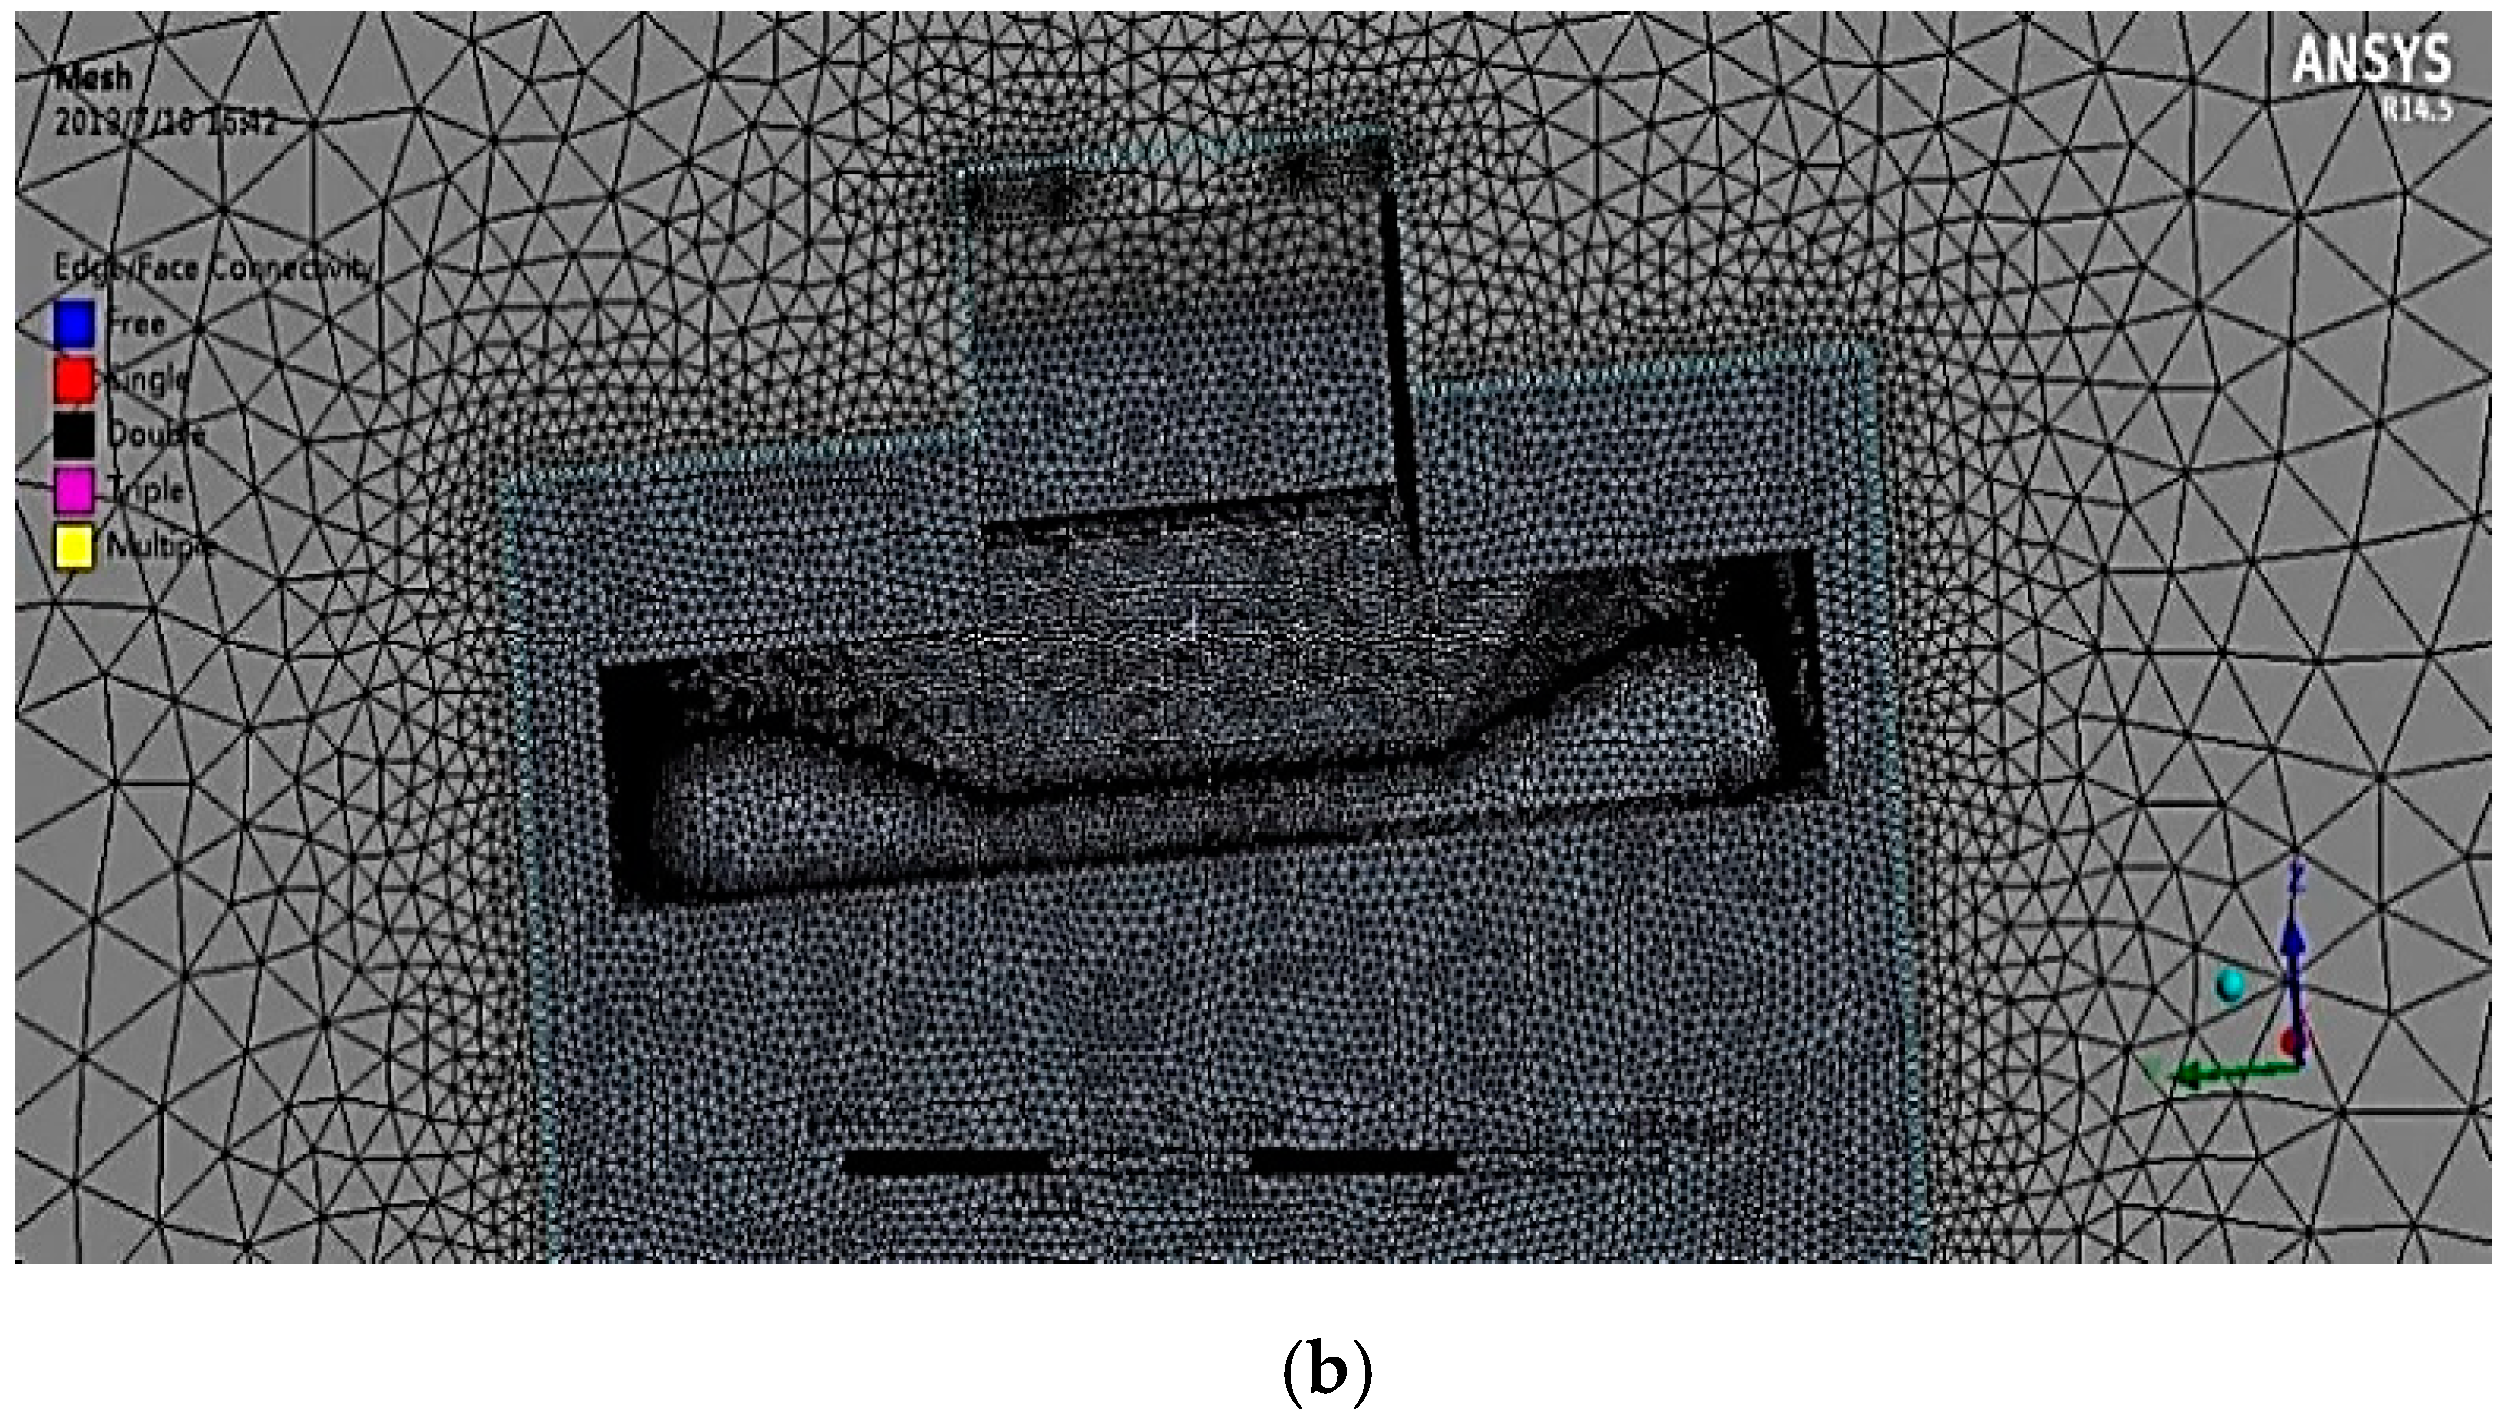
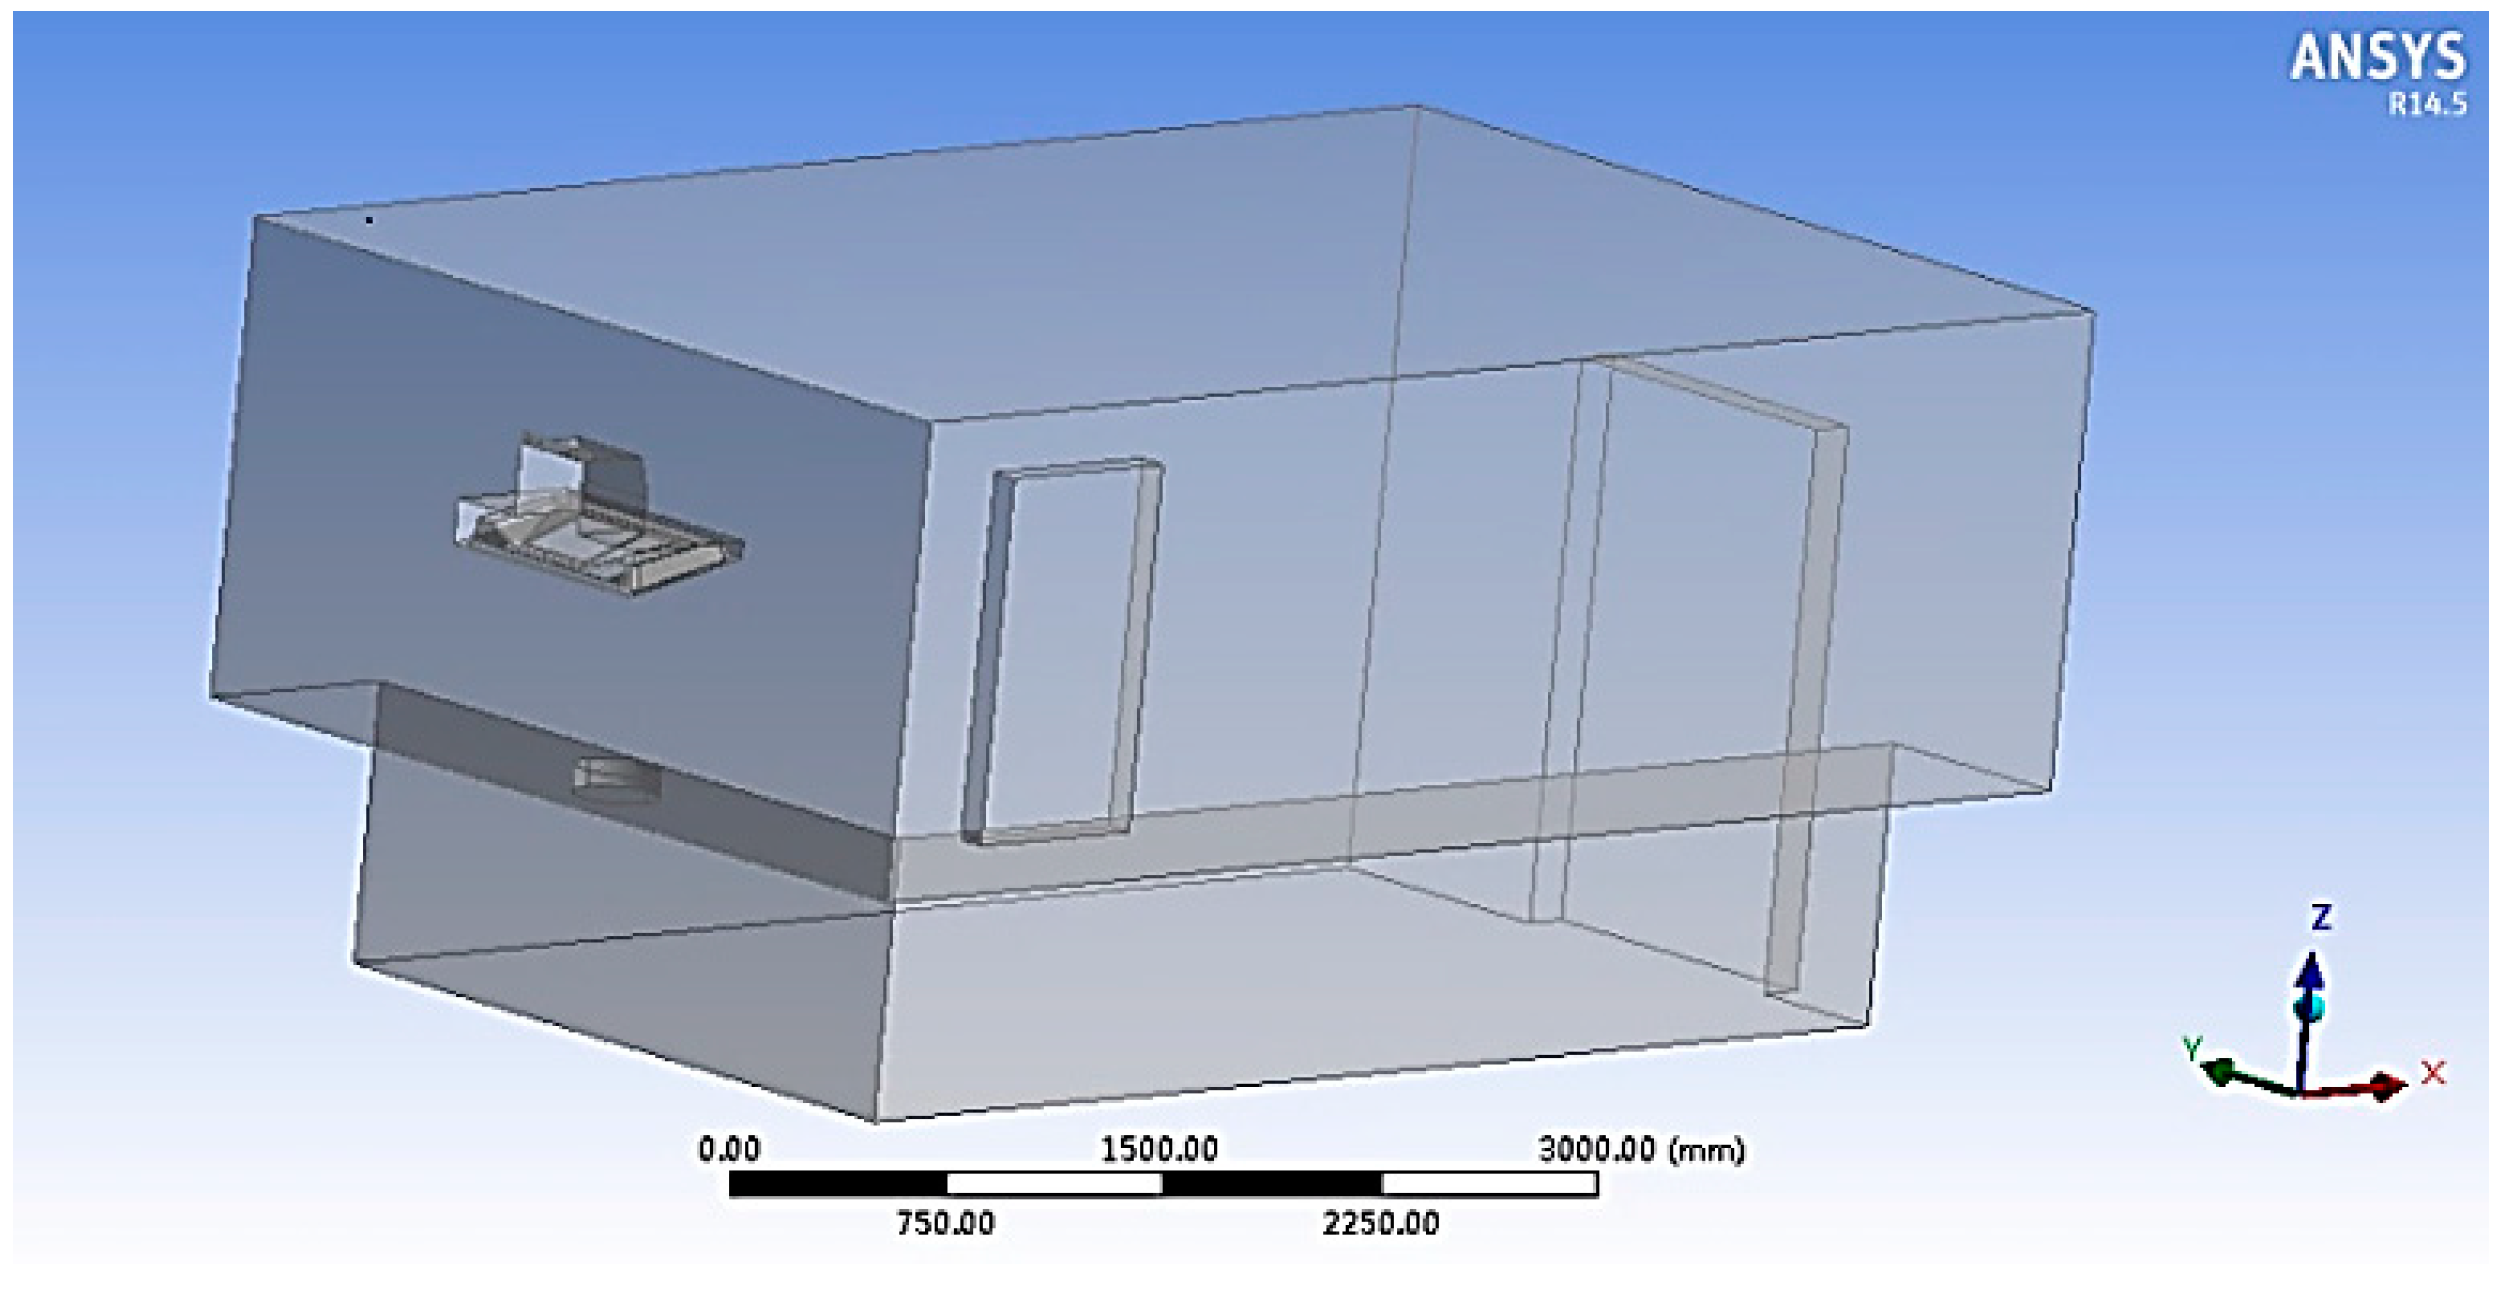
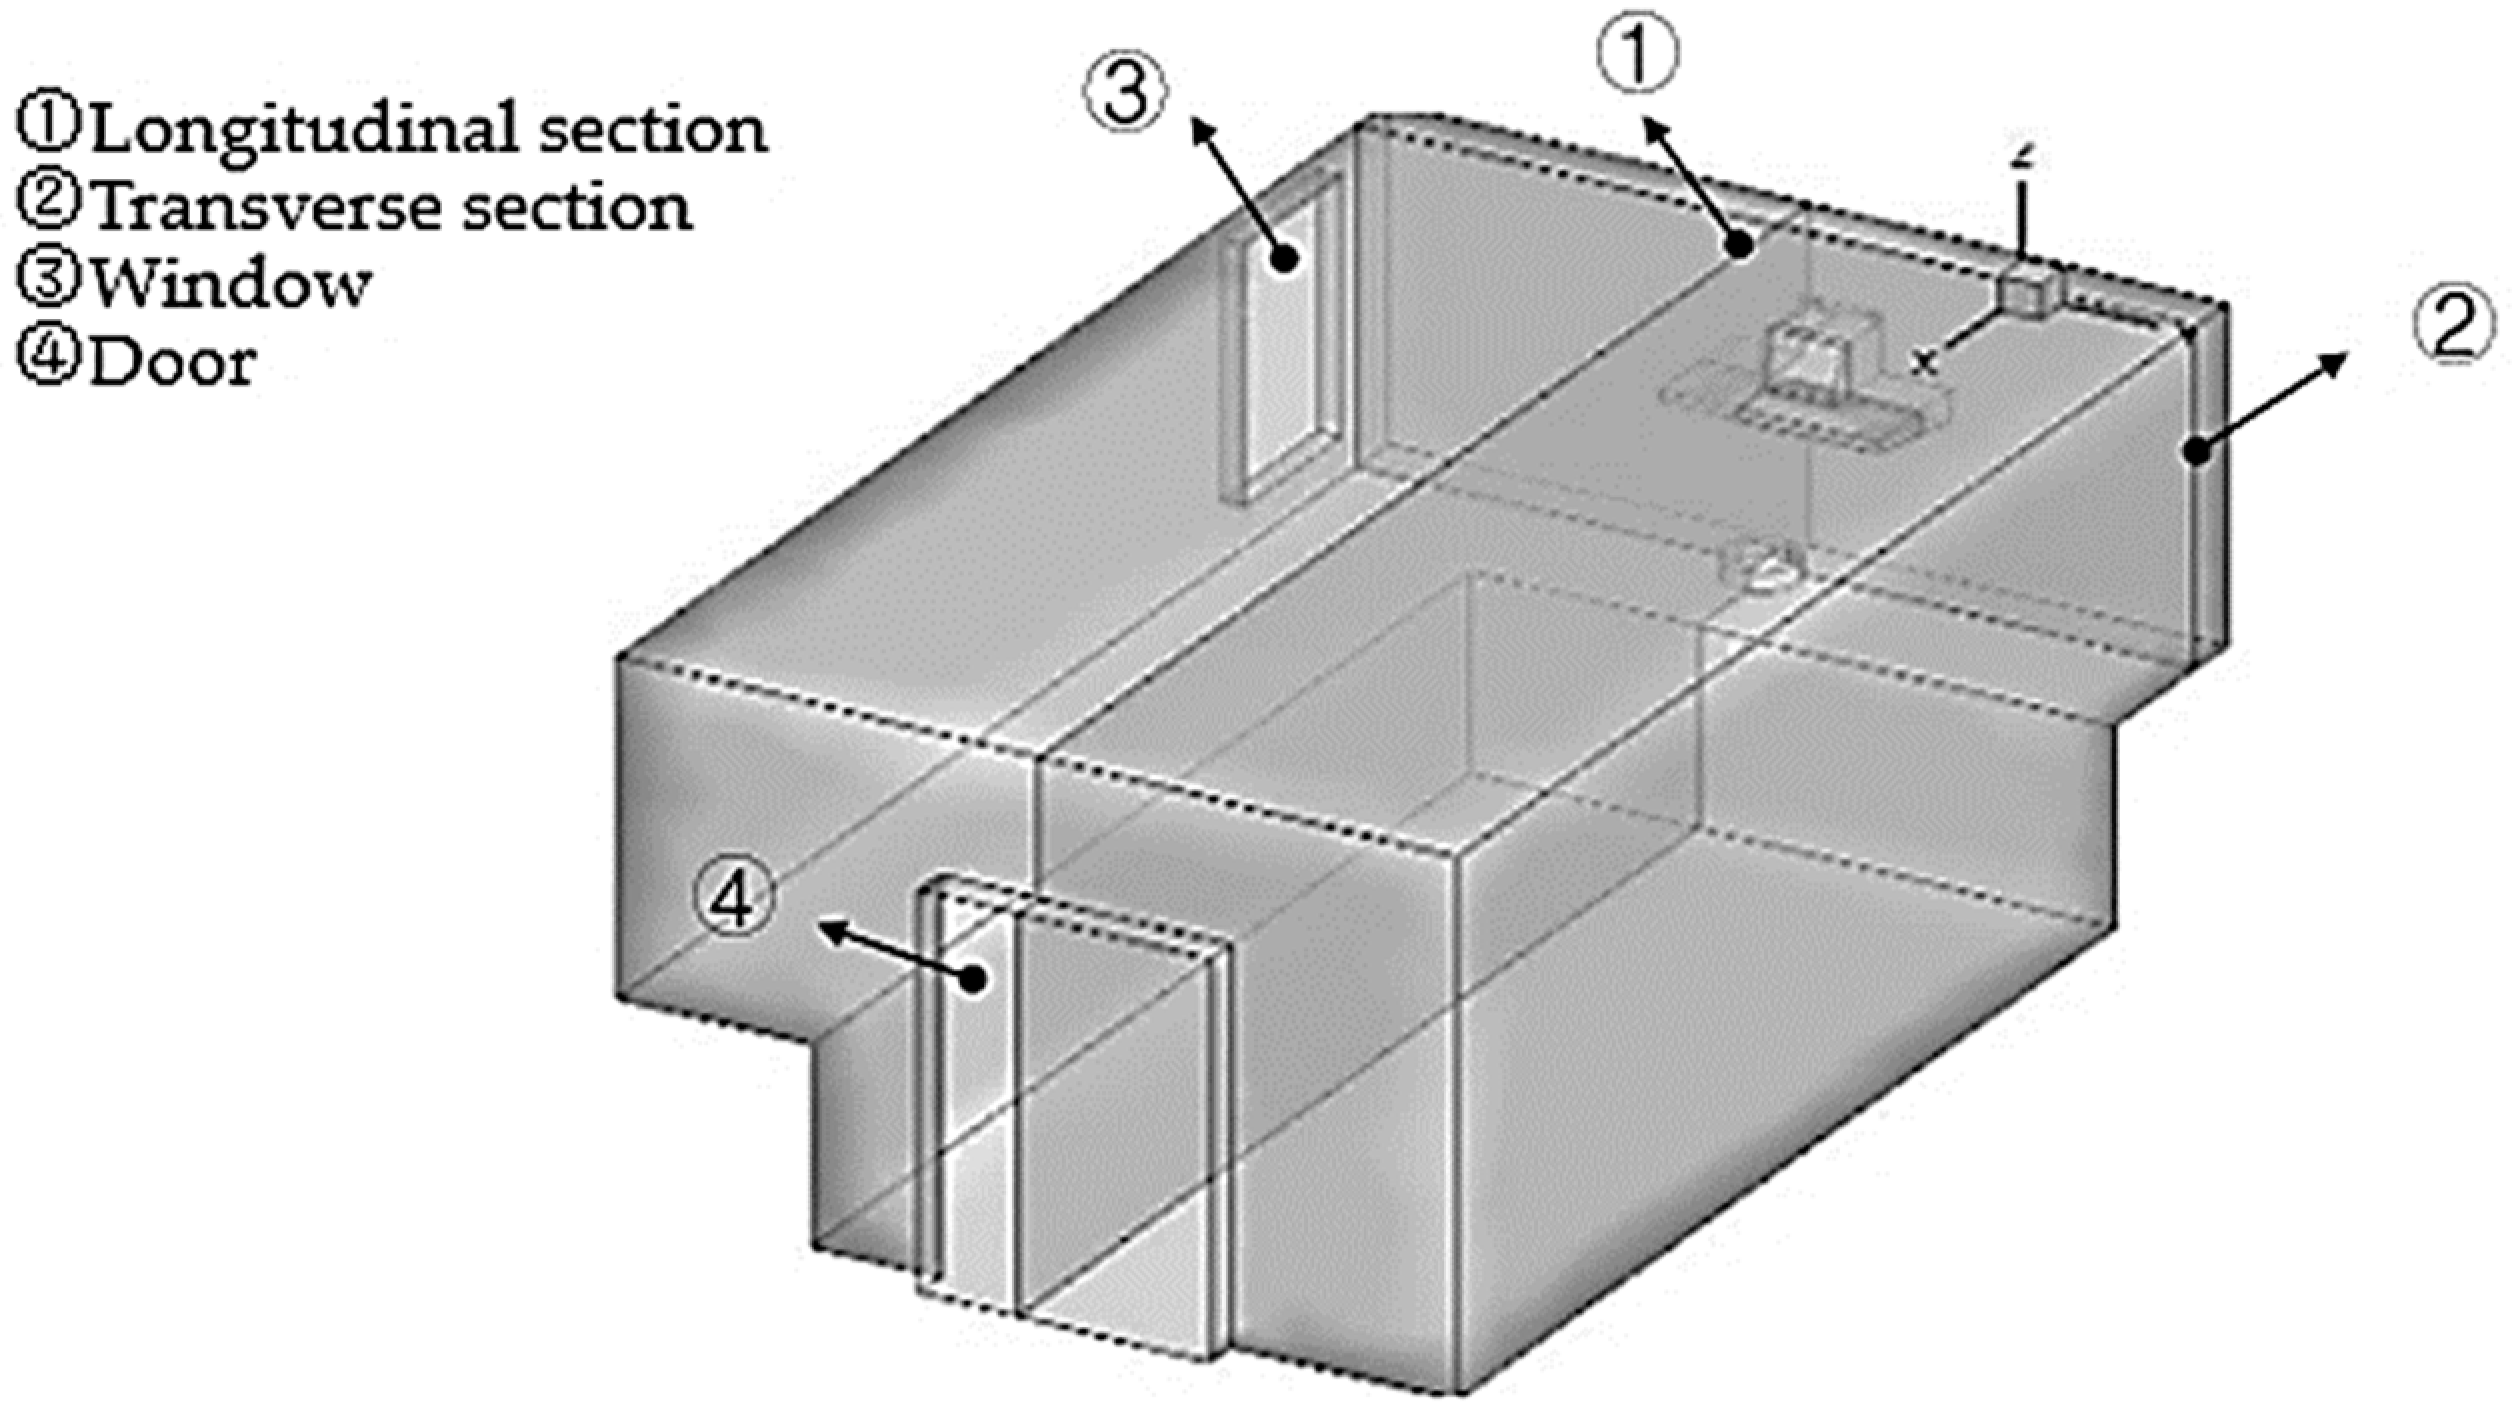
3.2. Simulation Model of Exterior Flow Field

The geometry model of the exterior flow field for cooker hood was built, basing on the flue simulation system. The commercial software Fluent is used to simulate the performance characteristics of cooker hood. The geometry model of simulation analysis is shown in Figure 6 and meshing effect is shown in Figure 7.

4. Results and Discussion
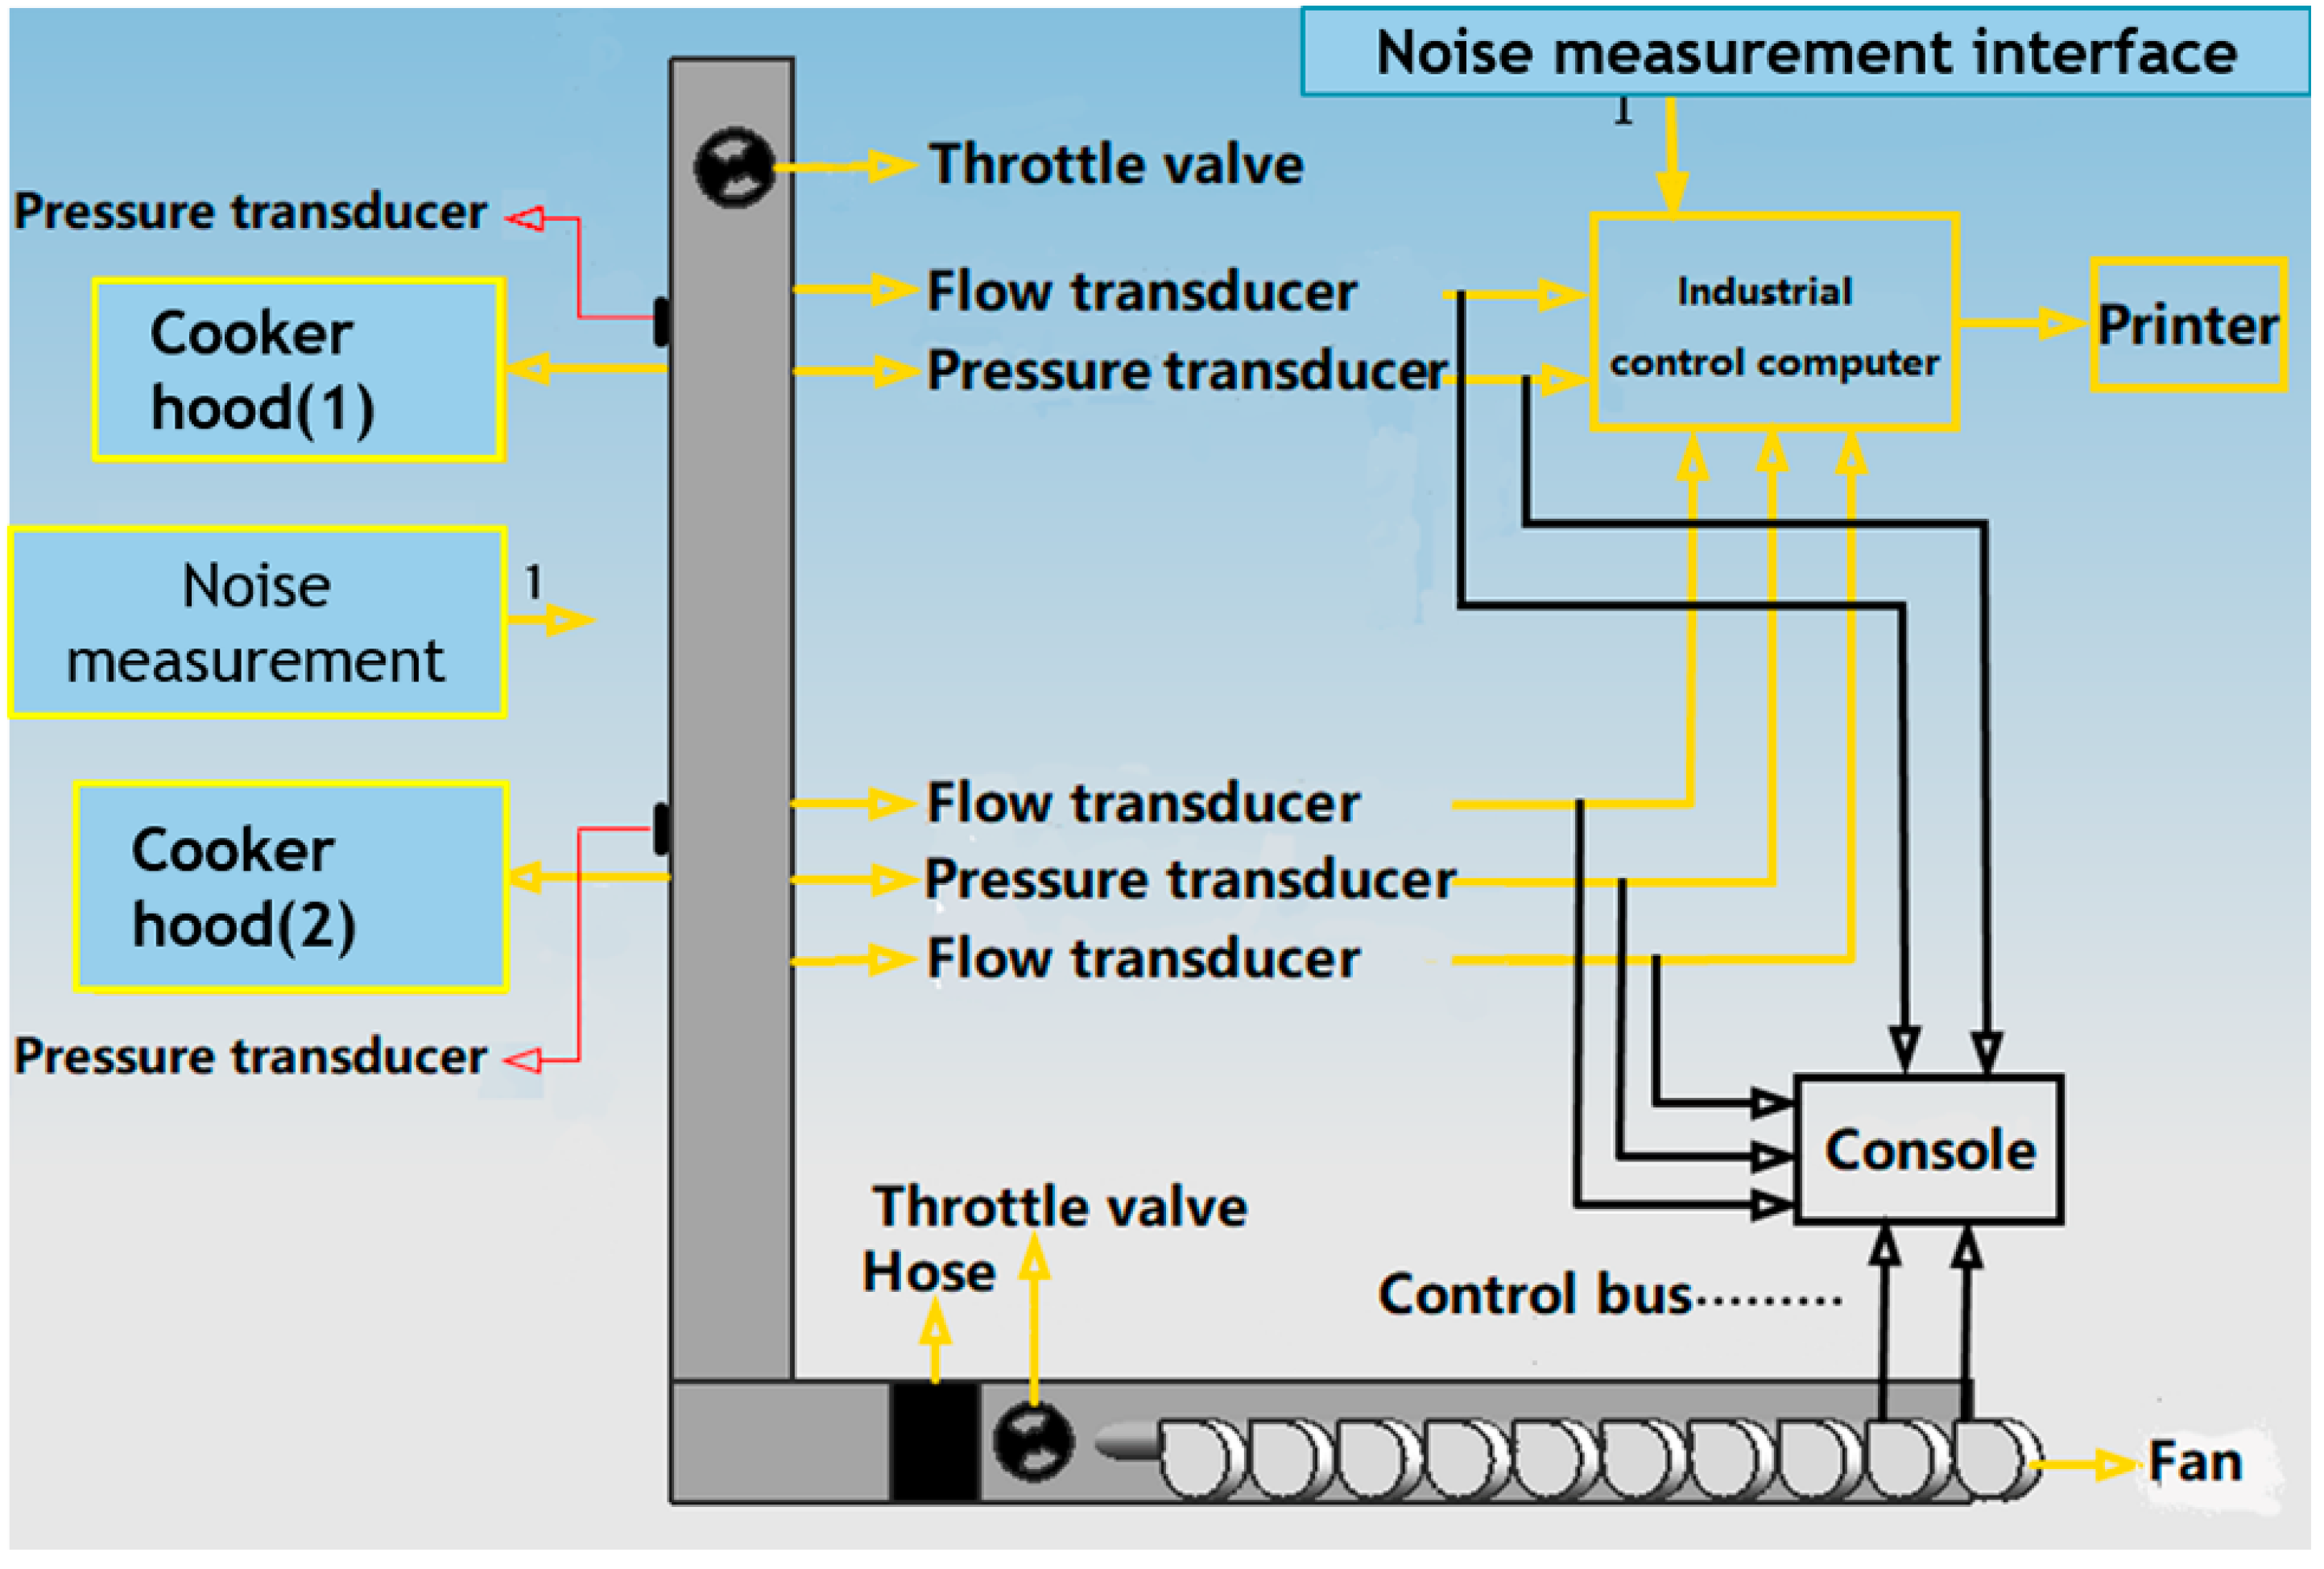
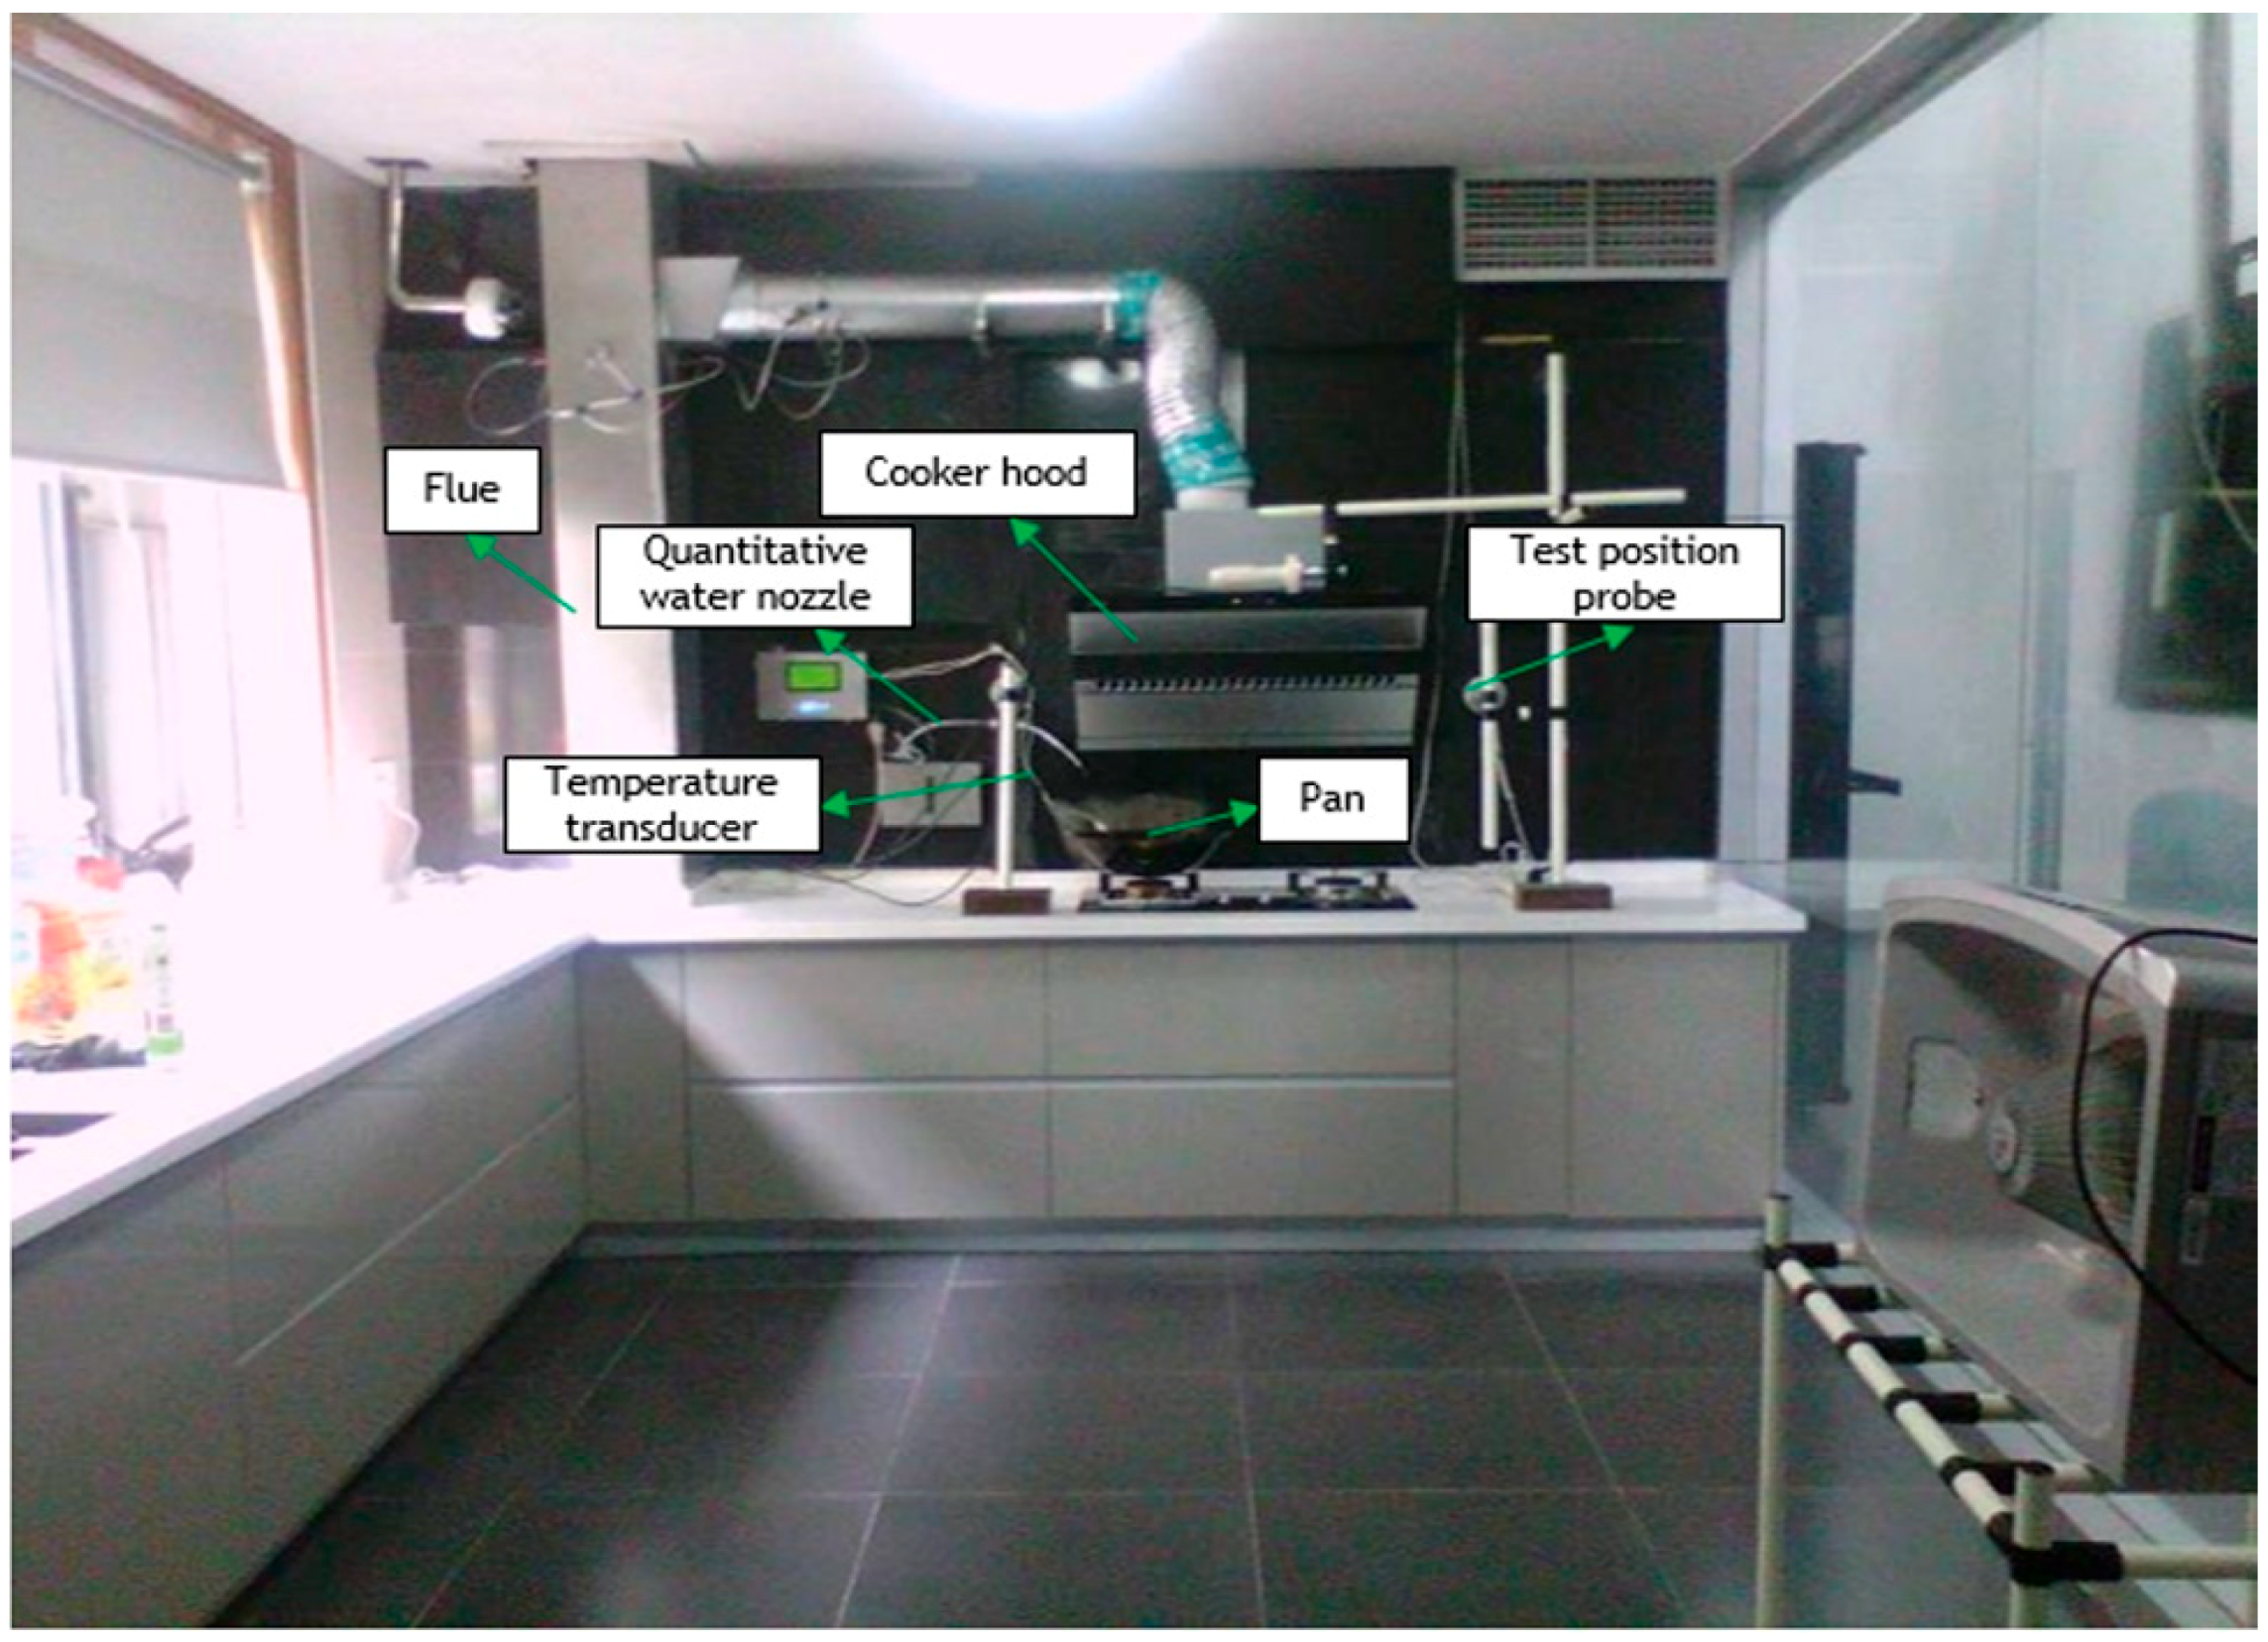
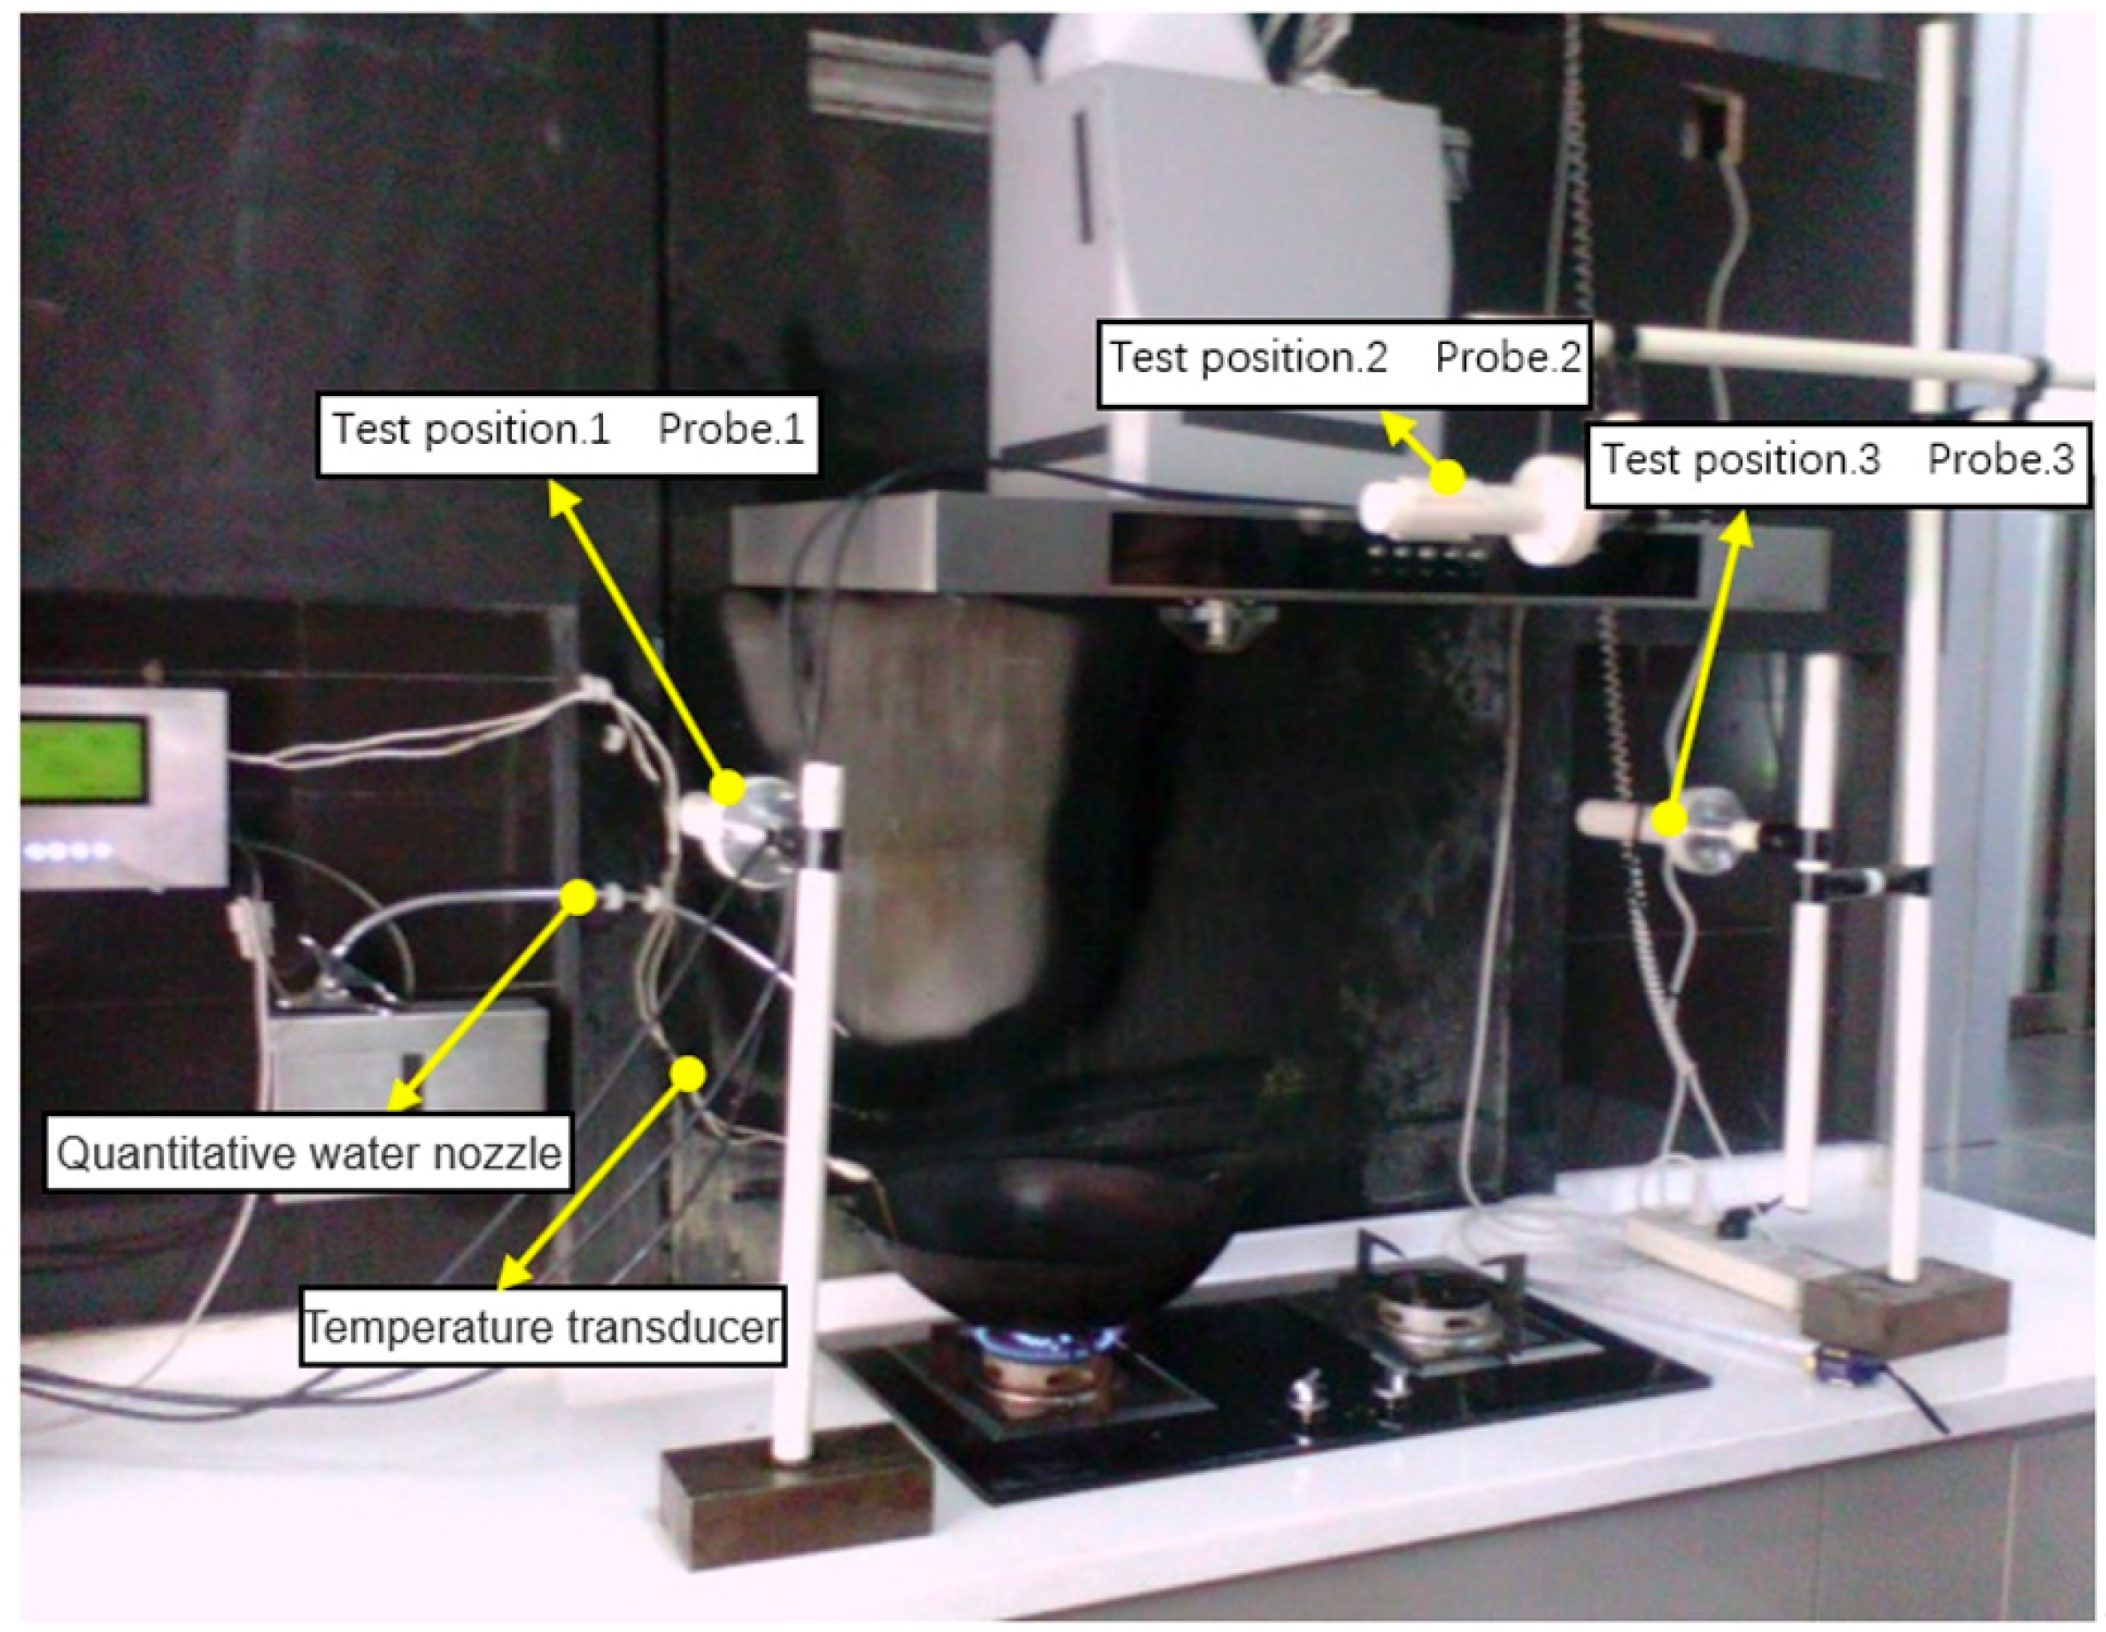
Taking the case of the 20-storey residential building, with the cooker hood installed on the bottom floor and the operating rate of 50%, the numerical simulation of the exterior flow field of the cooker hood was done using the commercial software Fluent. The oil fumes concentration, pressure distribution, and temperature distribution were analyzed when the window was opened and closed in the kitchen. To facilitate observation, the transverse section and longitudinal section of the oil fumes maximum escape position were selected to extract the results of analysis. The position is shown in Figure 8.
According to the calculation results extracted from the sections, the pressure distributions are shown in Figure 9 and Figure 10. It should be noted that because the reference pressure in the calculation is set to 101,325 Pa (standard atmospheric pressure), the actual pressure in the calculation result is the pressure value in the figure plus the standard atmospheric pressure.
It can be seen from the calculation results that the oil fumes flow channel is narrowed due to the existence of the oil baffle plate at the fumes outlet. There was a low-pressure region that formed between the oil baffle plate and the fumes outlet, which was conducive to oil fumes emissions. For both sides of the oil baffle plate, the pressure difference is 6 Pa when the state of window is open, and the pressure difference is 9 Pa when the state of window is closed, in the transverse section and longitudinal section.
In addition, the pressure drops on both sides of the oil baffle plate are larger when the window is opened at the same section compared with when the window is closed. When the window is opened, the air flow is good; the kitchen ventilation is smooth, and oil fumes’ exhaust is smooth. However, this is not conducive to oil fumes’ exhaust due to poor air flow when the window is closed. At this time, the air compensation mainly depends on the intake from kitchen door, as the distance is far away, the air intake is not smooth, and a large negative pressure is formed at the rear of the oil baffle plate close to the outlet, so that the flow velocity is increased to meet the requirements of the oil fumes’ exhaust. This phenomenon is better reflected in the calculation results of flow rate in streamline distributions of oil fumes.
The temperature distributions of the exterior flow field for the cooker hood are shown in Figure 11 and Figure 12; the initial temperature of the kitchen is 300 K, and the outlet temperature of the oil pan is 340 K. The results show that, when the window is closed, the temperature on the same section of the kitchen is obviously higher than when the window is opened. In fact, the level of the temperature is closely related to whether the oil fumes are discharged smoothly. When the oil fumes escape, it causes the temperature in the kitchen to rise, and the higher the temperature rises, the more the oil fumes escape. Therefore, when the oil fumes are not discharged smoothly, the temperature in the kitchen rises to a maximum of 315 K. The influence of heat conduction on the increase of ambient temperature is also related to the air flow in the kitchen. The more air flow, the better the heat dissipation and the lower the temperature rise in the kitchen. When the window is opened, the temperature rise is reduced by 5 K compared to when the window is closed. Although medium heat radiation, such as fumes and air, has an impact on the temperature rise, its influence is not greatly changed by the air flow, so it is not significantly influenced by whether the window is closed or not.
The results shown in Figure 11 and Figure 12 also prove that the farther it is away from the pan, the lower the temperature. The highest temperature point is near the oil pan, with the highest temperature when the oil fumes are generated from the pan, and the temperature gradually decreases as the oil fumes rise. In the convection movement, the temperature in the kitchen is increased, and the temperature of the kitchen is higher closer to the roof, which is completely consistent with the actual situation, and the correctness of the simulation calculation method is also verified.
The concentration field of oil fumes at the two entry boundaries was analyzed and calculated by a multicomponent simulation method. The oil fumes were divided into three groups: acetaldehyde, acetic acid, and water vapor. The concentration fields of acetaldehyde, acetic acid, and water vapor on the transverse section and longitudinal section are shown in Figure 13 and Figure 14.
It can also be seen from the above analysis that the oil fumes in the pan were not completely discharged by the cooker hood, and part of the oil fumes escaped from the upper right side to diffuse into the kitchen space. Due to the temperature of the oil fumes being higher compared with the surrounding air, it mainly concentrates on the kitchen roof as the air rises. This is the reason that the fumes’ concentration near the kitchen roof is obviously higher than the bottom in the simulation calculation results. The maximum concentration of escaping fumes on the right and front side of the cooker hood is shown in Table 1.
In addition, it can be seen from the calculation results that the concentration of the oil fumes far away from the oil pan is relatively low on the section, and the phenomenon is reflected more clearly in the simulation results on the transverse section.
The streamline distributions of oil fumes on the transverse section and longitudinal section of the kitchen are shown in Figure 15 and Figure 16. It shows that the air flow is blocked when the window is closed, and the airflow supply to the kitchen with cooker hood is no longer from bottom to top, but rather shows a tendency to be replenished from the periphery and the flow instability. The movement of the air flow changes, which leads to diffusion and escape of soot. This is the main reason that the fumes’ exhaust is not smooth and escapes more when the window is closed.
Figure 17 and Figure 18 show the simulation results of the velocity field on the transverse section and the longitudinal section. The velocity of the region above the cooker hood is smaller than the surrounding region, but the region is bigger. This indicates that the velocity of oil fumes that spreads to the rest of the kitchen was smaller when the fumes escaped into this region, and it verifies the analysis results of concentration field and streamline field of oil fumes: The oil fumes escaped more easily to this region through the right and front region of the cooker hood. Therefore, the escaped fumes can easily concentrate in this region, and this is also the main reason for the high temperature and fumes concentrations in the region. By contrast, this trend is more serious when the window is closed.
From the analysis results in Figure 17 and Figure 18, it can also be seen that the inhaled gas is rarefied in the case of poor airflow. According to the aerodynamic characteristic curve (P-Q) of the cooker hood, to achieve a certain flow rate, the flow velocity will naturally increase. Therefore, the flow velocity of the exhaust port of the cooker hood has obviously increased; this also shows that the simulation results are consistent with the actual characteristics of the hood.

5. Experiment

According to the primary path simulation analysis results fumes escaping, combined with high-rise buildings constructed flue simulation conditions, models for simulation analysis hood, the hood of the concentration field trials conducted testing. In the experiment, in order to simulate the production environment of oil fumes, when the oil in the pan was heated to a predetermined temperature, a quantitative nozzle was used to spray water into the pan to simulate the mixed fumes produced during cooking. Three groups of fumes concentration sensors are, respectively, arranged on the two sides and the front side of the cooker hood, and the test kitchen environment is shown in Figure 19. Consistent with the established simulation model, the oil pan is placed close to the side of the window, and the left side in Figure 19 is the right of the transverse section in the above simulation results.
In the experiment, taking into account the instability of the external atmospheric environment when the window is opened, in order to better compare with the simulation results, the experiment is carried out with the window is closed. The quantitative water nozzle will start automatically when the temperature of the oil pan reaches 260 °C in the experiment, and the reliability of the result is insured by several consecutive automatic tests. The test results are shown in Figure 20.
As shown in Figure 20, the concentration of oil fumes (1) is the test result of the right side of the oil pan; the concentration of oil fumes (2) is the test result of the front side of the hood, and the concentration of oil fumes (3) is the test results away from the left side of the oil pan. From the test results, it can be seen that the peak value of the maximum concentration on the right side is 0.26 mg / m 3 , and the maximum value of the concentration of smoke on the front side is 0.30 mg / m 3 . Because the simulation analysis uses the steady state calculation method, the concentration of oil fumes obtained is equivalent to the maximum of the actual concentration test of oil fumes. The test results are compared with the concentration of oil fumes of the simulation results in Table 1 and the errors are 5% and 11.7%, respectively. The error of concentration of oil fumes (2) is slightly larger, which is mainly due to the interference of air flow on the front side of the hood in the actual test environment. Moreover, the concentration of oil fumes (3) is only 0.07   mg / m 3 , and there is almost no escape, which is consistent with the simulation analysis. Therefore, the test results verify the simulation analysis method.

6. Conclusions

A field test and CFD modeling were conducted in a 20-storey residential kitchen with the cooker hood installed on the bottom floor, and the operating rate was 50%. The effects of operating rates of cooker hoods on flow characteristics were analyzed. Based on the investigations presented in this paper, the key conclusions are summarized below.
(1)
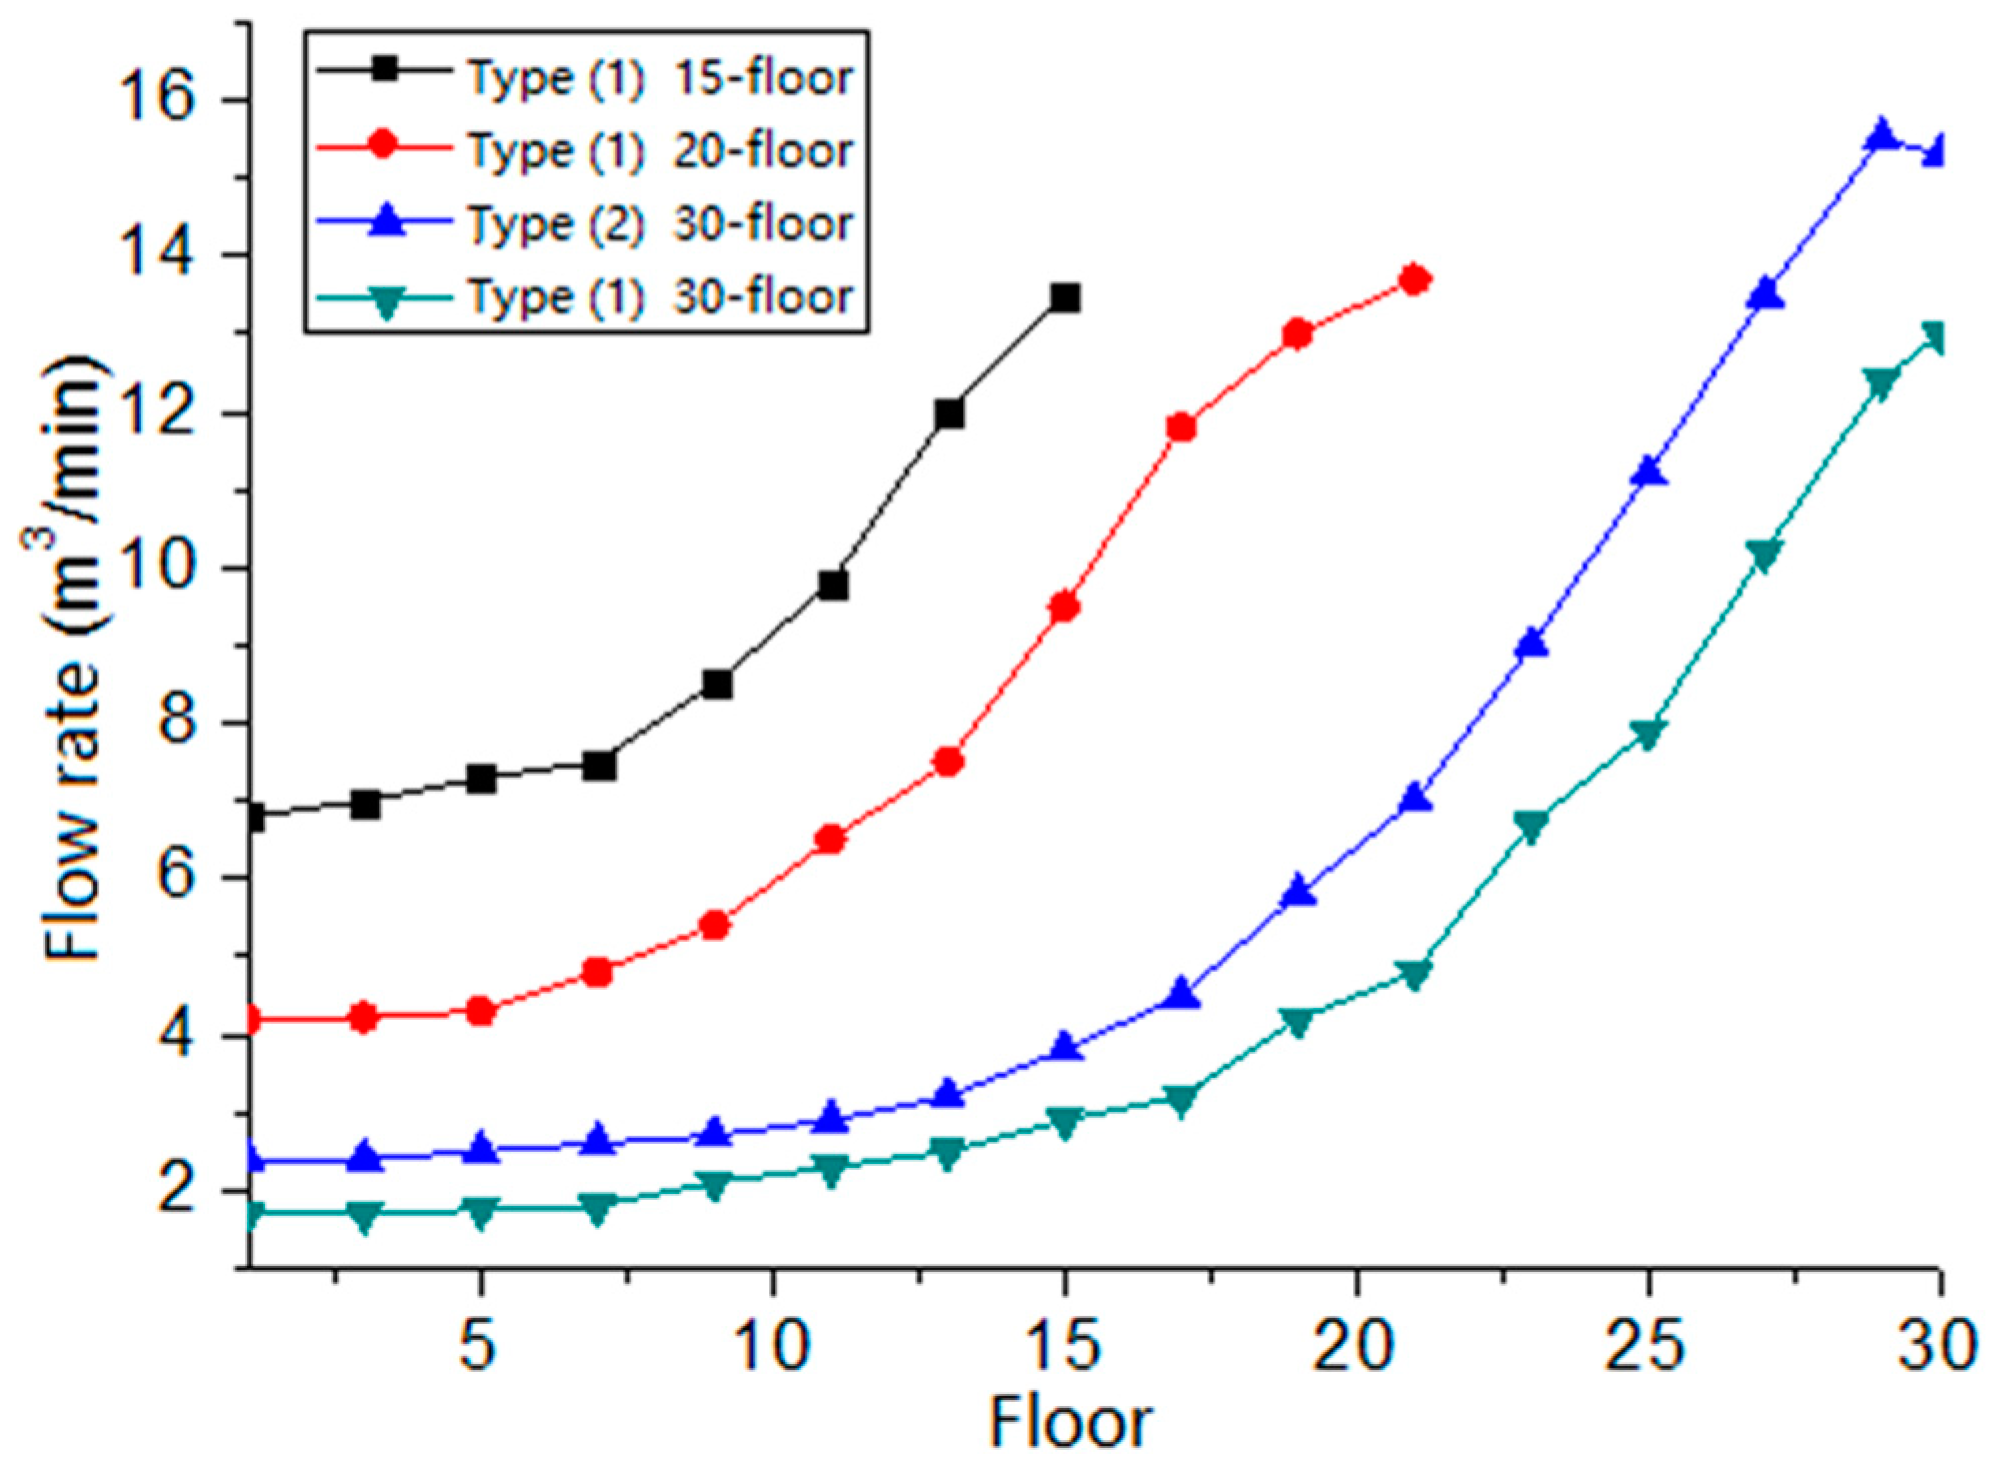
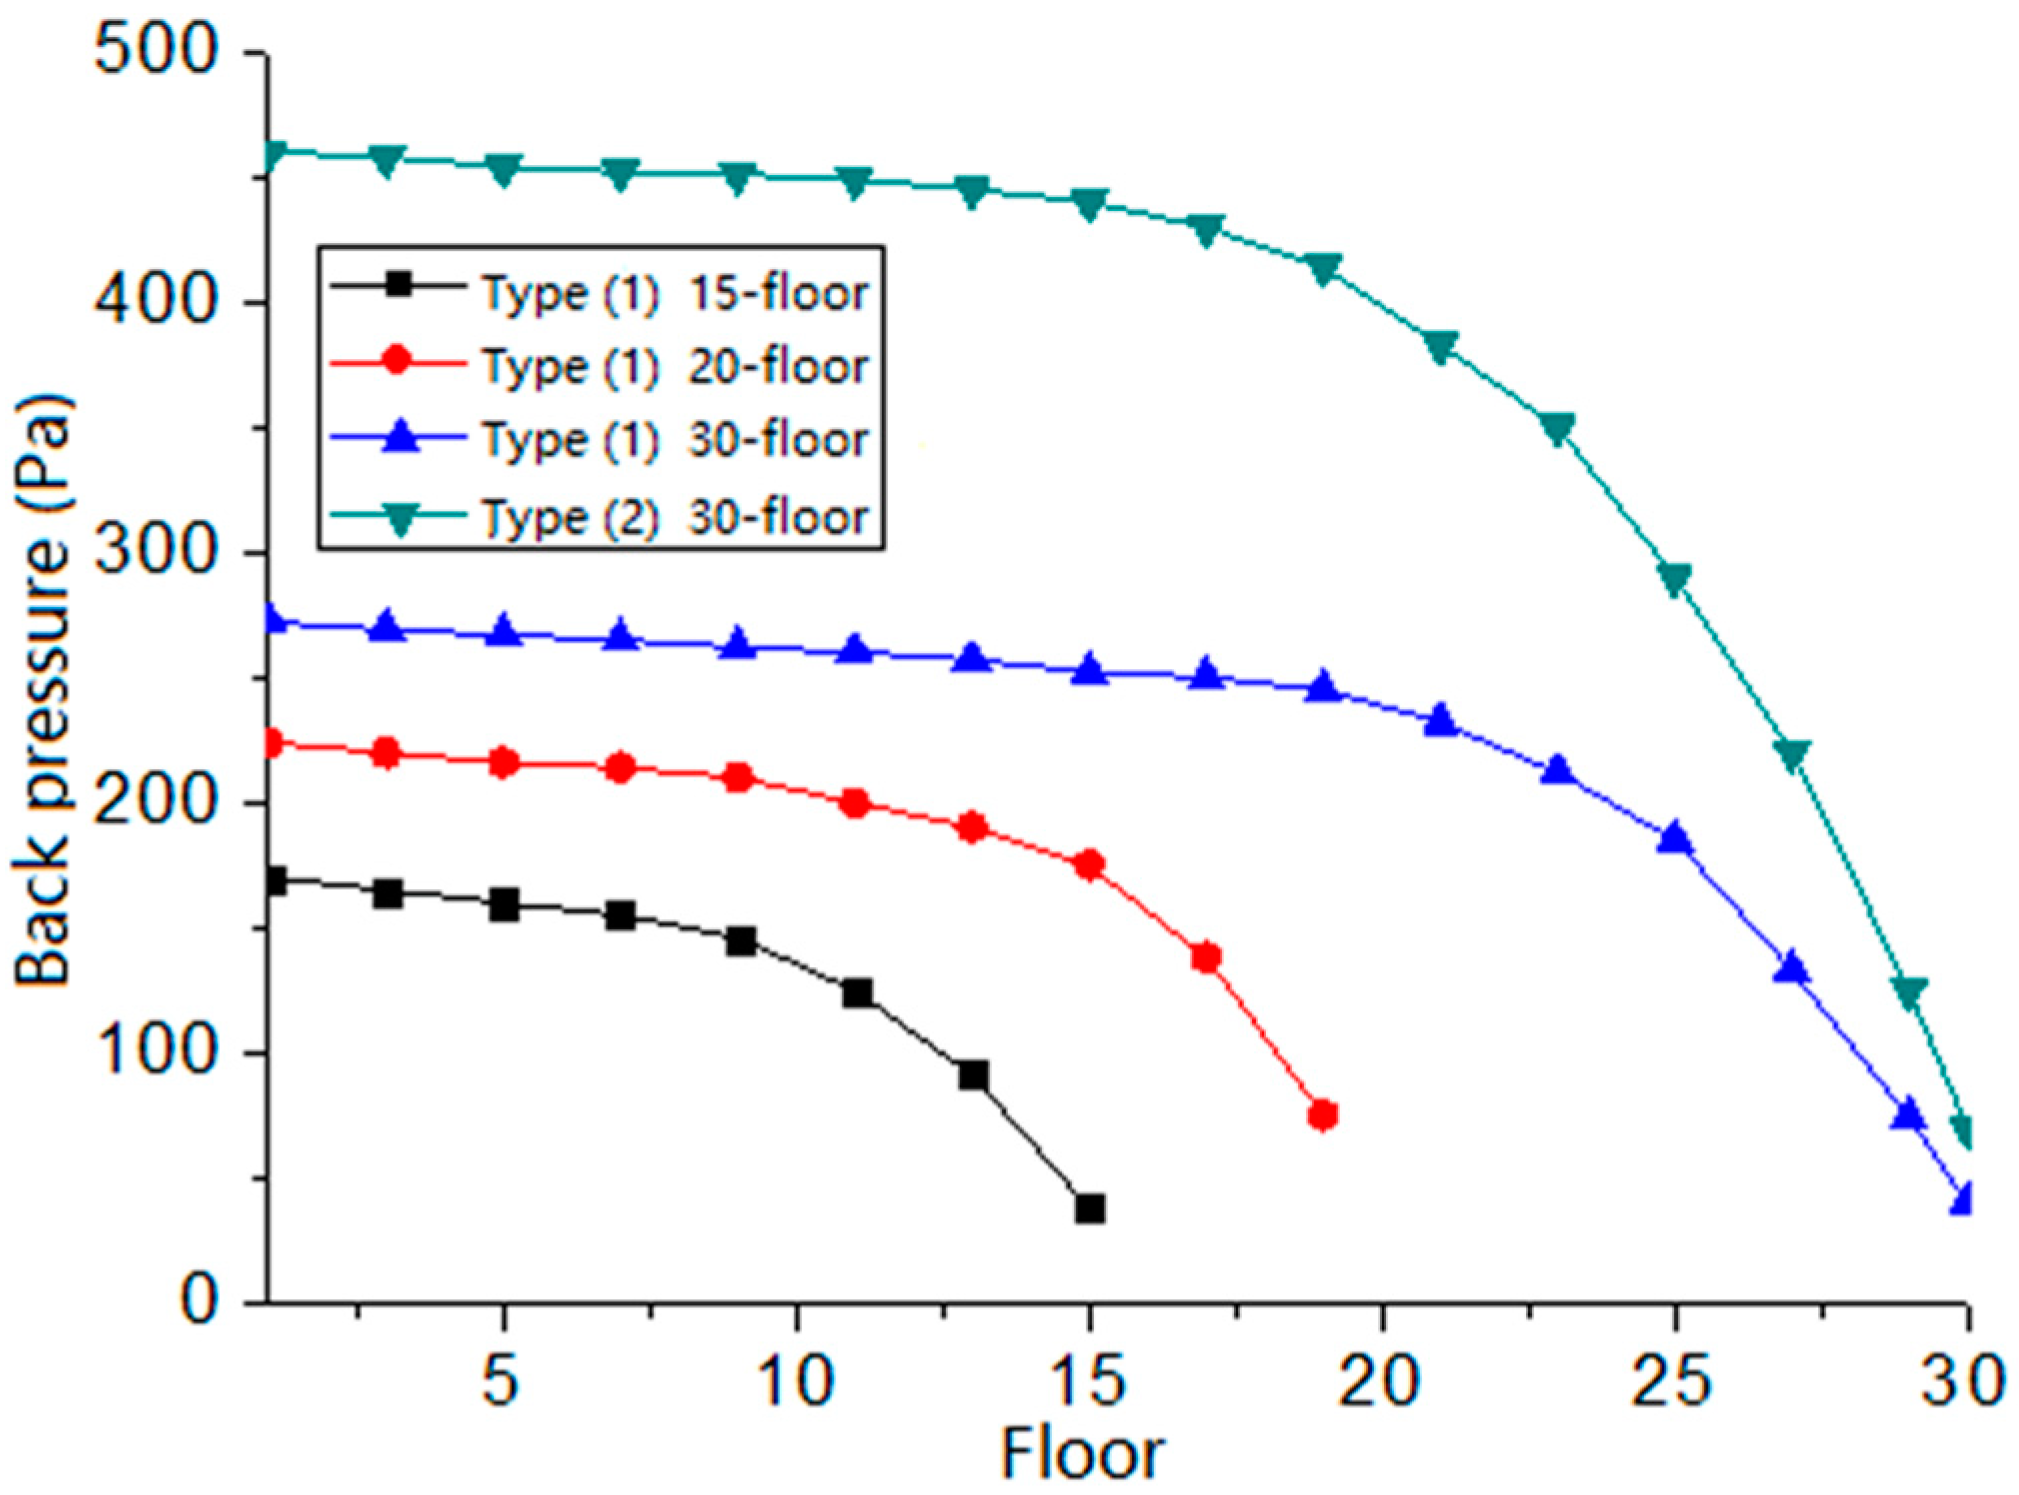
The effects of different operation rates and different installation floors are considered in this study, and a calculation model for the centralized flue system of high-rise residential buildings is proposed. The correlation of the back pressure and flow rate of cooker hoods with the installation floors is obtained by the model, and it provides a feasible theoretical method for the performance design of cooker hoods and the user selection of cooker hoods.
(2)
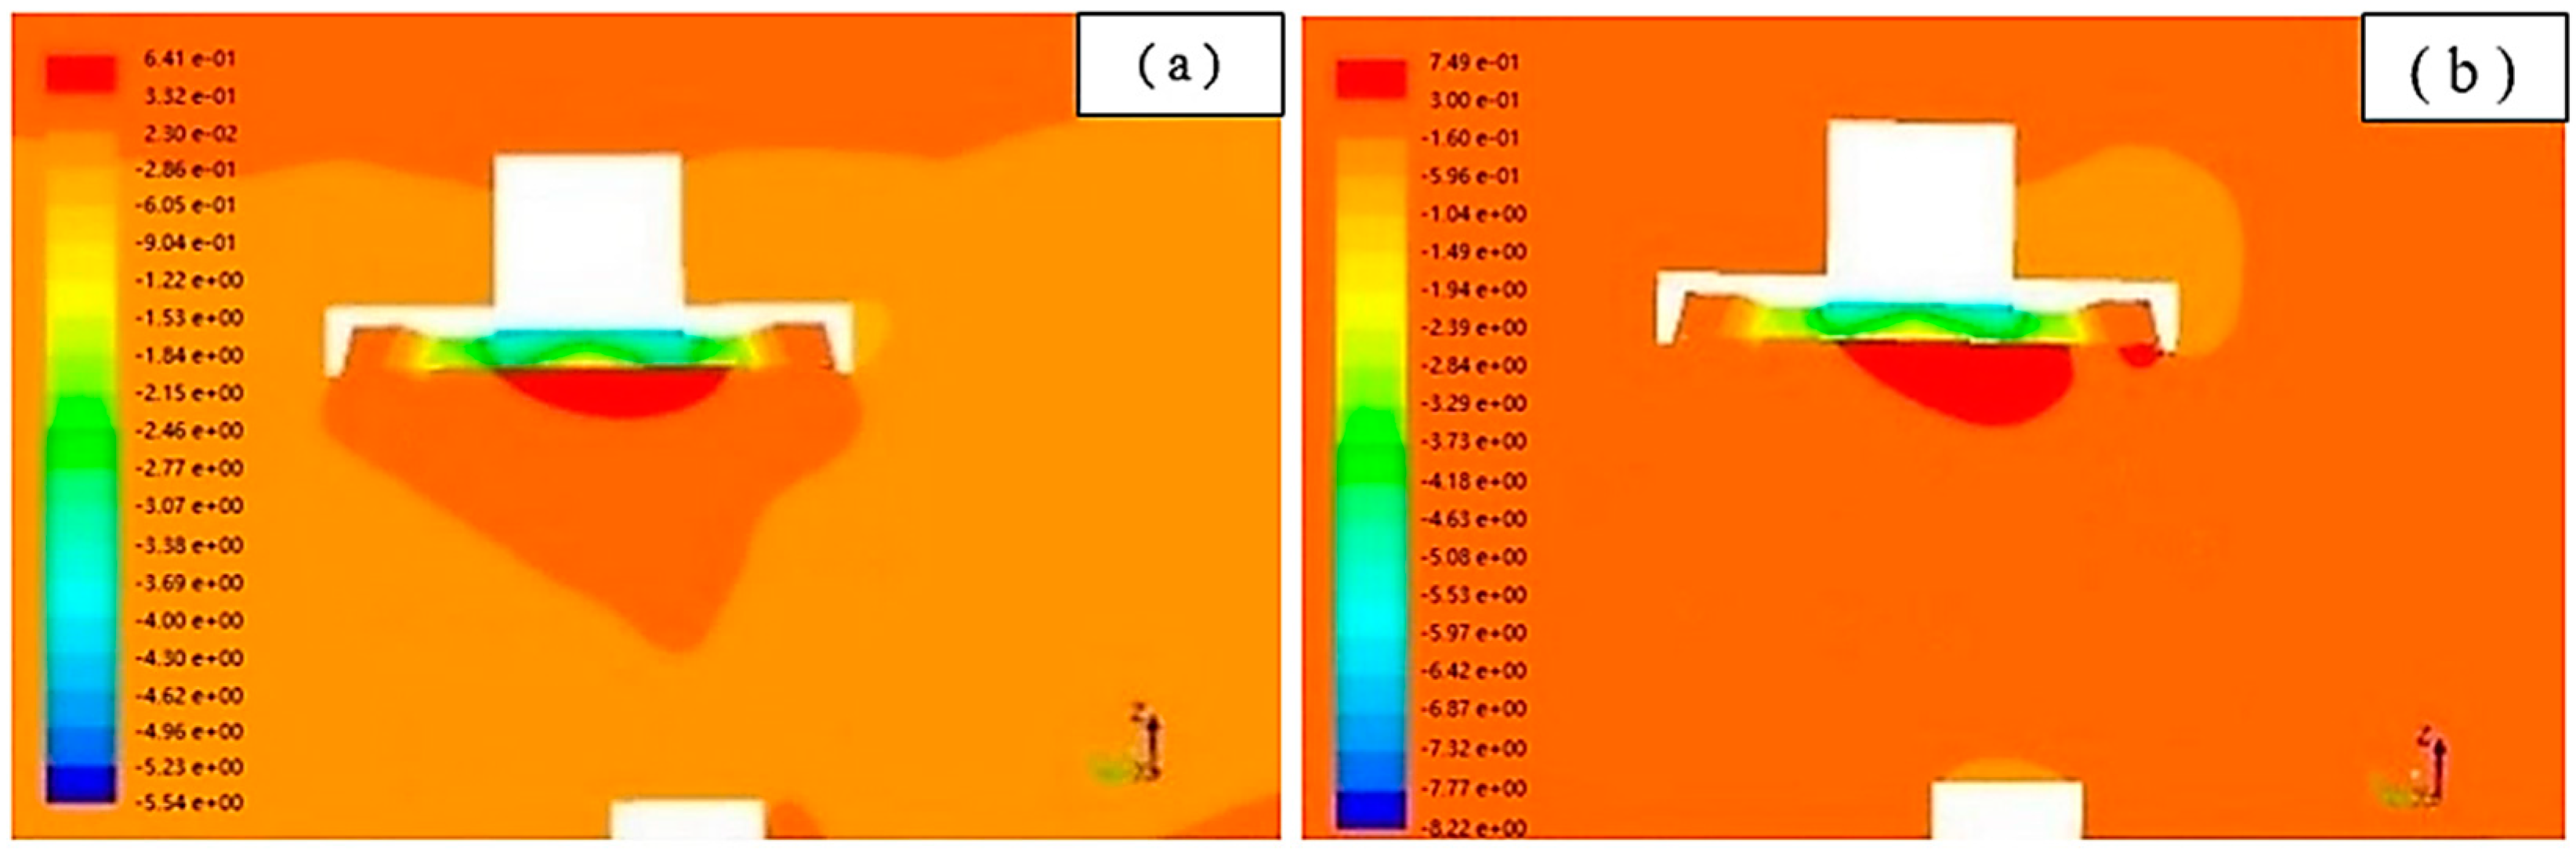
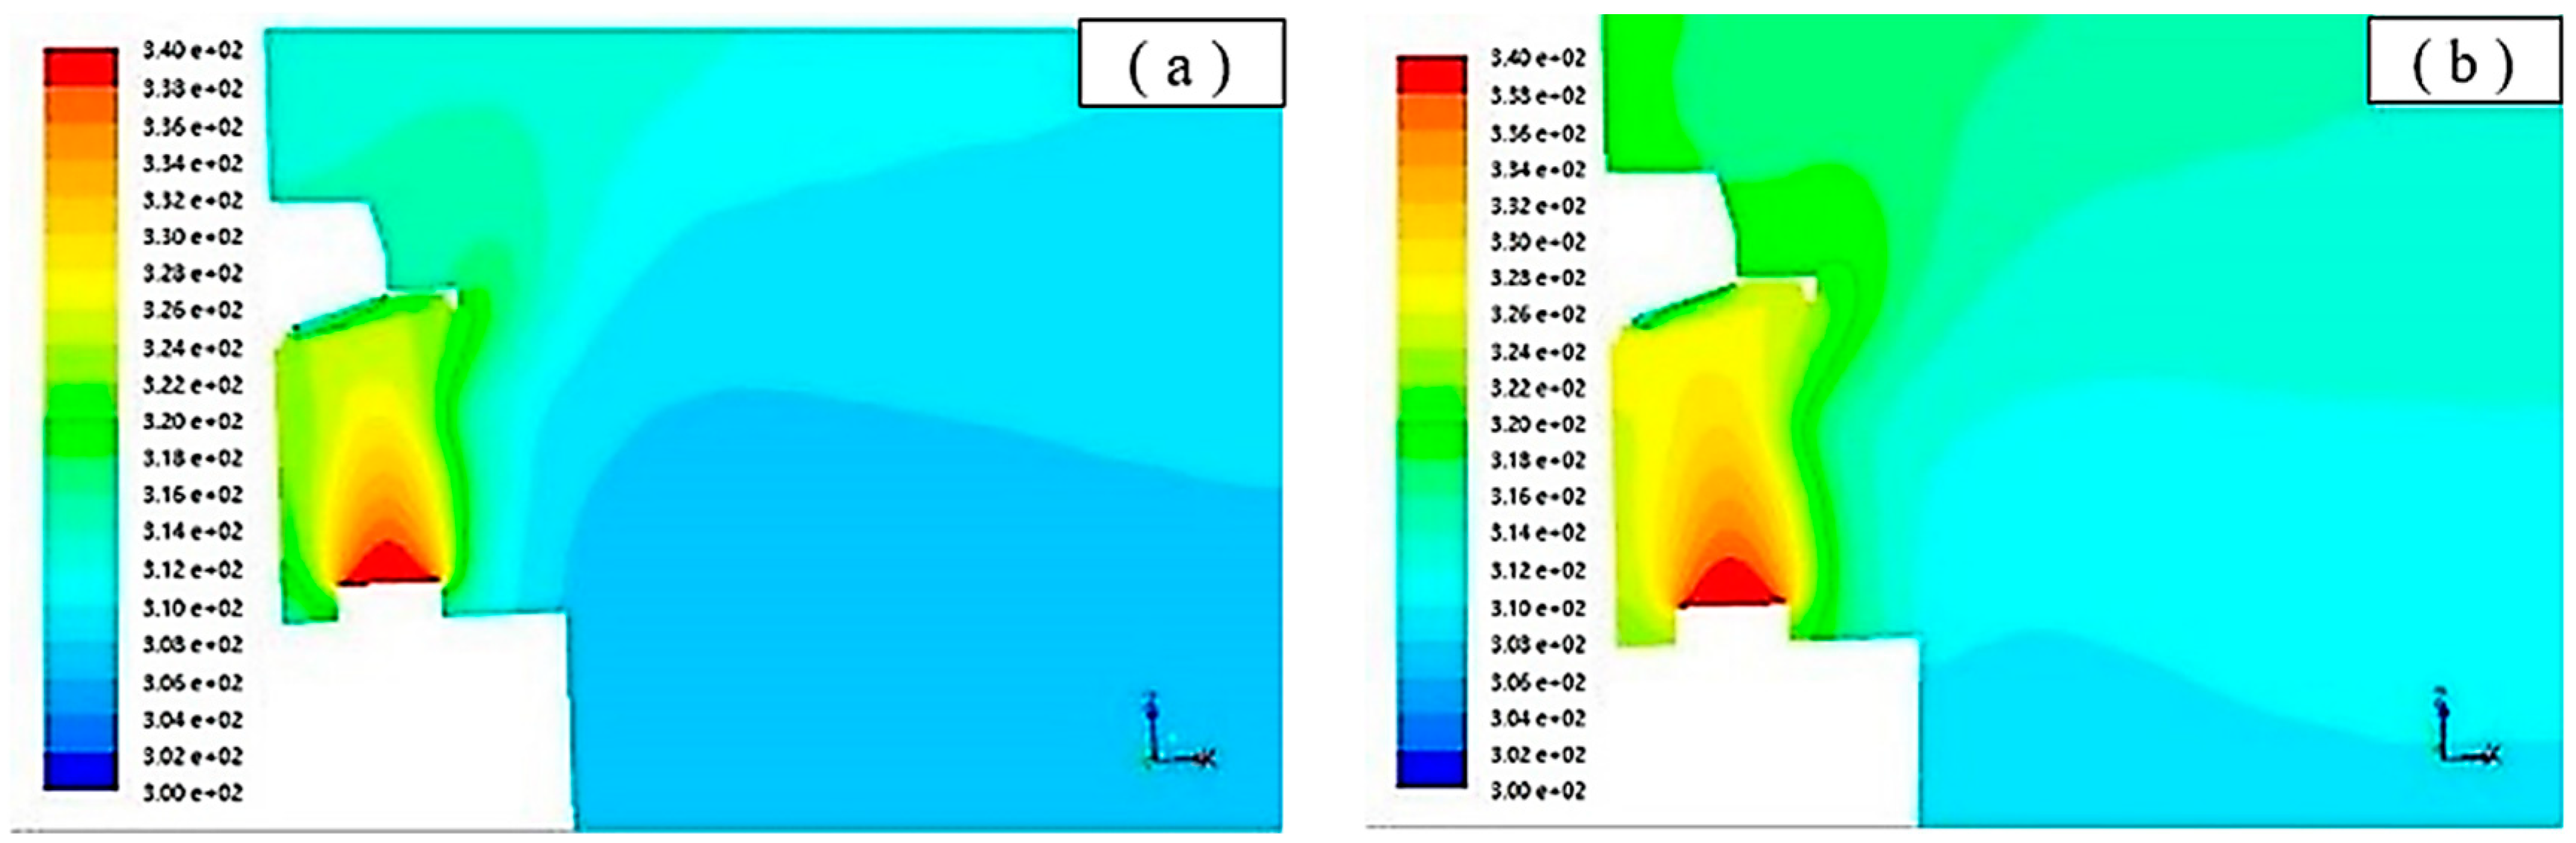
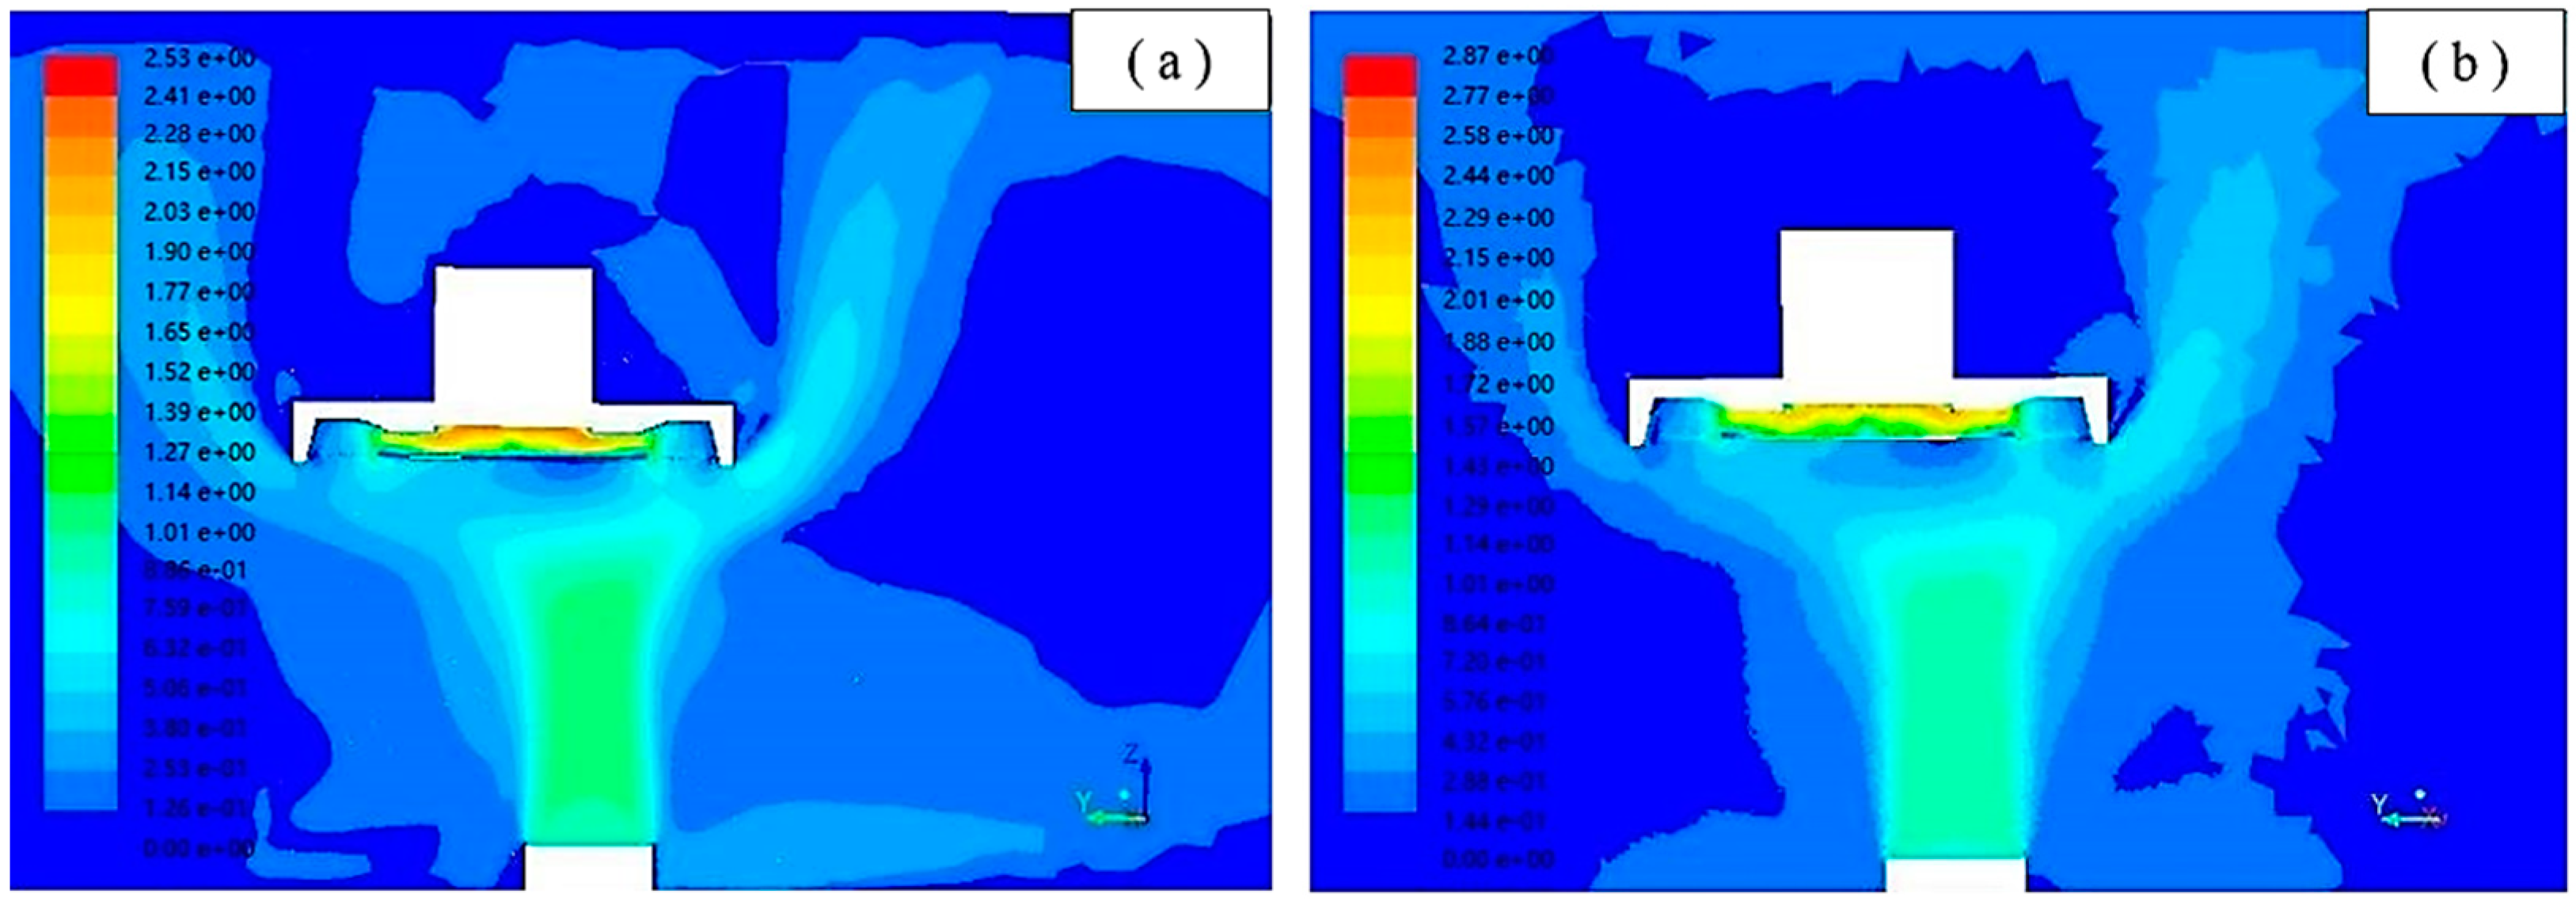
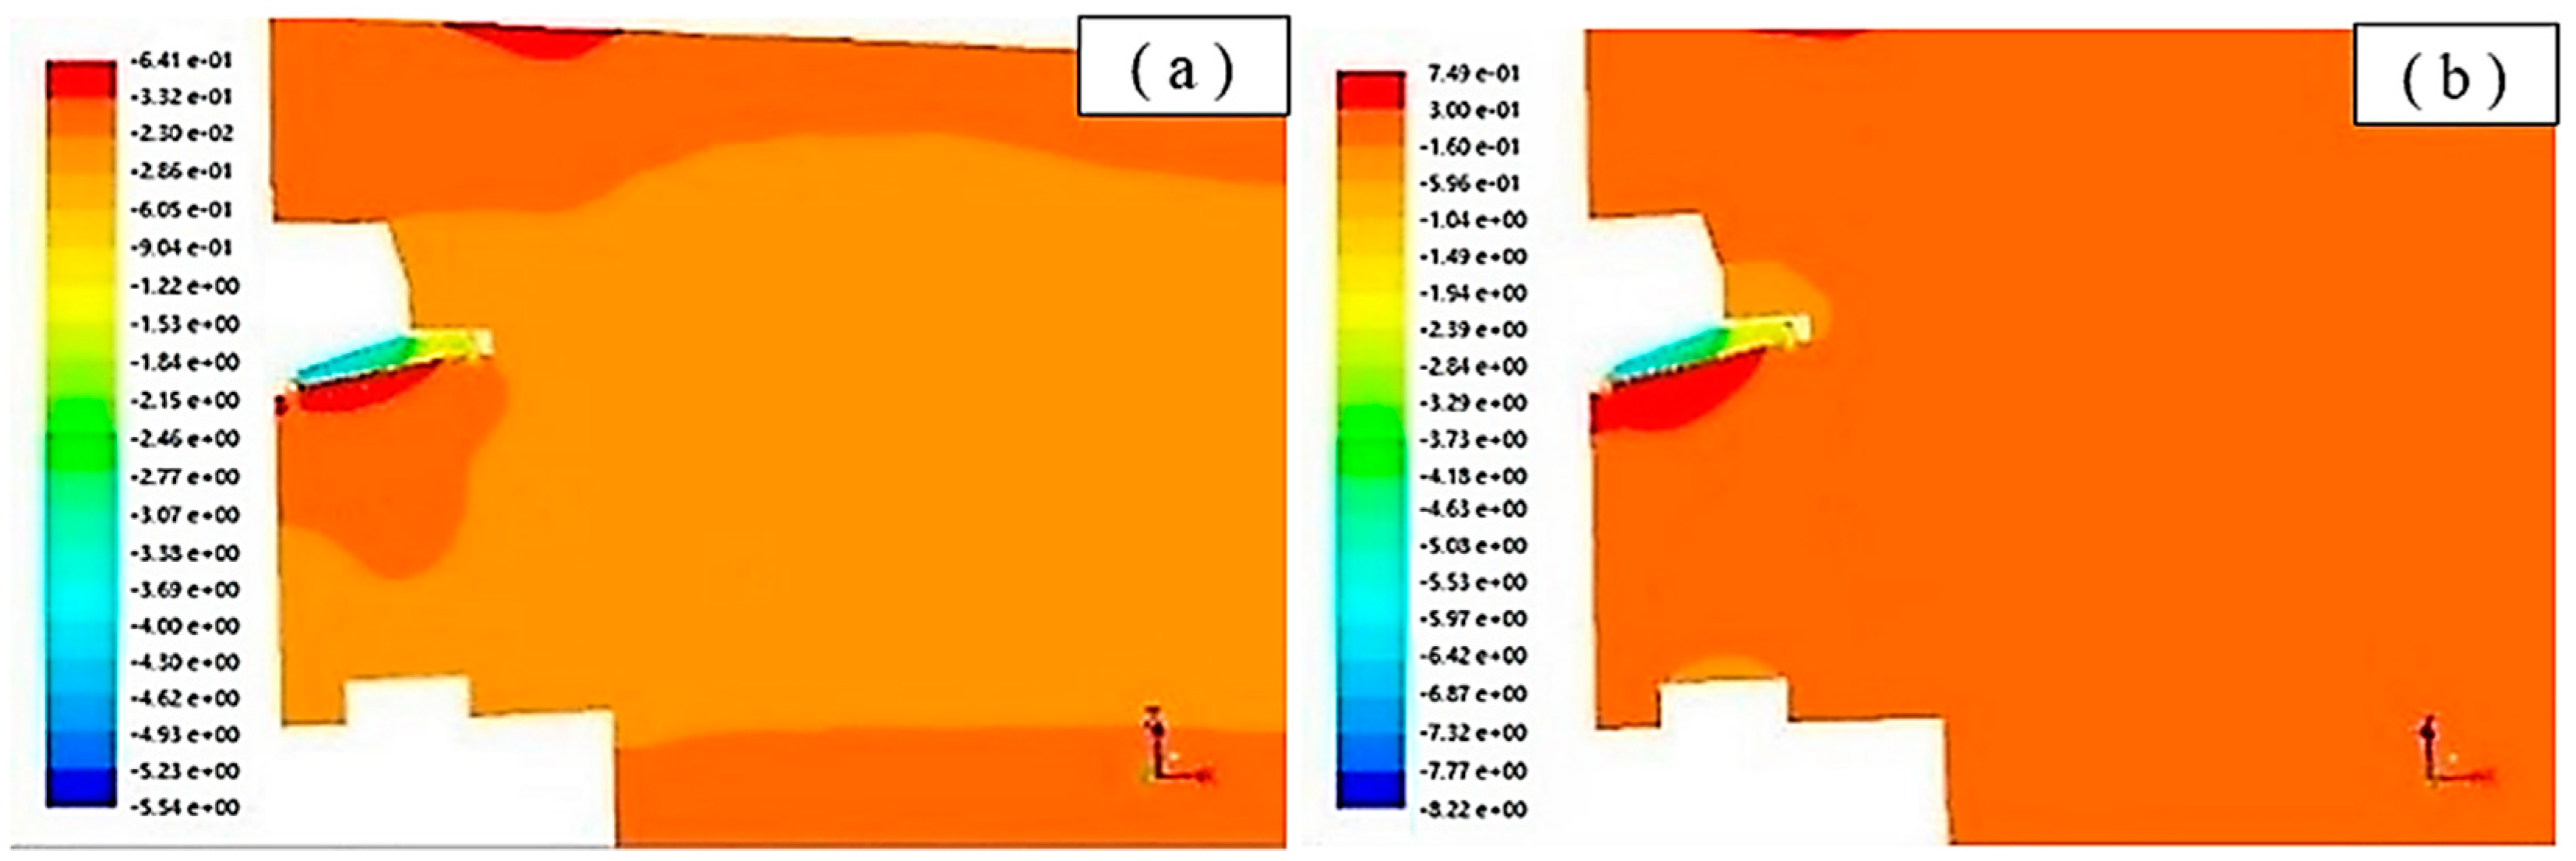
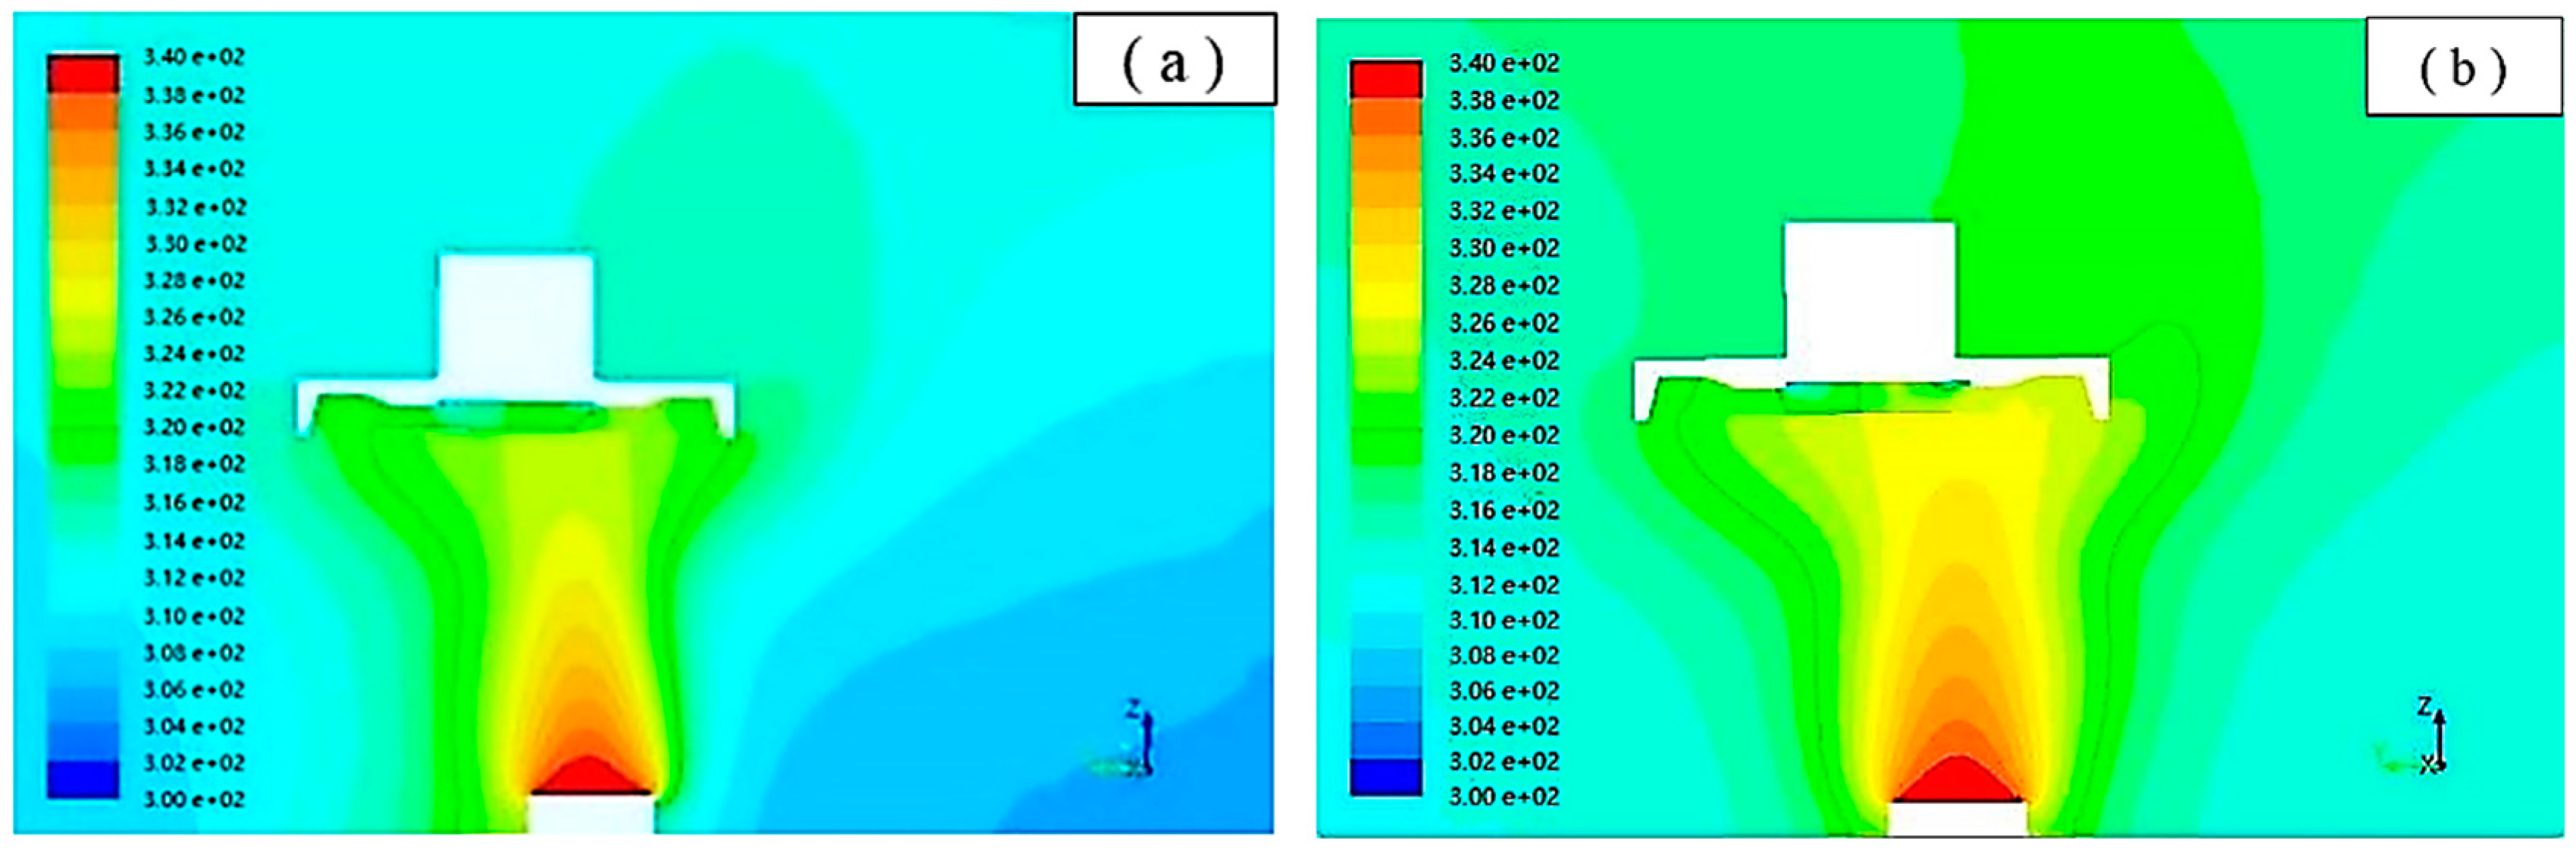
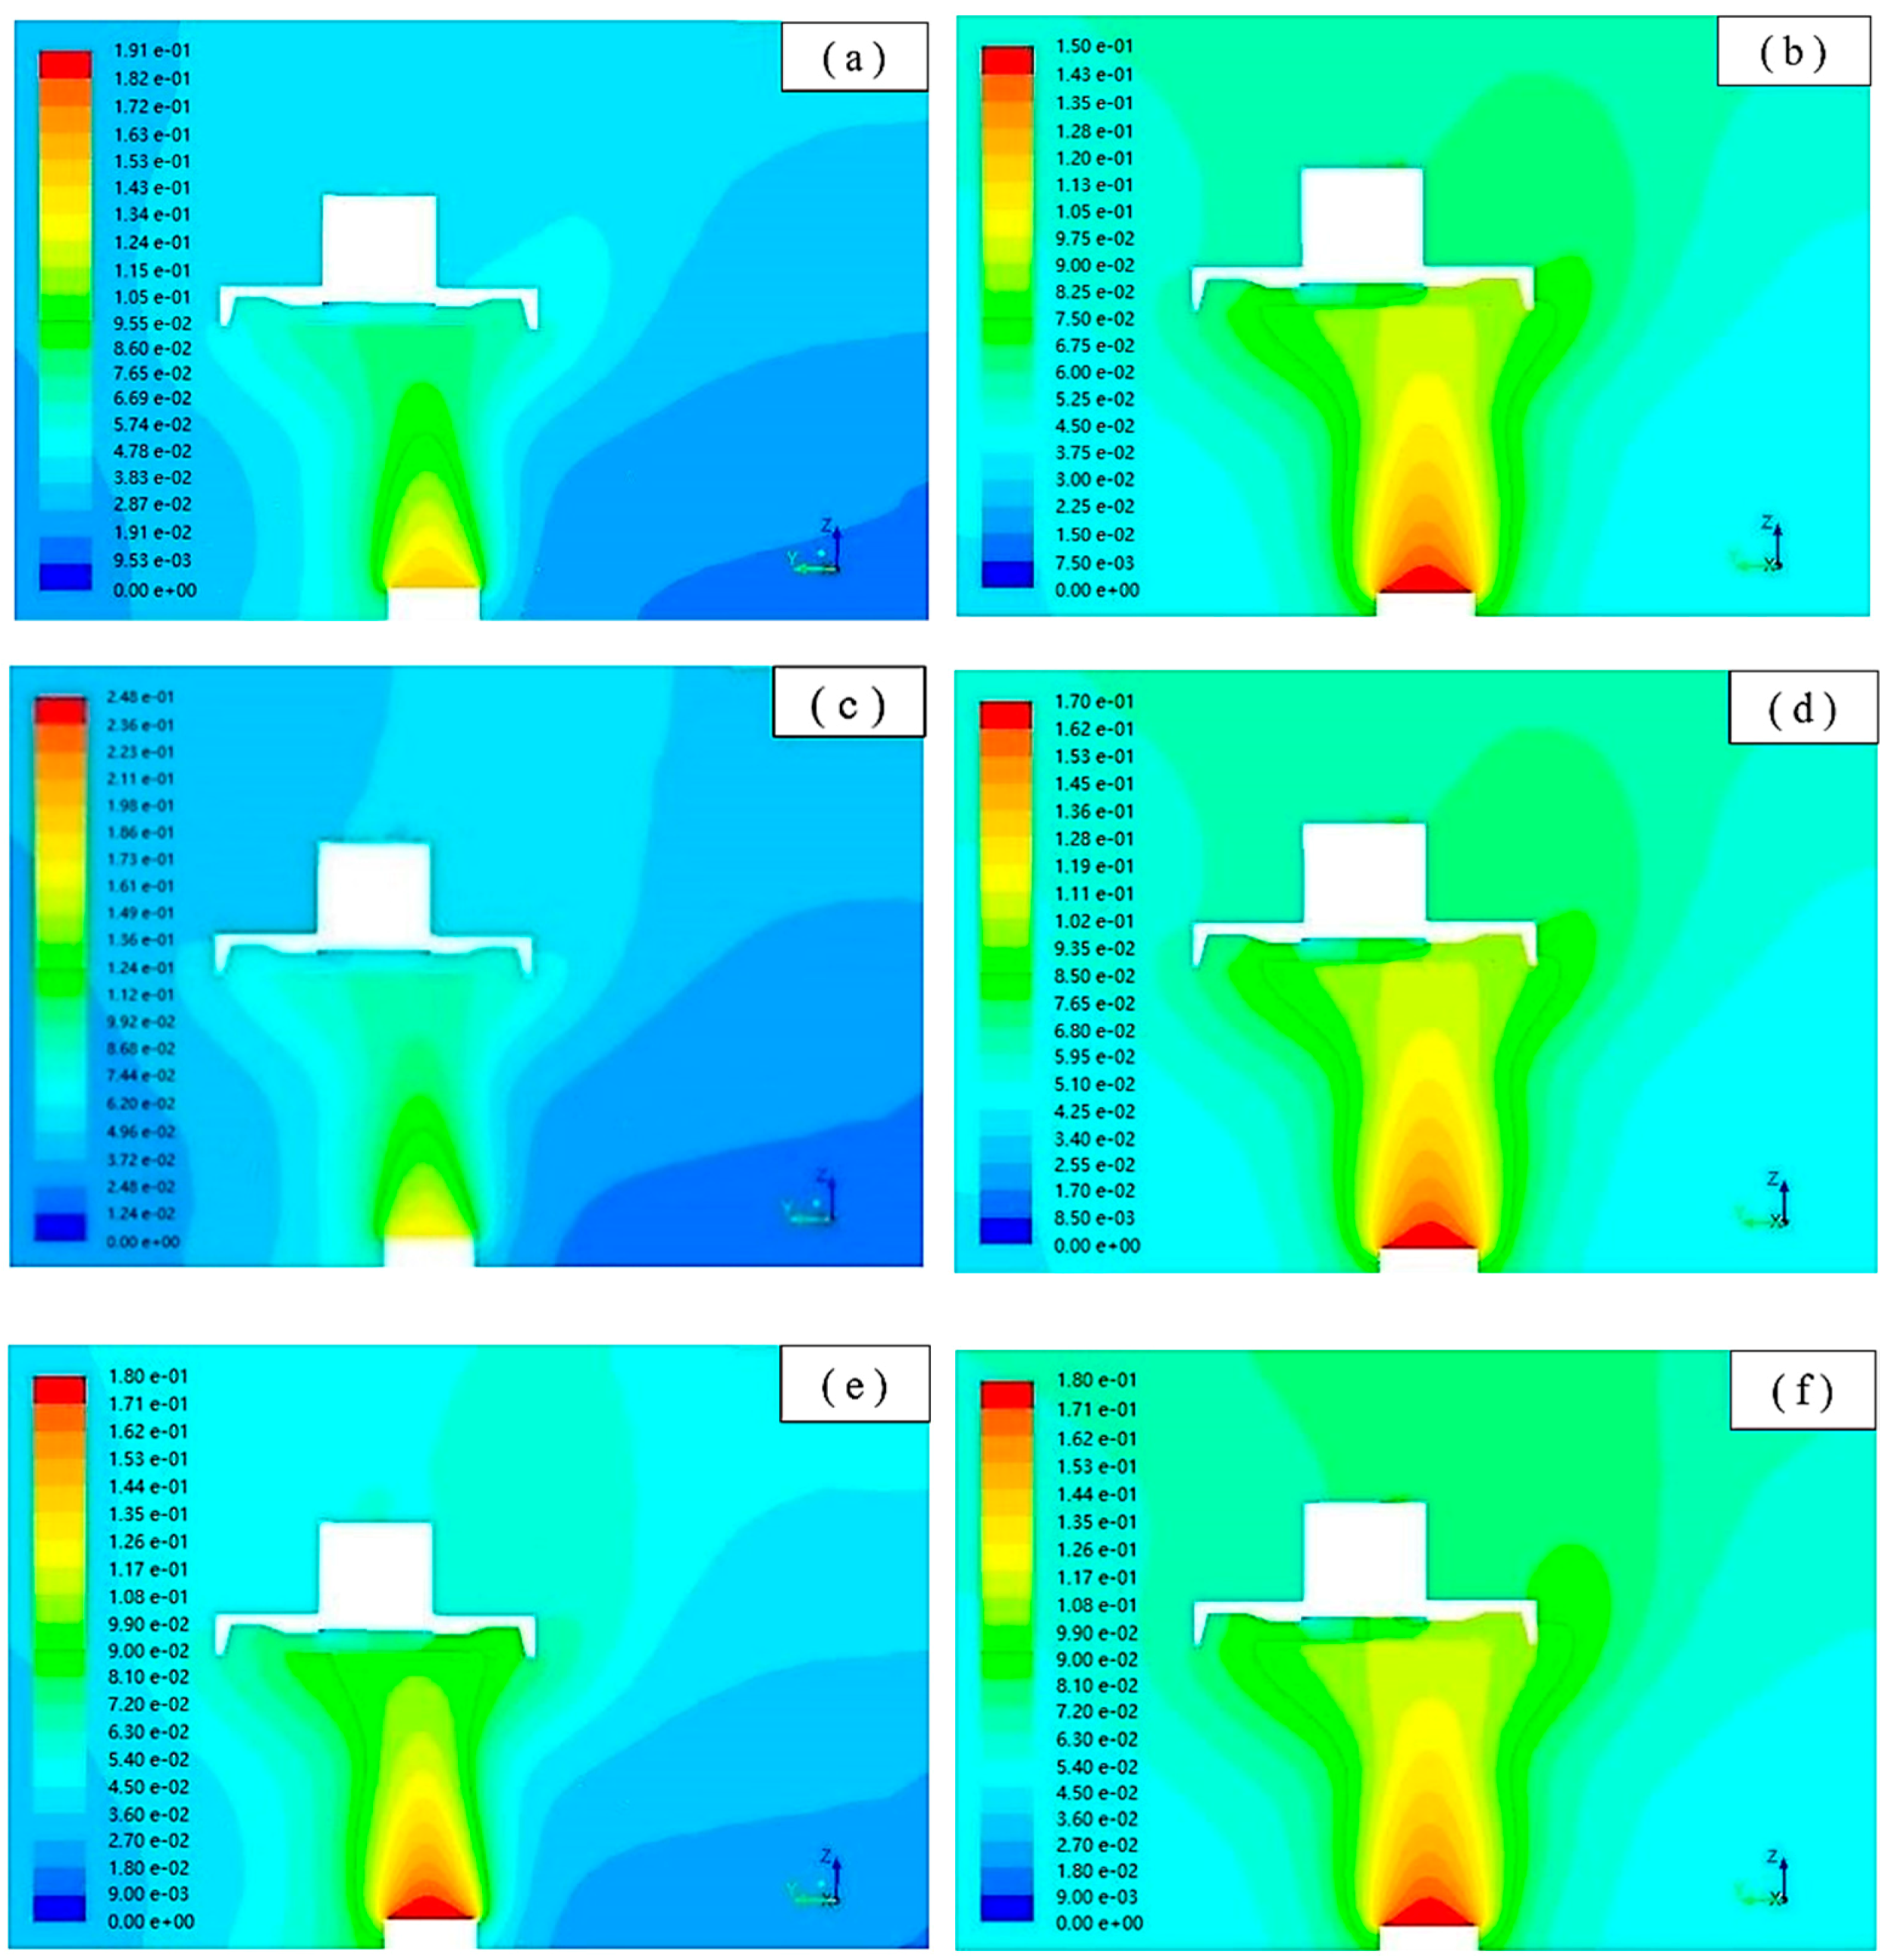
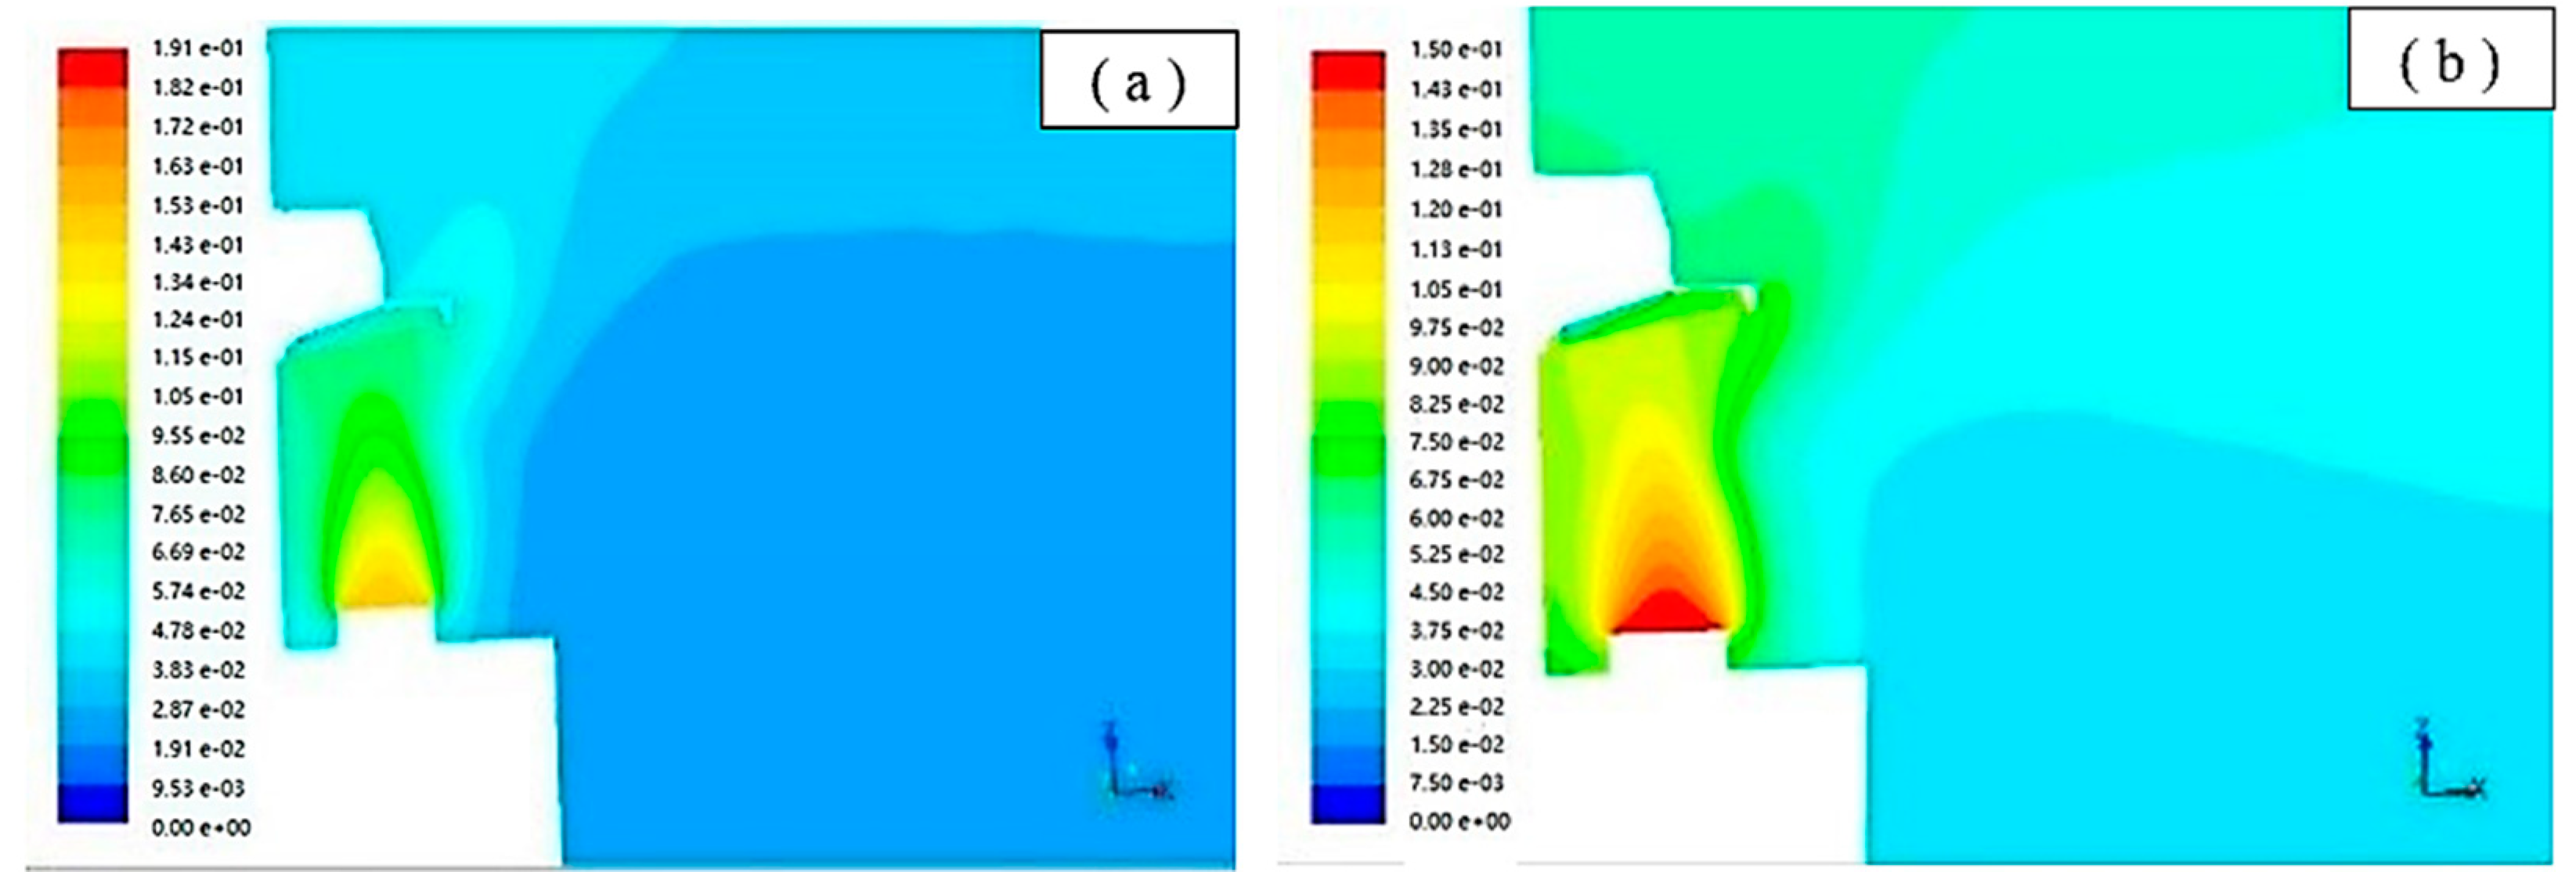
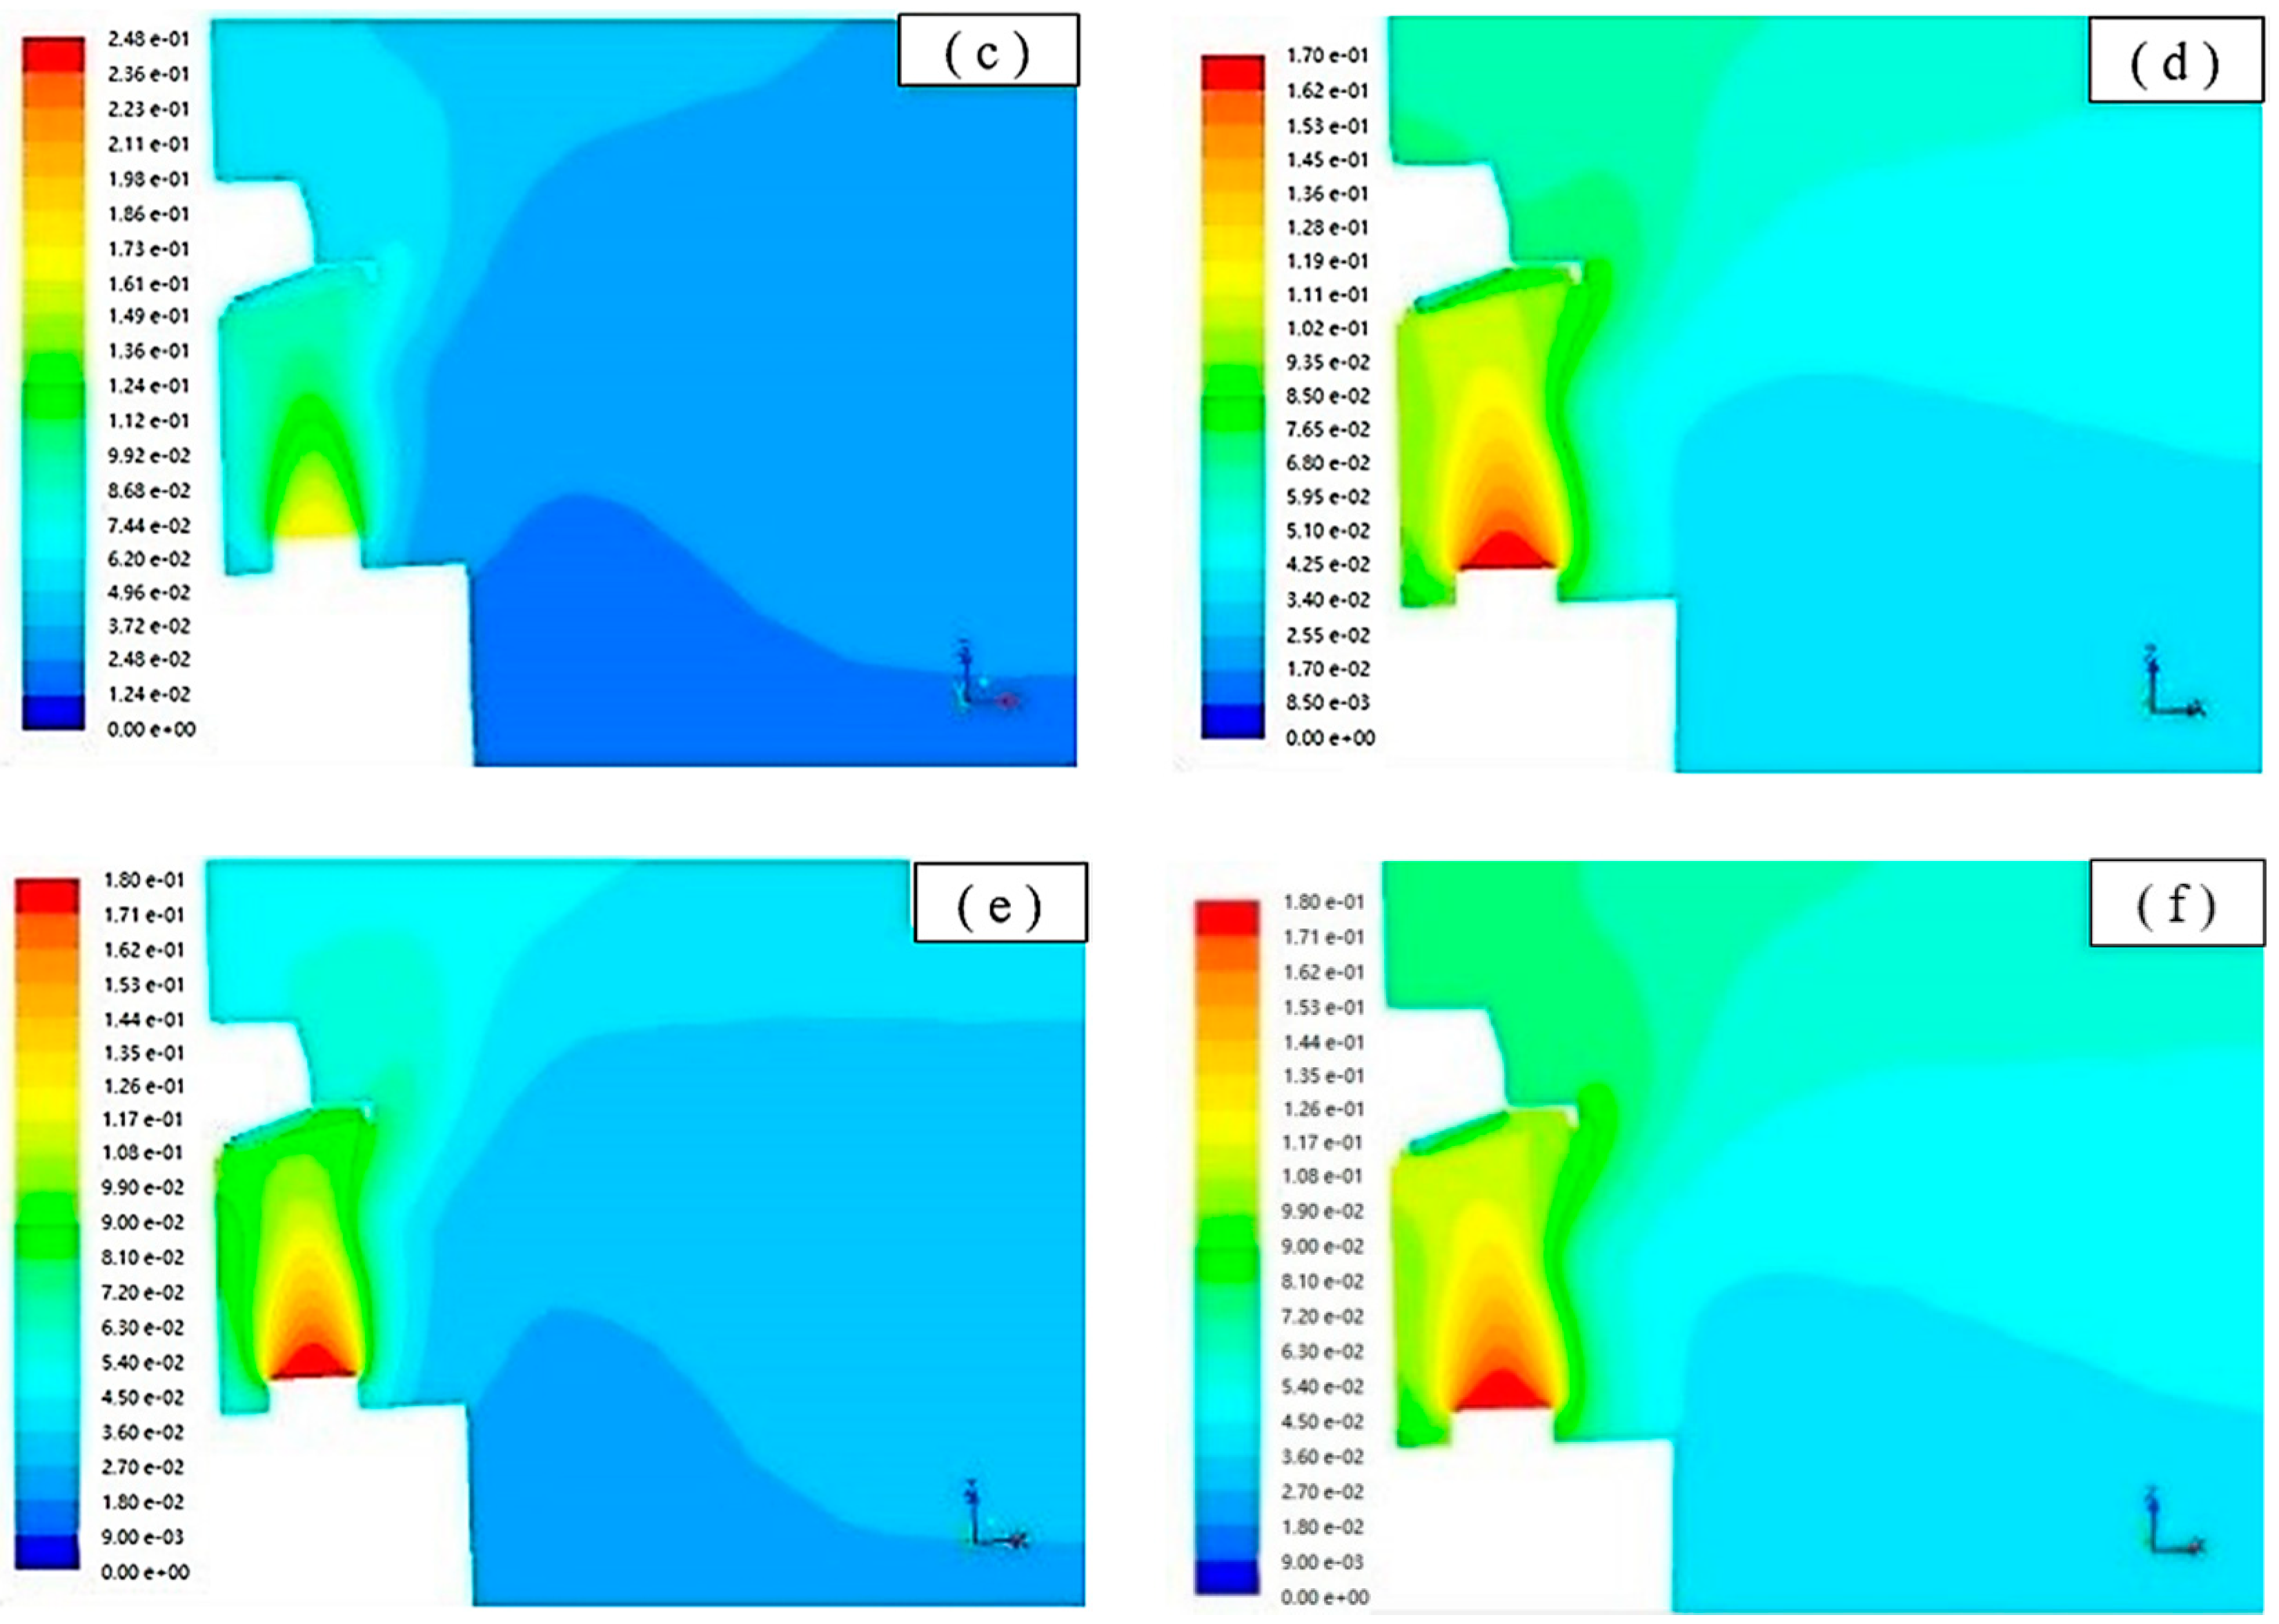
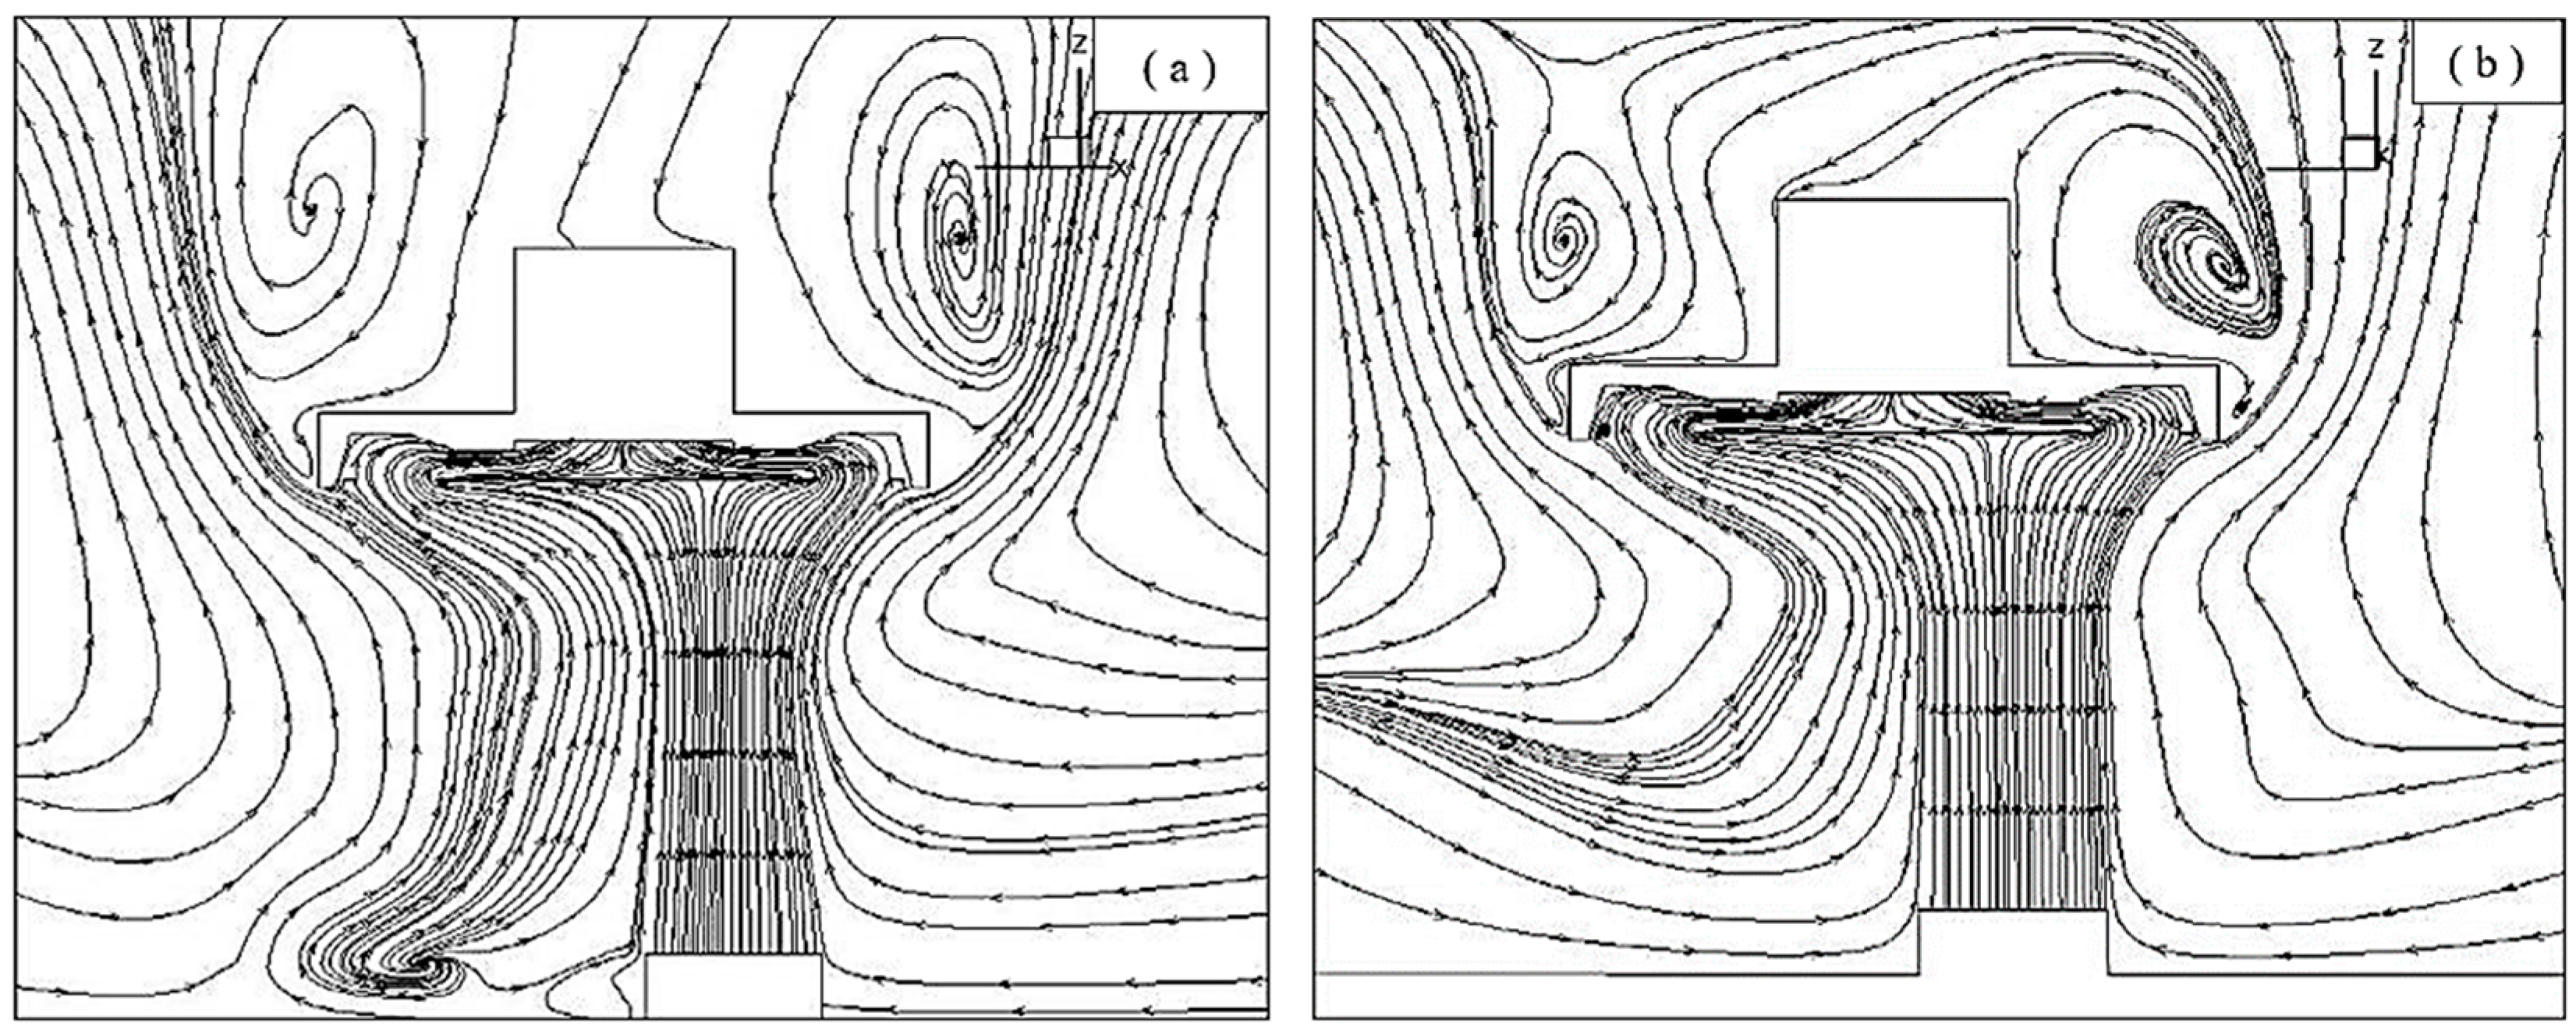
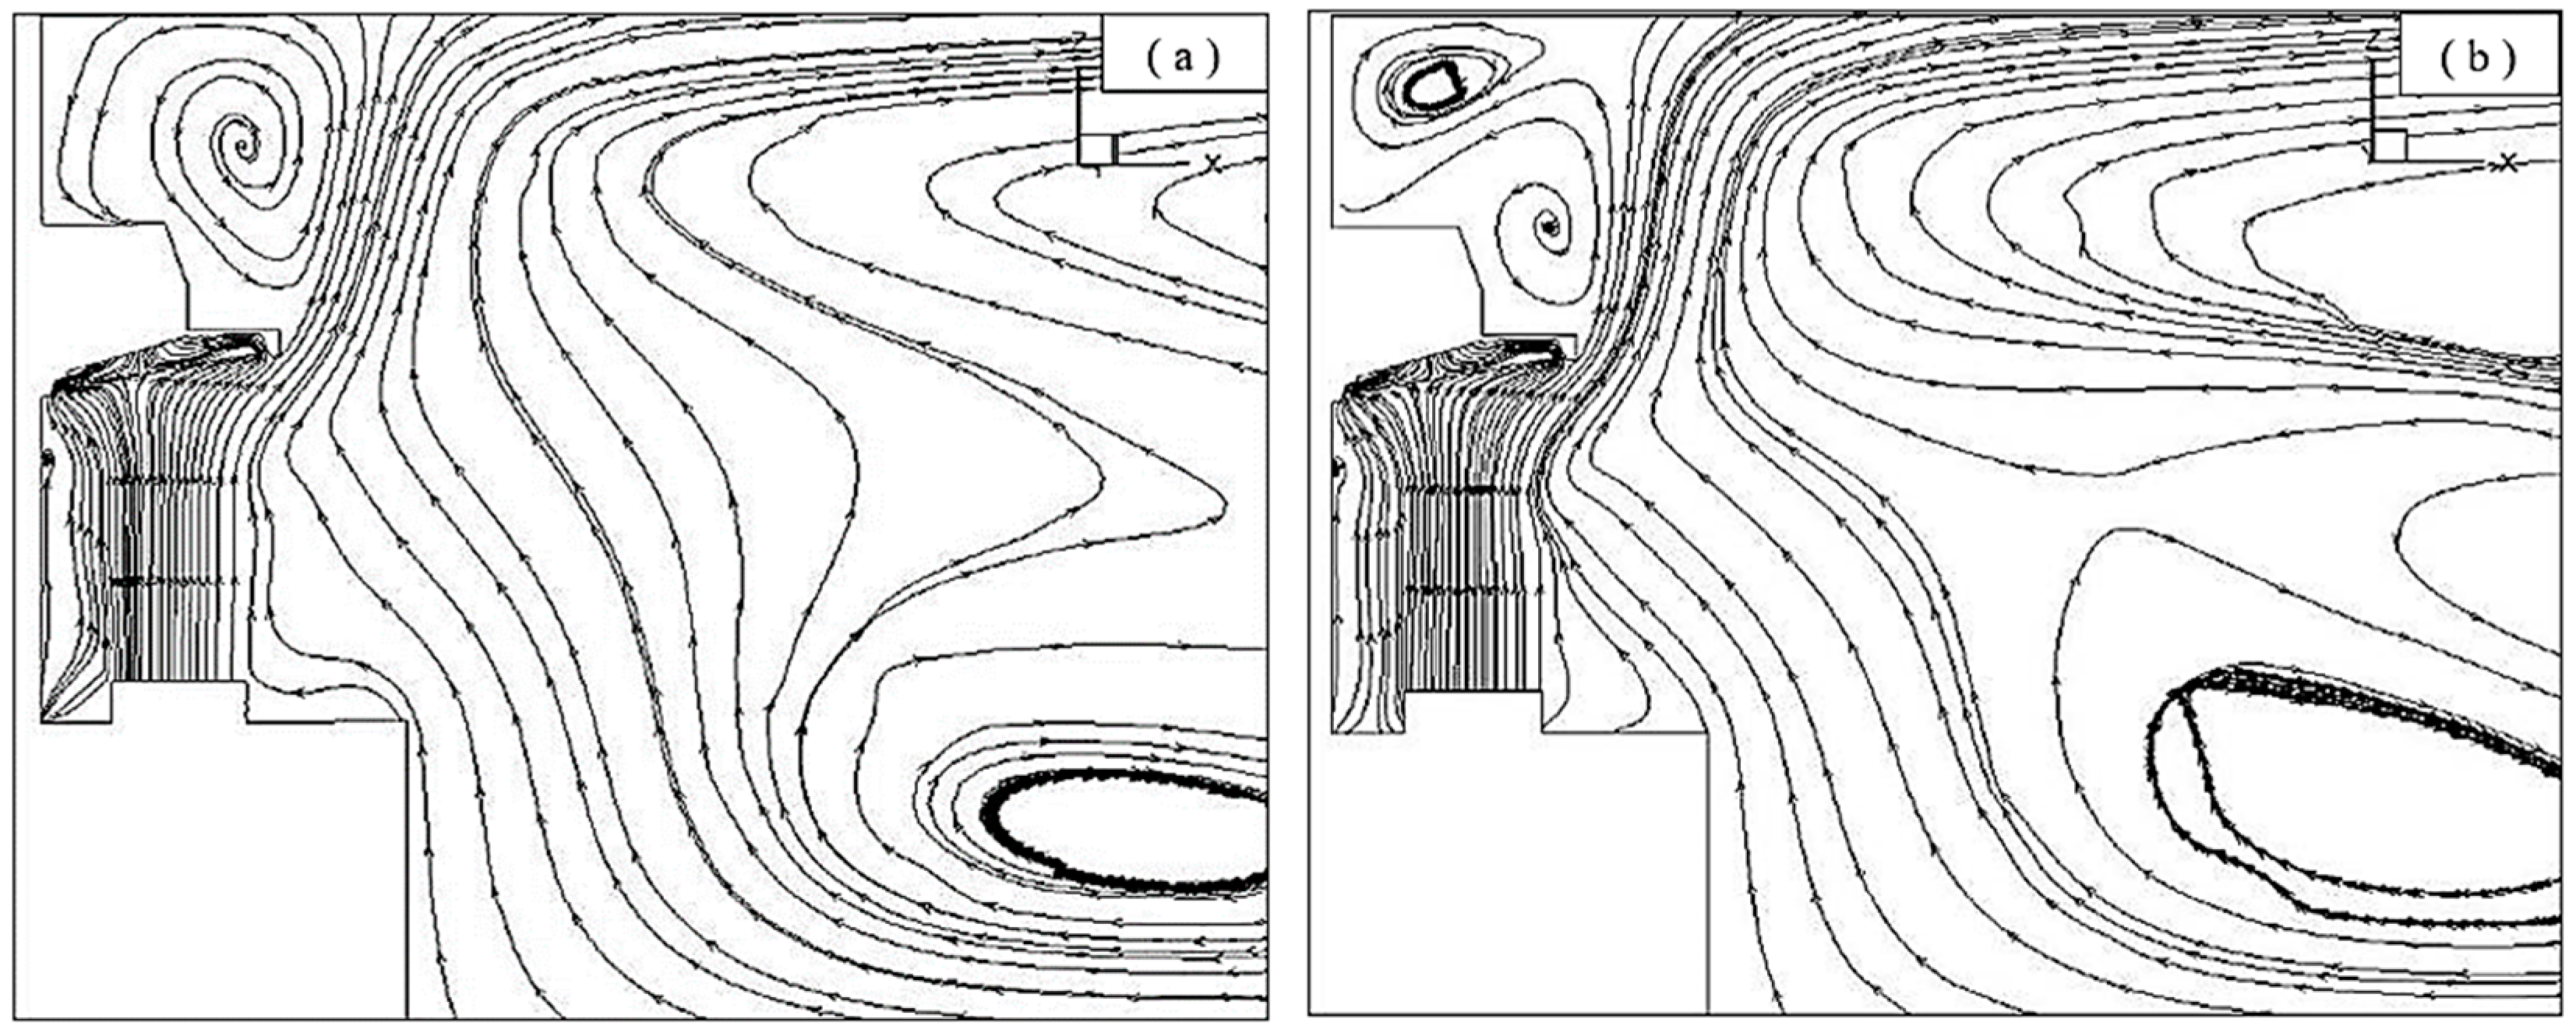
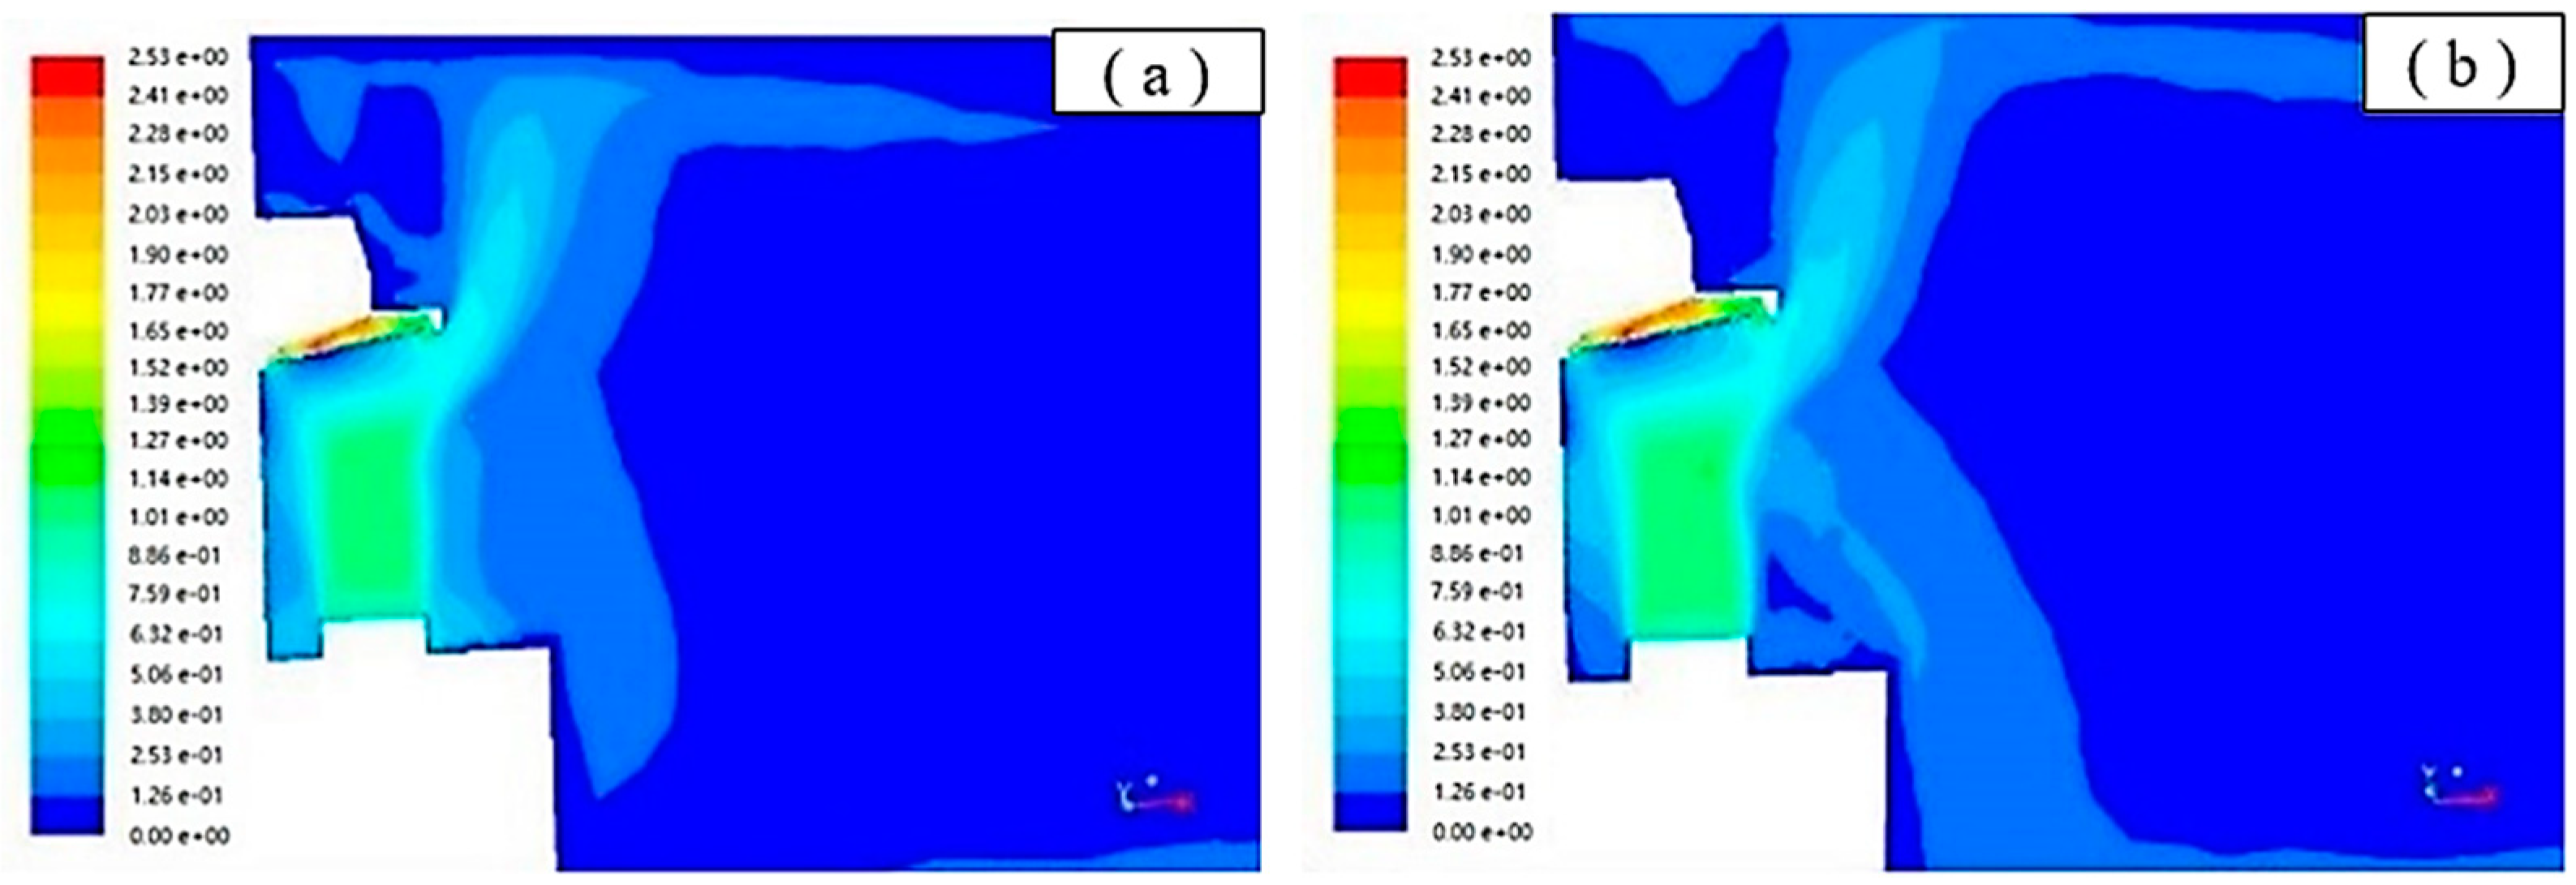
Based on the simulation environment of high-rise residential buildings with centralized flue systems, the simulation model of exterior flow field for cooker hoods was built to analyze the diffusion characteristics of cooking oil fumes. The escape path, temperature distribution, pressure distribution, and the concentration distribution of oil fumes in kitchens were obtained. The simulation results show that the escape path of oil fumes mainly concentrates on the sides of the cookers and the front sides of the cooker hoods, and the maximum concentrations of escaping oil fumes are 0.247   mg / m 3 and 0.265   mg / m 3 , respectively. When the window is closed, the highest temperature in the main escape region above the cooker hood is 315 K. When the window is opened, the temperature is reduced by 5 K, due to the fact that the air flow is usually more conducive to the emission of oil fumes, fumes escape less, and the temperature is lower.
(3)
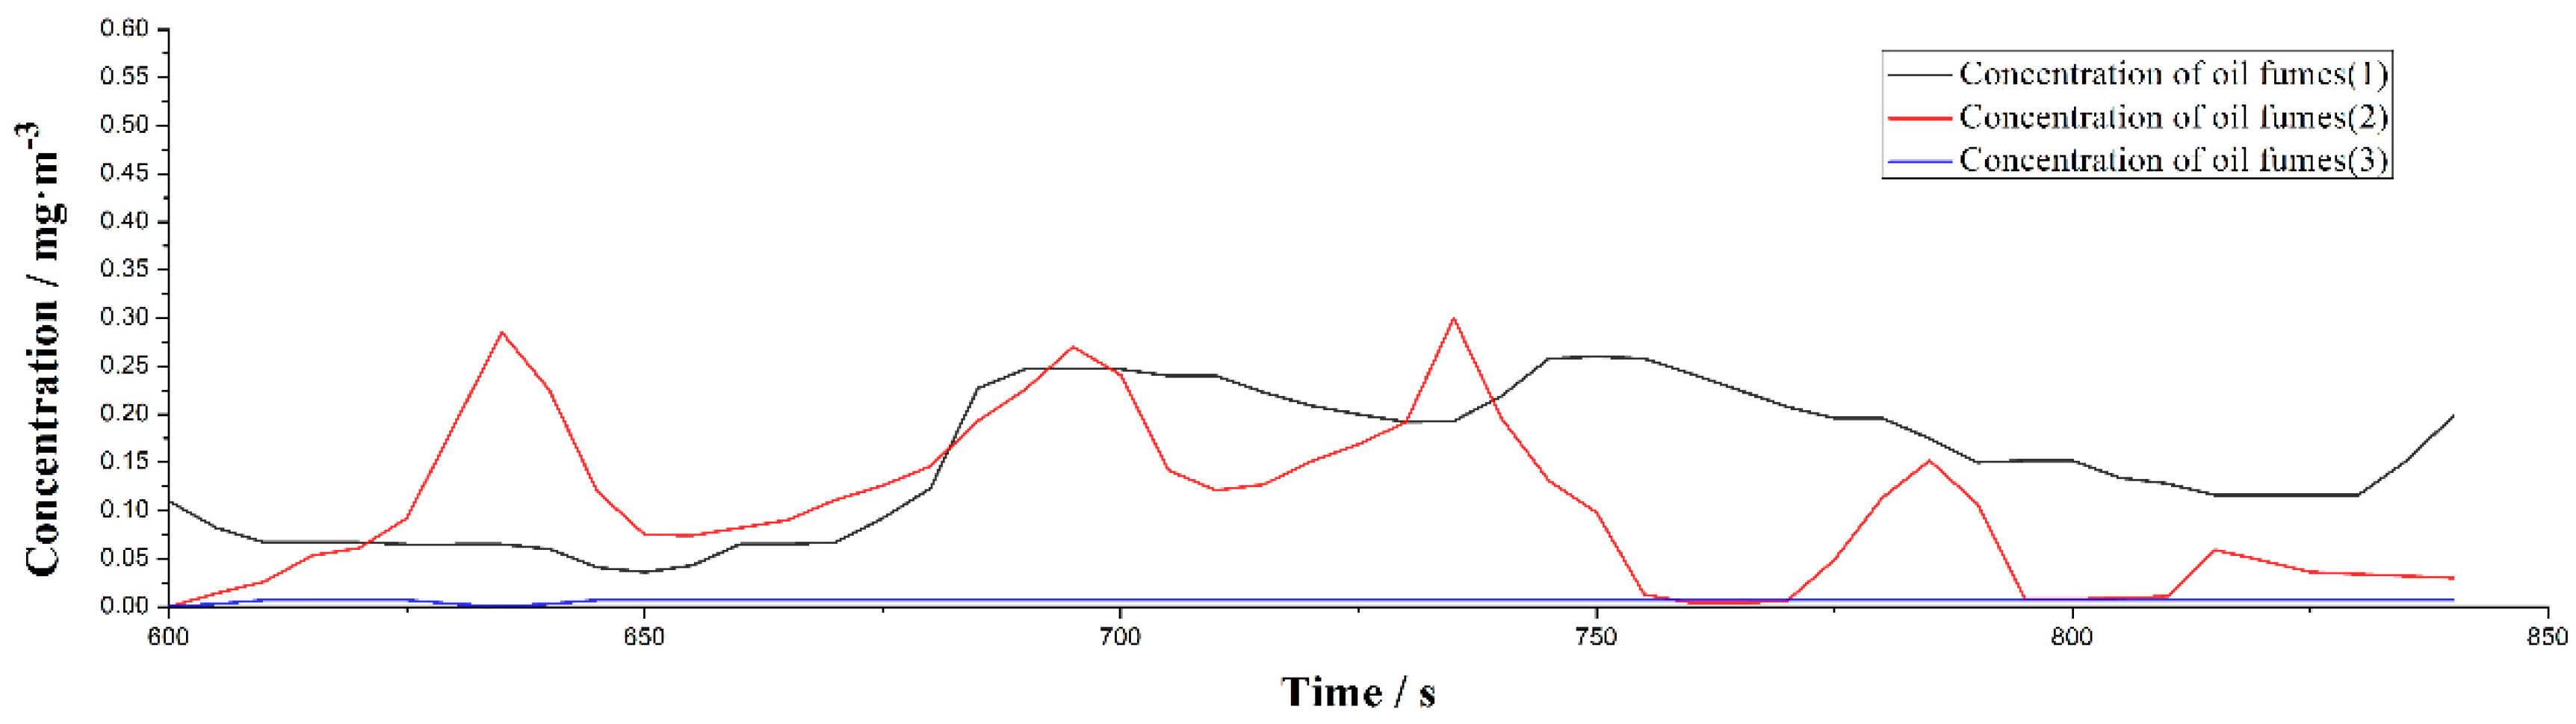
The results calculated by the simulation model of the cooker hood based on the simulation environment of high-rise residential building agree well with the experiment data. Comparing the simulation analysis with the test results from the experimental test results, the peak value of the maximum concentration on the right side is 0.26 mg / m 3 , and the maximum peak value of the front side oil smoke concentration is 0.30 mg / m 3 , so the front side error is only 5% minimum, and on the right side the maximum error is not more than 12%. The simulation model proposed in this paper can better analyze the diffusion characteristics of cooking oil fumes in kitchens of high-rise residential buildings with cooker hoods. This method provides a useful reference for kitchen design, performance improvements of cooker hoods, and the relationships between the living environments and cooker hoods.

Author Contributions

X.-Q.L. conceived and designed the experiments; Y.-X.Y. performed the experiments for test; Y.-D.Z. analyzed the experiment results; Y.-C.Z. came up with the simulation analysis method and wrote the paper; and T.W. performed the simulation analysis.

Acknowledgments

This work was supported by the China Postdoctoral Science Foundation funded project (Program No. 2013M530431) and the Natural science fund of Ningbo City (201401A6103017).

Conflicts of Interest

The authors declare no conflict of interest.

References

  1. Wang, K.X.; Zhu, X.D. The constituents in cooking-oil smoke and their analysis of methods. Shanghai Environ. Sci. 1999, 18, 526–528. [Google Scholar]
  2. Song, R.J.; Wang, G.F.; Wang, B. Chemical composition analysis and identification of cooking oil smoke. Chin. J. Public Health Eng. 1996, 5, 7–11. [Google Scholar]
  3. De Gennaro, G.; Dambruoso, P.R.; Di Gilio, A.; Di Palma, V.; Marzocca, A.; Tutino, M. Discontinuous and continuous indoor air quality monitoring in homes with fireplaces or wood stoves as heating system. Int. J. Environ. Res. Public Health 2015, 13, 78. [Google Scholar] [CrossRef] [PubMed]
  4. Zhu, L.Z.; Wang, J.; Jiang, B.H. Prelimilary exploration of features and sources of PAHs pollution in air of kitchen. China Environ. Sci. 2002, 22, 142–145. [Google Scholar]
  5. Rbeumer, R.; Kusumaningru, H. Kitchen hygiene in daily life. Int. Biodeterior. Biodegrad. 2003, 51, 299–302. [Google Scholar] [CrossRef]
  6. Shun, C.L.; Wai, M.L.; Lo, Y.C. Indoor air quality at restaurants with different styles of cooking in metropolitan Hong Kong. Sci. Total Environ. 2001, 279, 181–193. [Google Scholar]
  7. Wang, X.X. Research on Design Method of the Central Exhaust System for Residential Kitchen in High-Rise Buildings; Tongji University: Shanghai, China, 2006. [Google Scholar]
  8. Li, M.F.; Peng, X.Y.; Yao, L. Effect of different working modes of range hood on environmental characteristics of kitchen. Power Gener. Air Cond. 2010, 31, 55–58. [Google Scholar]
  9. Feng, M.; Wang, Y.R.; Wang, Y.C.; Wang, P.C.; Tang, A.L. Experimental study on branch set up check valve of centralized exhaust system in high-rise residential buildings. China House Facil. 2010, 4, 60–63. [Google Scholar]
  10. Liu, N. Ordinary high-rise residential kitchen computer simulation in central exhaust system. Refrigeration Air Cond. 2009, 5, 119–126. [Google Scholar]
  11. Zhu, P.G.; Zhu, M.L.; Cai, H. Numerical simulation and test on smoke of residential kitchen. J. PLA Univ. Sci. Technol. 2006, 7, 153–156. [Google Scholar]
  12. Yu, M.C.; Zhang, D.C. Numerical simulation of fume concentration in indoor kitchens. J. Xiangtan Norm. Univ. 2008, 30, 72–75. [Google Scholar]
  13. Li, S.D.; Xu, J.B.; Mo, S.P.; Li, W.H.; Gao, J.J.; Cao, Y.Q.; Chen, Y.F. Particle size distribution and diffusion for simulated cooking fume. Environ. Sci. 2017, 38, 32–40. [Google Scholar]
  14. Yao, X.; Chen, M.; Fan, Z.Y.; Chen, M.X.; Shi, J.W.; Shang guan, W.F.; Cao, Y.Q.; Zhang, X.D. Pollution from cooking emission and progress in its control technology. Chem. Ind. Eng. 2015, 32, 53–58. [Google Scholar]
  15. Chen, F.; Zhou, B.; Liu, J.X.; Xue, K.; Xu, Y.; Tang, X.Y. Auxiliary effect of slot air curtain on pollution control performance of kitchen range hood. China Environ. Sci. 2016, 36, 709–718. [Google Scholar]
  16. Fu, W.J.; Li, J.; Wang, H.J. Optimization design of kitchen hood system based on simulation analysis. Comput. Simul. 2013, 30, 229–233. [Google Scholar]
  17. Shi, M.X.; Wang, H.Q.; Wang, Z.Y.; Chen, Y. Experimental research on new design for wind-curta in lampblack presser. J. Hunan Univ. Technol. 2008, 22, 20–23. [Google Scholar]
  18. Zhang, J.Y. Studies on the Characteristic of Smoke Movement and Smoke Control in Shaft of High-Rise Buildings; University of Science and Technology of China: Hefei, China, 2006. [Google Scholar]
  19. Zhang, D.Y.; Zhao, F.F.; Li, Y.; Li, P.Y.; Zeng, Q.F.; Dong, G.N. Study on tribological properties of multi-layer surface texture on Babbitt alloys surface. Appl. Surf. Sci. 2016, 390, 540–549. [Google Scholar] [CrossRef]
Figure 1. Schematic of centralized flue system with cooker hoods in high-rise residential building.
Applsci 08 00777 g001
Figure 2. Simulation system of centralized flue system in high-rise residential building.
Applsci 08 00777 g002
Figure 3. Simulation laboratory of high-rise residential building.
Applsci 08 00777 g003
Figure 4. Relationship between the air volume of fan and installation floors of cooker hood.
Applsci 08 00777 g004
Figure 5. Relationship between the back pressure of fan and installation floors of cooker hood.
Applsci 08 00777 g005
Figure 6. The geometry model of exterior flow field of cooker hood.
Applsci 08 00777 g006
Figure 7. Finite element model of exterior flow field of cooker hood. (a) An analysis grid model of the flow field of cooker hood; (b) The local grid effect of cooker hood.
Applsci 08 00777 g007aApplsci 08 00777 g007b
Figure 8. Extraction position of the exterior flow field analysis result of cooker hood.
Applsci 08 00777 g008
Figure 9. Exterior flow field pressure analysis results of cooker hood (transverse section) under the window conditions of: (a) open and (b) close.
Applsci 08 00777 g009
Figure 10. Exterior flow field pressure analysis results of cooker hood (longitudinal section) under the window conditions of: (a) open and (b) close.
Applsci 08 00777 g010
Figure 11. Exterior flow field temperature distribution of cooker hood (transverse section). under the window conditions of: (a) open and (b) close.
Applsci 08 00777 g011
Figure 12. Exterior flow field temperature distribution of cooker hood (longitudinal section) under the window conditions of: (a) open and (b) close.
Applsci 08 00777 g012
Figure 13. The concentration field of oil fumes (transverse section) as the window conditions of: (a) open and (b) close when acetaldehyde, (c) open and (d) close when acetic acid and (e) open and (f) close water when vapor.
Applsci 08 00777 g013
Figure 14. The concentration field of oil fumes (longitudinal section) as the window conditions of: (a) open and (b) close when acetaldehyde, (c) open and (d) close when acetic acid and (e) open and (f) close water when vapor.
Applsci 08 00777 g014aApplsci 08 00777 g014b
Figure 15. Streamline distributions of oil fumes (transverse section) under the window conditions of: (a) open and (b) close.
Applsci 08 00777 g015
Figure 16. Streamline distributions of oil fumes (longitudinal section) under the window conditions of: (a) open and (b) close.
Applsci 08 00777 g016
Figure 17. Flow velocity of oil fumes (transverse section) under the window conditions of: (a) open and (b) close.
Applsci 08 00777 g017
Figure 18. Flow velocity of oil fumes (longitudinal section) under the window conditions of: (a) open and (b) close.
Applsci 08 00777 g018
Figure 19. Test environment for oil fumes concentration.
Applsci 08 00777 g019
Figure 20. Test result of oil fumes concentration.
Applsci 08 00777 g020
Table 1. The maximum concentration of escaping fumes.
Components Window StateAcetaldehydeAcetic AcidWater VaporMixed Gas
OpenCloseOpenCloseOpenCloseOpenClose
Right0.0470.0680.0700.0900.0620.0890.1790.247
Front0.0640.0750.0750.0940.0810.0960.2200.265

