1. Introduction
Cracking alongside the wheel path is one of the common distress types seen on asphalt pavements, especially on heavy-duty ones. Different from the traditional bottom-up fatigue cracking, this type of longitudinal cracking, observed within two to six years after opening to traffic [
1,
2,
3,
4], initiates at the top part of asphalt layer and then propagates downward, and is often called top-down cracking (TDC). There are two different views on TDC mechanisms. Some researchers believe that TDC is caused by the tensile stress/strain initiated at the surface of the pavement. For example, Molenaar [
5] used Australian CIRCLY(a computer program for mechanistic pavement design and analysis) elastic analysis program to analyze the effects of the lateral and vertical contact stresses within the pavement and stresses of the tyre on the pavement within the asphalt layers, and concluded that the surface tensile stress at the tyre edge was the cause for top-down cracking. Similar findings were later published by Hugo [
4] and Gerritsen [
6], respectively. By using a finite element (FE) program CAPA(FE program developed at Delft University of Technology in the Netherlands), Groenendijk [
7] analyzed the pavement structure under the measured non-uniform tyre–pavement contact load with the South African Vehicle-Road Pressure Transducer Array (VRSPTA). He found that higher tensile stress at the surface of the layer is associated with non-uniform tyre–pavement contact pressure and aging of the asphalt mixture, which ultimately led to TDC. Mayer [
8] suggested that longitudinal TDC cracks were caused by principal tension stress due to radial ply tyres. Kim and Roque et al. [
9] later developed the models for TDC initiation and propagation based on the “tension cracking mechanism assumption”.
The second view on TDC is that it is caused by shear stress/strain. By using the FE method to analyze the pavement stress/strain distributions under tyre loads, Bensalem [
10] found that traffic-induced shear strain on the vertical plane at tyre edge was much larger than the lateral tensile strain at same position. Wang [
11] computed the stress distributions using the discrete element method (DEM) and bimodal mechanics. The results indicated that the crack was initiated at a depth of 25 mm, and obvious plastic deformation was observed below the cracking zone. He believed that the crack was caused by the shear stress. Based on the calculated octahedral shear strain for three pavement structures, Pellinen et al. [
12,
13] found that the maximum shear strain location is at the inner side of tyre edge, which indicated that the top-down crack was more likely to occur in the summer time. In recent years, Kim and Roque have shifted their research focuses from the “tension cracking mechanism assumption” to the “shear cracking mechanism assumption” and proposed that TDC was shear-induced or shear-dominant cracking.
This paper, based on the latest findings from TDC-oriented accelerated pavement testing (APT) and laboratory uniaxial repeated penetration tests, develops and validates new TDC initiation and propagation mechanisms. Details are presented in the following sections.
2. Field and Laboratory TDC Tests
In order to investigate the TDC mechanisms, both field accelerated pavement testing with MMLS3 (Model Mobile Load Simulator) and laboratory uniaxial repeated loading penetration tests were conducted. The MMLS3 is a mobile loading system developed in South Africa with a maximum load of 2.9 kN, maximum tyre pressure of 850 kPa, maximum loading rate of 7200 pass/h, and tyre that was 80 mm wide inflated to 700 kPa. Since traffic wander was not considered in the test, the wheel track area was 80 mm wide. The test pavement structures for the field APT are listed in
Table 1.
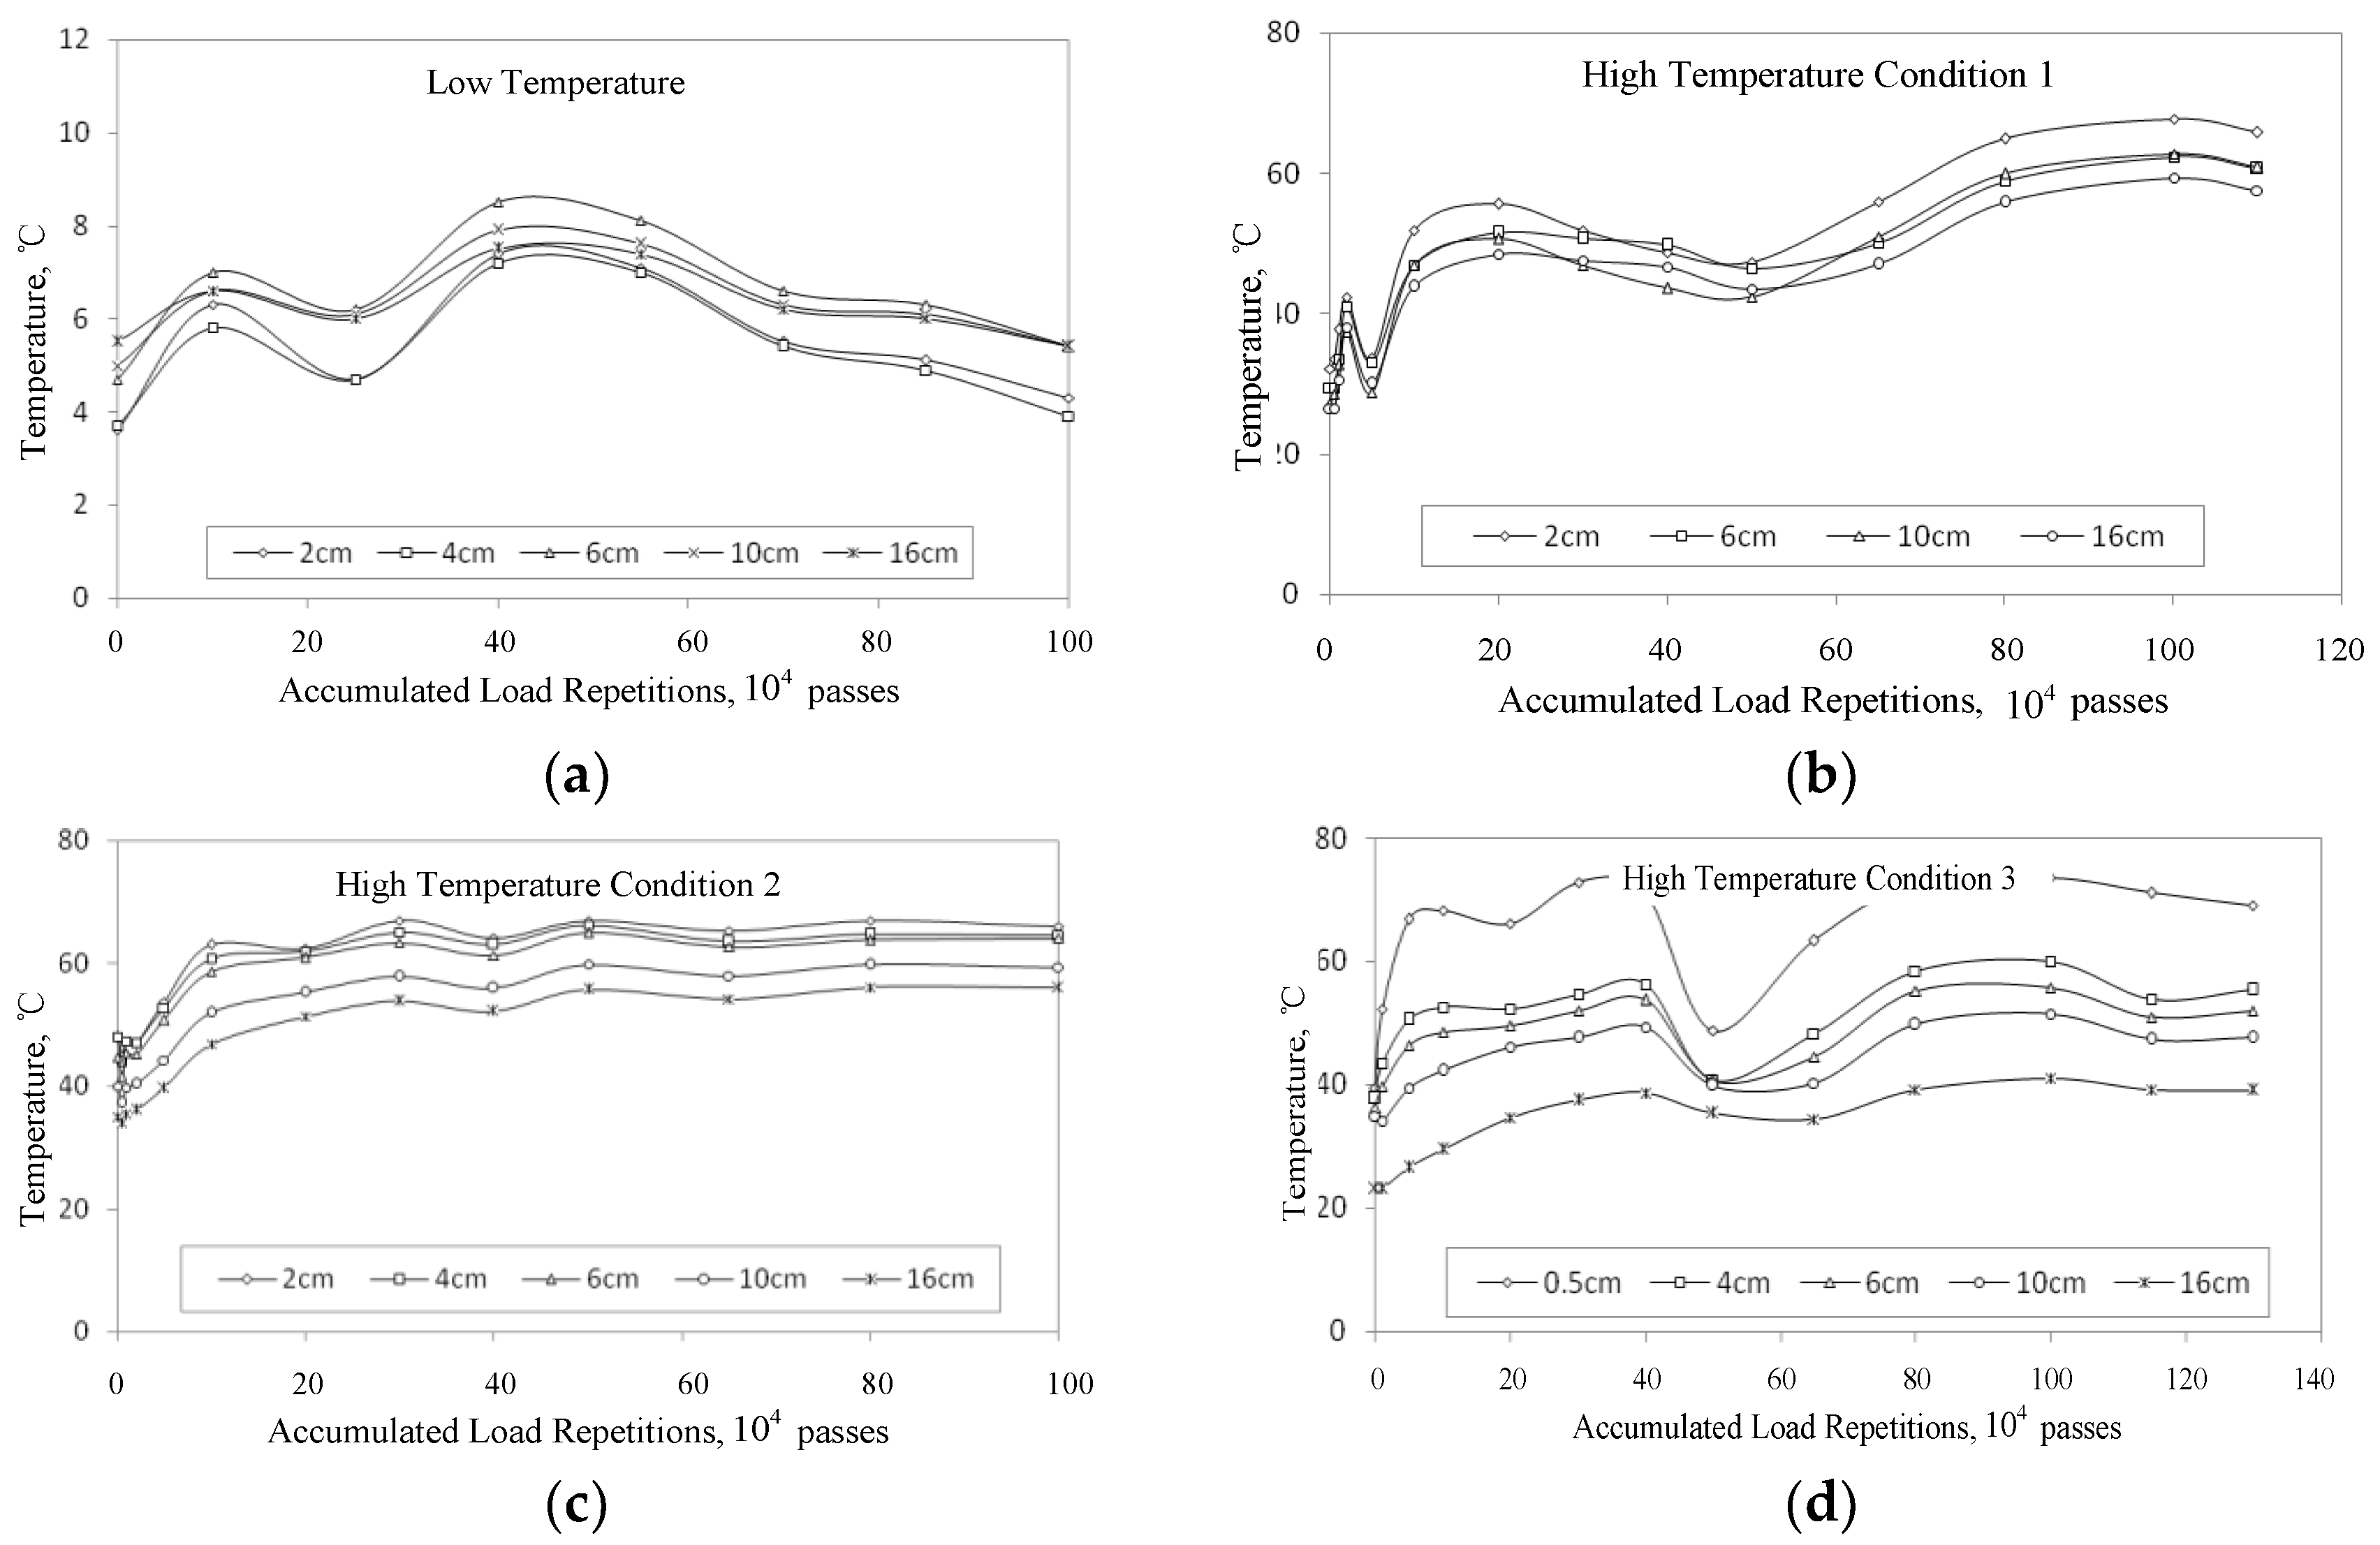
For pavement structure 1, the APT loading was applied under four different temperature conditions: low (
Figure 1a), normal (
Figure 1b), and two high temperature conditions (
Figure 1c). However, pavement structure 2 was tested under the high temperature condition (
Figure 1d) only. The number of load repetitions for each test was 1 million. The temperatures at different pavement depth, deformation and cracks on pavement surface were measured during testing. The air temperatures at normal conditions are listed in
Table 2.
Pavement deformation from transverse profiles was automatically measured with a laser profilometer (MLS Profilometer Drive-P2003). The data obtained from the profilometer was accurate to within 0.01 mm. For pavement structure 1, the measured pavement deformation was 2.4 mm after one million load repetitions at normal temperature conditions (
Table 2). Neither upheave nor visual crack were observed near the outside of the wheel path. Similar observations were made at the low temperature conditions: there was not any significant deformation nor any cracks after applying one million repetitions of MMLS3 loading. In the case of high temperature conditions (
Figure 1b), significant deformation occurred alongside the wheel path, and clearly, longitudinal cracking was found within 2 cm outside of the wheel path.
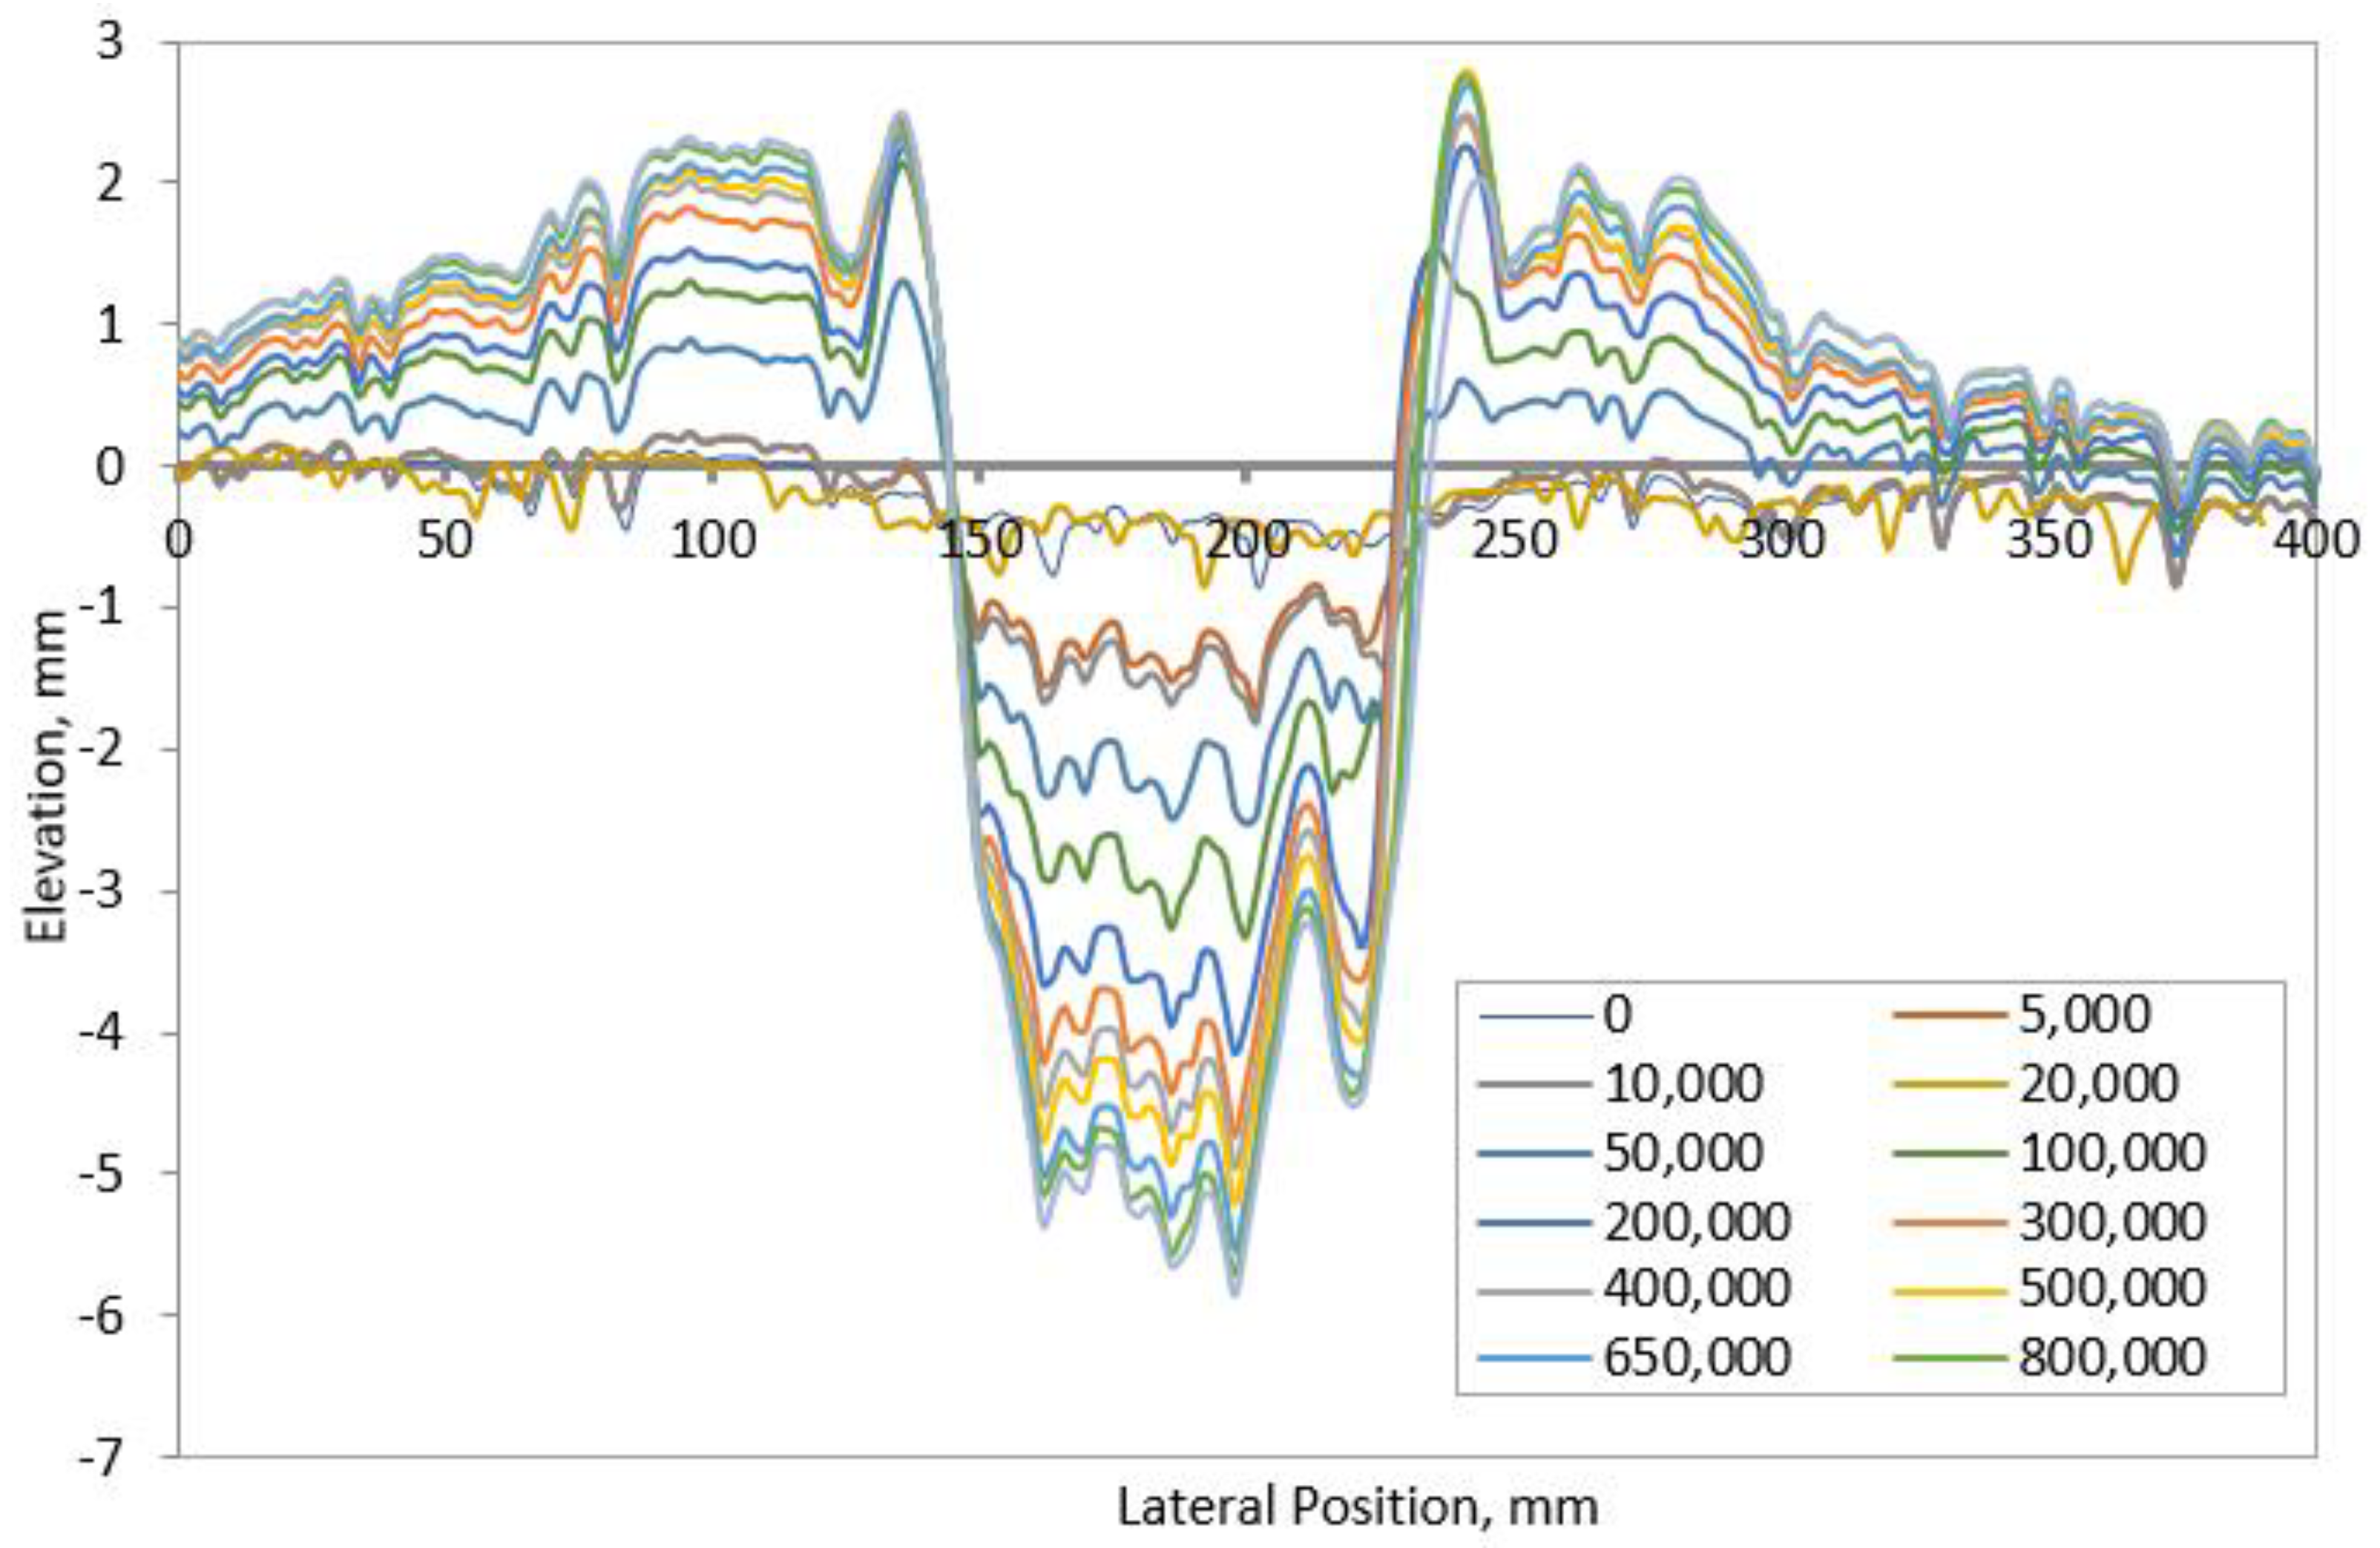
Figure 2 shows the measured rutting profiles at the high temperature conditions (
Figure 1c) under different loading repetitions, varying from 0 to 1 million. In
Figure 2, there is a “rutting zone” in either side of upheave which is circled in red. It was found that the deepest position in the either red circle is around 20 mm away from the tyre edge, where the longitudinal cracking is located. To further verify this observation, another test was conducted at high temperature conditions (
Figure 1c) at 10 m away from the test site where longitudinal cracking was observed. Again, longitudinal cracks were found within 20 mm from the wheel path.
Similarly, APT testing was performed on pavement structure 2 at the temperature conditions shown in
Figure 1d. Similar deformations (
Figure 2) and obvious longitudinal cracking were observed within 20 mm of the wheel path. It can be concluded from the APT test results that longitudinal cracking occurs more often at higher temperature conditions.
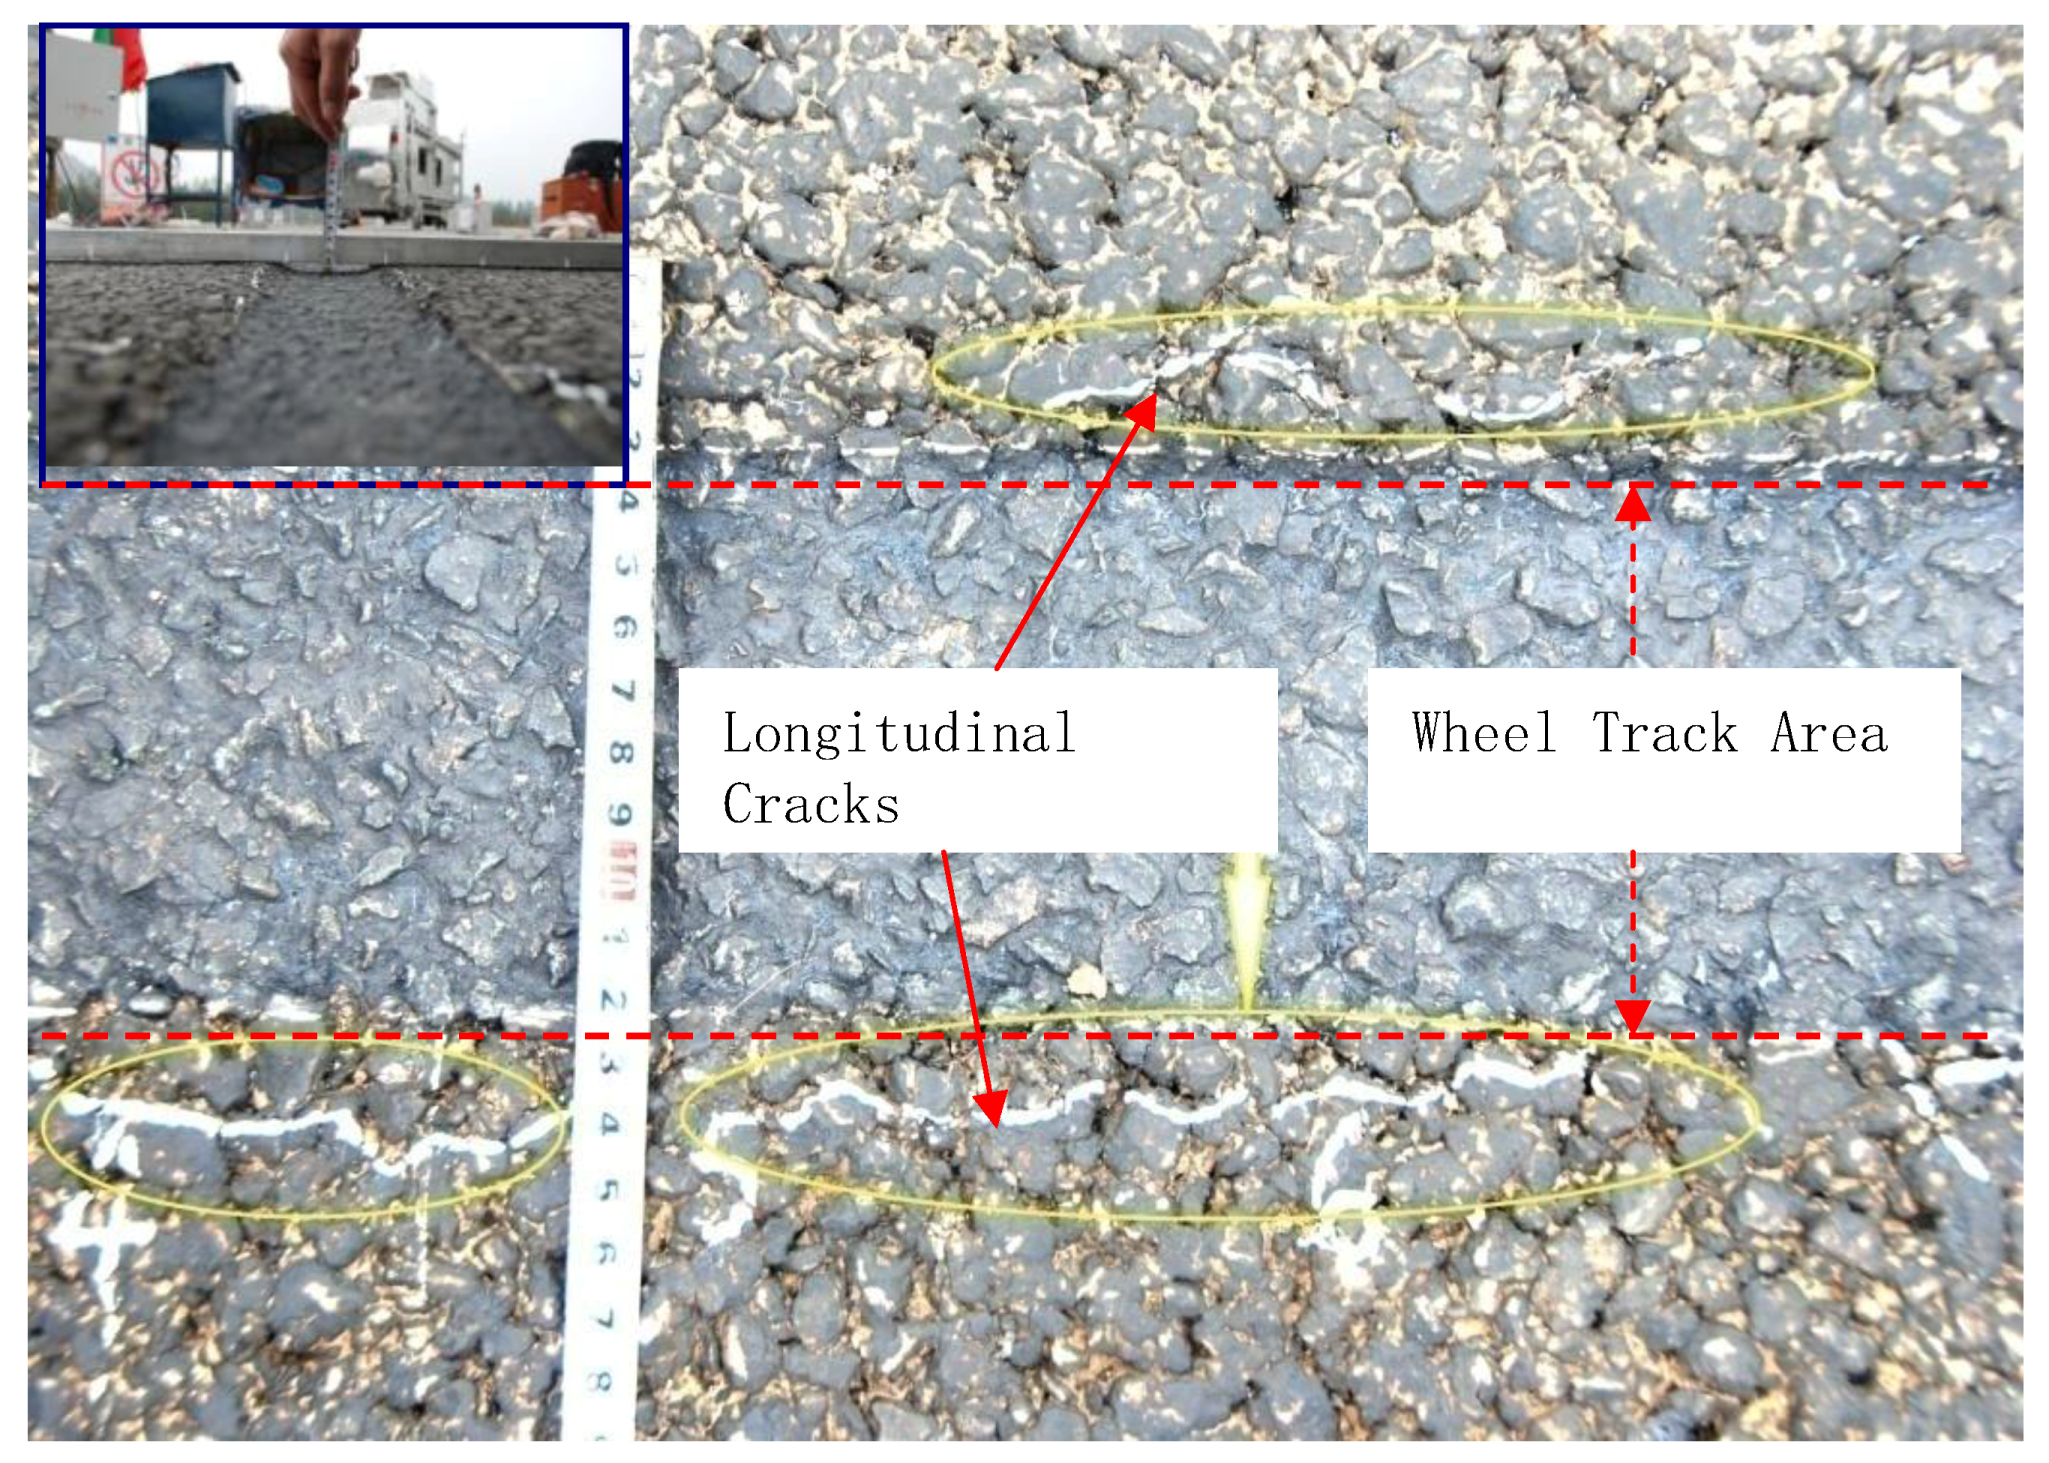
Figure 3 shows the observed longitudinal cracking located within 20 mm from the tyre edge with a width of 3 mm. To identify whether or not the longitudinal cracking is TDC, cores were taken and cut in half. It was obvious that the longitudinal cracking observed outside the wheel path was TDC, and that TDC propagated downwards 9 mm from the pavement surface. This observation matches the FE analysis results, which indicates that the maximum shear stresses for pavement structures 1 and 2 at high temperature conditions are located at 10–12 mm below the pavement surface.
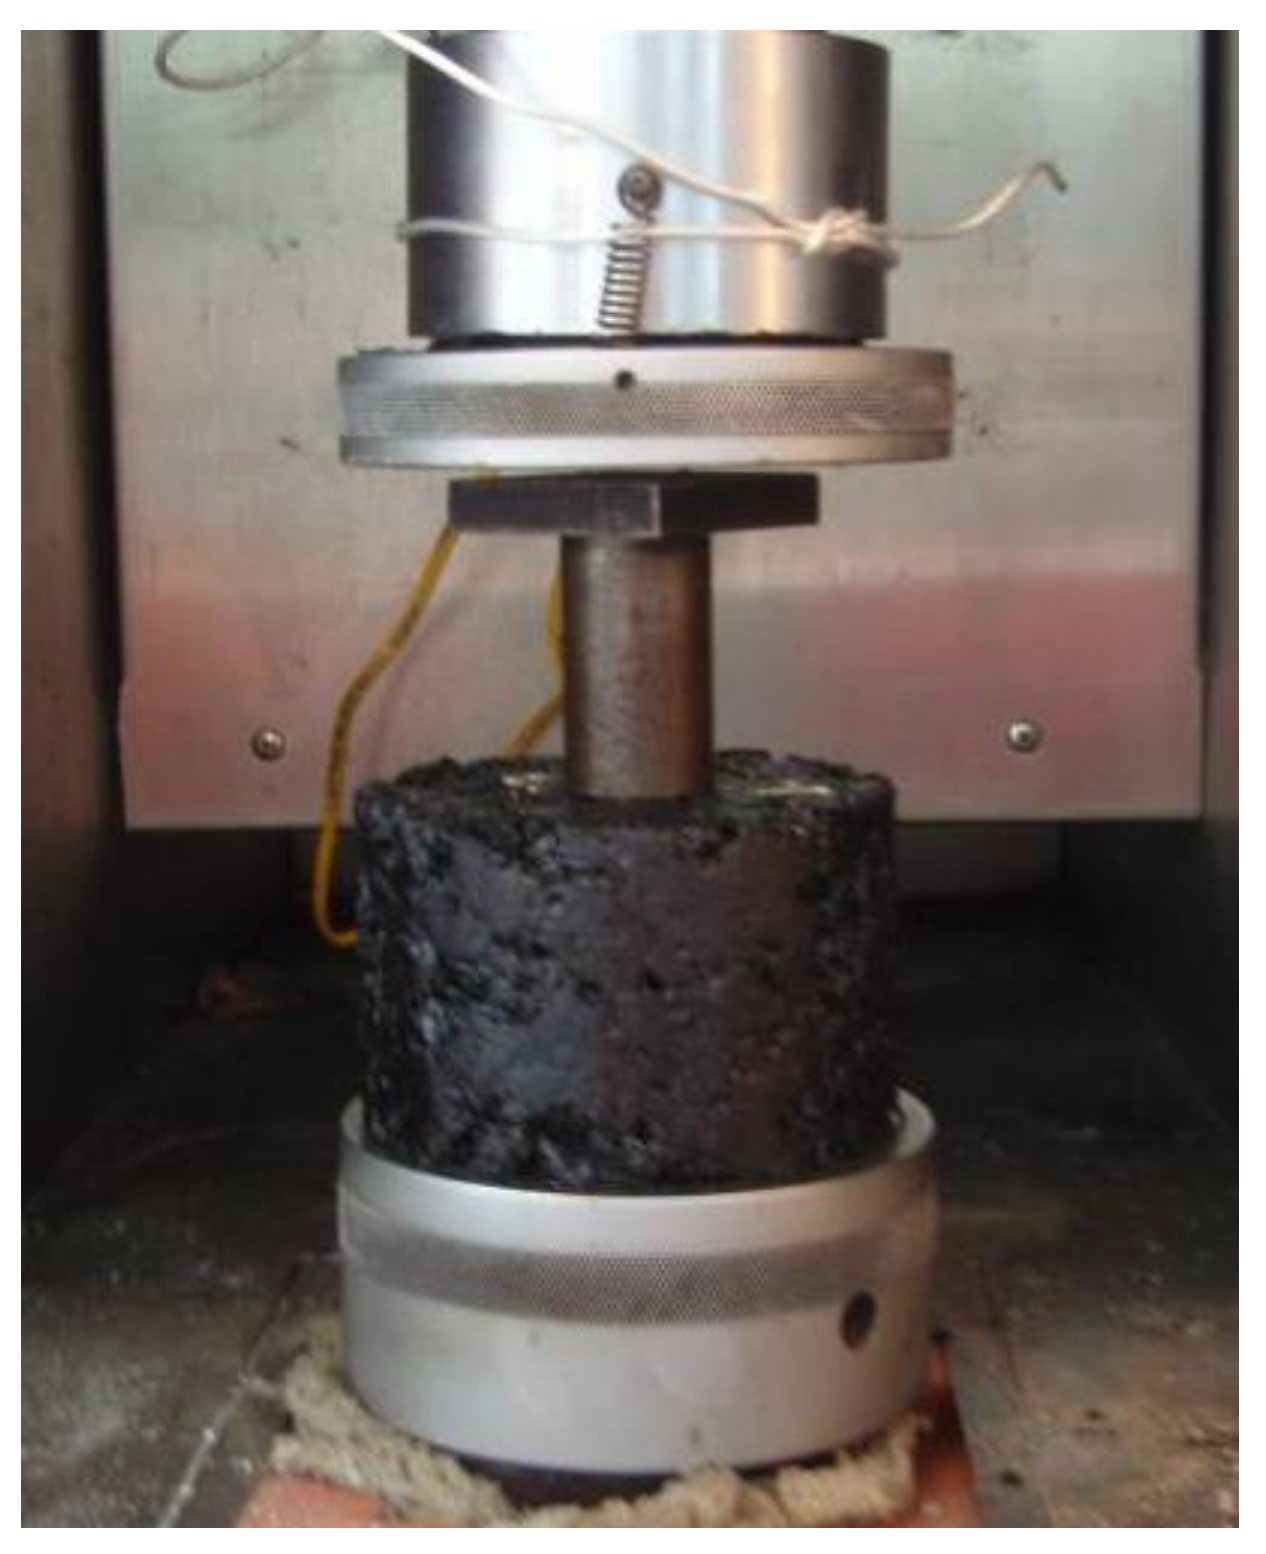
In addition to field APT testing, a simple laboratory test—uniaxial repeated penetration test [
14]—was developed in Tongji University, as shown in
Figure 4, that simulates TDC initiation and propagation. In
Figure 4, the specimen diameter is 150 mm, the plunger diameter is 42 mm, test temperature is 60 °C, the loading rate is 1 mm/min, and the loading frequency is 10 Hz.
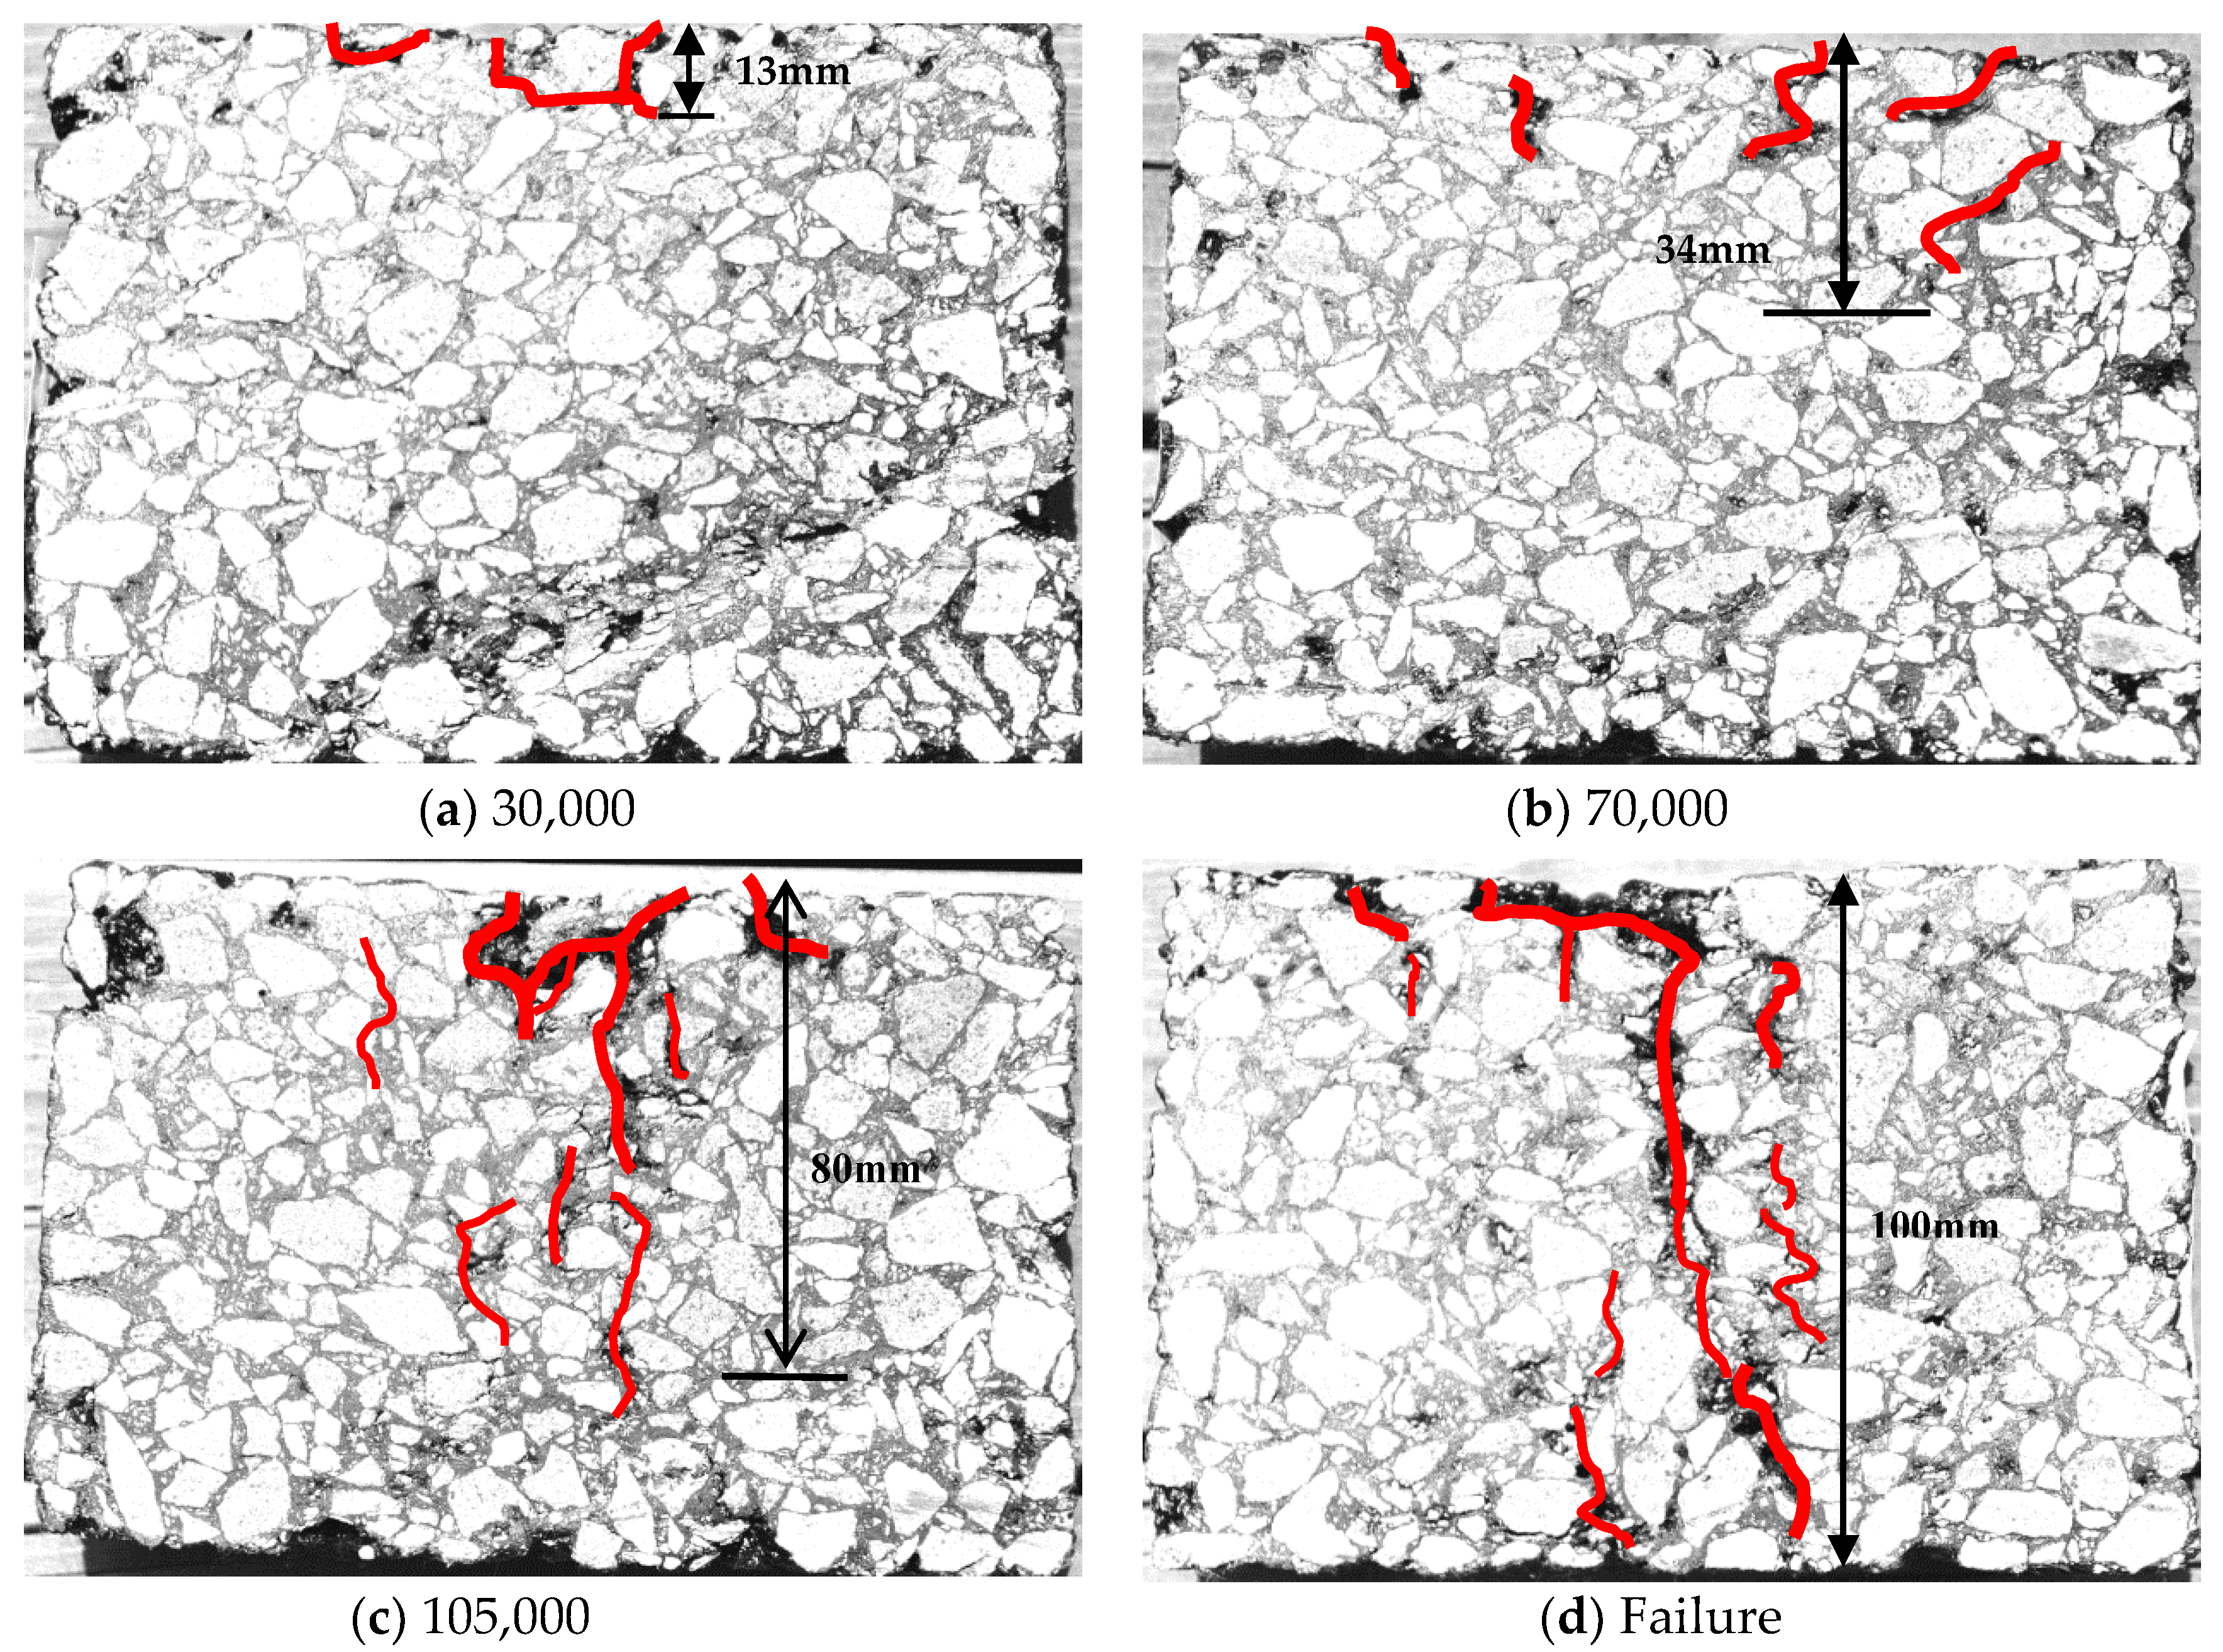
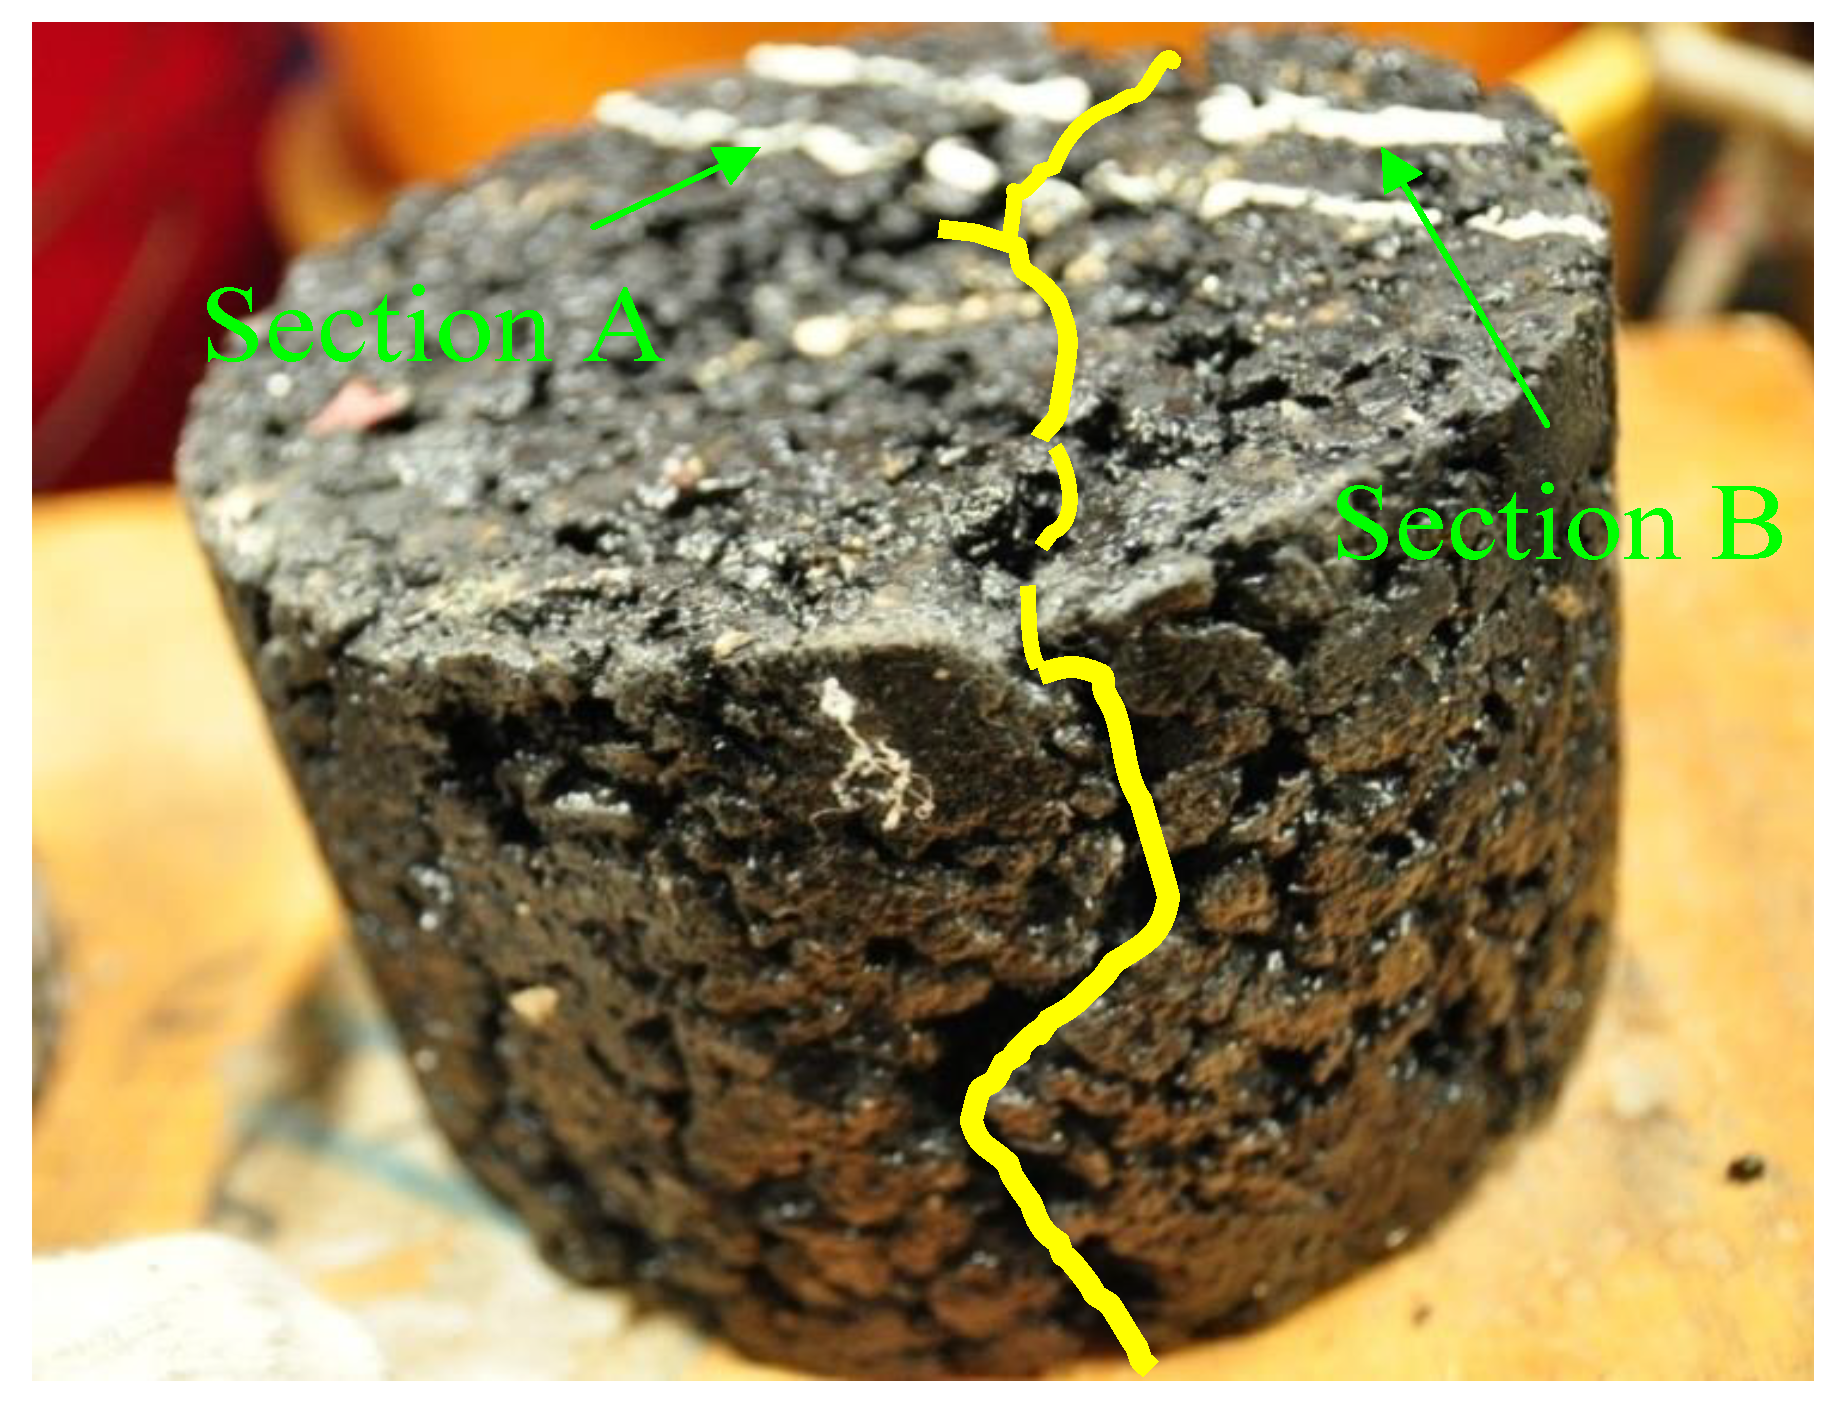
Figure 5 shows a cracked specimen after the uniaxial repeated penetration test. There is downward deformation beneath the plunger in the specimen, and obvious cracks were observed at the edge of the plunger.
Then, the cracked specimen was sliced two times with a diamond saw at Sections A and B, as shown in
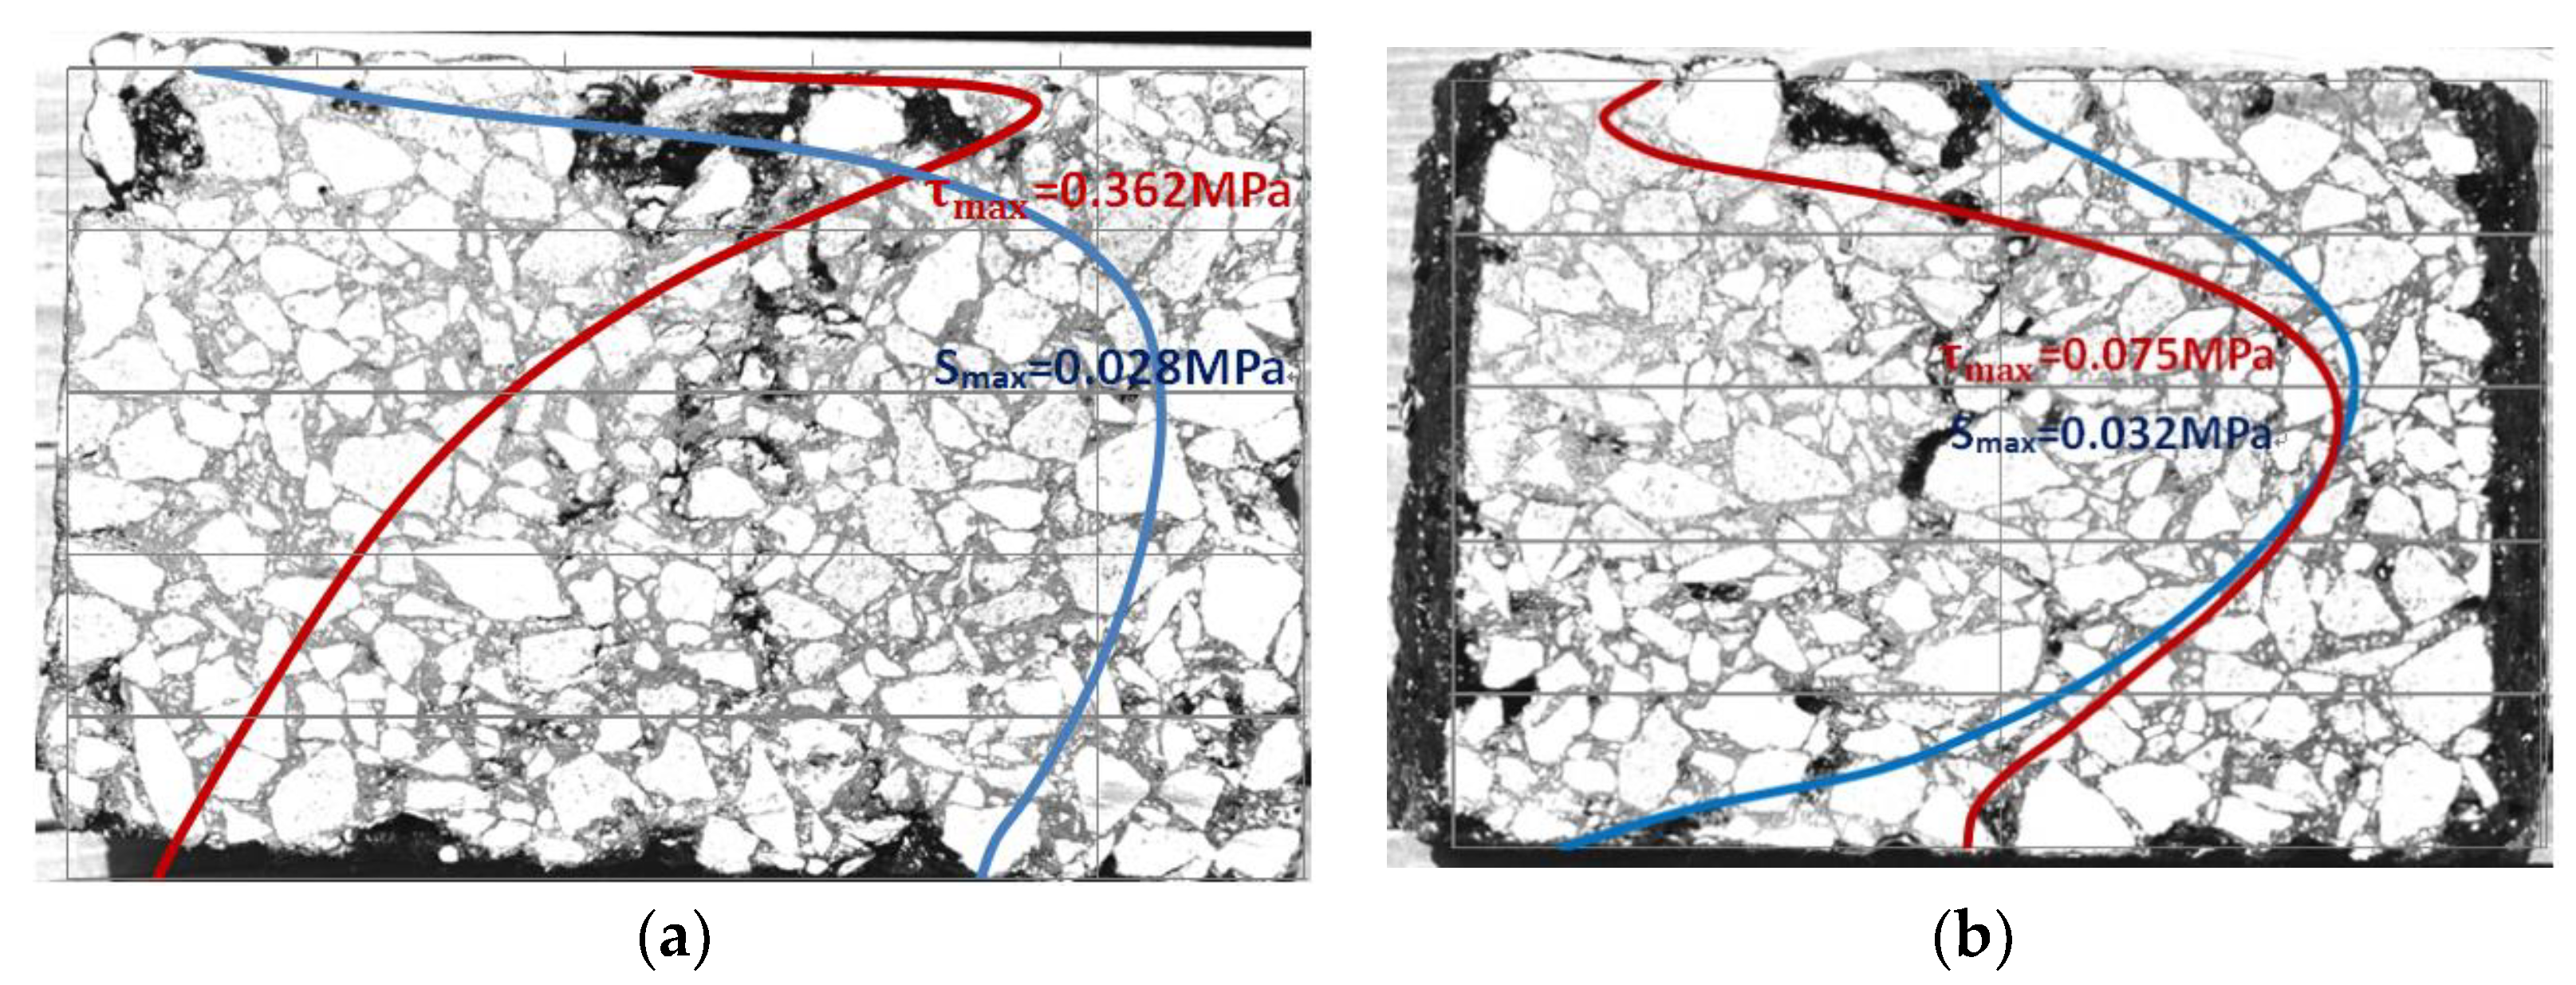
Figure 5. Cross-Section A was sliced perpendicular to the crack alongside the edge of the plunger; Cross-Section B was sliced around 20 mm away from Section A. The cross-sections of Sections A and B are shown in
Figure 6. It can be seen that TDC of Cross-Section A was much more severe than that of Cross-Section B. Therefore, it can be excluded that TDC initiates from outside the specimen (Cross-Section B) and moves inside (Cross-Section A). Compared to the field TDC observed on cores taken from the APT site, the cracks observed in Cross-section A were very similar to the longitudinal cracking seen alongside the wheel path in terms of both the characteristic and the formation of cracks via top to downward propagation.
Additionally,
Figure 6 also shows the variations of shear stress (red line) and tangent tension stress (blue line) on the section along its depth. The most severe cracking area occurred at the top part of the specimen (6 mm down from the top surface of specimen)—where the largest shear stress was located—as shown in
Figure 6. Meanwhile, tangent stress is compressive stress, rather than tensile stress in this area, and the greatest tangent stress is 40 mm from the top surface, located far away from the severe TDC area. Therefore, it can be concluded that the crack on Cross-Section A was due t shear stress at the edge of the plunger, and initiated at the maximum shear stress area. The uniaxial repeated penetration test result is consistent with the field APT test. Thus, the uniaxial repeated penetration test is a valid test for simulating TDC in the laboratory.
4. Proposed New Mechanisms for TDC Initiation and Propagation
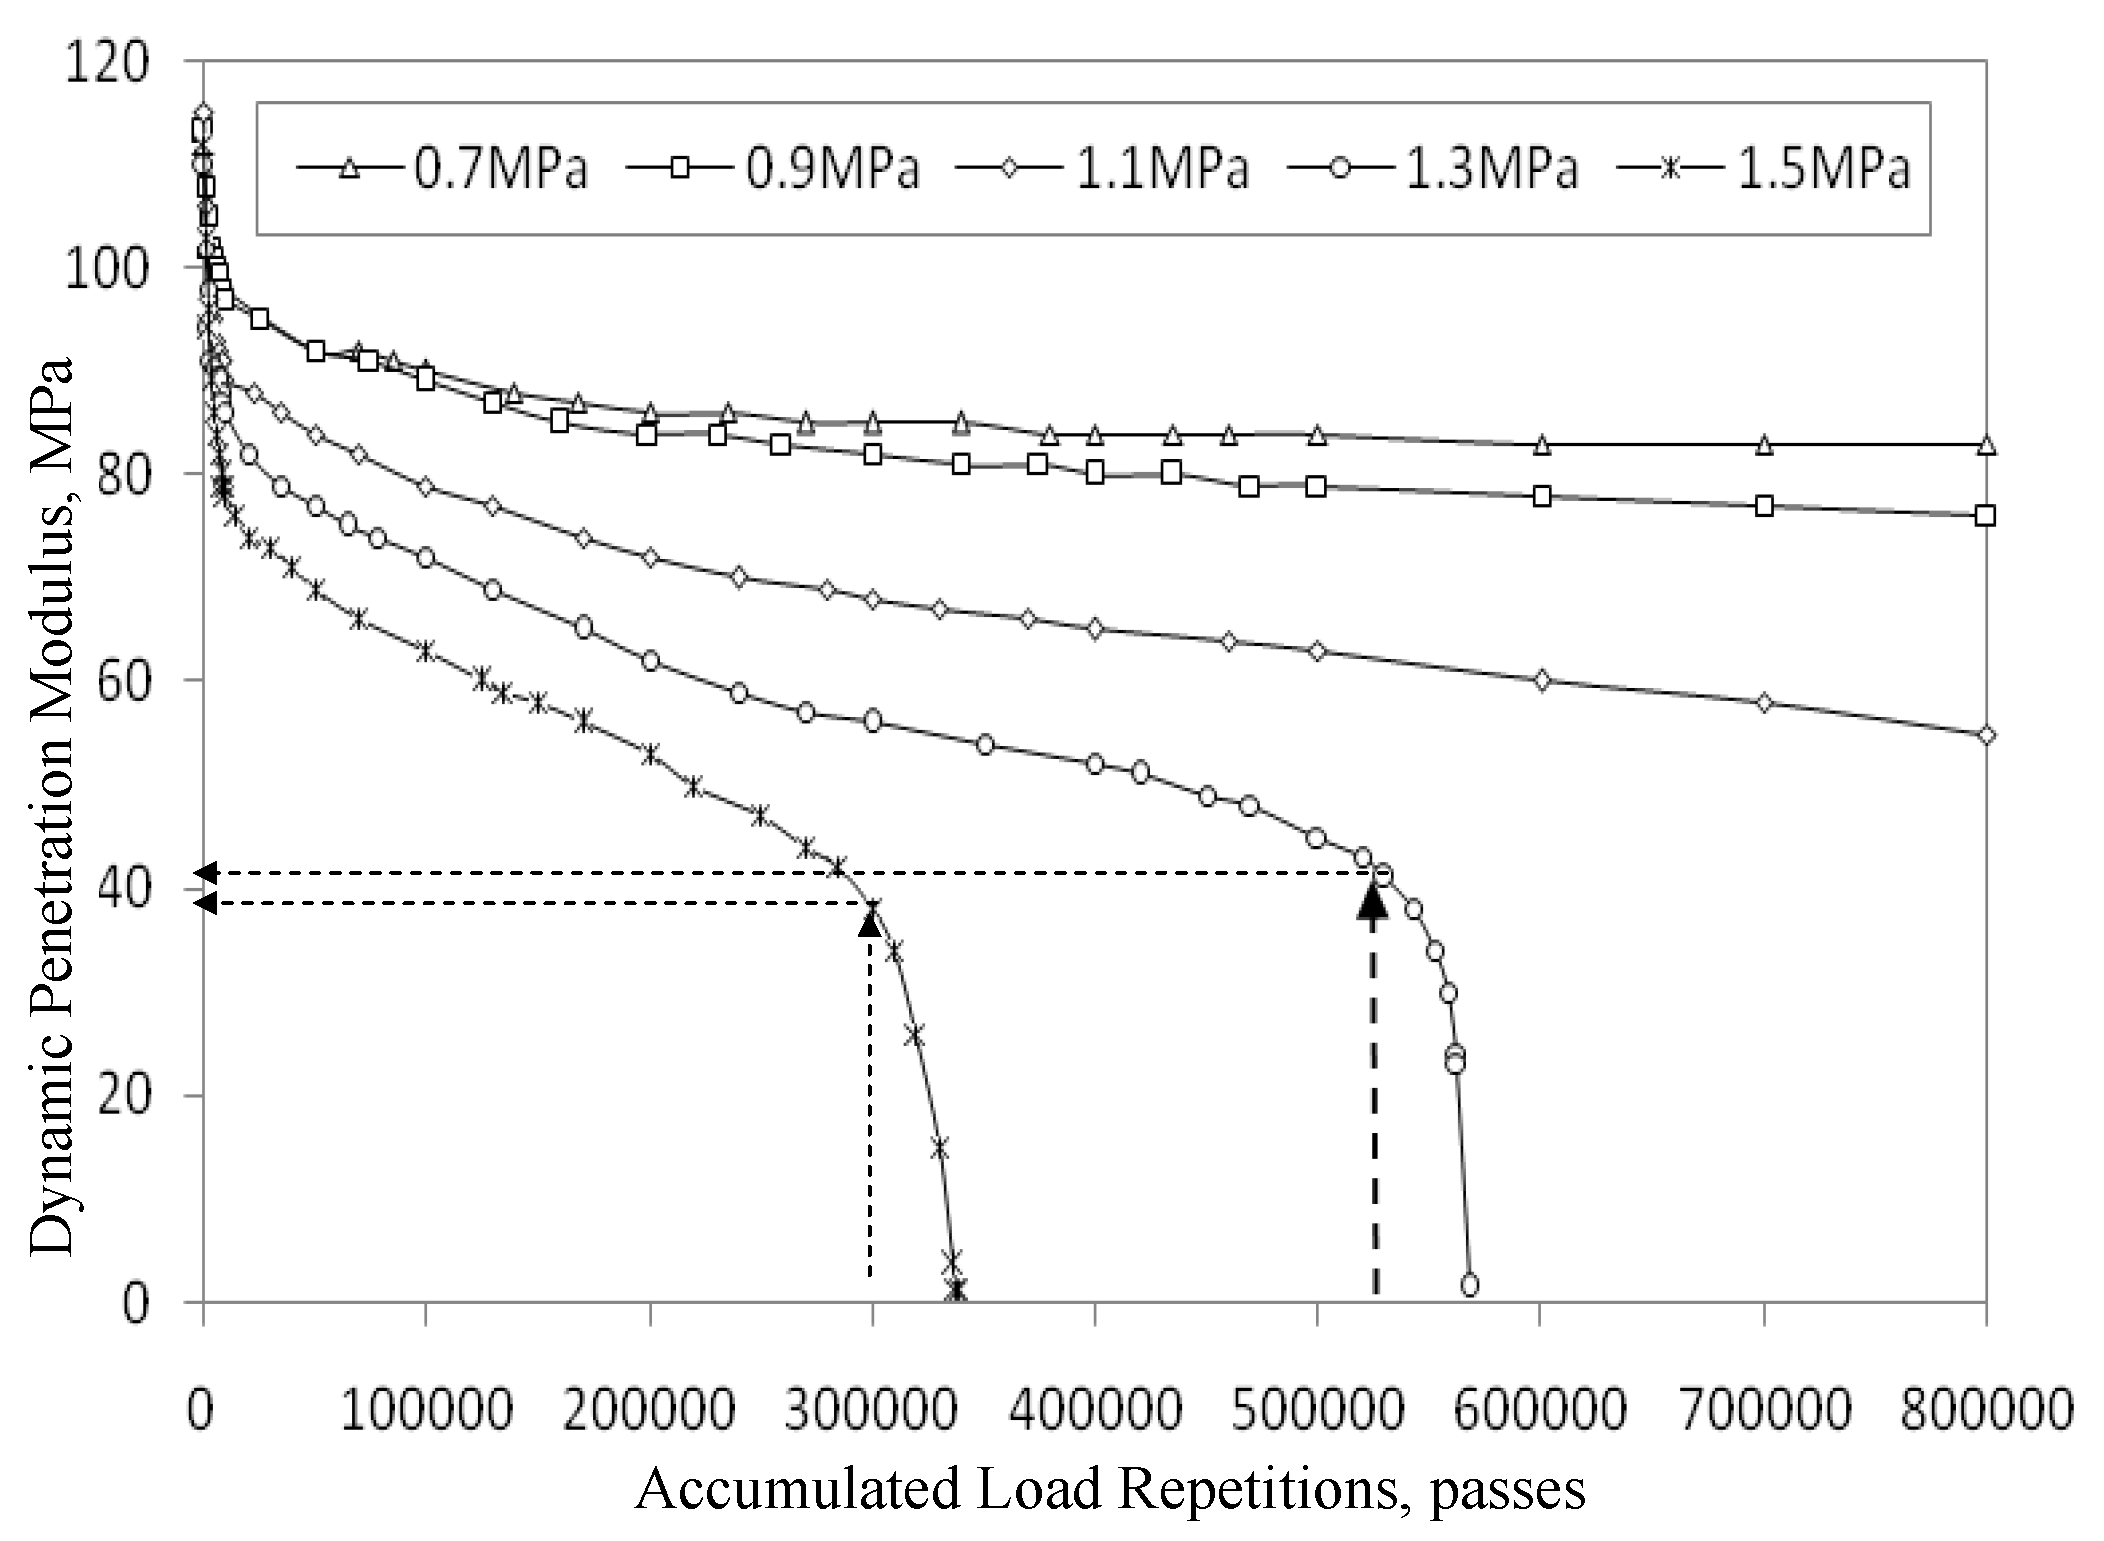
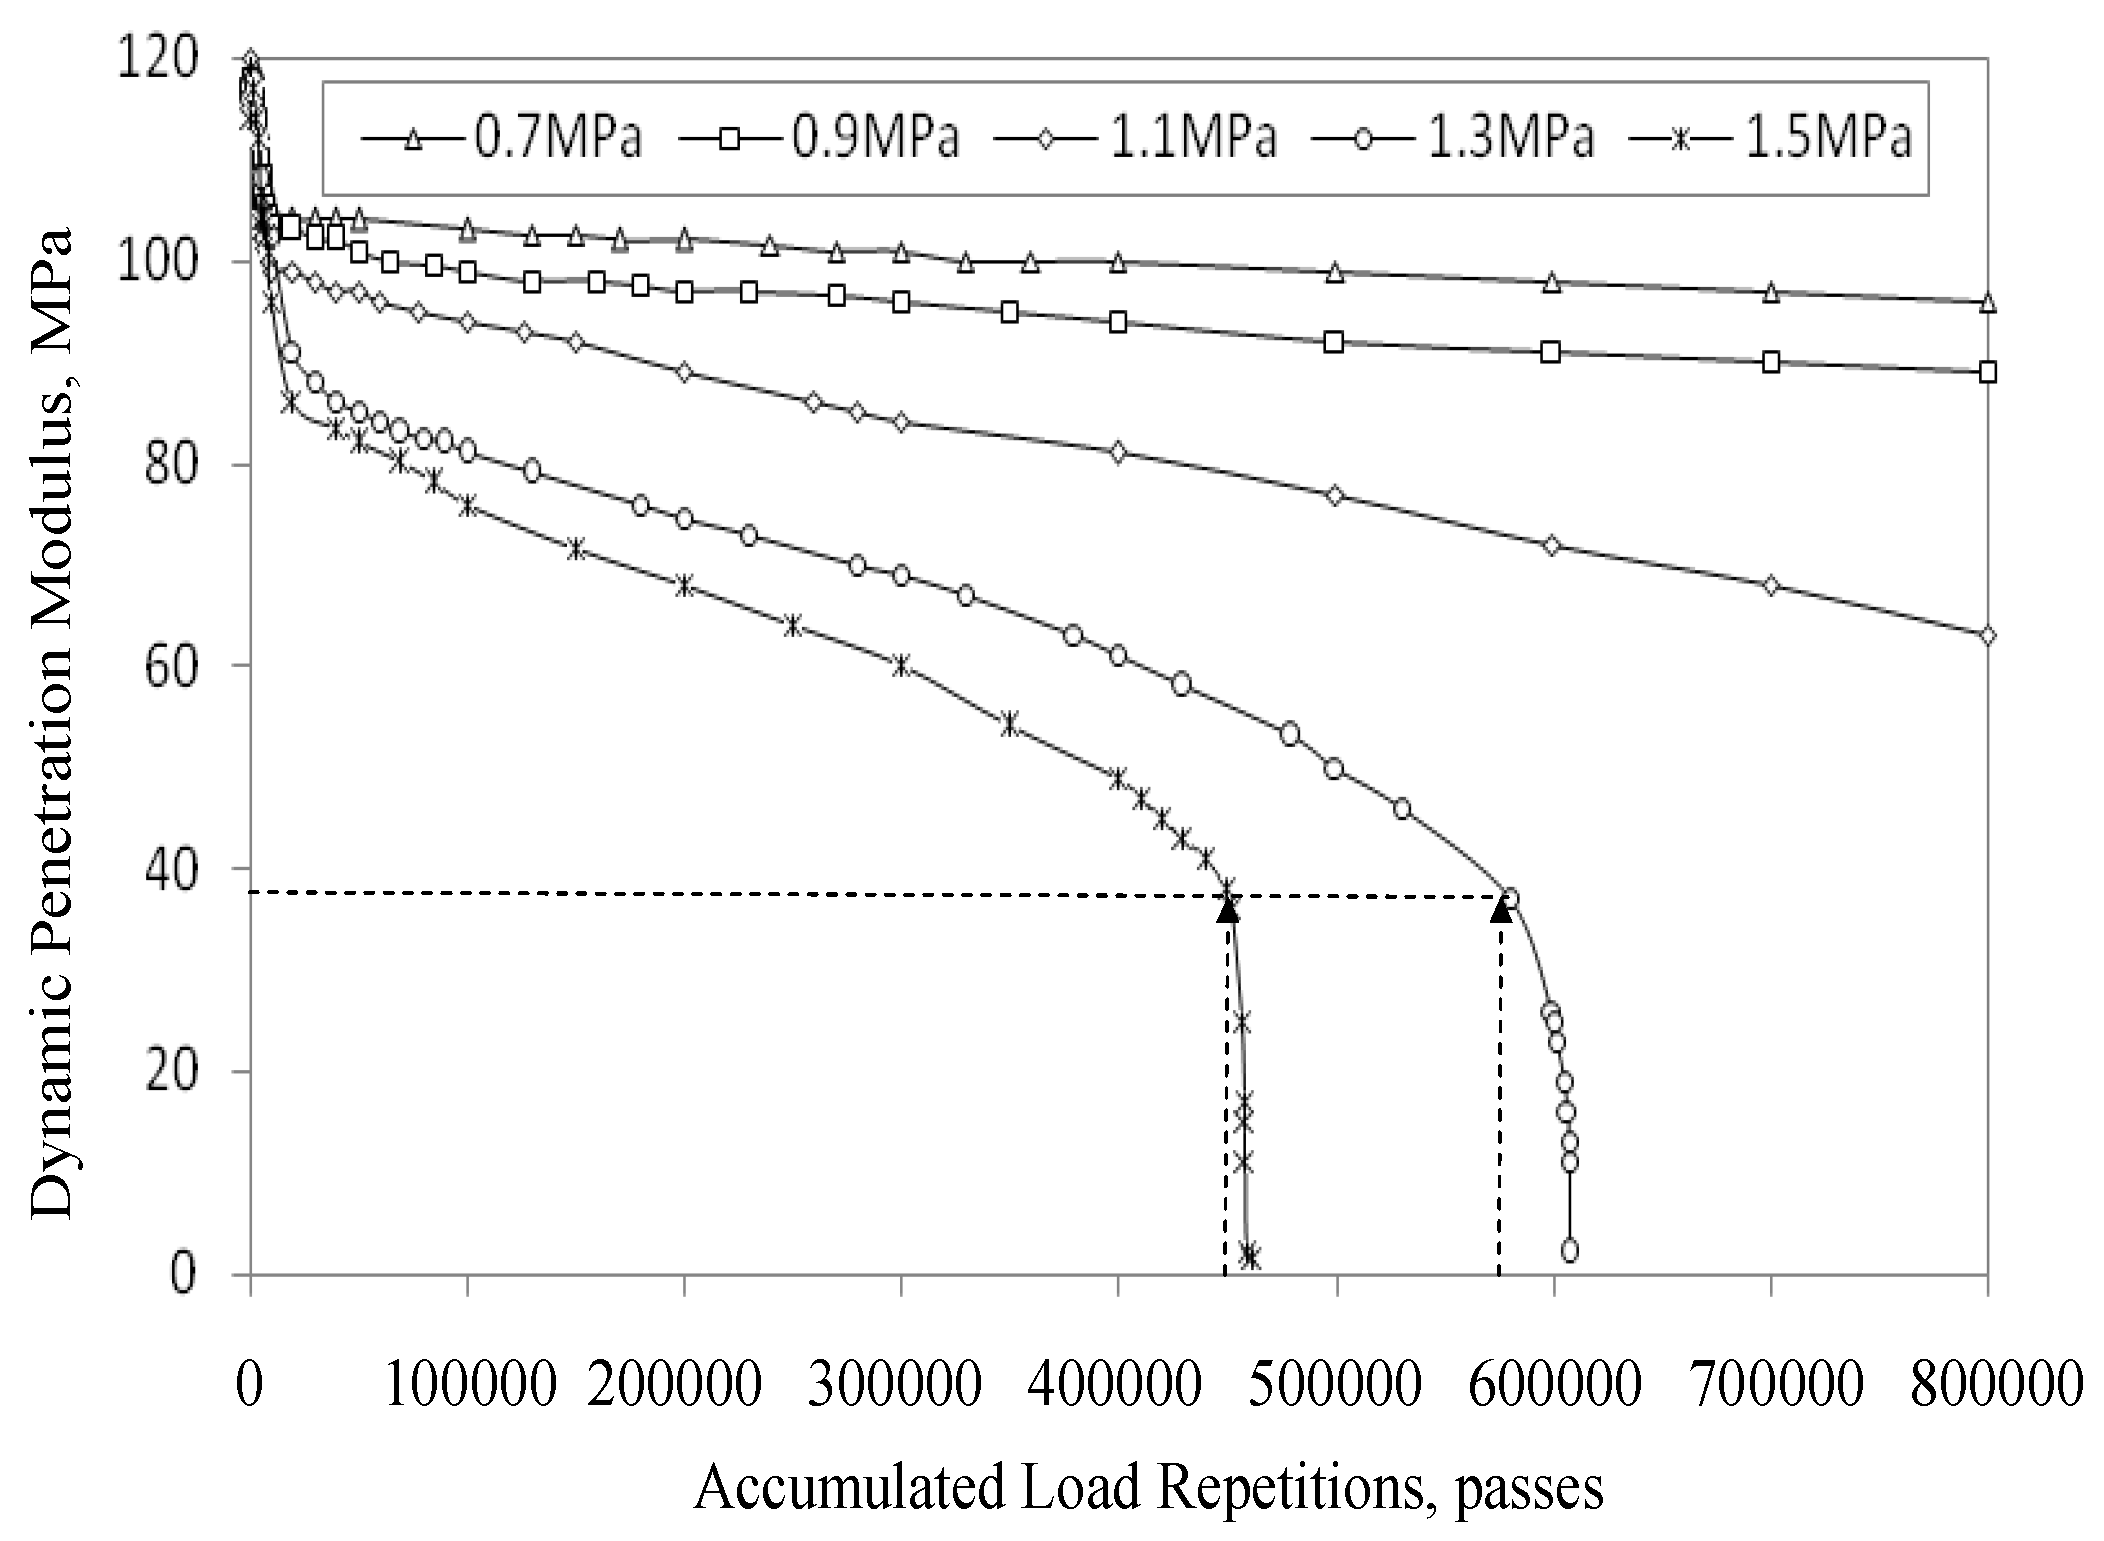
Inspired by the laboratory observations (
Figure 7,
Figure 8,
Figure 9,
Figure 10 and
Figure 11) and the relationship between TDC initiation and propagation and the dynamic penetration modulus deterioration, the authors explored a new way to view TDC initiation and propagation in asphalt pavements. A pavement structure with a geometry of 6 m × 6 m × 15 m was analyzed by FE method. Traffic loading was represented using a 22 × 16 cm rectangle with uniform distribution pressure of 0.7 MPa.
4.1. Simulation of Cracking Initiation and Propagation Process with FE Method
Based on the field and laboratory test results discussed previously, it was concluded that under repeated loading, shear damage occurs first in areas where maximum shear stress is located. Consequently, the modulus in those areas decreases and pavement stresses/strains are re-distributed within the whole pavement structure. When the modulus of the asphalt mixture in this area decreases to around 1/3 of initial value, the crack starts to grow rapidly. This is simulated by FE method, and detailed steps are described as follows:
Step 1: Establish a set of elements for the shear damage area, named set U.
Step 2: Compute the shear stress in the original pavement structure, and identify the element (say, e1) with maximum shear stress, then put this element (i.e., e1) into U.
Step 3: Assign a reduced modulus value to the elements in U, then reanalyze pavement structure with FE program.
Step 4: Identify again the element (for example, e2) with the maximum shear stress in the pavement structure, and put element e2 into U.
Step 5: Again, assign the discounted modulus value to the elements in U, then reanalyze pavement structure with the FE program.
Step 6: Find again the element (say, e3) with the maximum shear stress in the pavement structure, and put element e3 into U.
Step 7: Repeat above steps.
The element set {e1 e2 e3…en} of the shear damage area constitutes the shear damage area in the asphalt pavement structure under repeated loading.
With an assumed 0.7 MPa loading pressure, the numerical simulation of the shear damage process for various pavement structures (see
Table 3) was performed. It can be seen from the simulations that maximum shear stress always occurred at the inner side of the tyre edge at a depth of 40 mm. The element with maximum shear stress is believed to damage first, gradually extending to the adjacent elements in a horizontal direction towards the outside of tyre edge. Finally, a “damaged layer” is formed from a damaged element in the pavement structure.
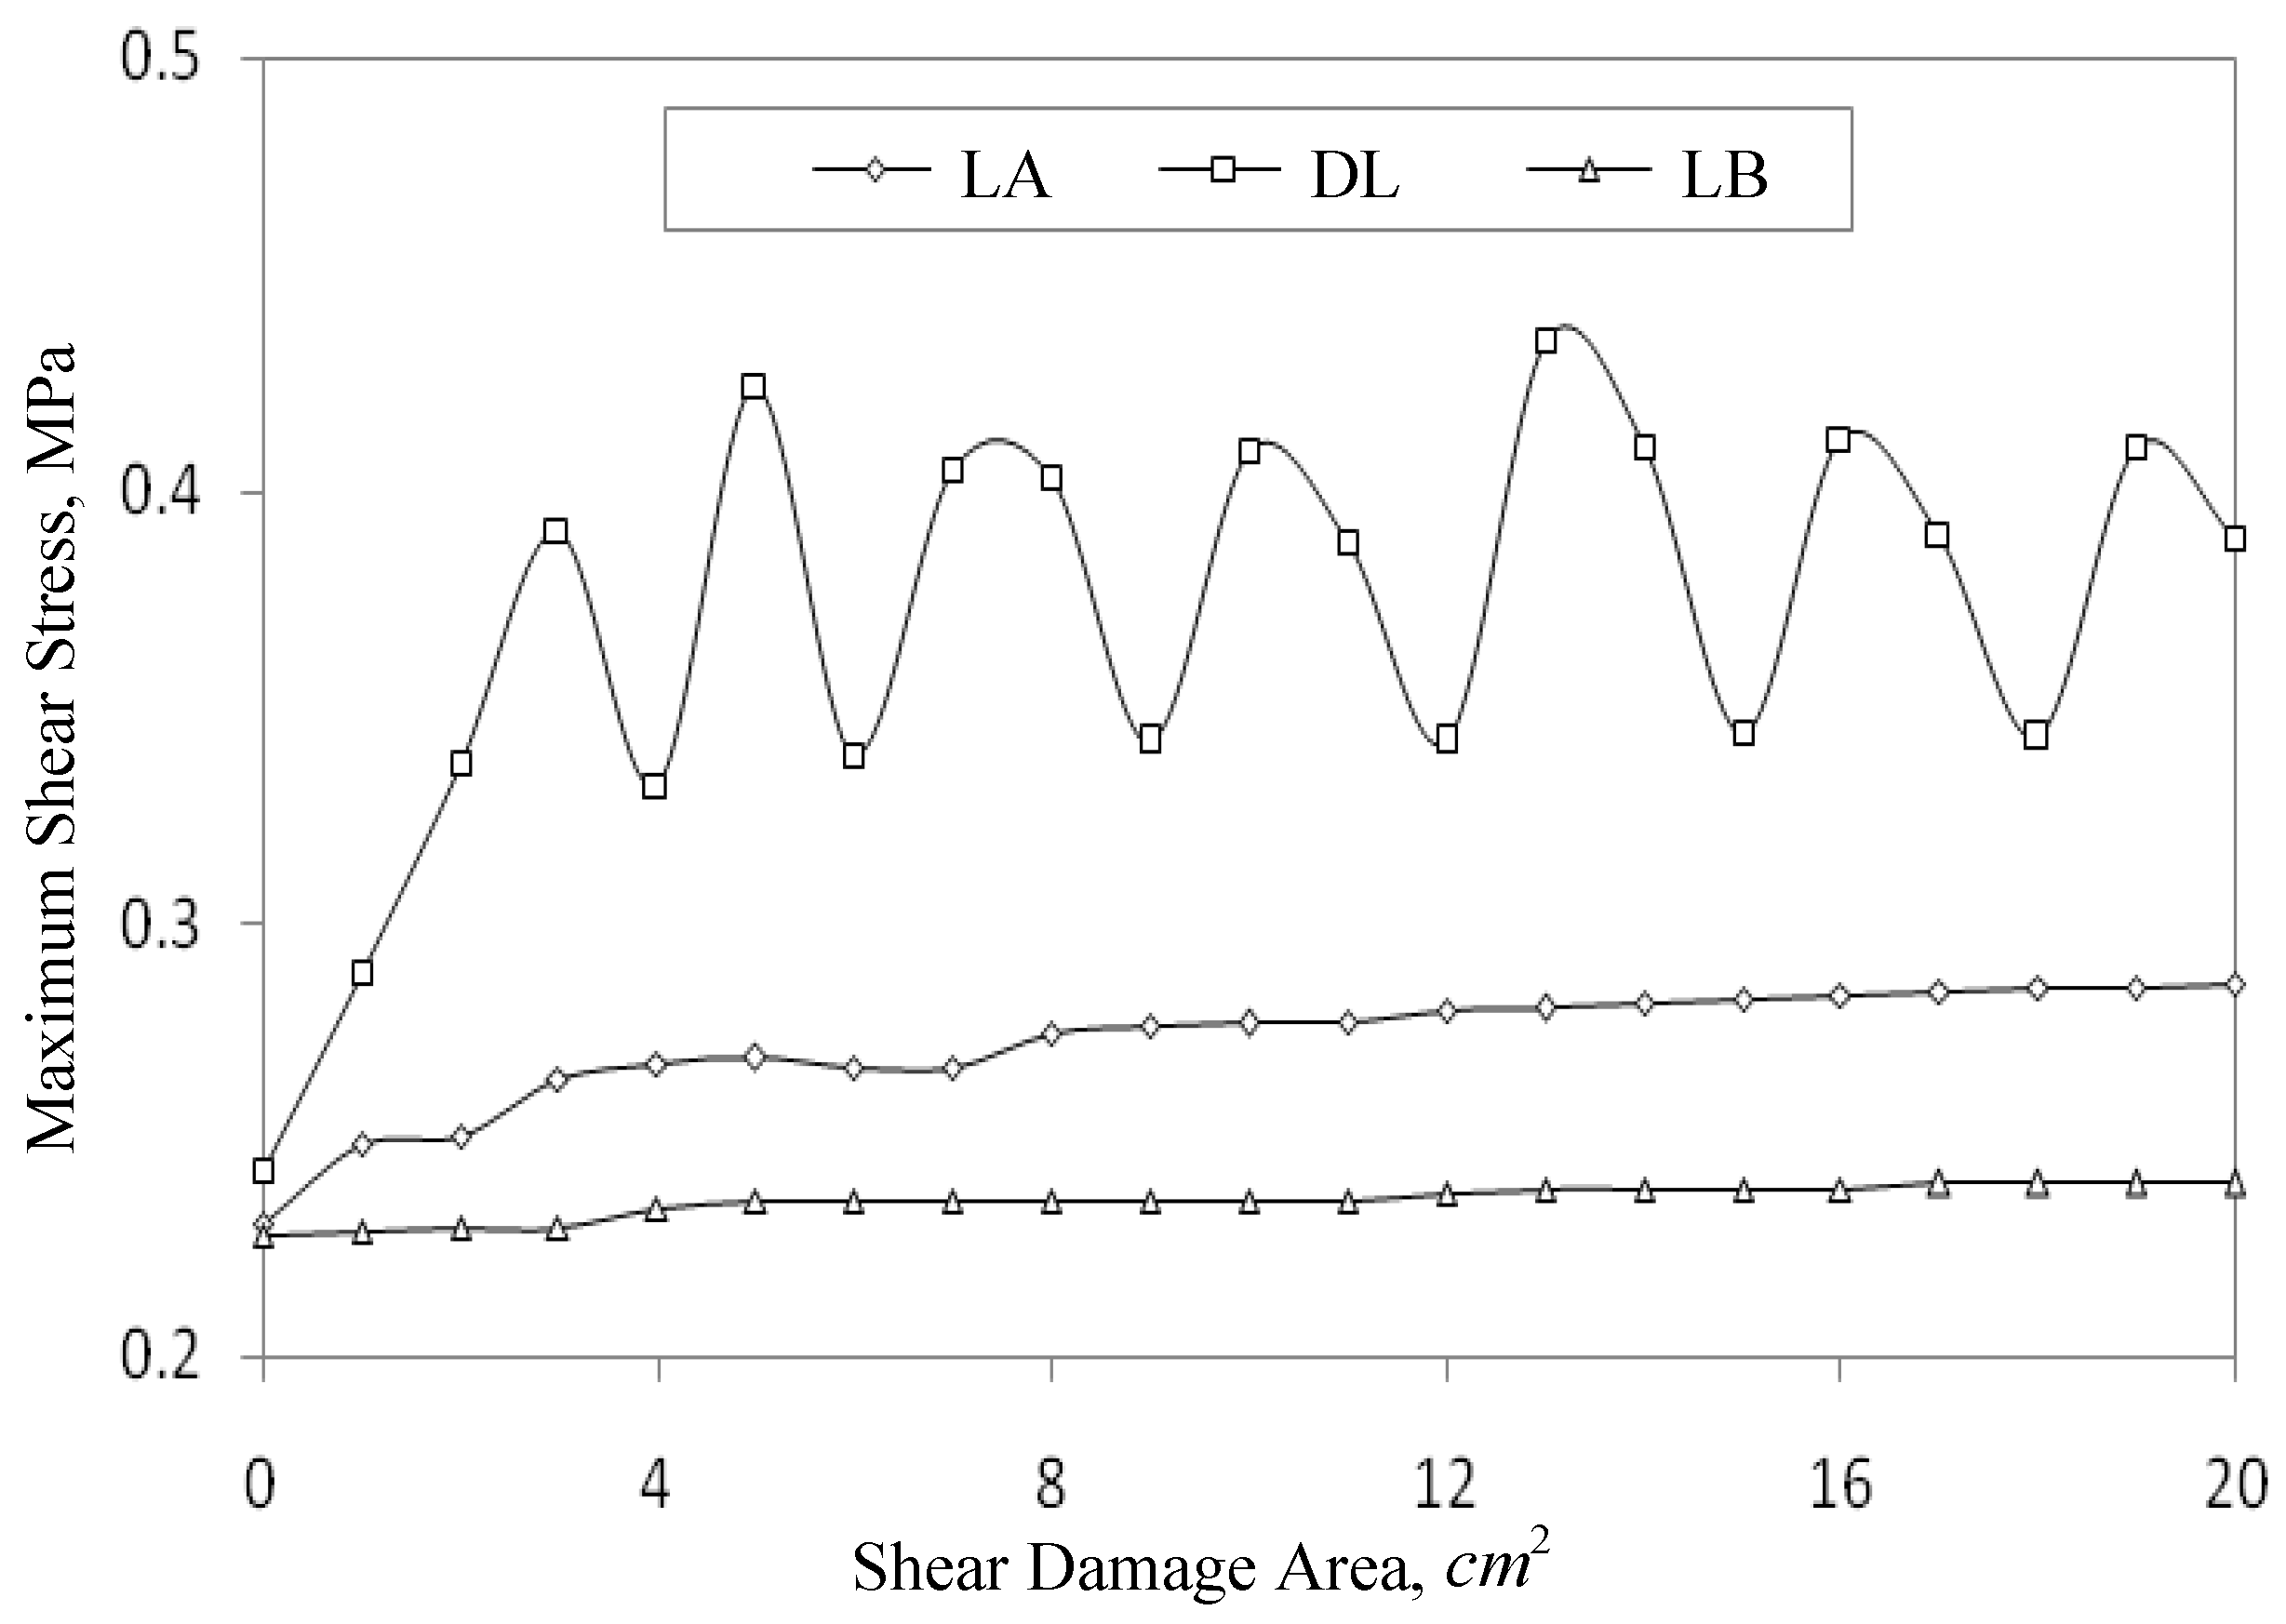
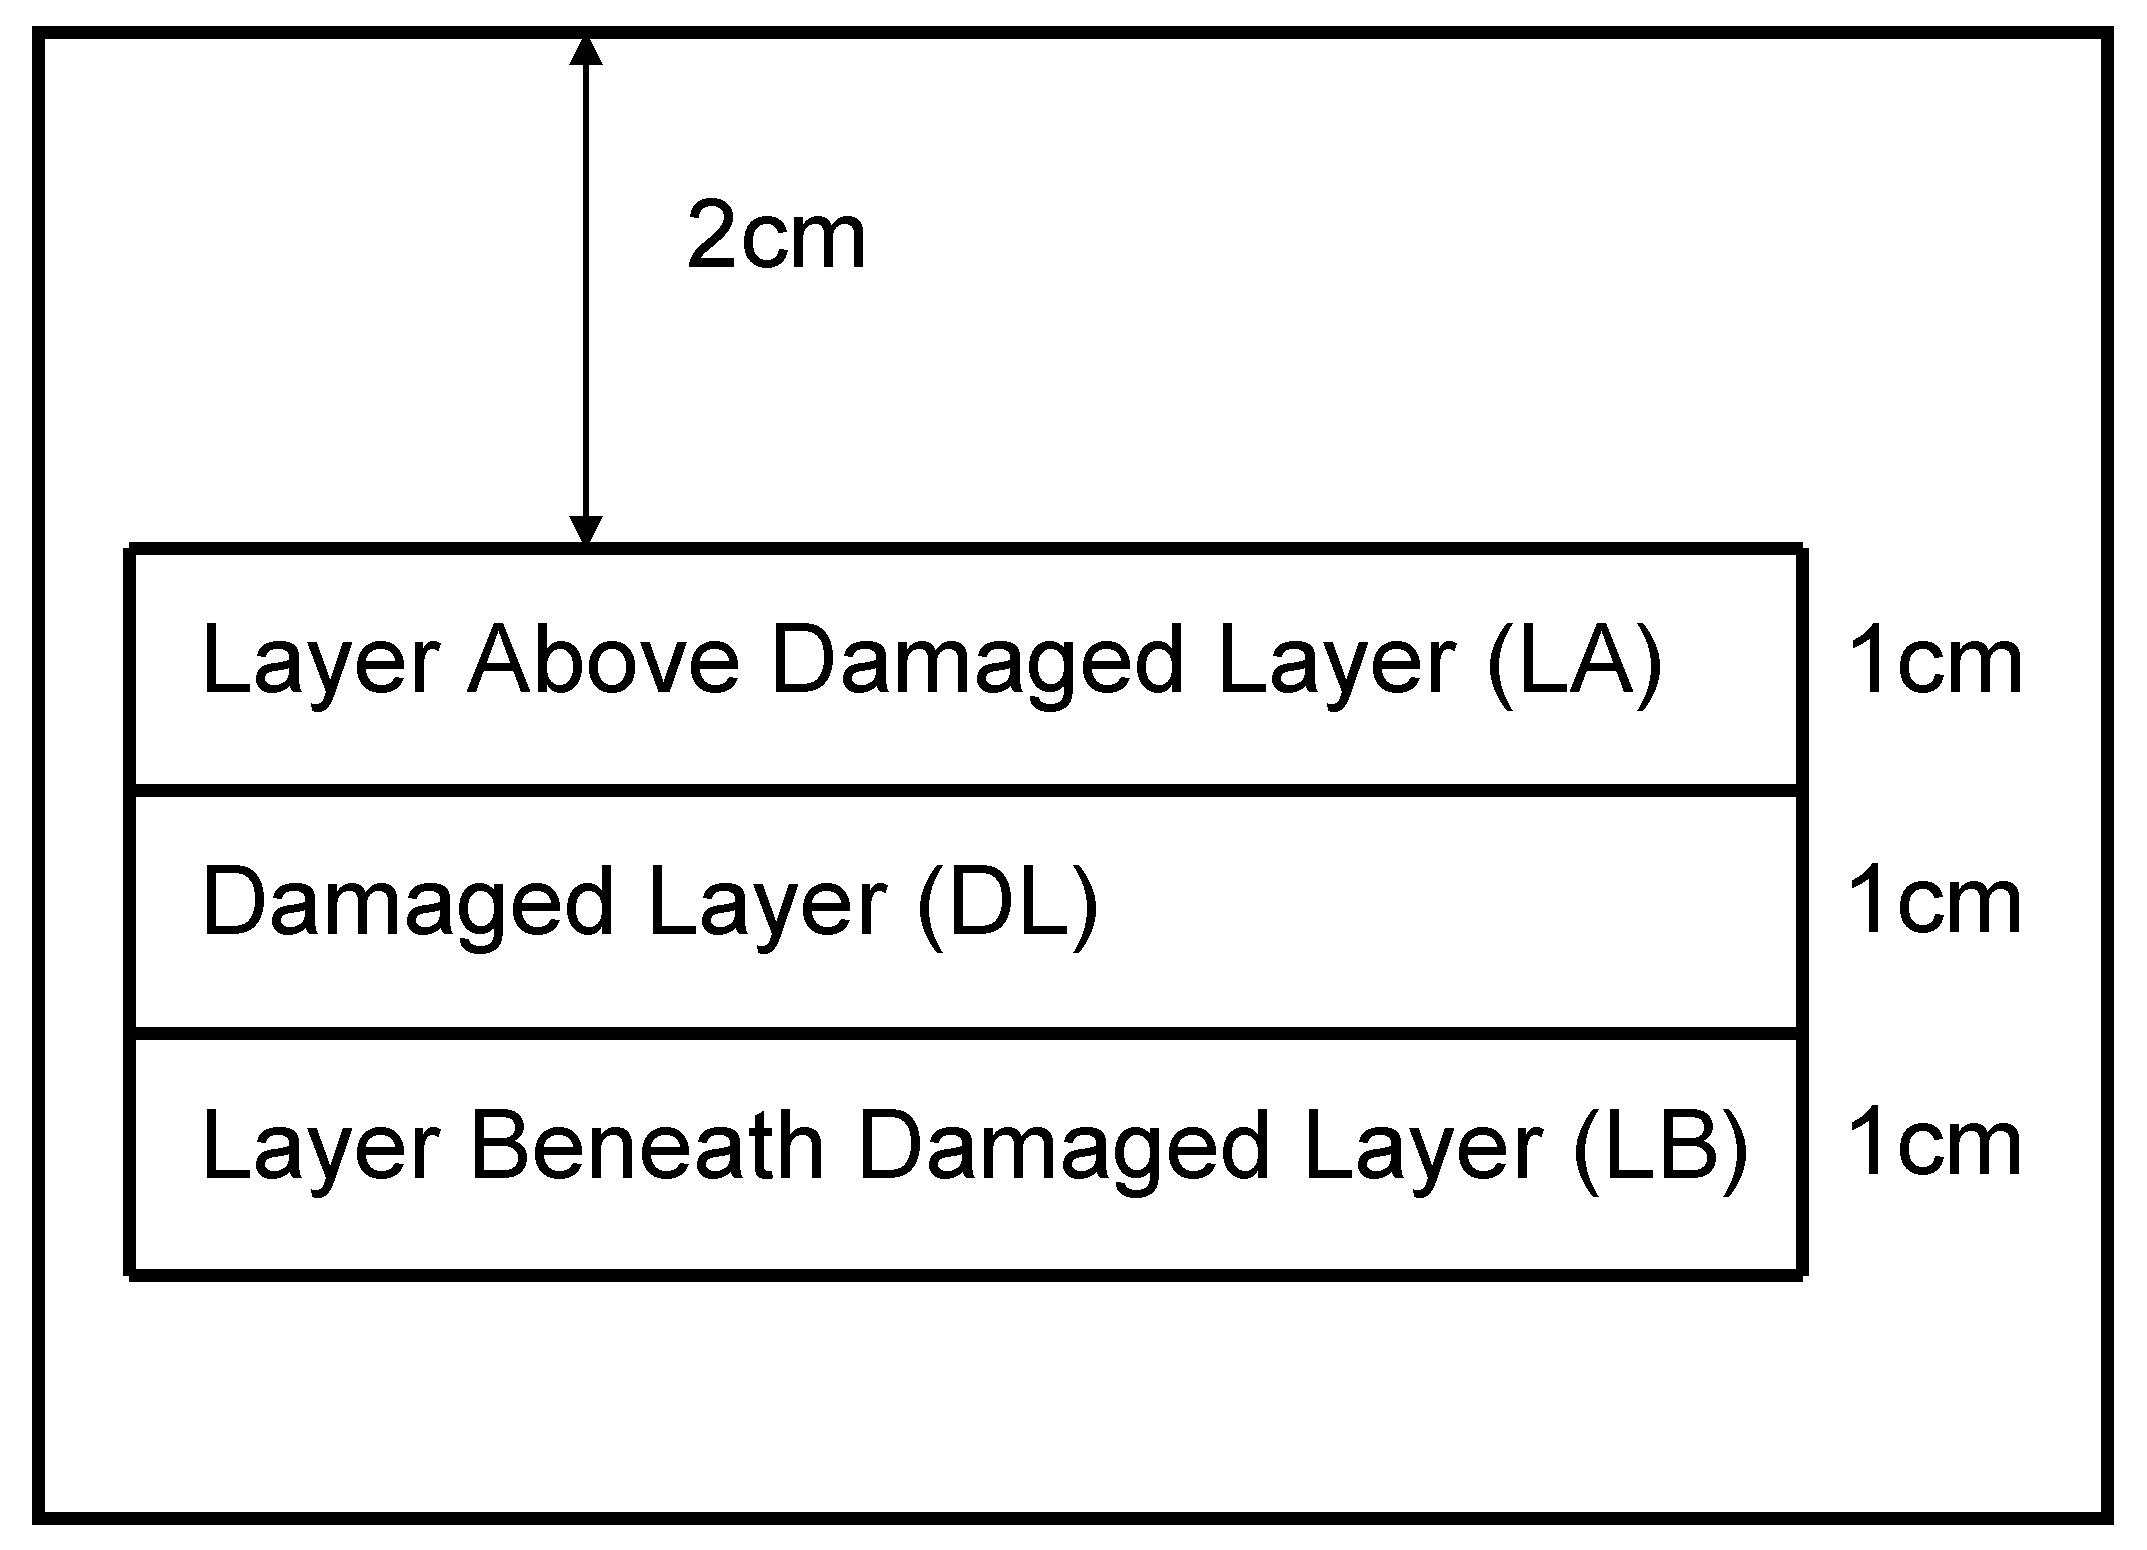
Figure 12 shows an example of pavement structure with a damaged layer (DL). The FE method was employed to investigate the impact of the weakened layer on the shear stresses in the layers above (LA) and beneath (LB) the damaged layer. As shown in
Figure 13, after shear damage, the maximum shear stresses
in the pavement structures kept a fixed relationship:
. Therefore, the maximum shear stress always occurs at the bottom of the damaged layer, 40 mm from the pavement surface. Accordingly, it is anticipated that shear damage in pavements under repeated loading will extend in a horizontal, rather than vertical, direction. Certainly, a shear-damaged layer will be formed. The same conclusion was made when analyzing other types of pavement structures. Horizontal, rather than vertical, extension of shear damage implies that the cause for TDC initiation and propagation may be more complex than initially thought.
4.2. Effects of Shear Damage Layer on Pavement Tensile Strain Distribution
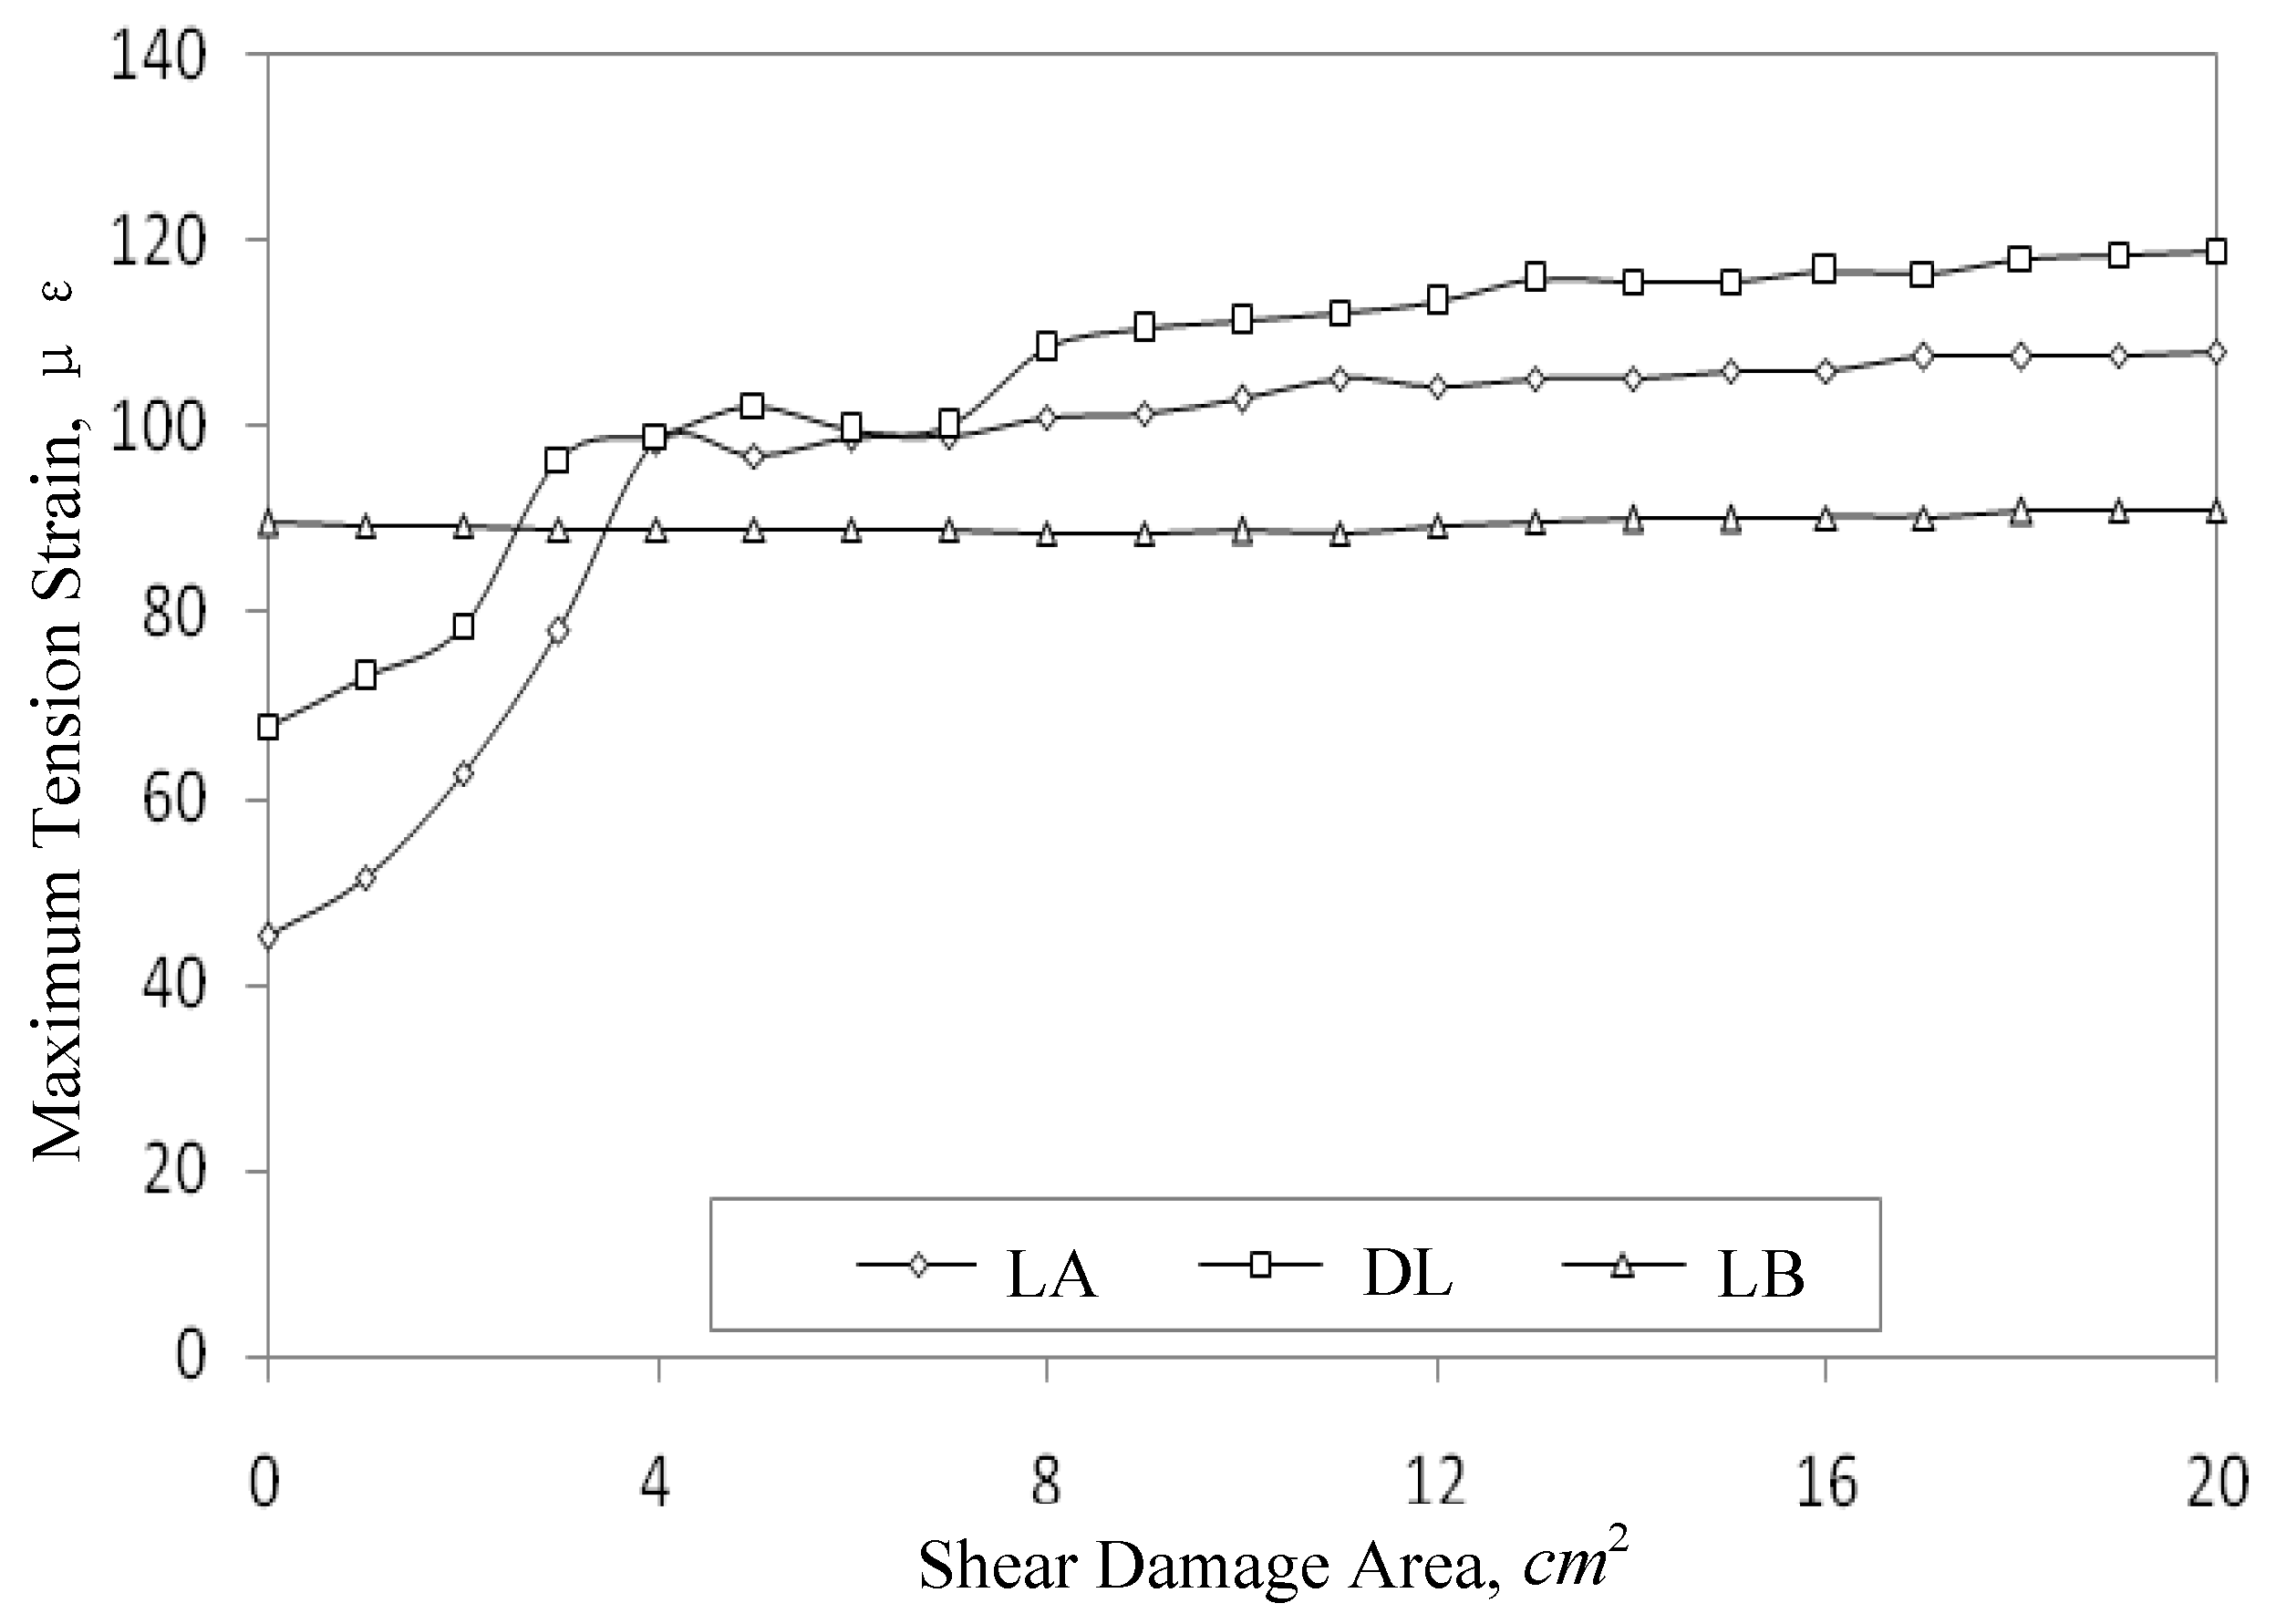
As discussed above, repeated loading results in a damaged layer in the pavement structure. It is obvious that this damaged layer will influence the tensile stress/strain distribution in nearby layers, including both LA and LB. The maximum tensile strains (at
x direction, which is perpendicular to the traveling direction) in the layers were computed with different assumed shear-damaged areas, as shown in
Figure 14.
Figure 14 shows that the maximum tensile strain in LA, DL, and LB at
x direction (i.e.,
,
and
) increased by 140.1%, 75.4% and 1.8%, respectively, when the shear damage area increased from 0 to 20 cm
2. When the shear damage area is larger than 4 cm
2, the maximum tensile strain at
x direction always kept the same order:
>
>
. With an increase in the shear damage area, the maximum tensile strain in LA increased rapidly, even exceeding the strain in LB. Therefore, there is a possibility that tension damage can occur in LA, and potentially accelerate the shear damage failure.
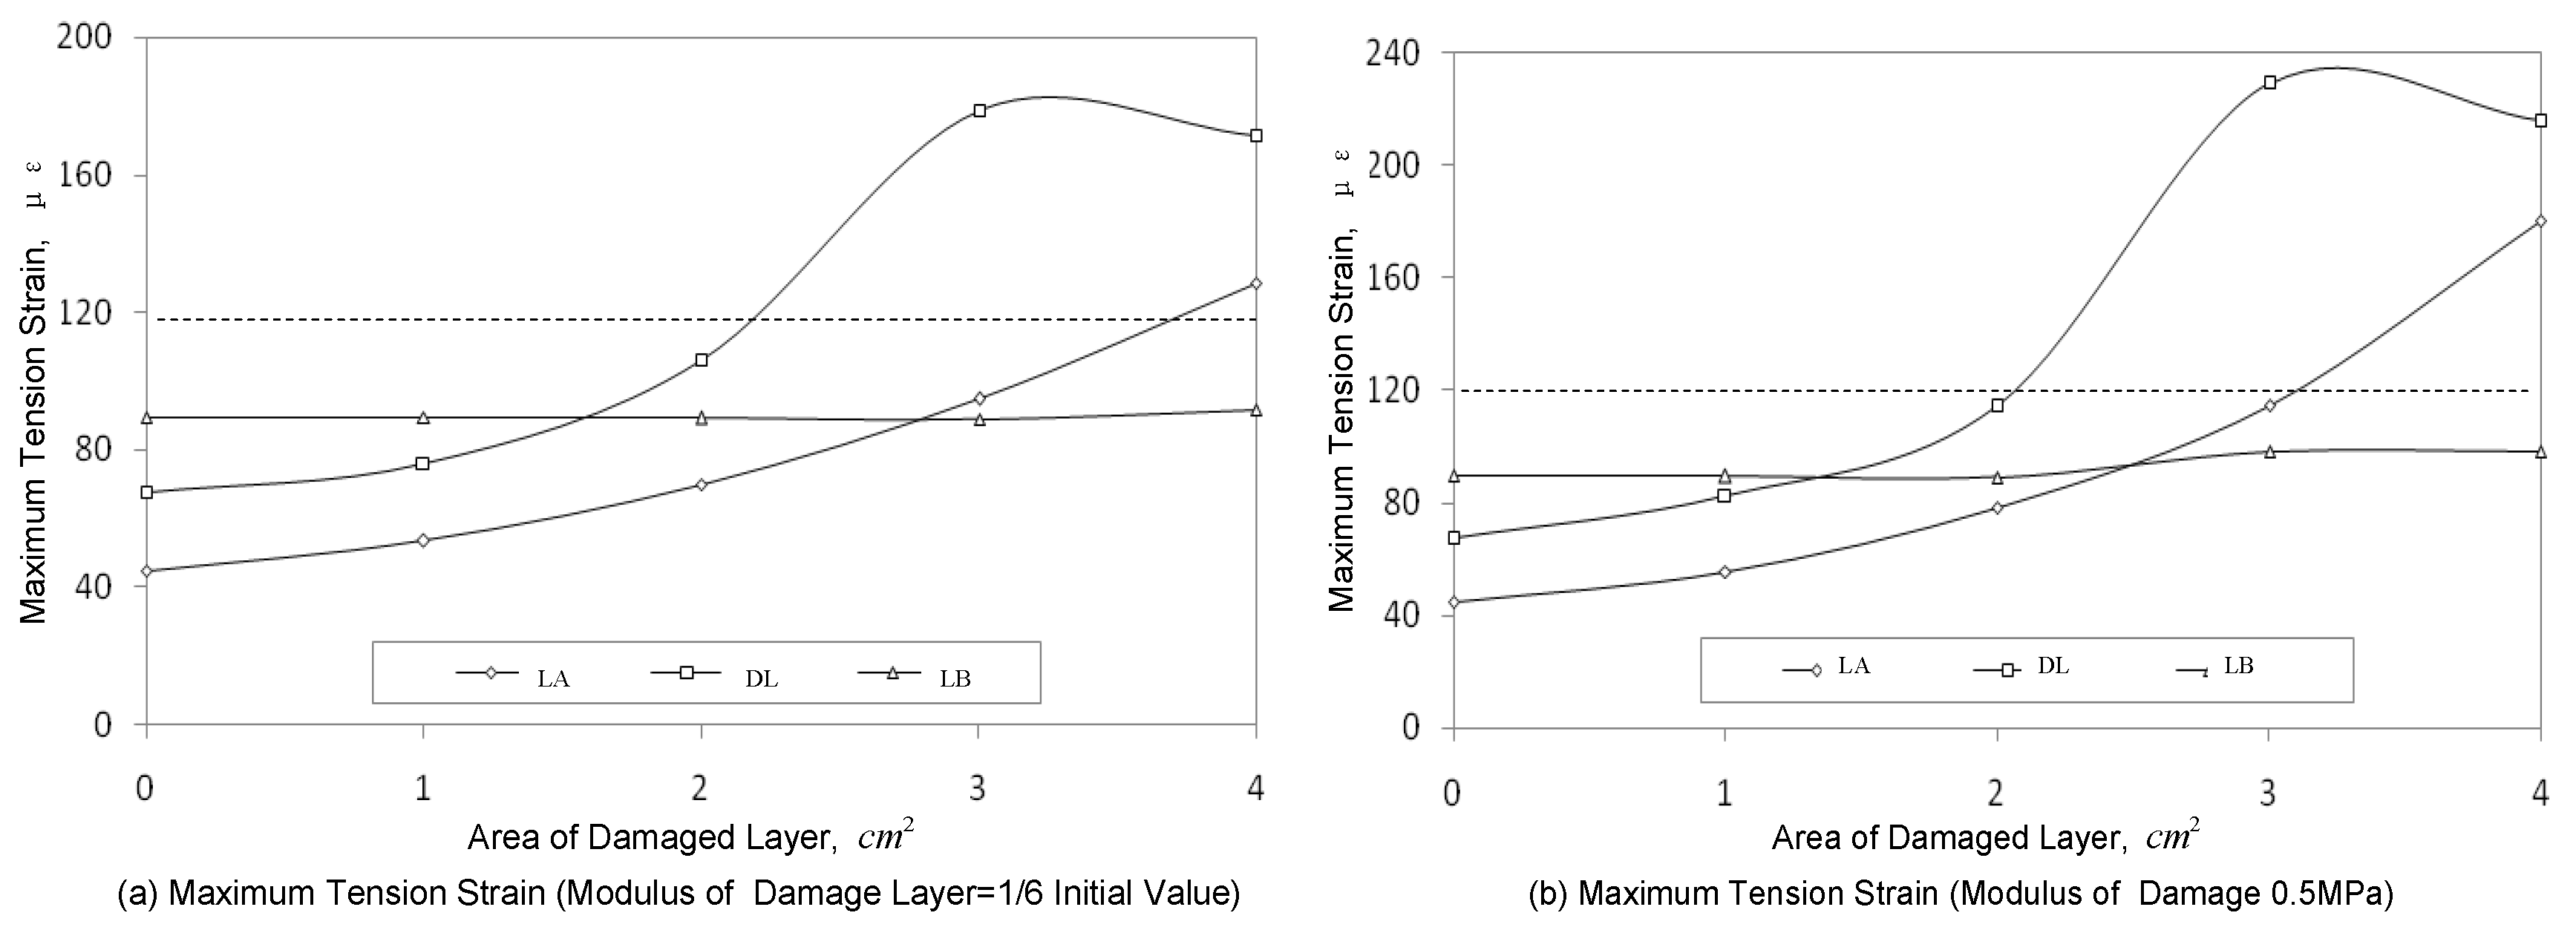
Repeated shear stress can damage the layer and result in the DL modulus reduction to almost 1/3 of its initial value, and even to 0 (assumed to be 0.5 MPa in FE model). Consequently, the maximum tensile strain in LA will be more than 120 με, as shown in
Figure 15.
As illustrated in
Figure 15, when the shear damage area reaches 3~4 cm
2, the maximum tensile strain in LA exceeds 120 με. Based on the laboratory studies and field survey conducted by Marshall [
15], Robert [
16], Angela [
17], and Xu [
18], it can be reasonably assumed that in cases where the tensile strain is above 120 με, fatigue cracking might occur. The tensile strain in DL is greater than that in LA, and so will accelerate the failure of the layer or the opening of cracks. For the LB, the tensile strain remains at a level of less than 120 με, indicating a low probability of tension cracking.
4.3. Analysis of TDC Growth Process
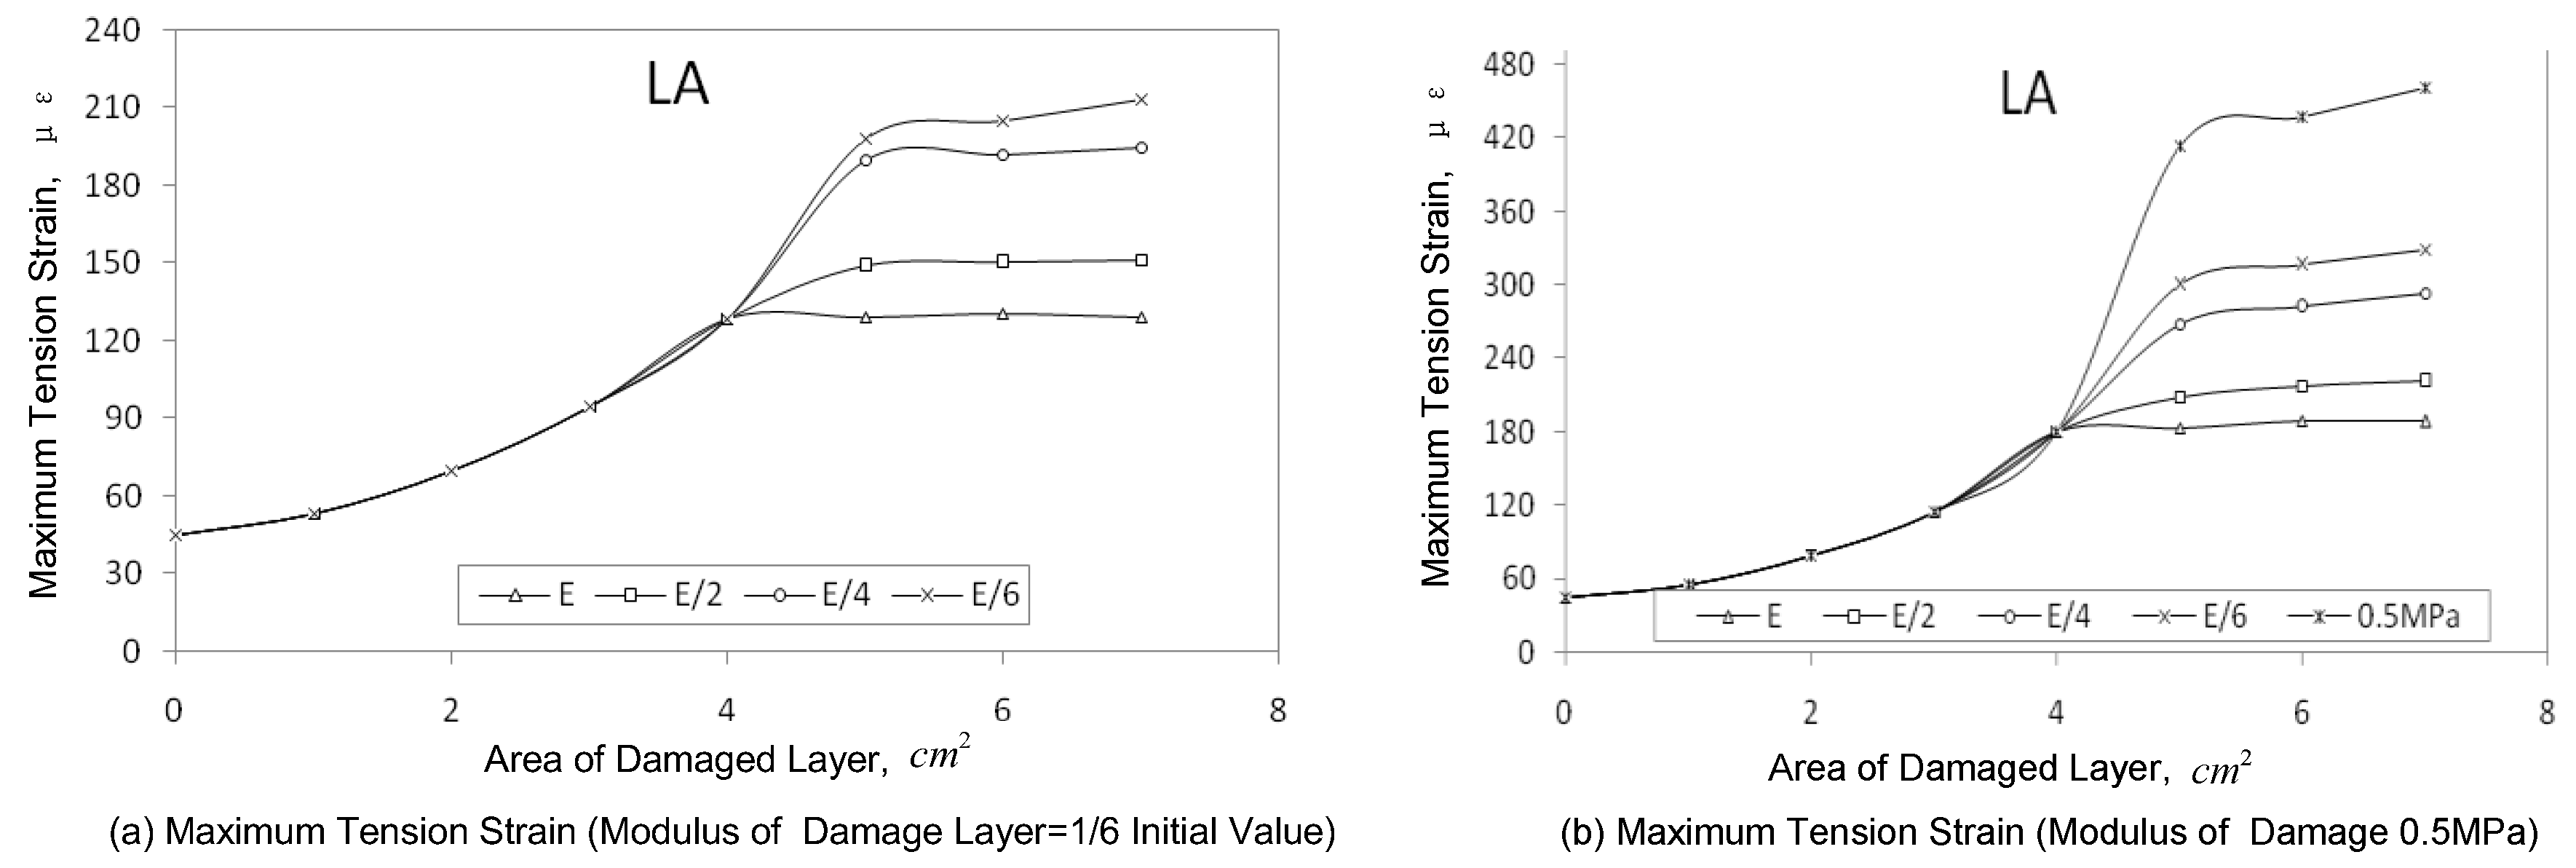
It is necessary to take into account the LA modulus reduction and evaluate its impact on the tensile strain in LA. The effects of reduced LA moduli (1, 1/2, 1/4 and 1/6 of its initial value) on the maximum tensile strain in LA are shown in
Figure 16.
Figure 16 clearly shows that the tensile strains with discounted moduli are much higher than 120 με. Thus, longitudinal cracks will occur under repeated loading. It will affect stress and strain responses in the layer above LA, resulting in a strain level higher than 120 με in the layer above LA. At same time, the maximum shear stress will increase from 0.270 MPa to 0.310 MPa.
In summary, this study proposed a new TDC initiation and propagation mechanism: shear damage in the asphalt layer results in increased tensile strain in the LA, which causes tension cracks; these tension cracks finally propagate upwards to the pavement surface. This new TDC mechanism can be described as “shear damage, then tension propagation”. After the crack propagates to pavement surface, stresses in the pavement structure will be re-distributed, and the maximum shear stress area will move downwards to the place beneath the crack tip. Then, the process of “shear damage, then tension propagation” will be repeated until it completely goes through the entire asphalt layer. It is worth noting that thermal stress will also accelerate crack propagation, although this was not discussed in detail in this paper.
5. Summary and Conclusions
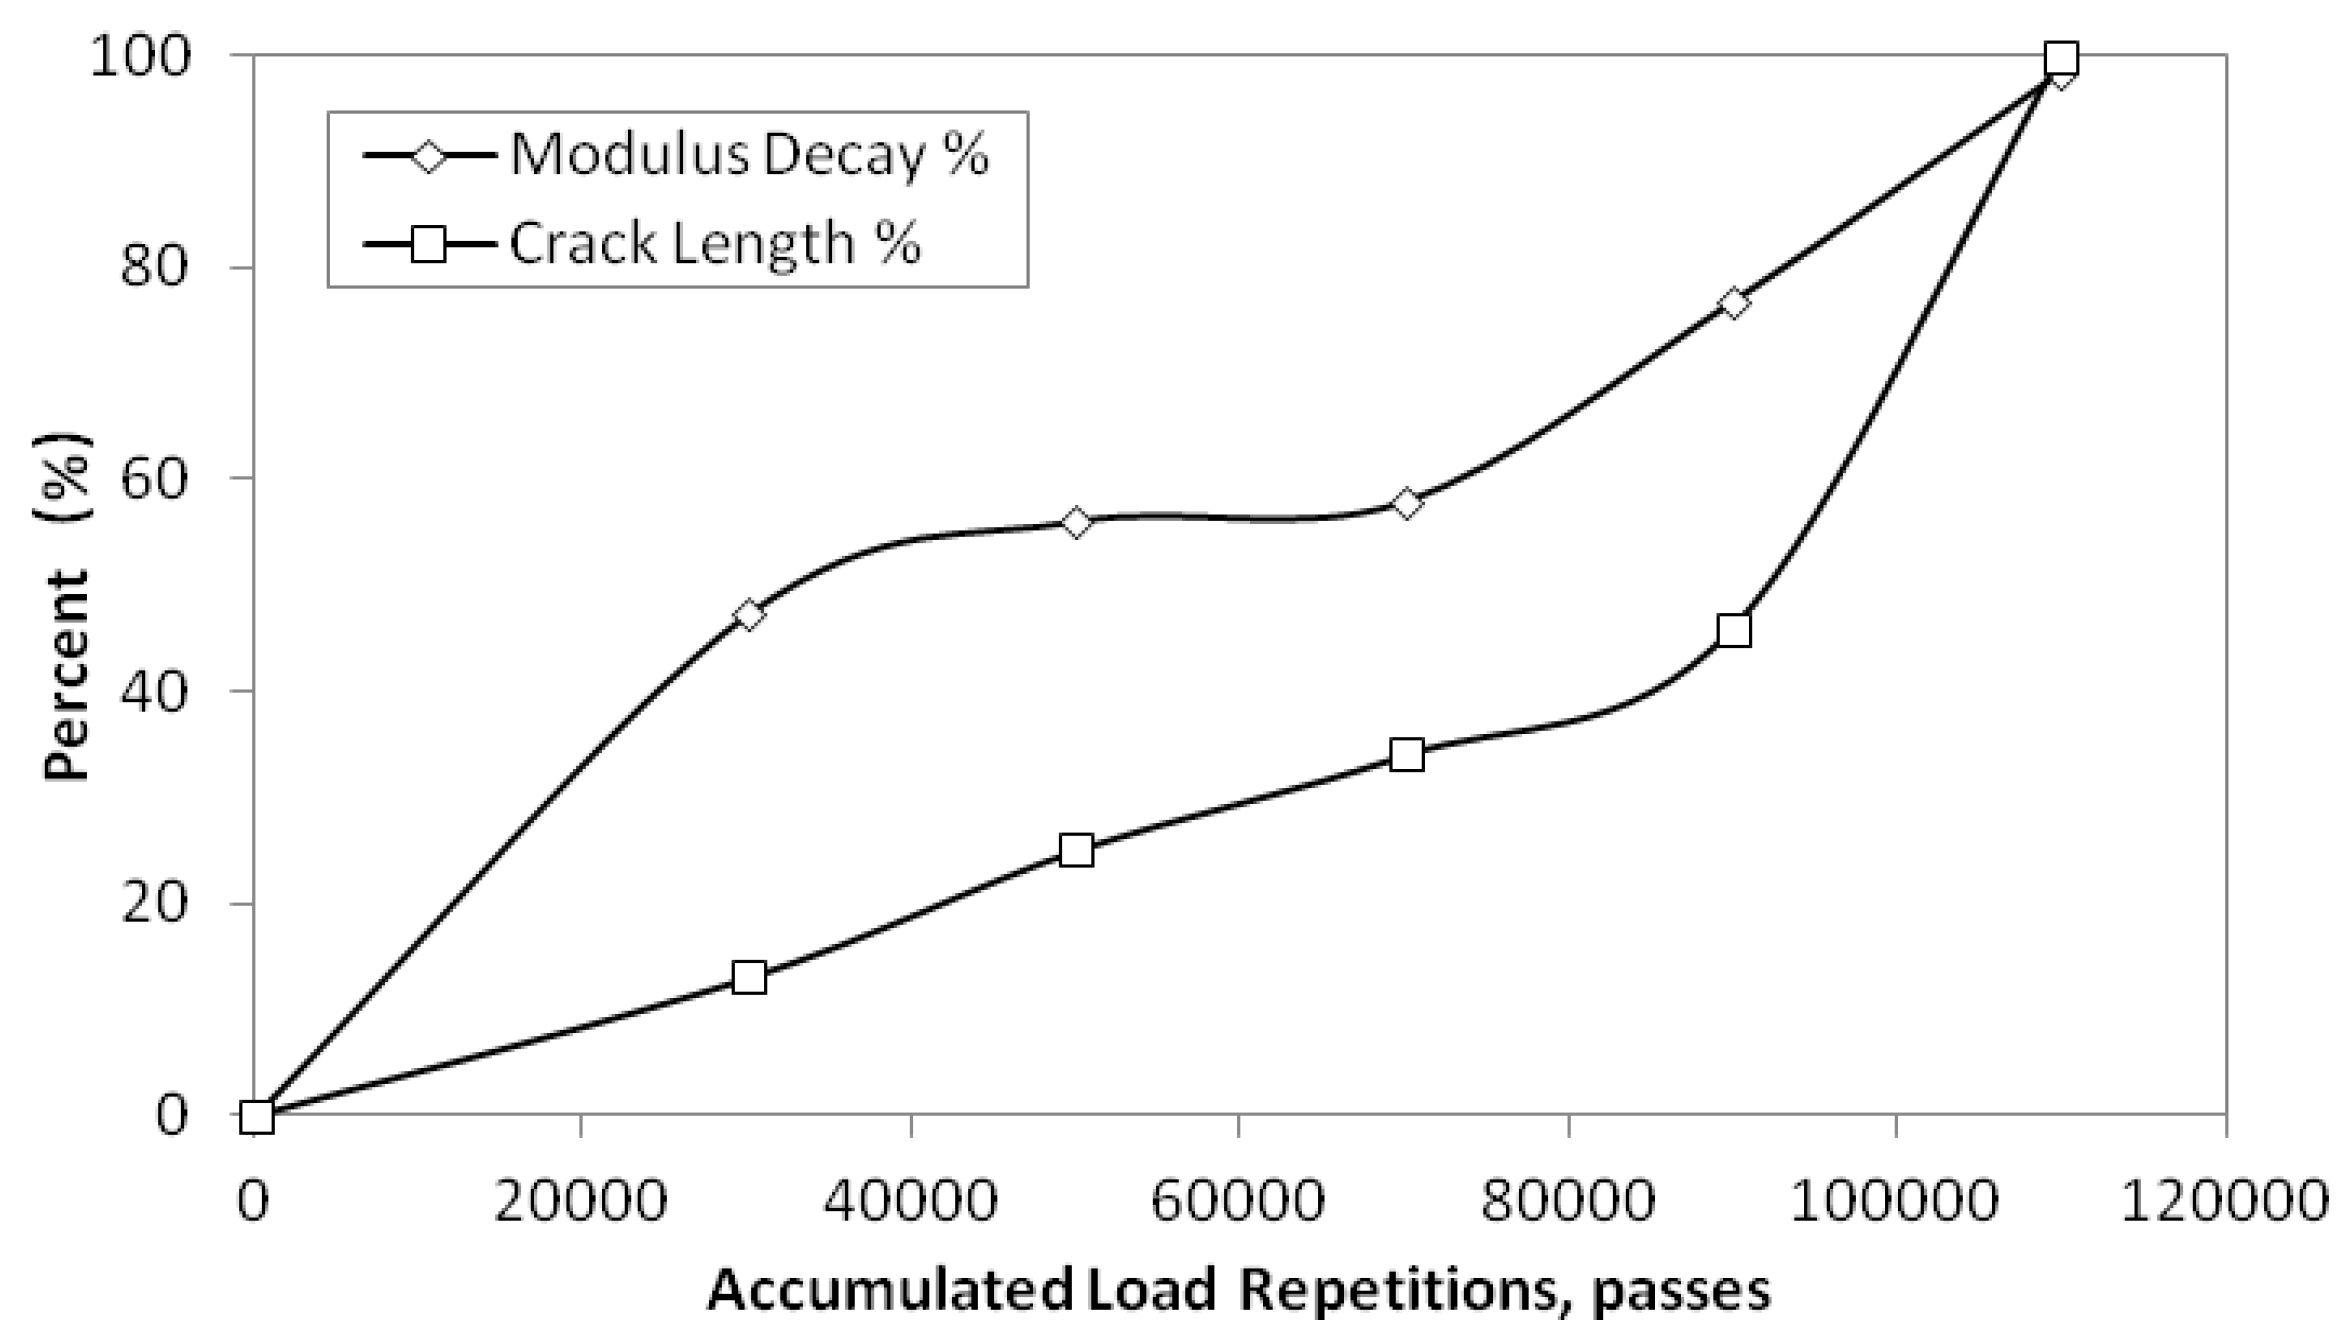
The TDC initiation and propagation process is much more complex than first believed. The field APT test results showed that under repeated loading, TDC occurred first within 20 mm outside of the wheel path and was more easily induced at higher temperatures. The cracking damage characteristics of specimens under laboratory uniaxial repeated penetration test coincided well with the field TDC. Therefore, the uniaxial repeated penetration test can be used to simulate TDC initiation and propagation processes. With increasing load repetitions, the dynamic penetration modulus of the mixture kept decreasing; this decreasing process is consistent with crack length growth.
Based on field and laboratory test data and extensive FE analyses, this paper concluded that top-down cracking is caused by shear stress, although the crack propagation process is not that simple. Maximum shear stress causes damage, which then extends horizontally and forms a damaged layer; the damaged layer will further cause the increased tensile strain in the upper layer. Higher tensile strain will result in crack initiation and propagation upwards to the pavement surface. The whole process can be summarized as “shear damage, then tension extension”. More field, laboratory, and mechanistic analysis is needed to further validate this new TDC mechanism.


