Covert Cyber Assault Detection in Smart Grid Networks Utilizing Feature Selection and Euclidean Distance-Based Machine Learning


Abstract
1. Introduction
1.1. Motivation
1.2. Related Works
1.3. Contributions
- We study intelligently-crafted CCD assaults on the SE-MF dataset, and we investigate how such an assault goes undetected in legacy systems that use bad-data detectors.
- To tackle the increasing computational complexity with the growing sizes of power systems, we use GA for the selection of independent and discriminating features from the SE-MF dataset. The selection of discriminative features leads to lower computational costs, a shorter time delay and improved accuracy.
- First, we propose an ED-based AD scheme to detect the presence of outliers in the unlabeled SE-MF dataset. Next, we extend the first scheme to propose a detection mechanism for the labeled SE-MF dataset. In both schemes, the optimal features selected through the GA are employed as input.
- We use the IEEE standard 14-bus, 39-bus, 57-bus and 118-bus test systems to evaluate the efficiency of the proposed schemes. The performance evaluation shows that the proposed schemes provide better accuracy, in comparison to existing AD-based schemes.
1.4. Paper Organization
2. Covert Cyber Deception Assault
2.1. Legacy Bad-Data Detectors in PCCs
2.2. The Covert Cyber Deception Assault
3. CCD Assault Detection Using Euclidean Distance-Based Anomaly Detection Schemes
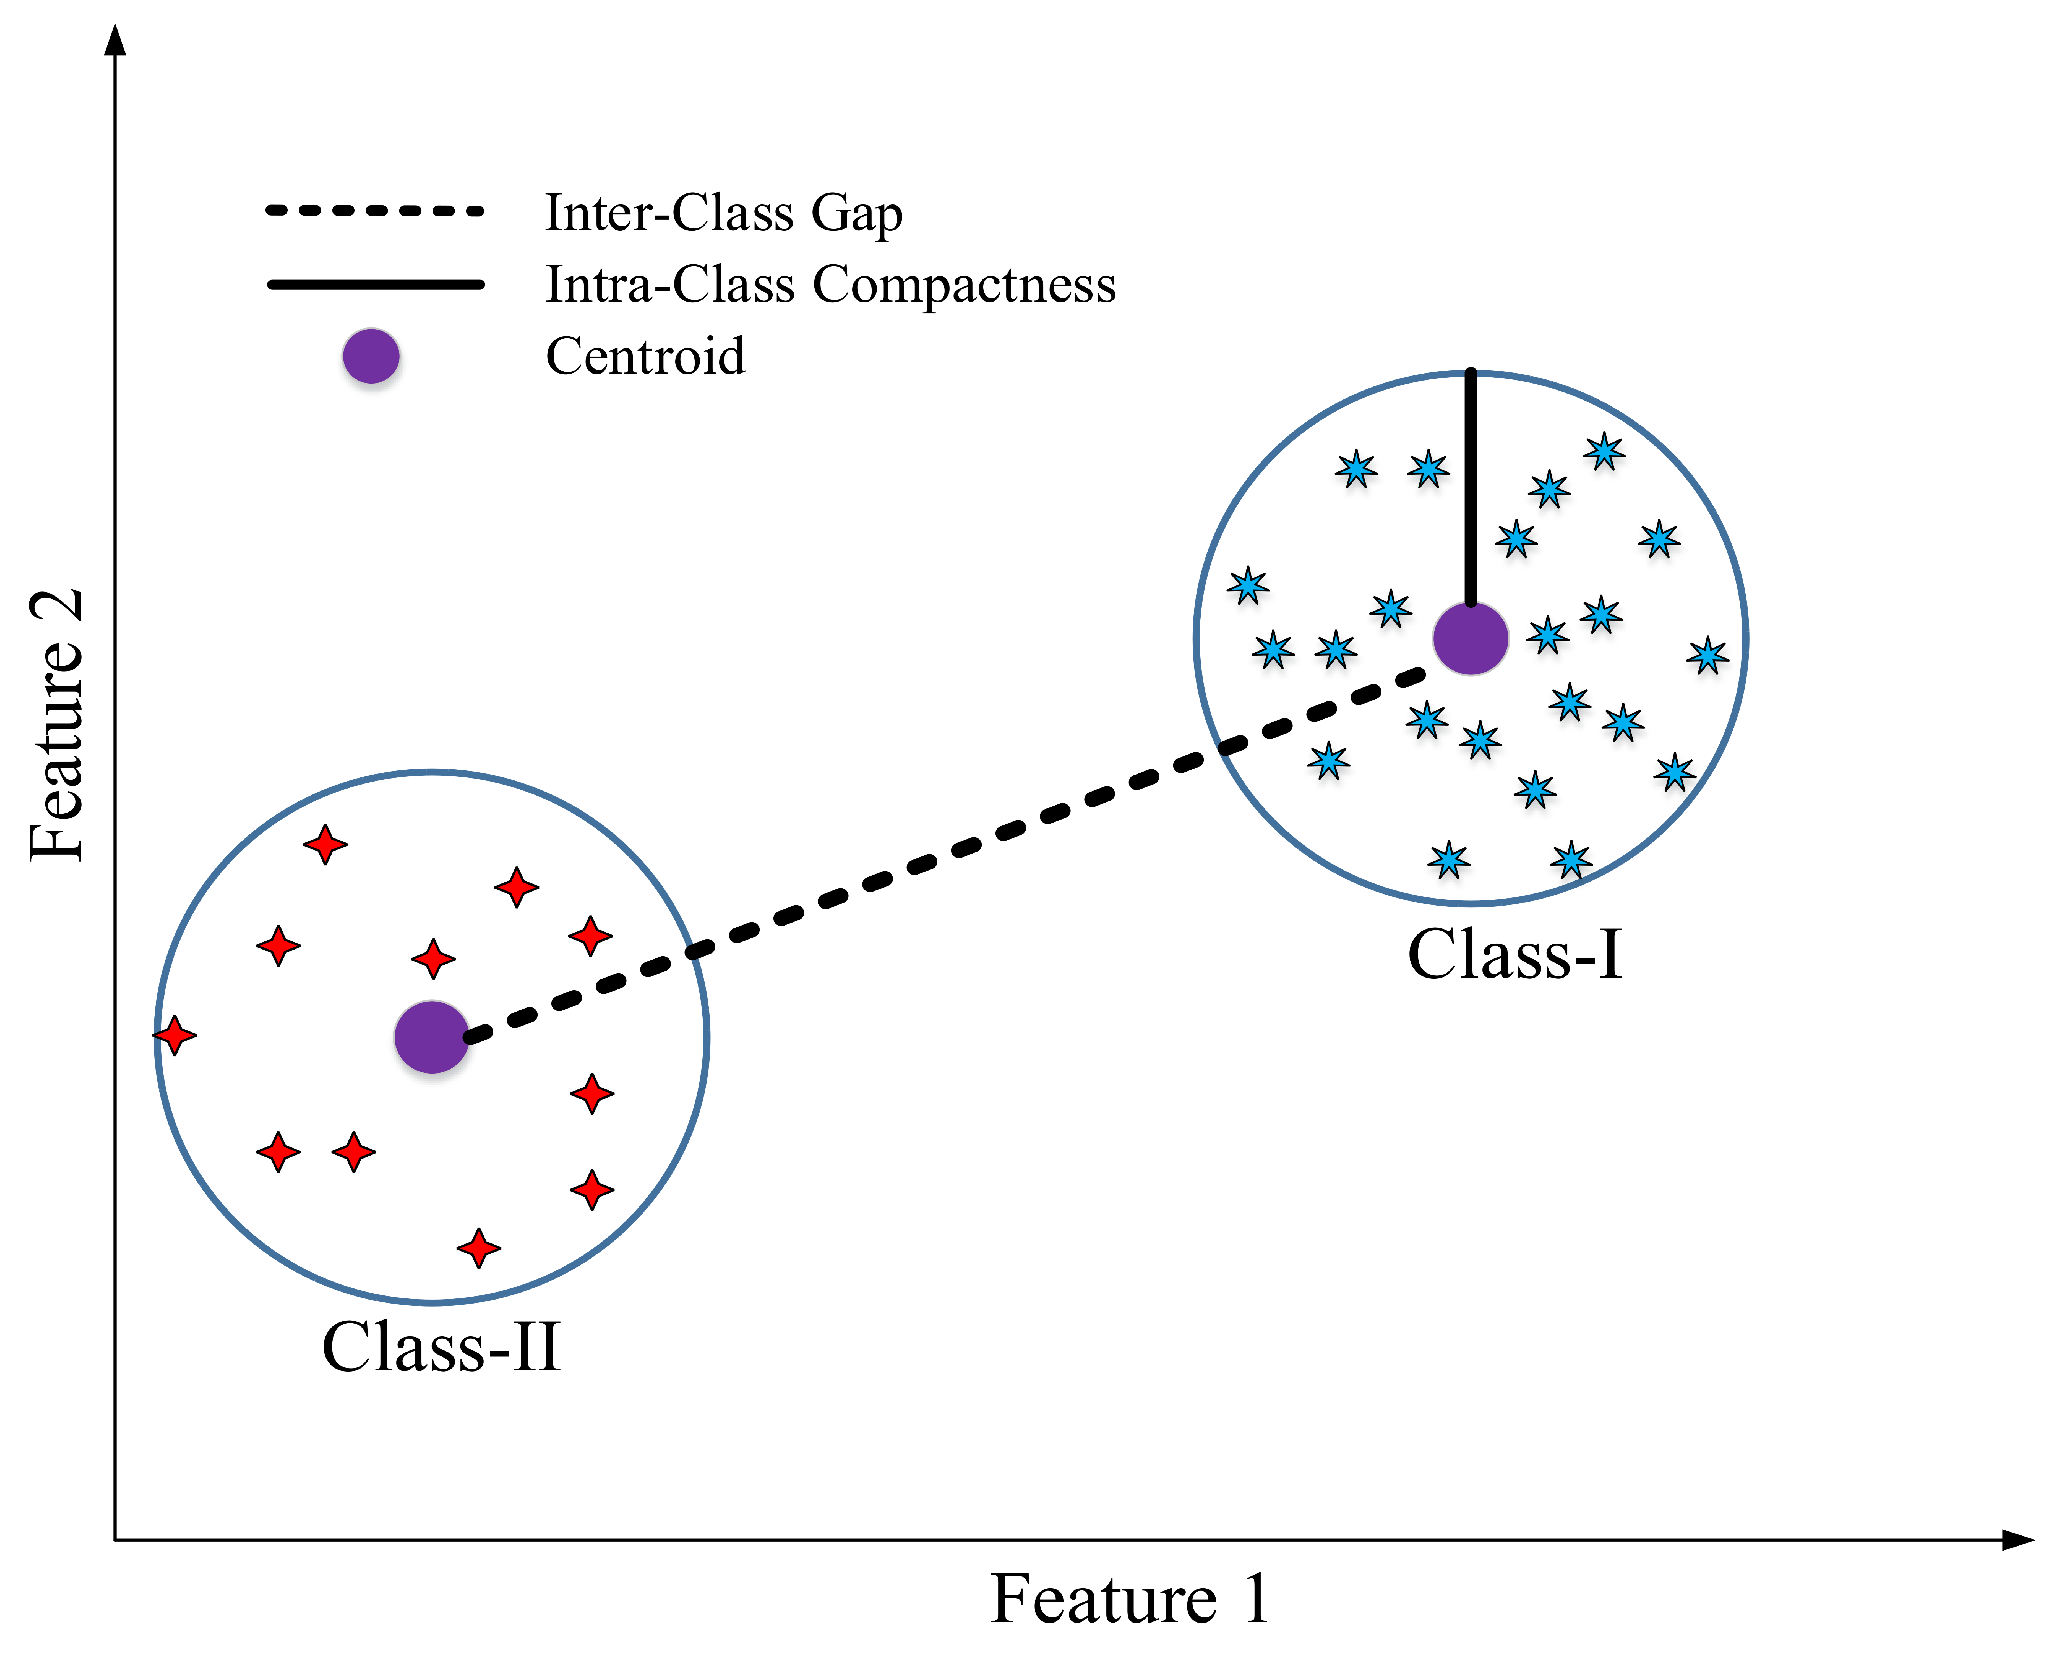
3.1. Dimensionality Reduction Using Genetic Algorithm-Based Feature Selection
- Inter-class separability: measures how well separated two different clusters are from each other.
- Intra-class compactness: indicates how well clustered the sample vectors are for a given class.
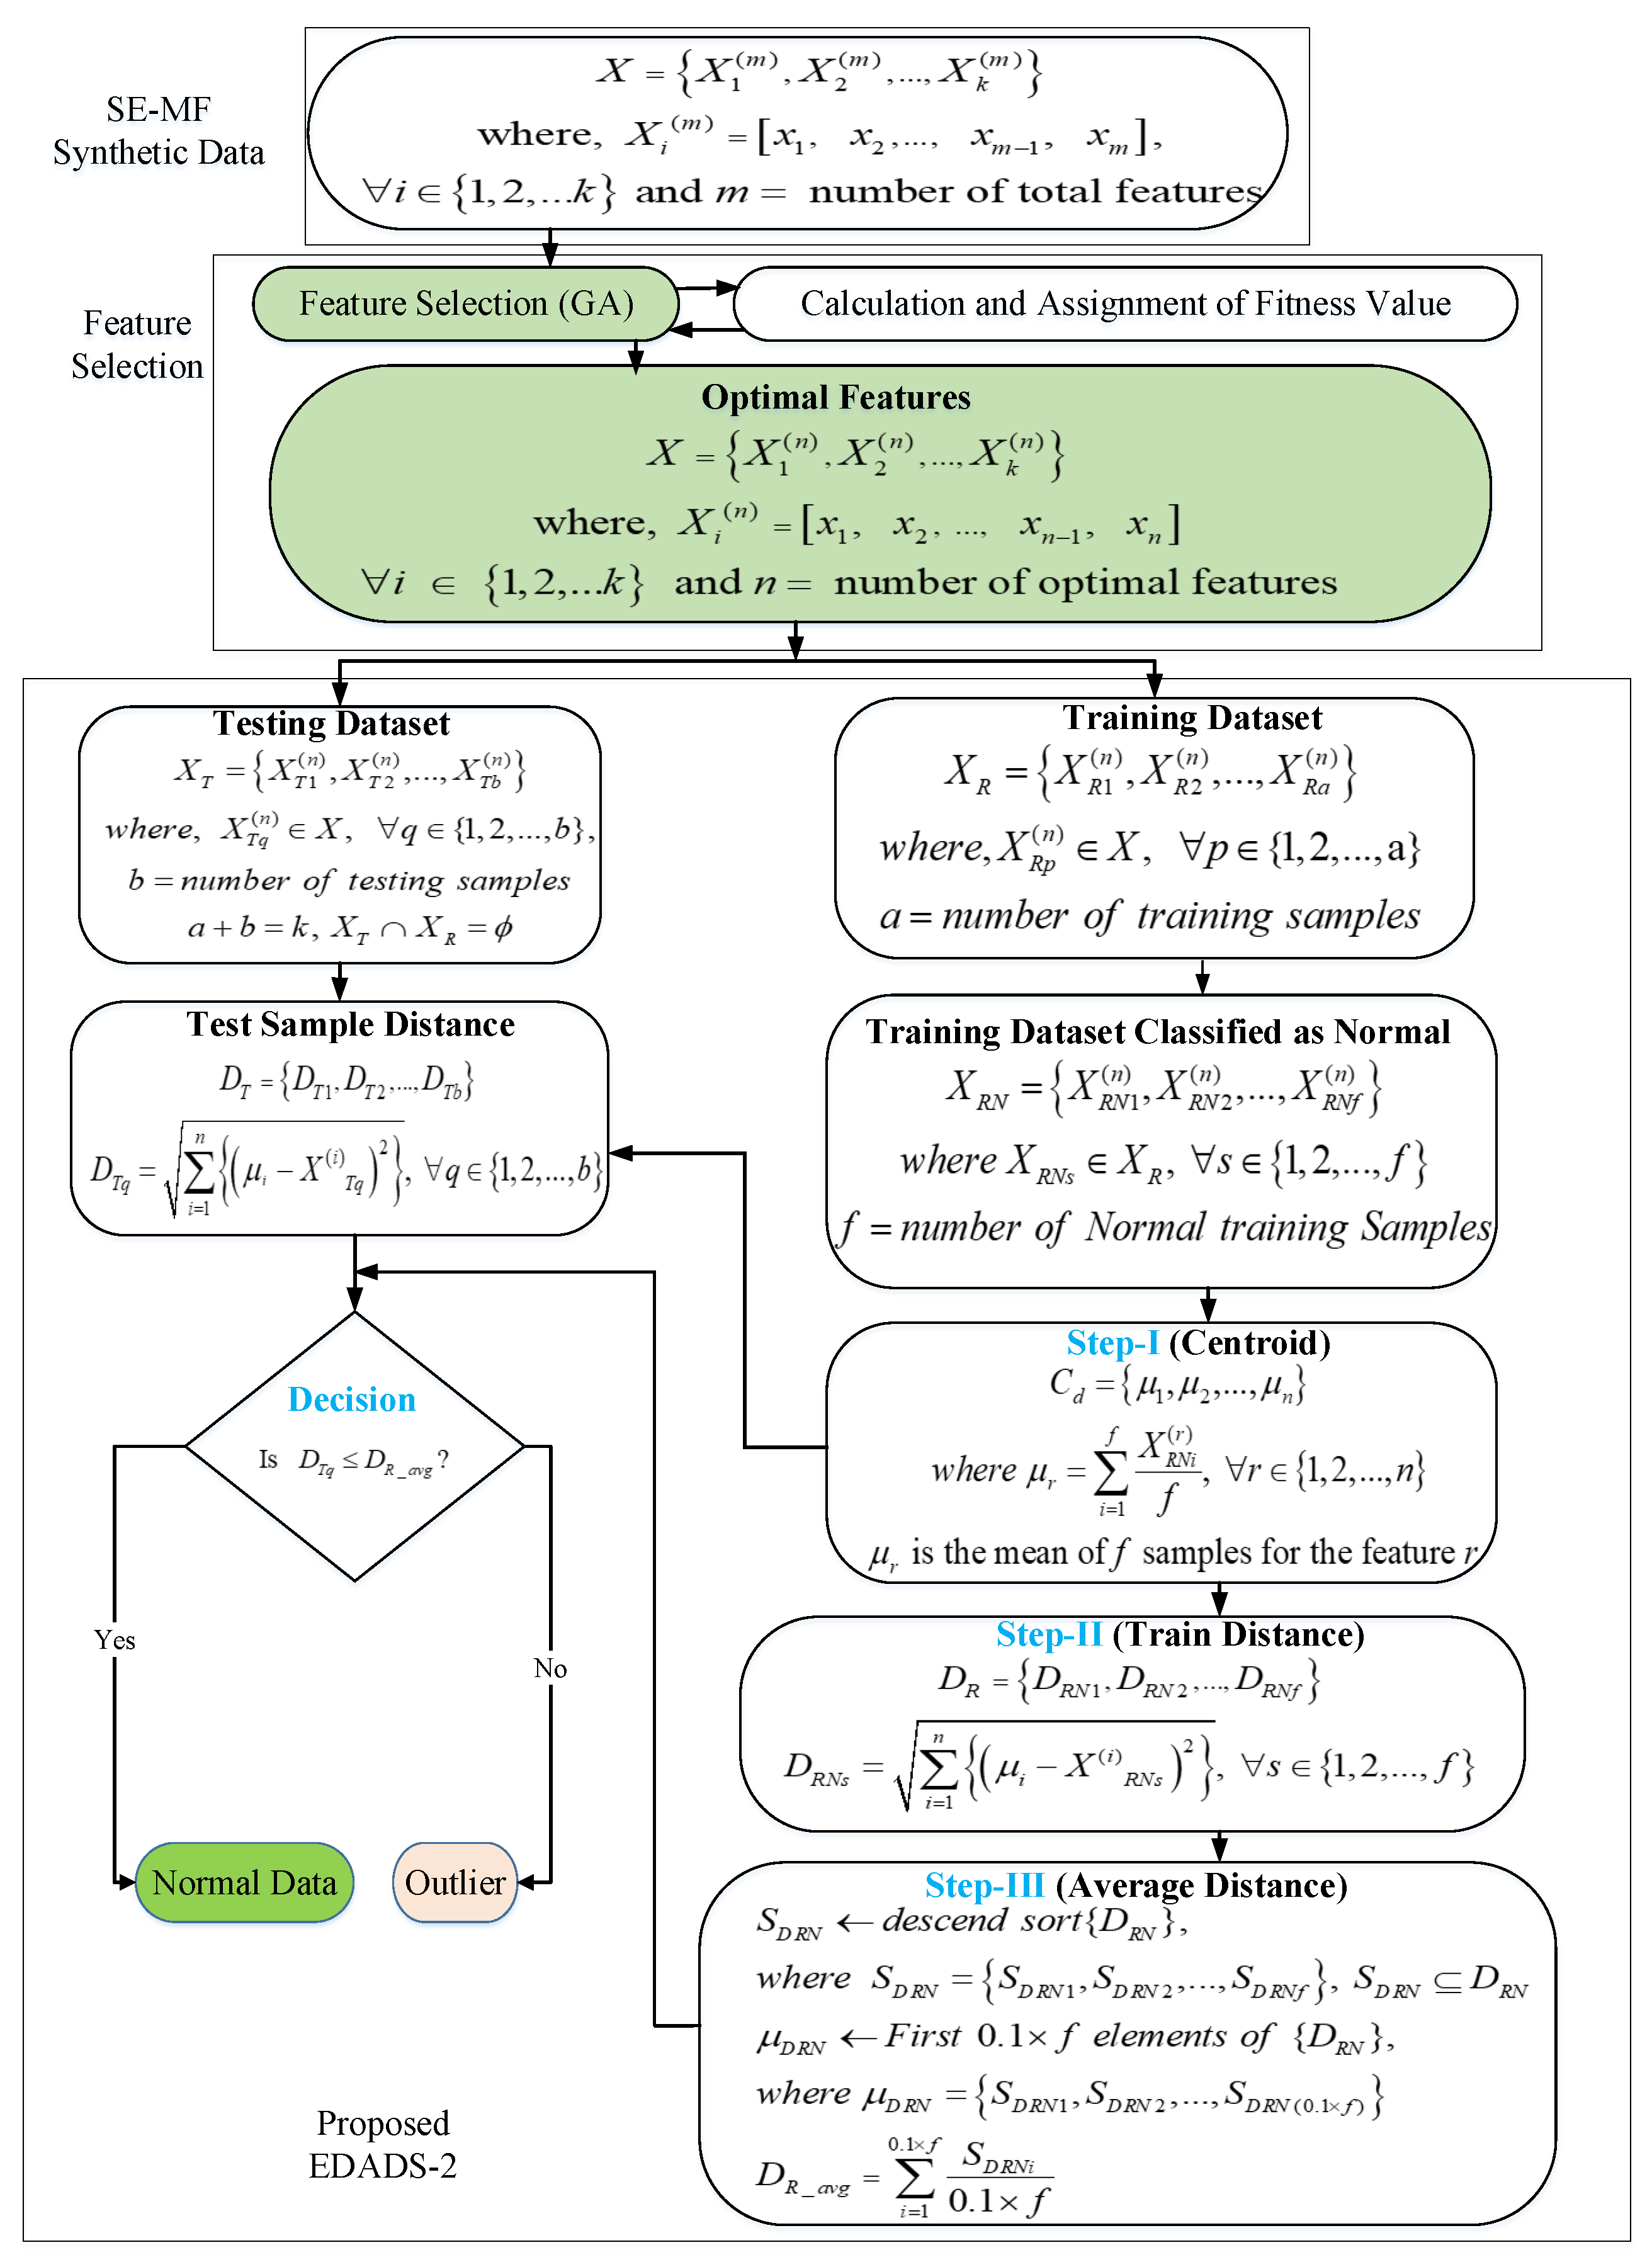
3.2. Euclidean Distance-Based Anomaly Detection Scheme 1
3.3. Euclidean Distance-Based Anomaly Detection Scheme 2
4. Experimental Results
4.1. GA-Based Feature Selection
4.2. 3D Representation of the Proposed EDADS-1 and EDADS-2
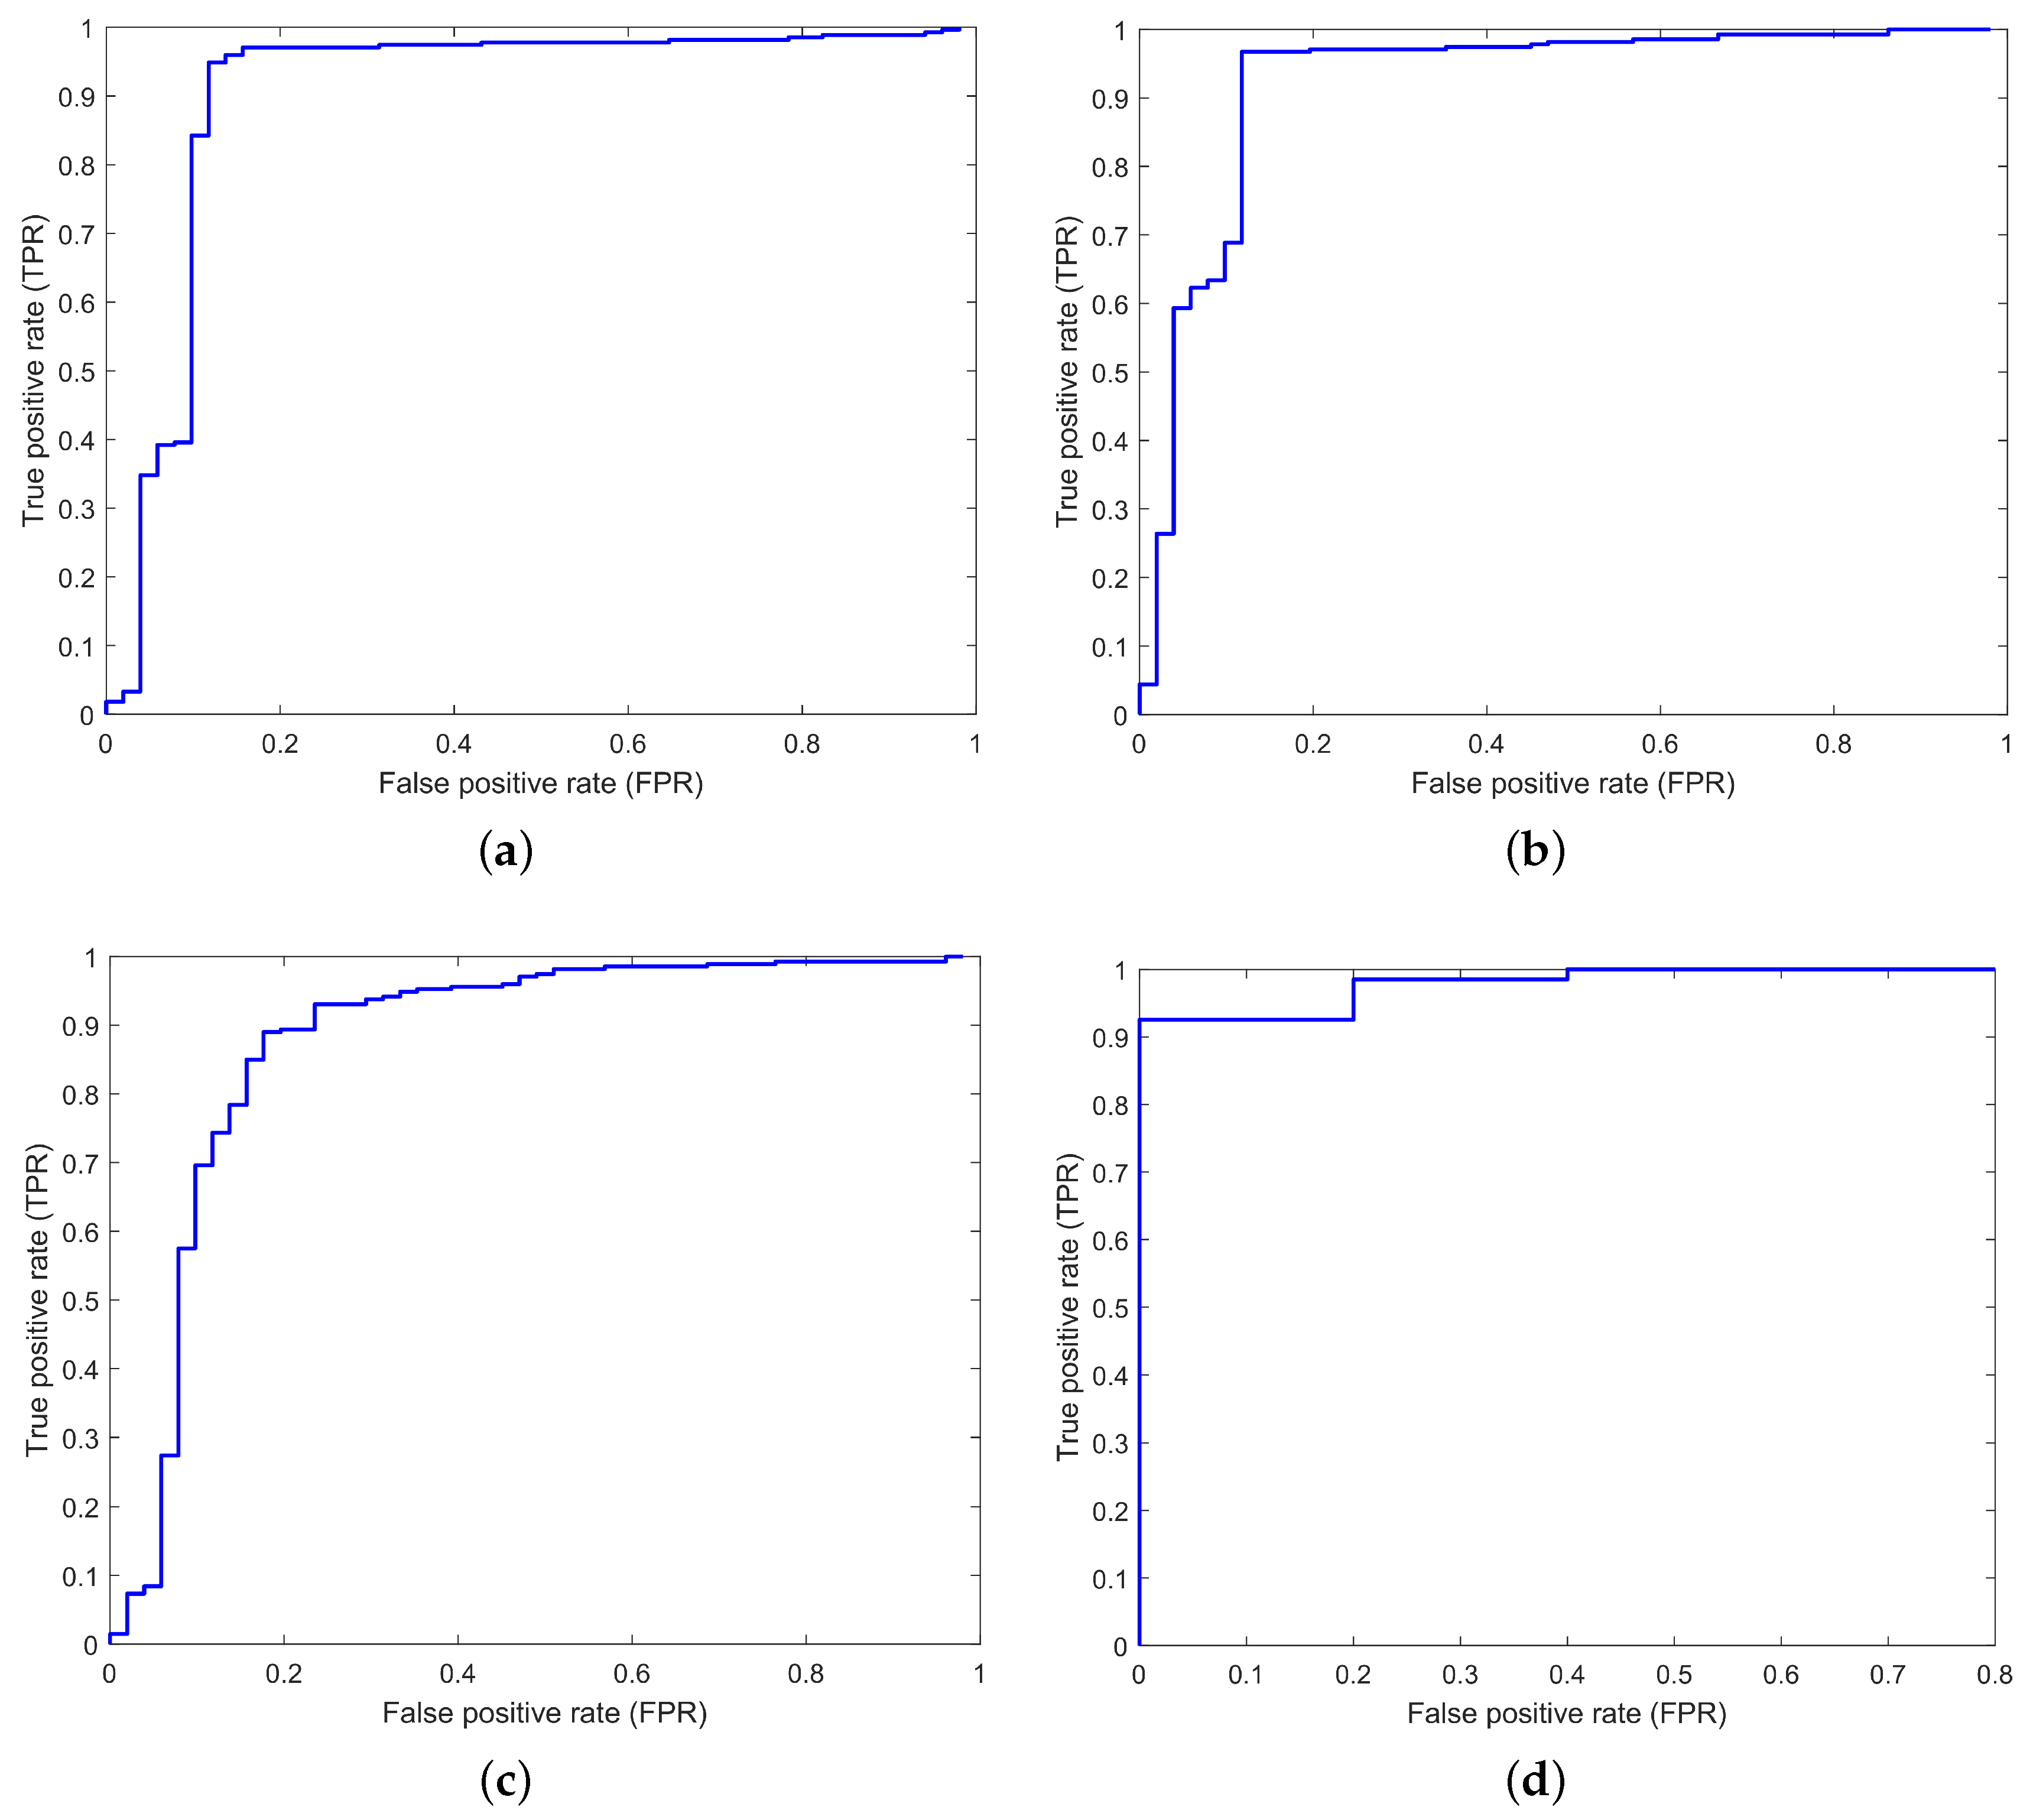
4.3. Receiver Operating Characteristic Curves
4.4. Accuracy
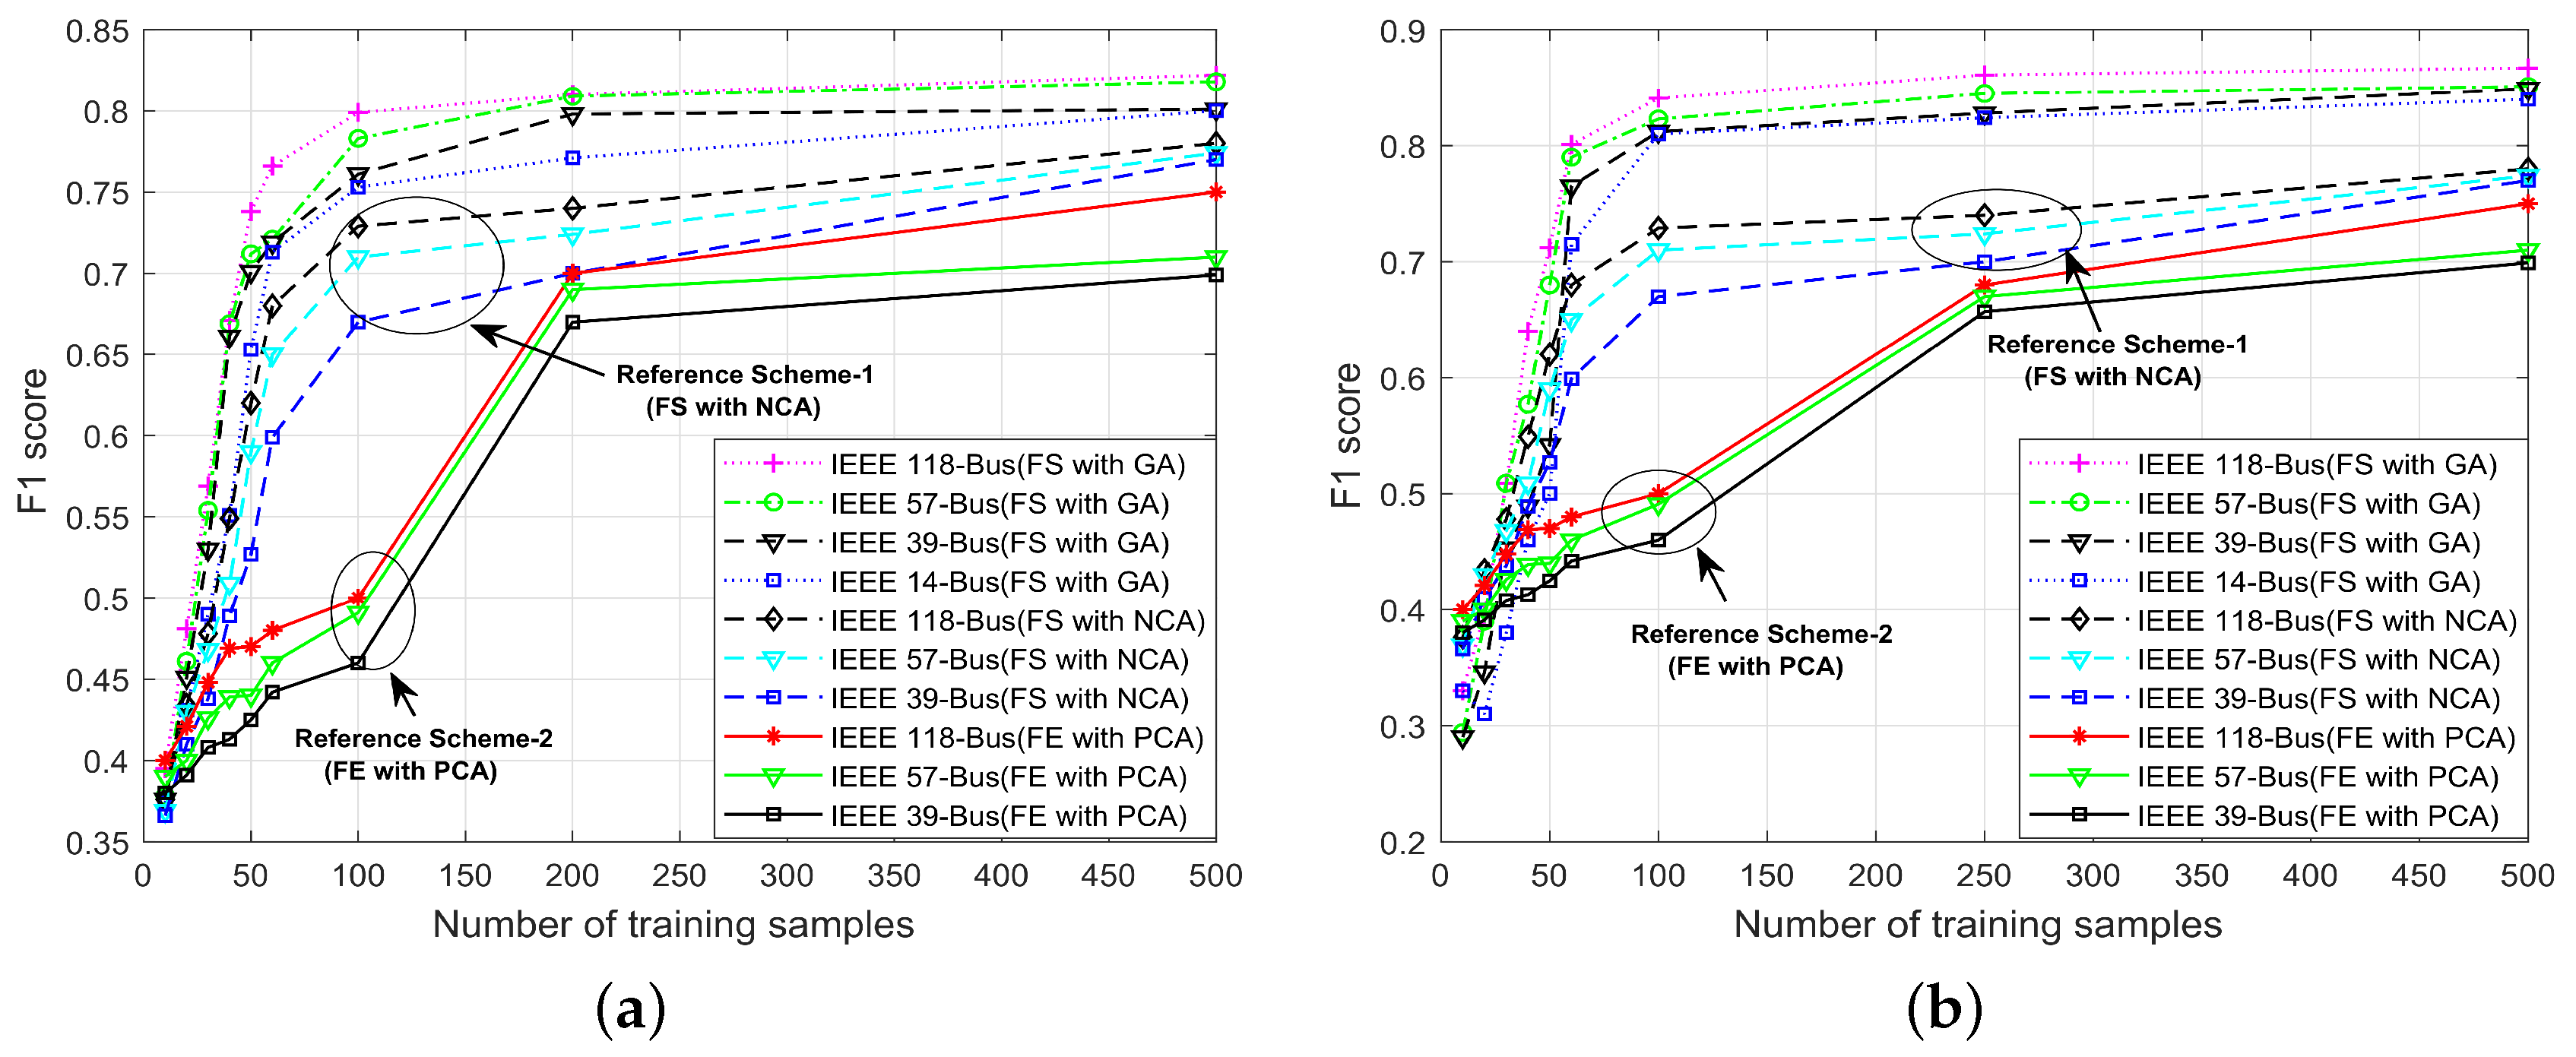
4.5. score
4.6. Execution Time Comparison
5. Conclusions
Author Contributions
Acknowledgments
Conflicts of Interest
References
- Liu, J.; Xiao, Y.; Li, S.; Liang, W.; Chen, C.P. Cyber security and privacy issues in smart grids. IEEE Commun. Surv. Tutor. 2012, 14, 981–997. [Google Scholar] [CrossRef]
- Mo, Y.; Kim, T.H.J.; Brancik, K.; Dickinson, D.; Lee, H.; Perrig, A.; Sinopoli, B. Cyber–physical security of a smart grid infrastructure. Proc. IEEE 2012, 100, 195–209. [Google Scholar]
- Yan, Y.; Qian, Y.; Sharif, H.; Tipper, D. A survey on cyber security for smart grid communications. IEEE Commun. Surv. Tutor. 2012, 14, 998–1010. [Google Scholar] [CrossRef]
- Deng, R.; Xiao, G.; Lu, R.; Liang, H.; Vasilakos, A.V. False data injection on state estimation in power systems—Attacks, impacts, and defense: A survey. IEEE Trans. Ind. Inform. 2017, 13, 411–423. [Google Scholar] [CrossRef]
- Ozay, M.; Esnaola, I.; Vural, F.T.Y.; Kulkarni, S.R.; Poor, H.V. Machine Learning Methods for Attack Detection in the Smart Grid. IEEE Trans. Neural Netw. Learn. Syst. 2016, 27, 1773–1786. [Google Scholar] [CrossRef] [PubMed]
- Singh, S.K.; Khanna, K.; Bose, R.; Panigrahi, B.K.; Joshi, A. Joint-Transformation-Based Detection of False Data Injection Attacks in Smart Grid. IEEE Trans. Ind. Inform. 2018, 14, 89–97. [Google Scholar] [CrossRef]
- Esmalifalak, M.; Liu, L.; Nguyen, N.; Zheng, R.; Han, Z. Detecting stealthy false data injection using machine learning in smart grid. In Proceedings of the 2013 IEEE Global Communications Conference, Atlanta, GA, USA, 9–13 December 2013. [Google Scholar]
- Bishop, C.M. Neural Networks for Pattern Recognition; Oxford University Press: Oxford, UK, 1995. [Google Scholar]
- Khan, F.; ur Rehman, A.; Arif, M.; Aftab, M.; Jadoon, B.K. A survey of communication technologies for smart grid connectivity. In Proceedings of the 2016 International Conference on Computing, Electronic and Electrical Engineering, Quetta, Pakistan, 11–12 April 2016; pp. 256–261. [Google Scholar]
- Gungor, V.C.; Lambert, F.C. A survey on communication networks for electric system automation. Comput. Netw. 2006, 50, 877–897. [Google Scholar] [CrossRef]
- Wang, W.; Xu, Y.; Khanna, M. A survey on the communication architectures in smart grid. Comput. Netw. 2011, 55, 3604–3629. [Google Scholar] [CrossRef]
- Emmanuel, M.; Rayudu, R. Communication technologies for smart grid applications: A survey. J. Netw. Comput. Appl. 2016, 74, 133–148. [Google Scholar] [CrossRef]
- Wang, W.; Lu, Z. Cyber security in the smart grid: Survey and challenges. Comput. Netw. 2013, 57, 1344–1371. [Google Scholar] [CrossRef]
- Bao, H.; Lu, R.; Li, B.; Deng, R. BLITHE: Behavior rule-based insider threat detection for smart grid. IEEE Internet Things J. 2016, 3, 190–205. [Google Scholar] [CrossRef]
- Iqbal, S.; Kiah, M.L.M.; Dhaghighi, B.; Hussain, M.; Khan, S.; Khan, M.K.; Choo, K.K.R. On cloud security attacks: A taxonomy and intrusion detection and prevention as a service. J. Netw. Comput. Appl. 2016, 74, 98–120. [Google Scholar] [CrossRef]
- Li, B.; Lu, R.; Wang, W.; Choo, K.K.R. DDOA: A dirichlet-based detection scheme for opportunistic attacks in smart grid cyber-physical system. IEEE Trans. Inf. Forensics Secur. 2016, 11, 2415–2425. [Google Scholar] [CrossRef]
- Liu, Y.; Ning, P.; Reiter, M.K. False data injection attacks against state estimation in electric power grids. ACM Trans. Inf. Syst. Secur. 2011, 14, 13. [Google Scholar] [CrossRef]
- Li, B.; Lu, R.; Wang, W.; Choo, K.K.R. Distributed host-based collaborative detection for false data injection attacks in smart grid cyber-physical system. J. Parallel Distrib. Comput. 2017, 103, 32–41. [Google Scholar] [CrossRef]
- Huang, Y.; Tang, J.; Cheng, Y.; Li, H.; Campbell, K.A.; Han, Z. Real-time detection of false data injection in smart grid networks: an adaptive CUSUM method and analysis. IEEE Syst. J. 2016, 10, 532–543. [Google Scholar] [CrossRef]
- Ferrag, M.A.; Maglaras, L.A.; Janicke, H.; Jiang, J. A survey on privacy-preserving schemes for smart grid communications. arXiv, 2016; arXiv:1611.07722. [Google Scholar]
- Baumeister, T. Literature Review on Smart Grid Cyber Security; Collaborative Software Development Laboratory at the University of Hawaii: Honolulu, HI, USA, 2010. [Google Scholar]
- Xie, L.; Mo, Y.; Sinopoli, B. Integrity data attacks in power market operations. IEEE Trans. Smart Grid 2011, 2, 659–666. [Google Scholar] [CrossRef]
- Esmalifalak, M.; Han, Z.; Song, L. Effect of stealthy bad data injection on network congestion in market based power system. In Proceedings of the 2012 IEEE Wireless Communications and Networking Conference, Shanghai, China, 1–4 April 2012; pp. 2468–2472. [Google Scholar]
- Dan, G.; Sandberg, H. Stealth attacks and protection schemes for state estimators in power systems. In Proceedings of the 2010 First IEEE International Conference on Smart Grid Communications, Gaithersburg, MD, USA, 4–6 October 2010; pp. 214–219. [Google Scholar]
- Kundur, P.; Balu, N.J.; Lauby, M.G. Power System Stability and Control; McGraw-Hill: New York, NK, USA, 1994; Volume 7. [Google Scholar]
- Gomez-Exposito, A.; Abur, A. Power System State Estimation: Theory and Implementation; CRC Press: Boca Raton, FL, USA, 2004. [Google Scholar]
- Casazza, J.; Casazza, J.; Delea, F. Understanding Electric Power Systems: An Overview of the Technology and the Marketplace; John Wiley & Sons: New York, NK, USA, 2003; Volume 13. [Google Scholar]
- Monticelli, A. State Estimation in Electric Power Systems: A Generalized Approach; Springer Science & Business Media: Berlin, Germany, 1999; Volume 507. [Google Scholar]
- Saeys, Y.; Inza, I.; Larrañaga, P. A review of feature selection techniques in bioinformatics. Bioinformatics 2007, 23, 2507–2517. [Google Scholar] [CrossRef] [PubMed]
- Min, S.H.; Lee, J.; Han, I. Hybrid genetic algorithms and support vector machines for bankruptcy prediction. Expert Syst. Appl. 2006, 31, 652–660. [Google Scholar] [CrossRef]
- Demel, M.A.; Janecek, A.G.; Thai, K.M.; Ecker, G.F.; Gansterer, W.N. Predictive QSAR models for polyspecific drug targets: The importance of feature selection. Curr. Comput.-Aided Drug Des. 2008, 4, 91–110. [Google Scholar] [CrossRef]
- Ma, S.; Song, X.; Huang, J. Supervised group Lasso with applications to microarray data analysis. BMC Bioinform. 2007, 8, 60. [Google Scholar] [CrossRef] [PubMed]
- Ambroise, C.; McLachlan, G.J. Selection bias in gene extraction on the basis of microarray gene-expression data. Proc. Natl. Acad. Sci. USA 2002, 99, 6562–6566. [Google Scholar] [CrossRef] [PubMed]
- Jafari, P.; Azuaje, F. An assessment of recently published gene expression data analyses: Reporting experimental design and statistical factors. BMC Med. Inform. Decis. Making 2006, 6, 27. [Google Scholar] [CrossRef] [PubMed]
- Hruschka, E.R.; Hruschka, E.R.; Ebecken, N.F. Feature selection by Bayesian networks. In Conference of the Canadian Society for Computational Studies of Intelligence; Springer: Berlin, Germany, 2004; pp. 370–379. [Google Scholar]
- Blum, A.L.; Langley, P. Selection of relevant features and examples in machine learning. Artif. Intell. 1997, 97, 245–271. [Google Scholar] [CrossRef]
- Chandala, V.; Banerjee, A.; Kumar, V. Anomaly Detection: A Survey, ACM Computing Surveys; University of Minnesota: Minneapolis, MN, USA, 2009. [Google Scholar]
- Illinois Center for a Smarter Electric Grid (ICSEG). Available online: http://icseg.iti.illinois.edu/ (accessed on 4 February 2018).
- Zimmerman, R.D.; Murillo-Sánchez, C.E.; Thomas, R.J. MATPOWER: Steady-state operations, planning, and analysis tools for power systems research and education. IEEE Trans. Power Syst. 2011, 26, 12–19. [Google Scholar] [CrossRef]


| Abbreviation | Term | Abbreviation | Term |
|---|---|---|---|
| AD | anomaly detection | GA | genetic algorithm |
| AGC | auto-generation control | MF | measurement features |
| BDD | bad-data detection | NCA | neighborhood component analysis |
| CCD | covert cyber deception | OPF | optimal power flow |
| CSD | cyber stealthy deception | PCA | principle component analysis |
| EC | evolutionary computation | PCC | power control center |
| ED | Euclidean distance | PSO | particle swarm optimization |
| EMS | energy management system | ROC | receiver operating characteristic |
| FDI | false data injection | RTU | remote terminal unit |
| FE | feature extraction | SE | state estimation |
| FS | feature selection | SG | smart grid |
| Standard IEEE Bus System | States | Features | Selected Features |
|---|---|---|---|
| 14-bus | 13 | 53 | 23 |
| 39-bus | 38 | 130 | 61 |
| 57-bus | 56 | 216 | 111 |
| 118-bus | 117 | 489 | 233 |
| Standard IEEE Bus System | Proposed EDADS-1 (FS + Detection) | Proposed EDADS-2 (FS + Detection) | FE with PCA FE + Detection | FS with NCA |
|---|---|---|---|---|
| 14 | 0.1149 (s) | 0.1147 (s) | 2.0134 (s) | 0.3125 (s) |
| 39 | 0.1316 (s) | 0.1299 (s) | 4.3417 (s) | 0.5313 (s) |
| 57 | 0.2322 (s) | 0.2317 (s) | 7.5121 (s) | 0.8013 (s) |
| 118 | 0.5179 (s) | 0.5177 (s) | 10.7925 (s) | 1.0130 (s) |
© 2018 by the authors. Licensee MDPI, Basel, Switzerland. This article is an open access article distributed under the terms and conditions of the Creative Commons Attribution (CC BY) license (http://creativecommons.org/licenses/by/4.0/).
Share and Cite
Ahmed, S.; Lee, Y.; Hyun, S.-H.; Koo, I. Covert Cyber Assault Detection in Smart Grid Networks Utilizing Feature Selection and Euclidean Distance-Based Machine Learning. Appl. Sci. 2018, 8, 772. https://doi.org/10.3390/app8050772
Ahmed S, Lee Y, Hyun S-H, Koo I. Covert Cyber Assault Detection in Smart Grid Networks Utilizing Feature Selection and Euclidean Distance-Based Machine Learning. Applied Sciences. 2018; 8(5):772. https://doi.org/10.3390/app8050772
Chicago/Turabian StyleAhmed, Saeed, YoungDoo Lee, Seung-Ho Hyun, and Insoo Koo. 2018. "Covert Cyber Assault Detection in Smart Grid Networks Utilizing Feature Selection and Euclidean Distance-Based Machine Learning" Applied Sciences 8, no. 5: 772. https://doi.org/10.3390/app8050772
APA StyleAhmed, S., Lee, Y., Hyun, S.-H., & Koo, I. (2018). Covert Cyber Assault Detection in Smart Grid Networks Utilizing Feature Selection and Euclidean Distance-Based Machine Learning. Applied Sciences, 8(5), 772. https://doi.org/10.3390/app8050772