Article

A Hybrid Ultrasonic Guided Wave-Fiber Optic System for Flaw Detection in Pipe

1
FBS, Inc. dba Guidedwave, 450 Rolling Ridge Drive, Bellefonte, PA 16823, USA
2
Department of Earth and Engineering Sciences, Pennsylvania State University, University Park, PA 16802, USA
3
Department of Electrical and Computer Engineering, Michigan State University, East Lansing, MI 48824-1226, USA
*
Author to whom correspondence should be addressed.
Appl. Sci. 2018, 8(5), 727; https://doi.org/10.3390/app8050727
Submission received: 11 April 2018 / Revised: 30 April 2018 / Accepted: 2 May 2018 / Published: 5 May 2018
(This article belongs to the Special Issue Ultrasonic Guided Waves)

Abstract

:
The work presented in this paper shows that Fiber Bragg Grating (FBG) optical fiber sensors can potentially be used as receivers in a long-range guided wave torsional-mode pipe inspection system. Benefits over the conventional pulse-echo method arise due to reduced total travel distance of the ultrasonic guided wave reflections, since reflections from defects and structural features do not need to propagate a full round trip back to the transmitting collar. This is especially important in pipe configurations with high attenuation, such as coated and buried pipelines. The use of FBGs as receivers instead of conventional piezoelectric or magnetostrictive elements also significantly reduces cabling, since multiple FBG receivers can be placed along a single optical fiber which has a diameter on the order of only around 100 μm. The basic approach and sample results are presented in the paper. Additionally, a brief overview of some topics in ultrasonic guided waves is presented as a background to understand the inspection problem presented here.

1. Introduction

Guided wave ultrasound is increasingly being used to solve inspection problems in a wide variety of applications. This is because guided waves can be used to inspect over long distances from a single probe position, offer complete volumetric coverage, and can inspect hidden/inaccessible structures, such as those under water, coatings, insulation, and soil. Before discussing the merger of ultrasonic guided waves with fiber optic technology, the major topic in this paper, a brief review of some of our first accomplishments on various topics in ultrasonic guided waves is presented. This illustrates the background leading to the topic of this paper.
Two textbooks on the subject of wave mechanics fundamentals with emphasis on guided waves for nondestructive testing (NDT) and structural health monitoring (SHM) are presented by Rose, [1] 1999, [2] 2014. Some selected developments over the last few decades include the following. The value of computing and selecting specific wave structures from the phase velocity dispersion curves was initially pointed out by Ditri, Rose, and Chen [3] 1991, where defects close to a surface were found with wave structure having lots of energy near the surface. Since then paying attention to wave structure has led to solutions for many important problems in NDT and SHM. Pilarski, Ditri, and Rose in [4] 1993, demonstrated the ability to locate wave structure profiles with in-plane displacement on the surface of a waveguide, which has played a significant role in ice detection and the impact of water loaded surfaces on many NDT and SHM problems. A variety of problems in the aircraft industry are covered by Rose and Soley [5] 2000. Such topics as lap joint, tear strap and honeycomb inspection are discussed. A method of focusing ultrasonic guided waves in pipe was introduced by Rose, Sun, Mudge, and Avioli [6] 2003. The phased array focusing approach improves detection sensitivity, axial and lateral resolution and even penetration power. The ability to generate dispersion curves for structures having an arbitrary cross section was introduced by Hayashi, Song, and Rose [7] 2003. Many new applications with guided waves became possible and in particular a breakthrough in treating guided wave propagation in rails. Guided wave tomography concepts and several sample problems were coved by Gao, Shi, and Rose [8] 2005. The critical problem of rail inspection under shelling for transverse crack detection in the rail head along with possibilities of web and base defect detection was presented by Lee, Rose, and Cho [9] 2008. Adhesive bondline inspection breakthroughs was reported for certain substrate systems by Puthillath and Rose [10] 2010. Utilization of magnetostrictive technology advancements for the generation and utilization of guided waves was reported by Van Velsor, Royer, Owens, and Rose [11] 2013. Guided wave mode and frequency tuning and optimization is discussed in Philtron and Rose [12] 2014, making it possible to find defects in a variety of different structures more completely. A phased array system for plate inspection was developed and reported by Rose, Borigo, Owens, and Reese [13] 2017. This technique is responsible for amazingly fast inspection of corrosion type defects in large plate-like structures employing radar type circumferential or sector scans. Other NDT applications for guided waves, for example, include oil-tank weld detection using EMAT-generated shear-horizontal guided waves [14] 2017, fundamental torsional mode detection of angled cut flaws [15] 2016, and liquid level displacement measurements using magnetostrictive sensors [16] 2017.
Our background in ultrasonic guided waves thus prepared us for a merger with concepts presented by Perez, Cui, and Udd [17] 2001. Perez et al. [17] showed the possibility of ultrasonic wave interaction with fiber Bragg gratings (FBG) in an optical fiber. To date, FBG ultrasonic sensors have been extensively investigated [18] 2008. The use of the fundamental shear horizontal mode in plates and torsional mode in pipes is of interest for ultrasonic inspection due to the nondispersive nature and insensitivity to water loading that these modes offer. However, the majority of FBG ultrasonic sensors have been used to detect Lamb-type guided waves which are quite different from the shear horizontal (SH) waves in plates and torsional waves in pipes, there are only a few papers experimentally describing the usage of FBG sensors for SH wave detection [19,20,21] but with inclusive results. The mechanism governing the interaction of an FBG sensor with SH waves in plates has not been thoroughly reported until our work was recently published by Liu, Philtron, Zhu, Rose, and Han [22] 2018. Our results in [22] confirm both theoretically and experimentally the feasibility of using FBG sensors for SH wave detection with a maximum reception efficiency around 45° incidence, which shows a completely different angular dependence in comparison to Lamb-type wave detection.
In this current paper, taking advantage of the remote sensing (attenuation of the optical signal in an optical fiber is ultralow) and multiplexing capability of FBG sensors, the work is expanded upon our previous work in [22] to demonstrate how the technique could be used to extend the range in medium and long-range pipe inspection applications using torsional guided waves. The use of the fundamental shear horizontal mode in plates and torsional mode in pipes is of interest for ultrasonic inspection due to the nondispersive nature and insensitivity to water loading that these modes offer. Since long-range guided wave pipe inspection is critical and taking place all over the world on thousands of miles of pipe, the work reported in this paper was intended to investigate if improvements in inspection reliability and cost reduction would be possible with a hybrid ultrasonic guided wave-FBG approach. Some earlier work on this subject was reported by Hu, Zhao, and Li [23] 2012 and Ray, Srinivasan, Balasubramaniam, and Rajagopal [24] 2017. Hu et al. [23] 2012 performed a modeling study suggesting feasibility to integrate optical fiber sensors into pipeline inspection using the L(0,2) mode, but an experiment was not reported. Ray et al. [24] 2017 describe the use of fiber optic sensors to detect changes in the guided wave features of the L(0,2) mode to assess cross sectional irregularities such as pipe eccentricity. Obviously, their work does not address torsional wave detection. The work reported in this paper will illustrate how FBG receivers could be implemented as part of a hybrid ultrasonic pipe inspection technology using torsional guided waves.

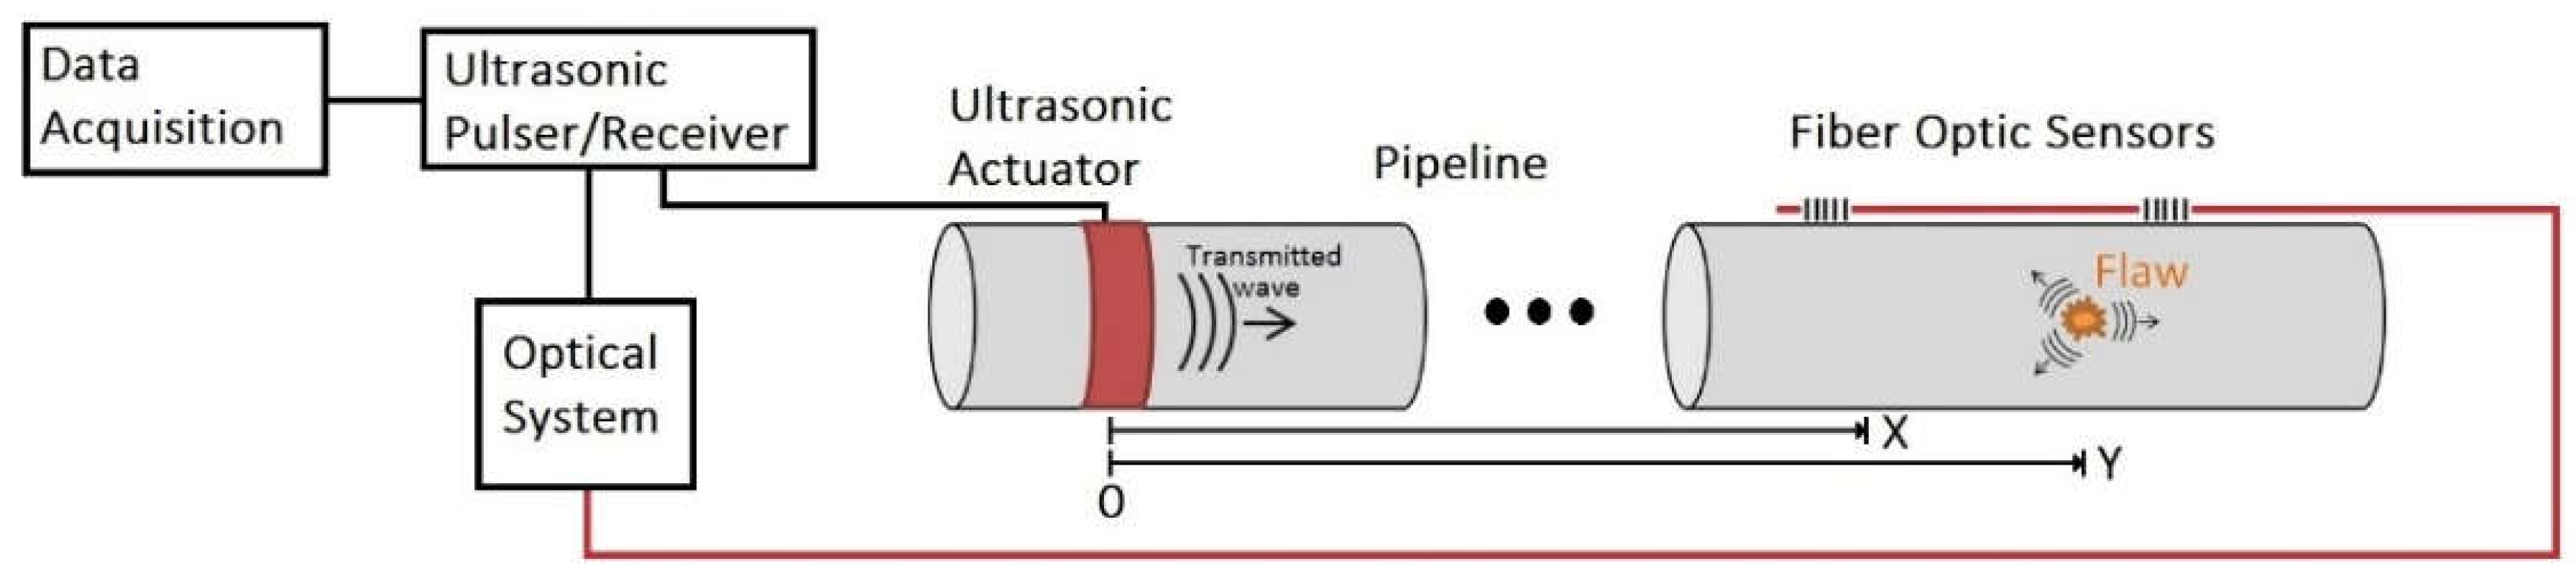
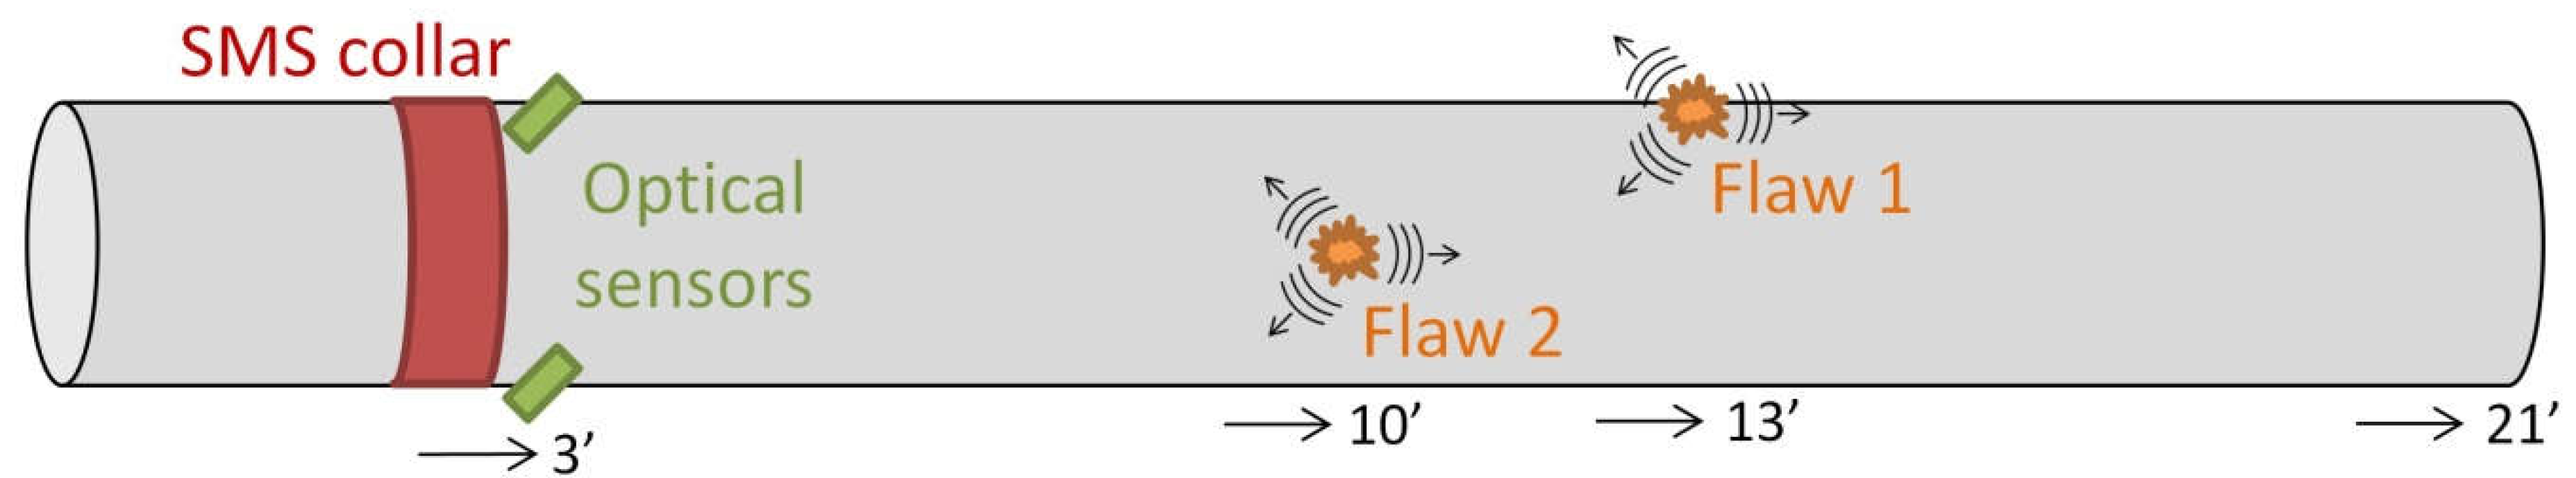
2. Hybrid Ultrasonic—Fiber Optic System Concept

Commercially available systems for ultrasonic guided wave pipe inspection can quickly and reliably scan large sections of pipeline for flaws. However, there are certain situations where increased range of an inspection system is desired. This may occur in such situations as for highly attenuative pipe, such as buried, coated, or generally corroded lines, or in situations where access is limited. In these situations, use of an alternate method, such as fiber optic sensors, in conjunction with conventional ultrasonic guided wave inspection can be beneficial to increase inspection range into the non-inspected region. Fiber optic sensors may be attached to a pipeline during installation and then left in place for use during periodic inspections. The fiber optic sensors could be placed near the end of the range of a conventional pulse-echo inspection system, allowing for increased range by as much as 50%, if the optical system has a similar signal-to-noise ratio. This can be achieved because the reflected wave energy from a flaw need not travel the full return distance to the actuator, but only back to the remote fiber optic sensor to be detected.
This concept is illustrated in Figure 1. The conventional ultrasonic collar generates guided waves in the pipe at location 0. Remote fiber optic sensor(s) are placed at a distance X from the collar, which should be near, but not beyond, the effective inspection range of the conventional system. The inspection range of the hybrid system is then extended such that a flaw at a distance Y from the collar is now detectable from the original collar location through use of the fiber optic sensor. Note that the optical system could be collocated with the ultrasonic equipment, or not. One key difference between optical fiber and conventional metal cable carrying ultrasonic signals is that the loss of the optical signal is very low in comparison.
Consider an example coated pipeline with high attenuation. It is possible that a conventional inspection distance is only 50 feet. Flaws beyond 50 feet from the collar are not detected because potential flaw reflections are hidden within the noise. However, if a fiber optic sensor was installed near the 50-foot location, the inspection range could be increased by 25 feet, to a total of 75 feet. Assuming constant attenuation along the pipe, the ultrasonic wave energy would decrease the same amount traveling from 50 feet back to the collar, or from 50 to 75 feet and back to the fiber optic sensor. If the fiber optic sensor has a similar signal-to-noise ratio as the ultrasonic collar, the effective inspection range can be increased by as much as 50%. The fiber optic sensors could be attached and left in place (under coatings) during pipeline installation, saving significant time and cost from inspection and preparation costs to expose the pipe for collar application, particularly for the case where access must be dug in the middle of a buried section of pipeline. Note that the use of a hybrid system could be costly due to the need for extra components to perform optical sensing such as the laser, controller, photodetector, etc. However, in certain cases where it can achieve improved performance, such as in cases where increased inspection range provides inspection of previously un-inspectable or expensive or hard-to-inspect areas, use of a hybrid system will be worthwhile. Future developments will also lead to reduced cost of optical components. Generally, it is expected that the fiber sensors will be used in a similar method as for conventional piezoelectric and magnetostrictive sensors, i.e., to detect reflections from flaws. Although it may be possible to detect flaws between a sender and receiver, flaw detection is much easier and more straight forward when analyzing a reflected wave signal from a flaw.
Note also that additional SMS collar(s) could be installed at location X, etc., to extend the inspection range, but these collars are generally more expensive than optical fiber, would require many, long cables (typically 16, one per channel) with a remotely used data acquisition system, and there may not physically be access space to install these collars. The use of fiber optic sensors also allows for many sensors along a single optical cable.

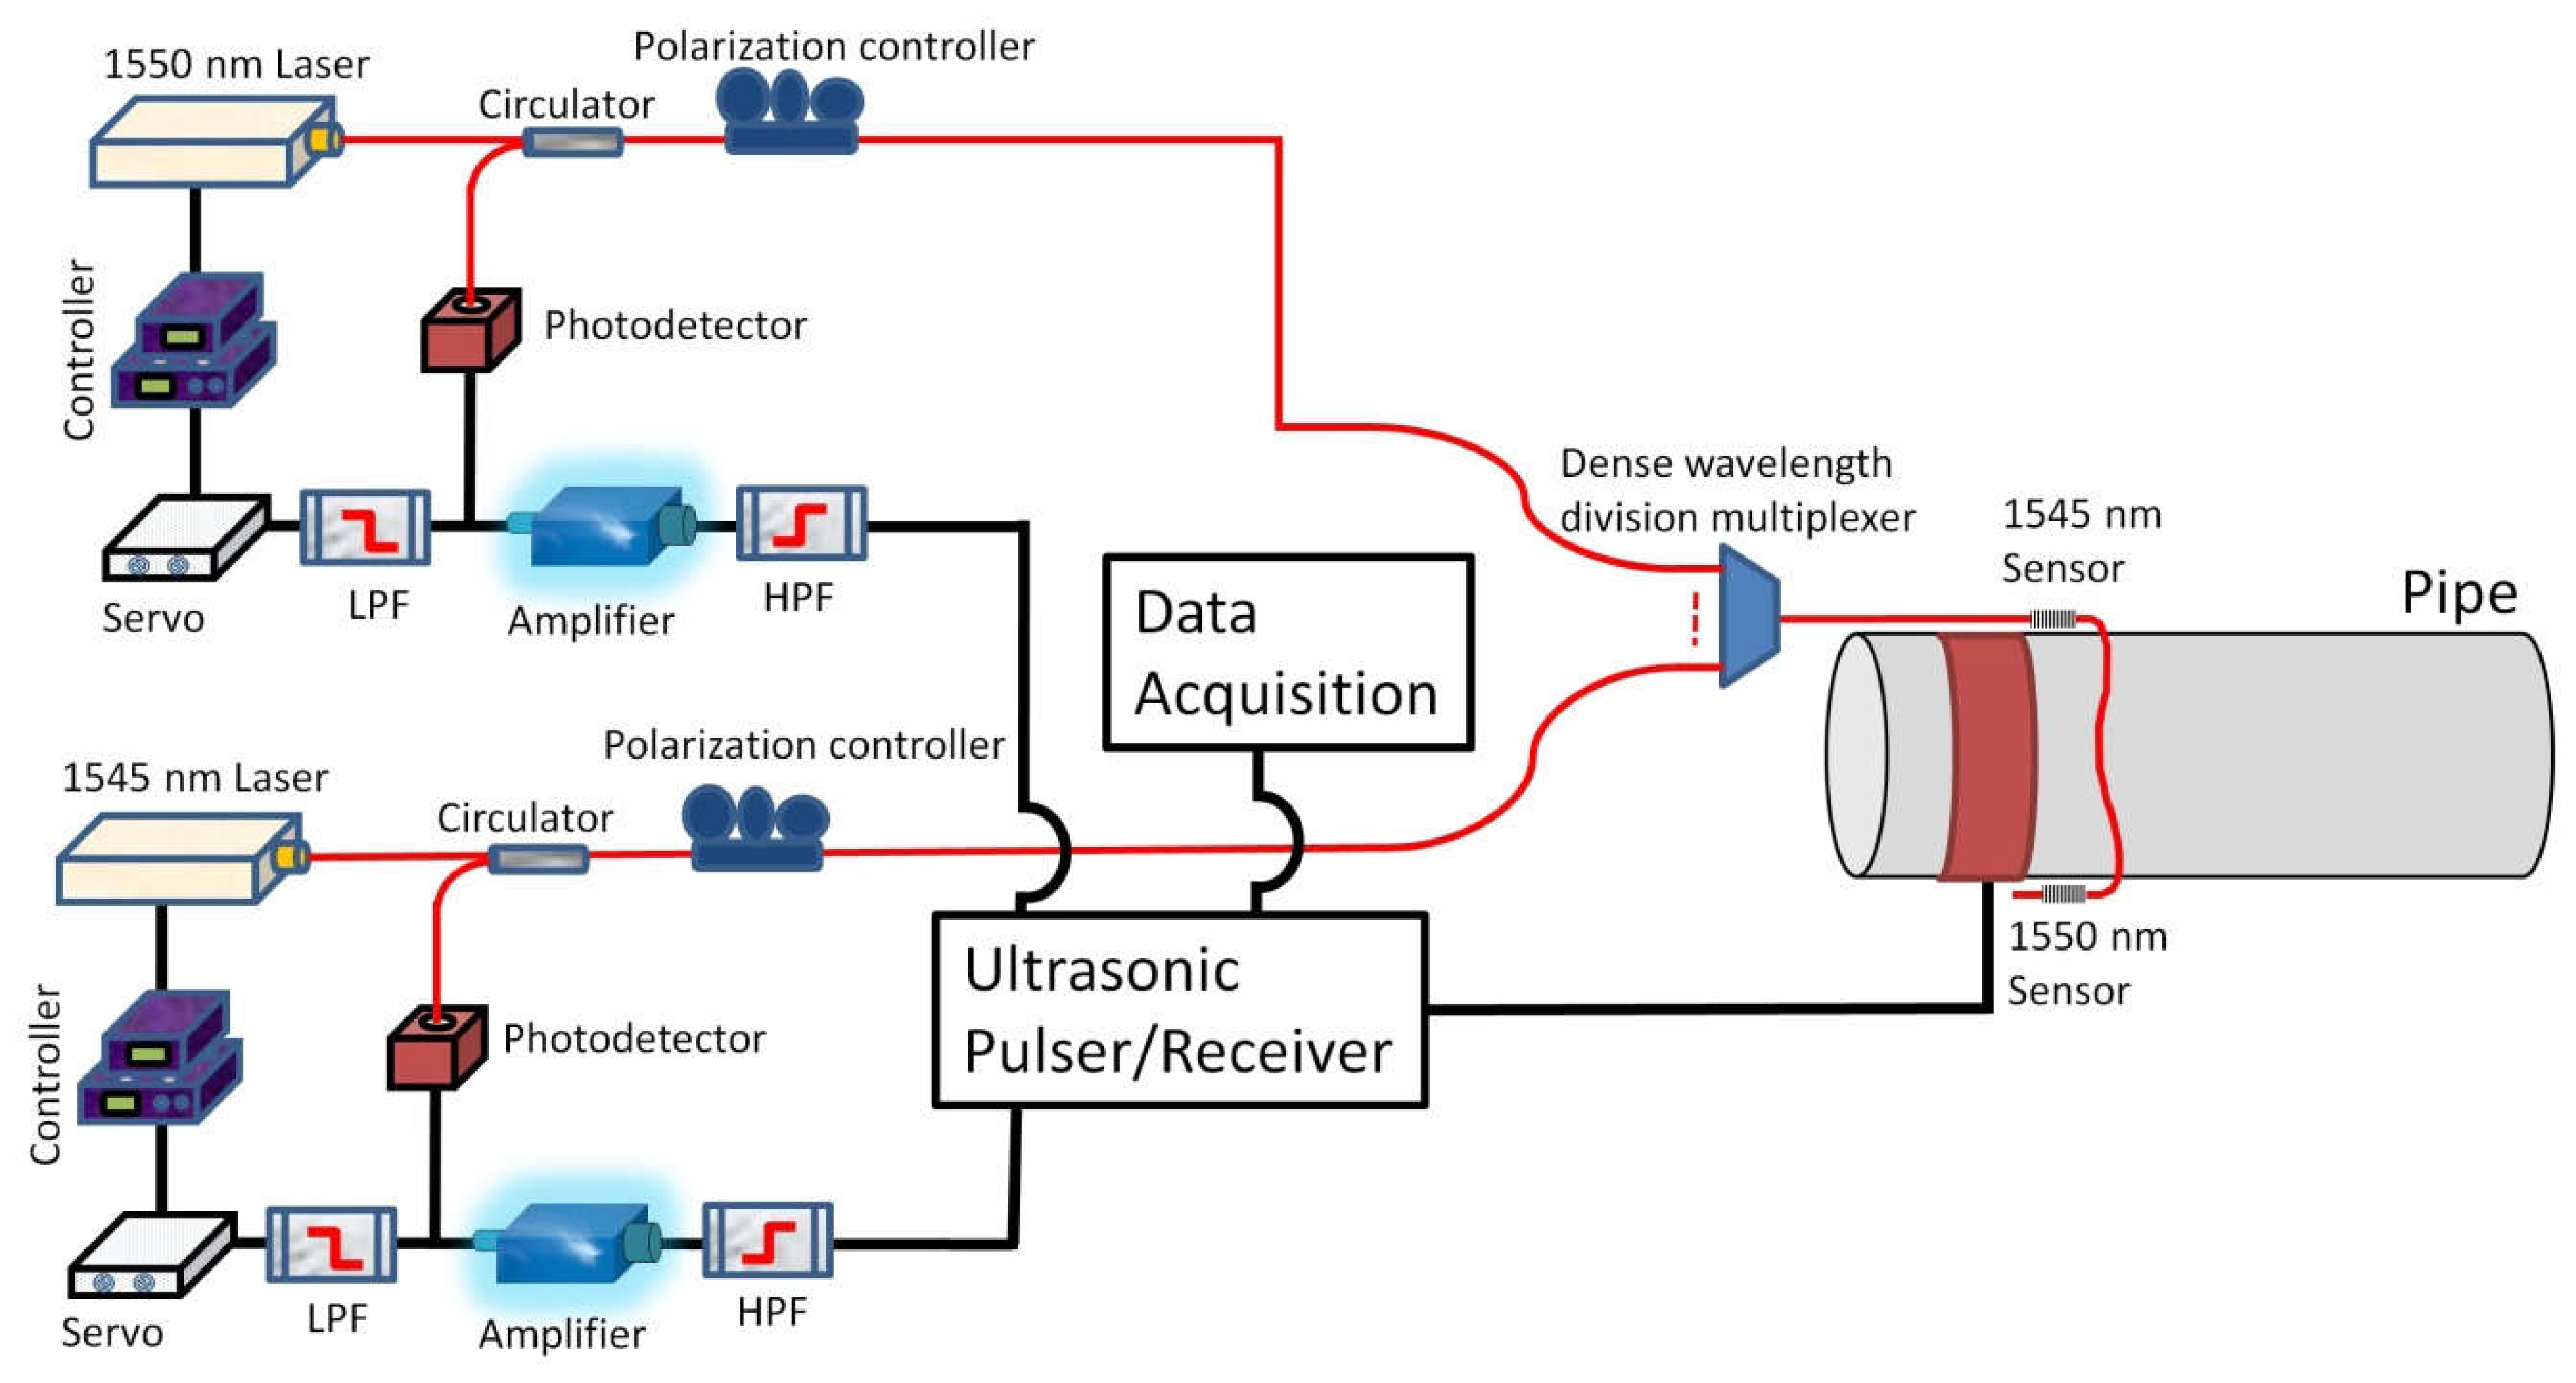
3. Materials and Methods

An experiment was conducted on a 21-foot section of 6-inch NPS schedule 40 carbon steel pipe. A segmented magnetostrictive (SMS) collar was placed 3 feet from the pipe end and used to generate torsional axisymmetric ultrasonic guided waves in the pipe. Generation of ultrasound using the magnetostrictive effect is described in Ref. [25] 1993. The SMS collar was constructed of copper meandering coils printed on flexible circuit boards with a design frequency of 64 kHz, which were placed over a 2-inch-wide strip of iron cobalt (FeCo) that was bonded to the circumference of the pipe. Olympus UltraWave LRT hardware (OSSA, Waltham, MA, USA) and custom software were used to generate torsional mode ultrasonic guided waves and collect data. This sending setup, and the SMS coil design, is identical to the one used and described in Ref. [11]. Optical FBG sensors were initially collocated with the collar, on the top and bottom of the pipe, and used to receive ultrasonic guided wave energy. The optical fiber sensors were oriented at 45° relative to the pipe axis and directly attached to the pipe surface using clear Scotch® tape. Tape was used because a temporary method for sensor bonding was desired so that the fiber optic sensor could be easily and quickly moved to various locations during experimental testing. Epoxy or superglue (cyanoacrylate) would be a more appropriate long-term choice for permanent sensor installation. The 45° orientation was previously shown to result in maximum reception of shear horizontal-type guided wave energy in plates [22] 2018. Ref. [22] also gives a theoretical justification for why this angle achieves the highest amplitude response to shear-type guided waves. Two flaws were introduced in the pipe at 13 feet and 10 feet from the pipe end. A schematic of the pipe is illustrated in Figure 2.
A schematic of the test equipment is shown in Figure 3. A laptop was used for data acquisition and custom software was used to control the UltraWave pulser/receiver hardware. The pulse was sent to the collar to generate ultrasonic guided waves in the pipe. One or more fiber optic sensors were coupled to the pipe and a distributed feedback (DFB) laser was used with a locking system to keep the laser wavelength locked onto the spectral notch of the optical fiber sensor, and a photodetector was used to convert the light signal into a voltage signal for recording. Different from the benchtop narrow linewidth laser used in our previous work [22], the much more portable and low-cost DFB lasers (A1905LMI, Avanex, New York, NY, USA) were used in this paper with moderate compromise in signal-to-noise ratio (due to the larger noise of a DFB laser). Furthermore, a two-channel system was used in this work to demonstrate the multiplexing capability of the FBG sensing system (see Figure 3), i.e., one DFB laser and FBG pair works at 1550 nm wavelength while the other pair works at 1545 nm. A dense wavelength division multiplexer (DWDM) was used to optically separate the two channels and the ultrasonic signals received by the two FBG sensors are acquired simultaneously. Additional details describing each single-channel setup are found in Ref. [22] 2018. Although the two-channel system is enough for the demonstration of multiplexing capability, when using this type of optical setup additional lasers could be added for additional simultaneous reception by fiber sensors connected to other channels of the DWDM but it is not the focus of this paper. Note that the type of optical fiber sensor used in this study is a Fabry-Perot interferometer formed by a pair of tandem chirped fiber Bragg gratings, each with a 5-mm grating length, abbreviated as CFBG-FPI and referred to in this work simply as an optical fiber sensor. Any reasonable optical fiber Bragg grating type sensor may be used to detect torsional guided waves; this sensor type was selected due to its relatively high signal-to-noise ratio, although it has other properties such as the ability to withstand relatively large static strains in the structure while still using its narrow spectral notch pattern [26] 2017.

4. Results

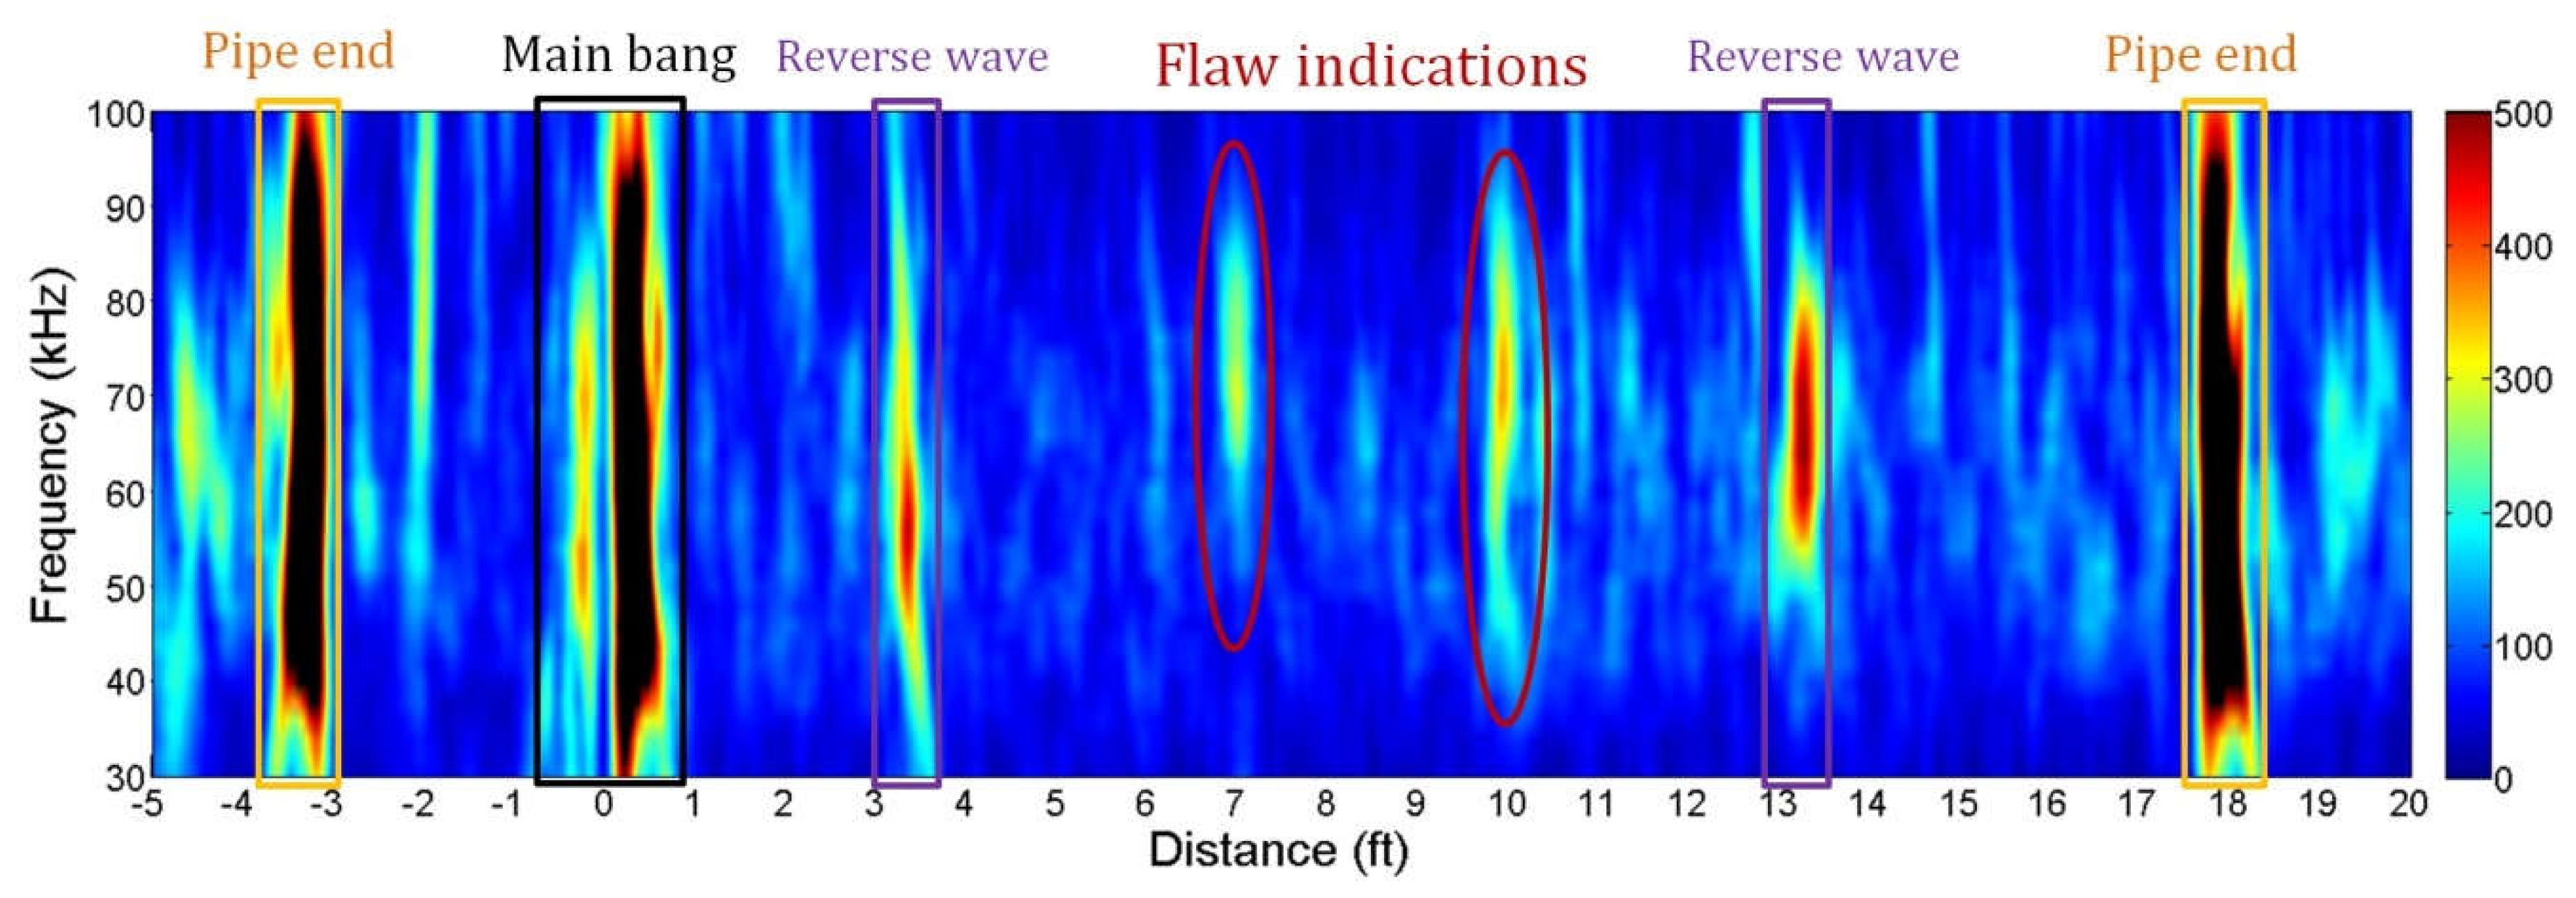
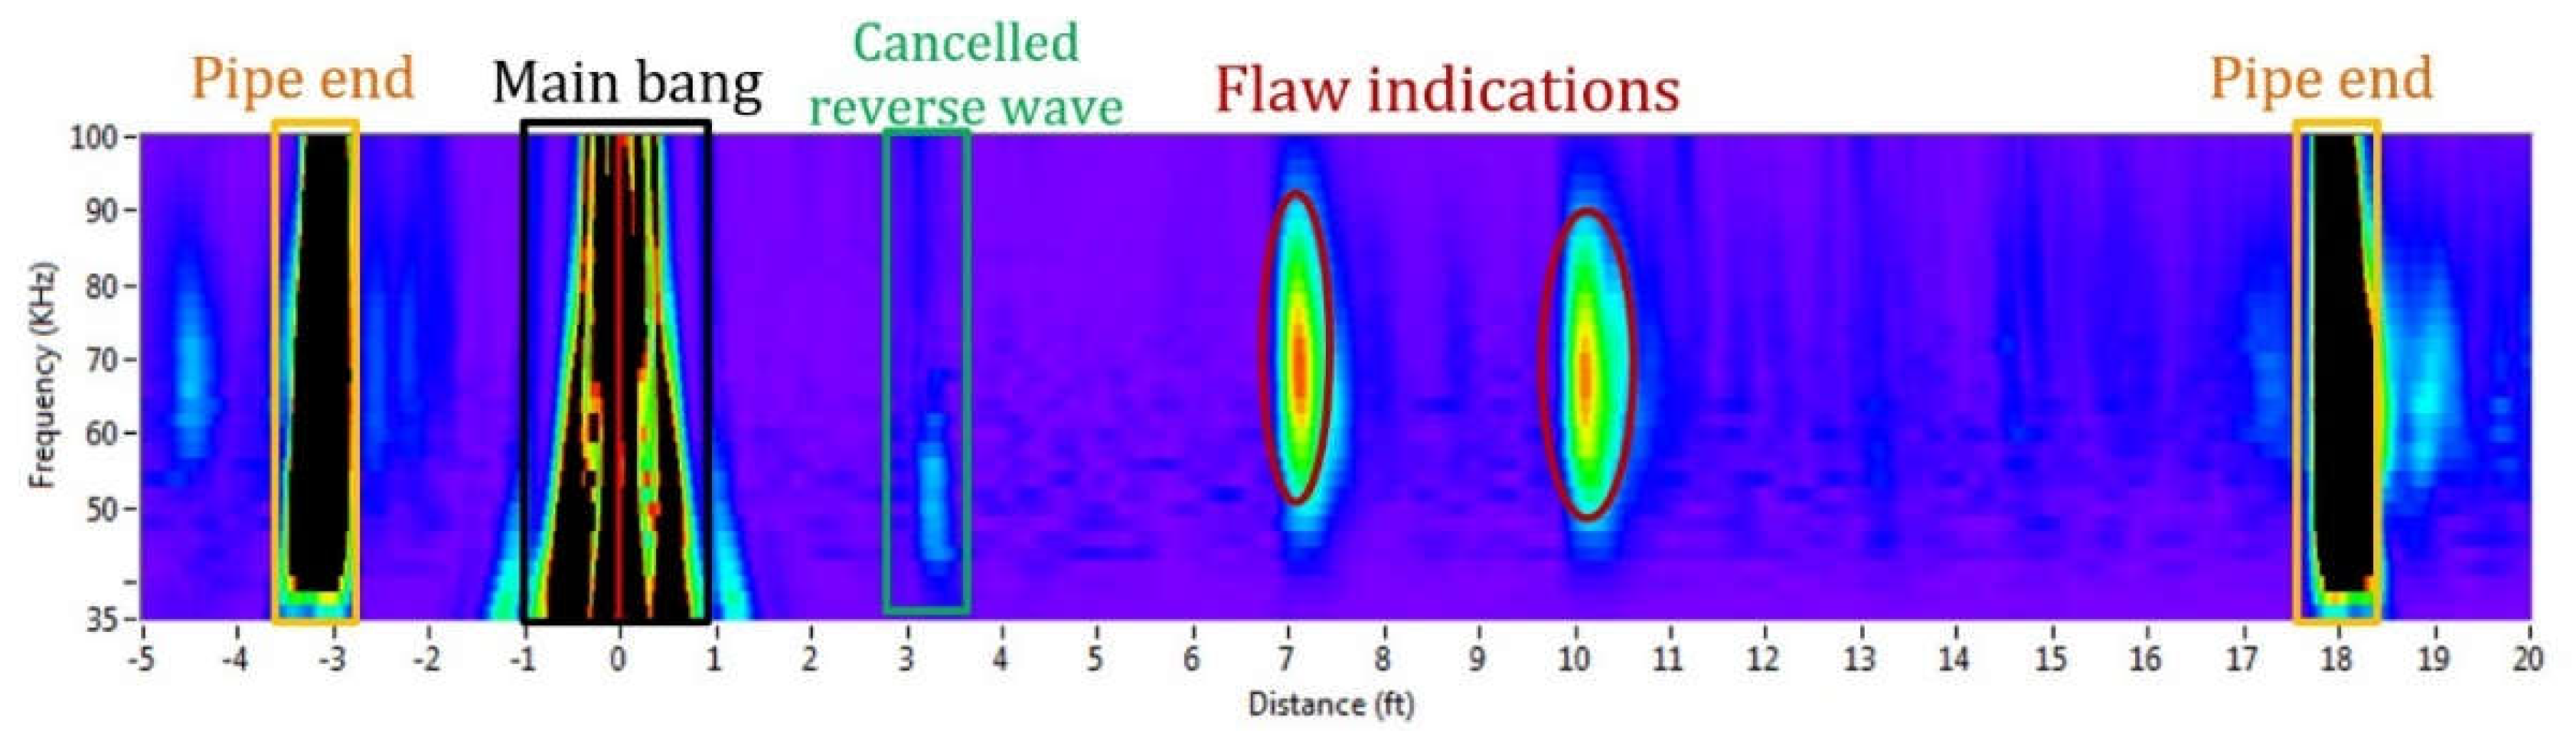
4.1. Confirmation of Torsional Mode and Flaw Detection

Figure 4 shows a frequency scan (F-Scan) plot of data collected using ultrasound generated by the SMS collar and received by the optical fiber sensor attached on the bottom of the pipe at 3 feet from the pipe end. The F-Scan plot shows data from a series of A-scans (amplitude scans) with different pulse center frequencies vs. distance, with amplitude shown in color. The dead zone, pipe end reflections, and flaw indications are indicated. These two flaws are located at 7 feet and 10 feet from the sensor and on the top and right side of the pipe, respectively. The flaws are 0.5-inch diameter and 0.25-inch deep drilled holes, which represent a simulated 2% CSA (pipe cross-sectional area) corrosion flaw.
Reflections from a reverse wave are also shown in Figure 4. Although the SMS collar was activated with directional control, in which two axially-separated coils are used with a time delay to cancel the backward-travelling wave, the cancellation is not perfect, and therefore extra reflections are shown at 3 feet and 13 feet, and to a lesser extent near 10.5 feet, from the collar location. These signals would not be as prevalent in a longer length of pipeline, since a 100% reflector (cut pipe end) would not be present. Also, these reverse wave reflections could be suppressed if two axially-separated optical fiber sensors are used and a directional control routine is applied on the received signals.
Even though the FBG sensor is effectively sensing at only a small portion (approximately a “point”) along the circumference, as opposed to sensing around nearly the full circumference as is achieved with a conventional long-range ultrasonic collar, it is clear from Figure 4 that positive flaw detection occurs over a range of frequencies. The ability of the “point” optical fiber sensor to detect a flaw reflection is dependent on the relative locations of the flaw and sensor, as will be discussed further below.
For comparison, F-Scan data using solely the SMS collar in pulse-echo mode is displayed in Figure 5. The two 2% CSA flaws are clearly detectable at 7 and 10 feet. Also, there is a higher signal-to-noise ratio for this setup, which is typically seen for magnetostrictive sensors. Use of different optical components, such as a laser with lower noise, could achieve a similar signal-to-noise ratio. Note also that the dual axially-separated coils allow for directional control and also a suppression algorithm on the received wave, suppressing the reverse waves shown in Figure 4, which is not possible for a single fiber optic sensor but could be achieved with multiple fiber optic sensors, as noted above. The experimental pipe tested here does not highlight the advantages of the hybrid sensing method, since this application of a short pipe of low attenuation would not benefit from range extension. The overall goal of this work is to prove that detection with a hybrid system is possible and describe future applications where it could prove beneficial.

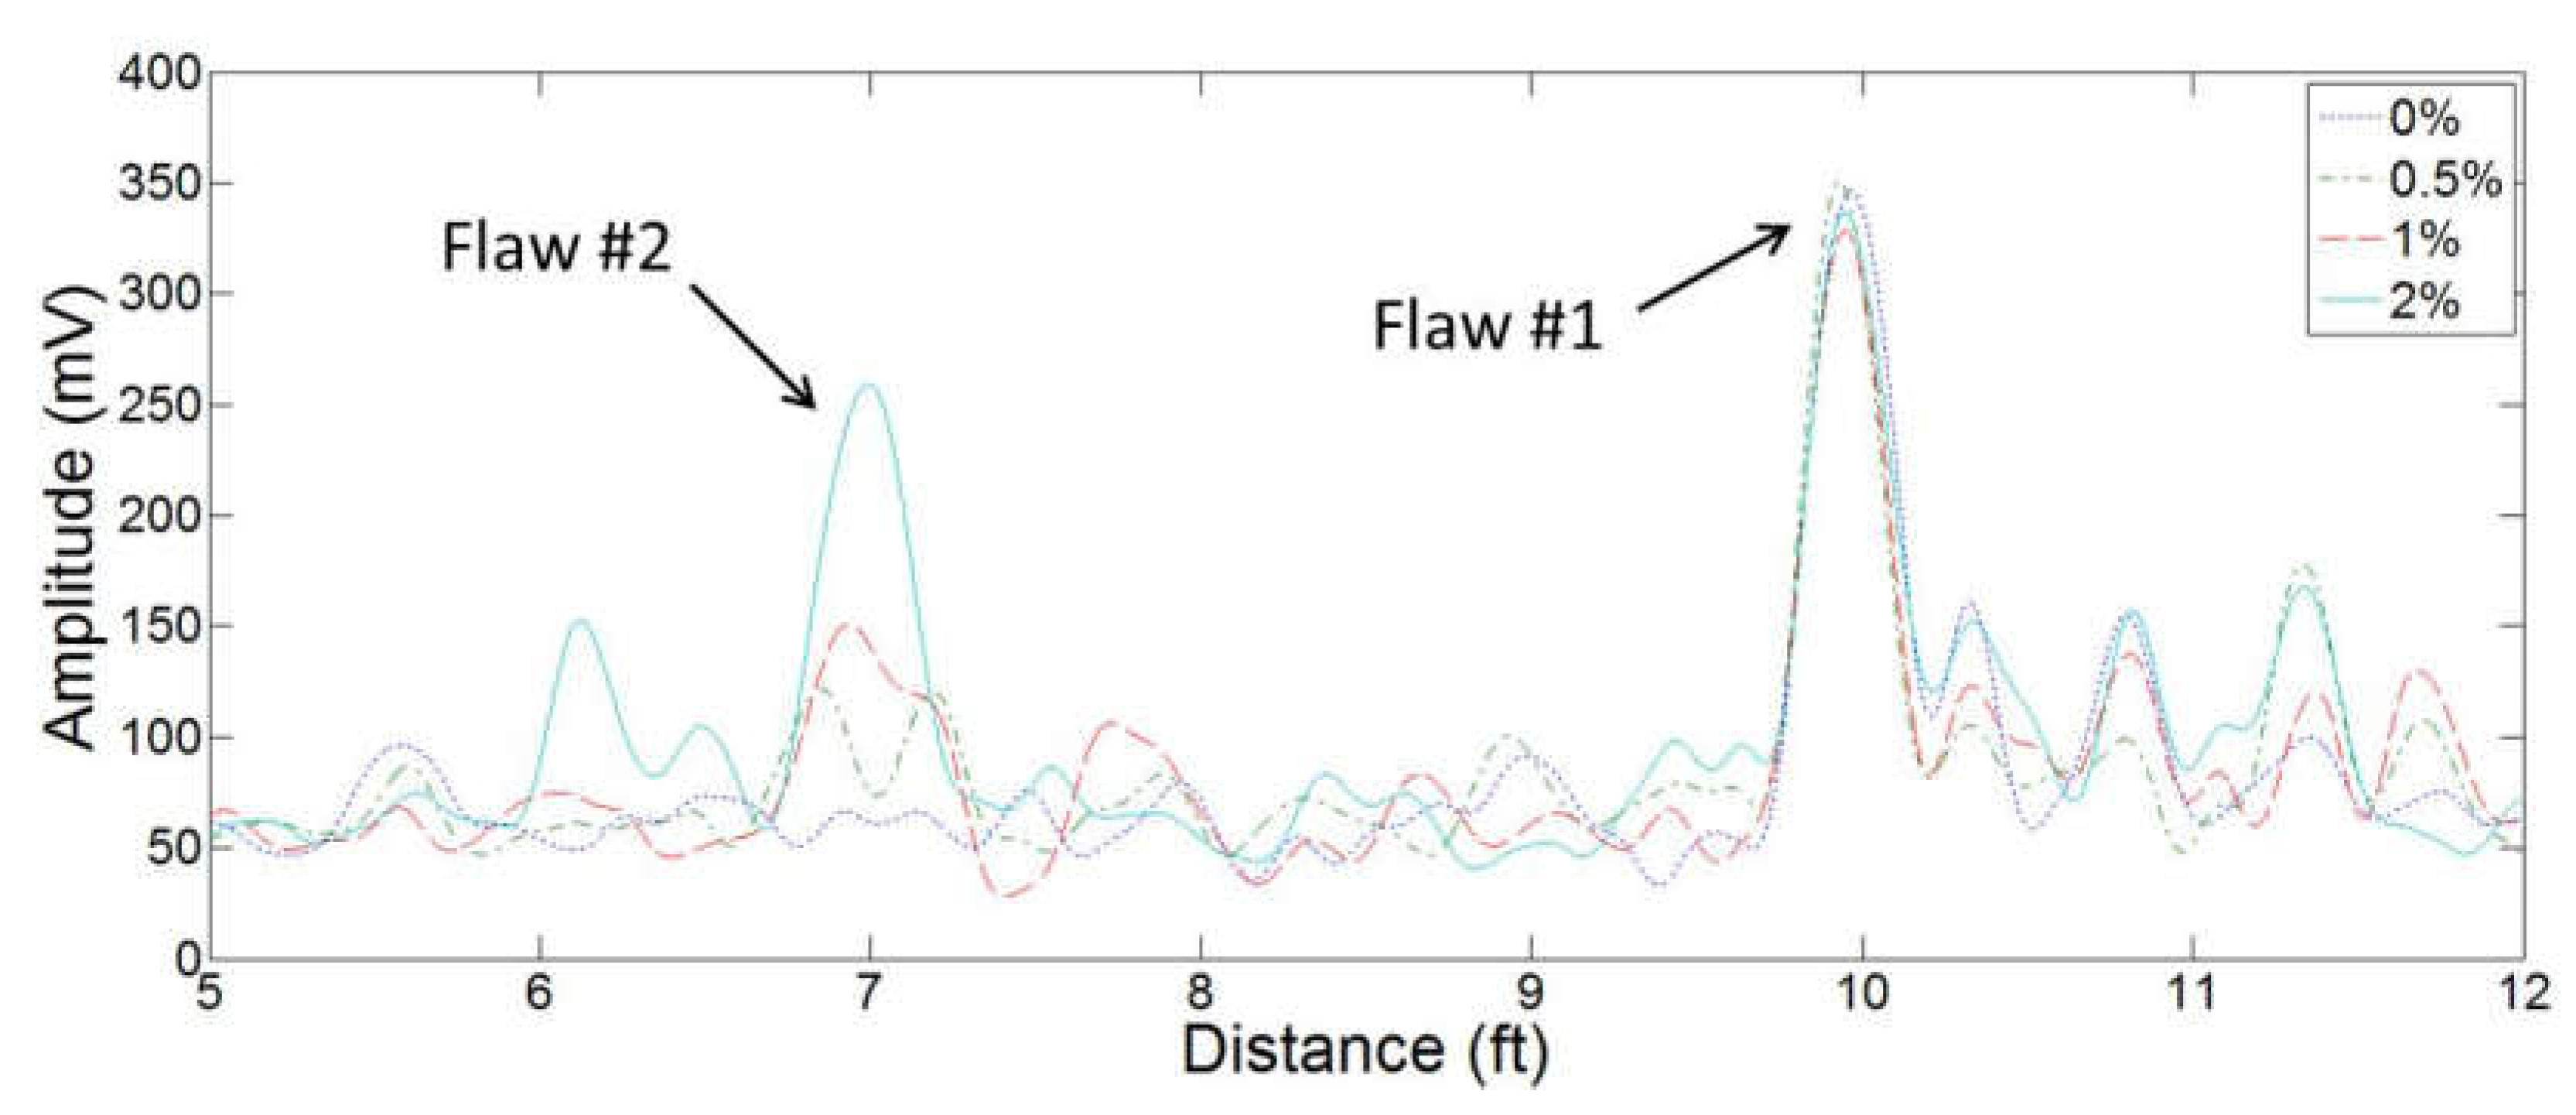
4.2. Progressive Damage Test in SHM Mode

Hybrid ultrasonic-optical data was also collected in a structural health monitoring (SHM) mode. In SHM mode, data was collected on the undamaged pipe, and then after each successive growth in flaw size. Figure 6 shows enveloped waveforms from several SHM states when the second flaw, located 7 feet from the sensor, was at 0%, 0.5%, 1% and 2% CSA. As shown, the reflection amplitude increases as the flaw size increases. Additionally, the reflection amplitude from the flaw at 10 feet from the sensor remains relatively constant, because the size of this flaw remains the same. Note that the 0.5% and 1% CSA flaws represent a 0.25-inch diameter hole with 0.125-inch depth and a 0.25-inch diameter hole with 0.236-inch depth, respectively.

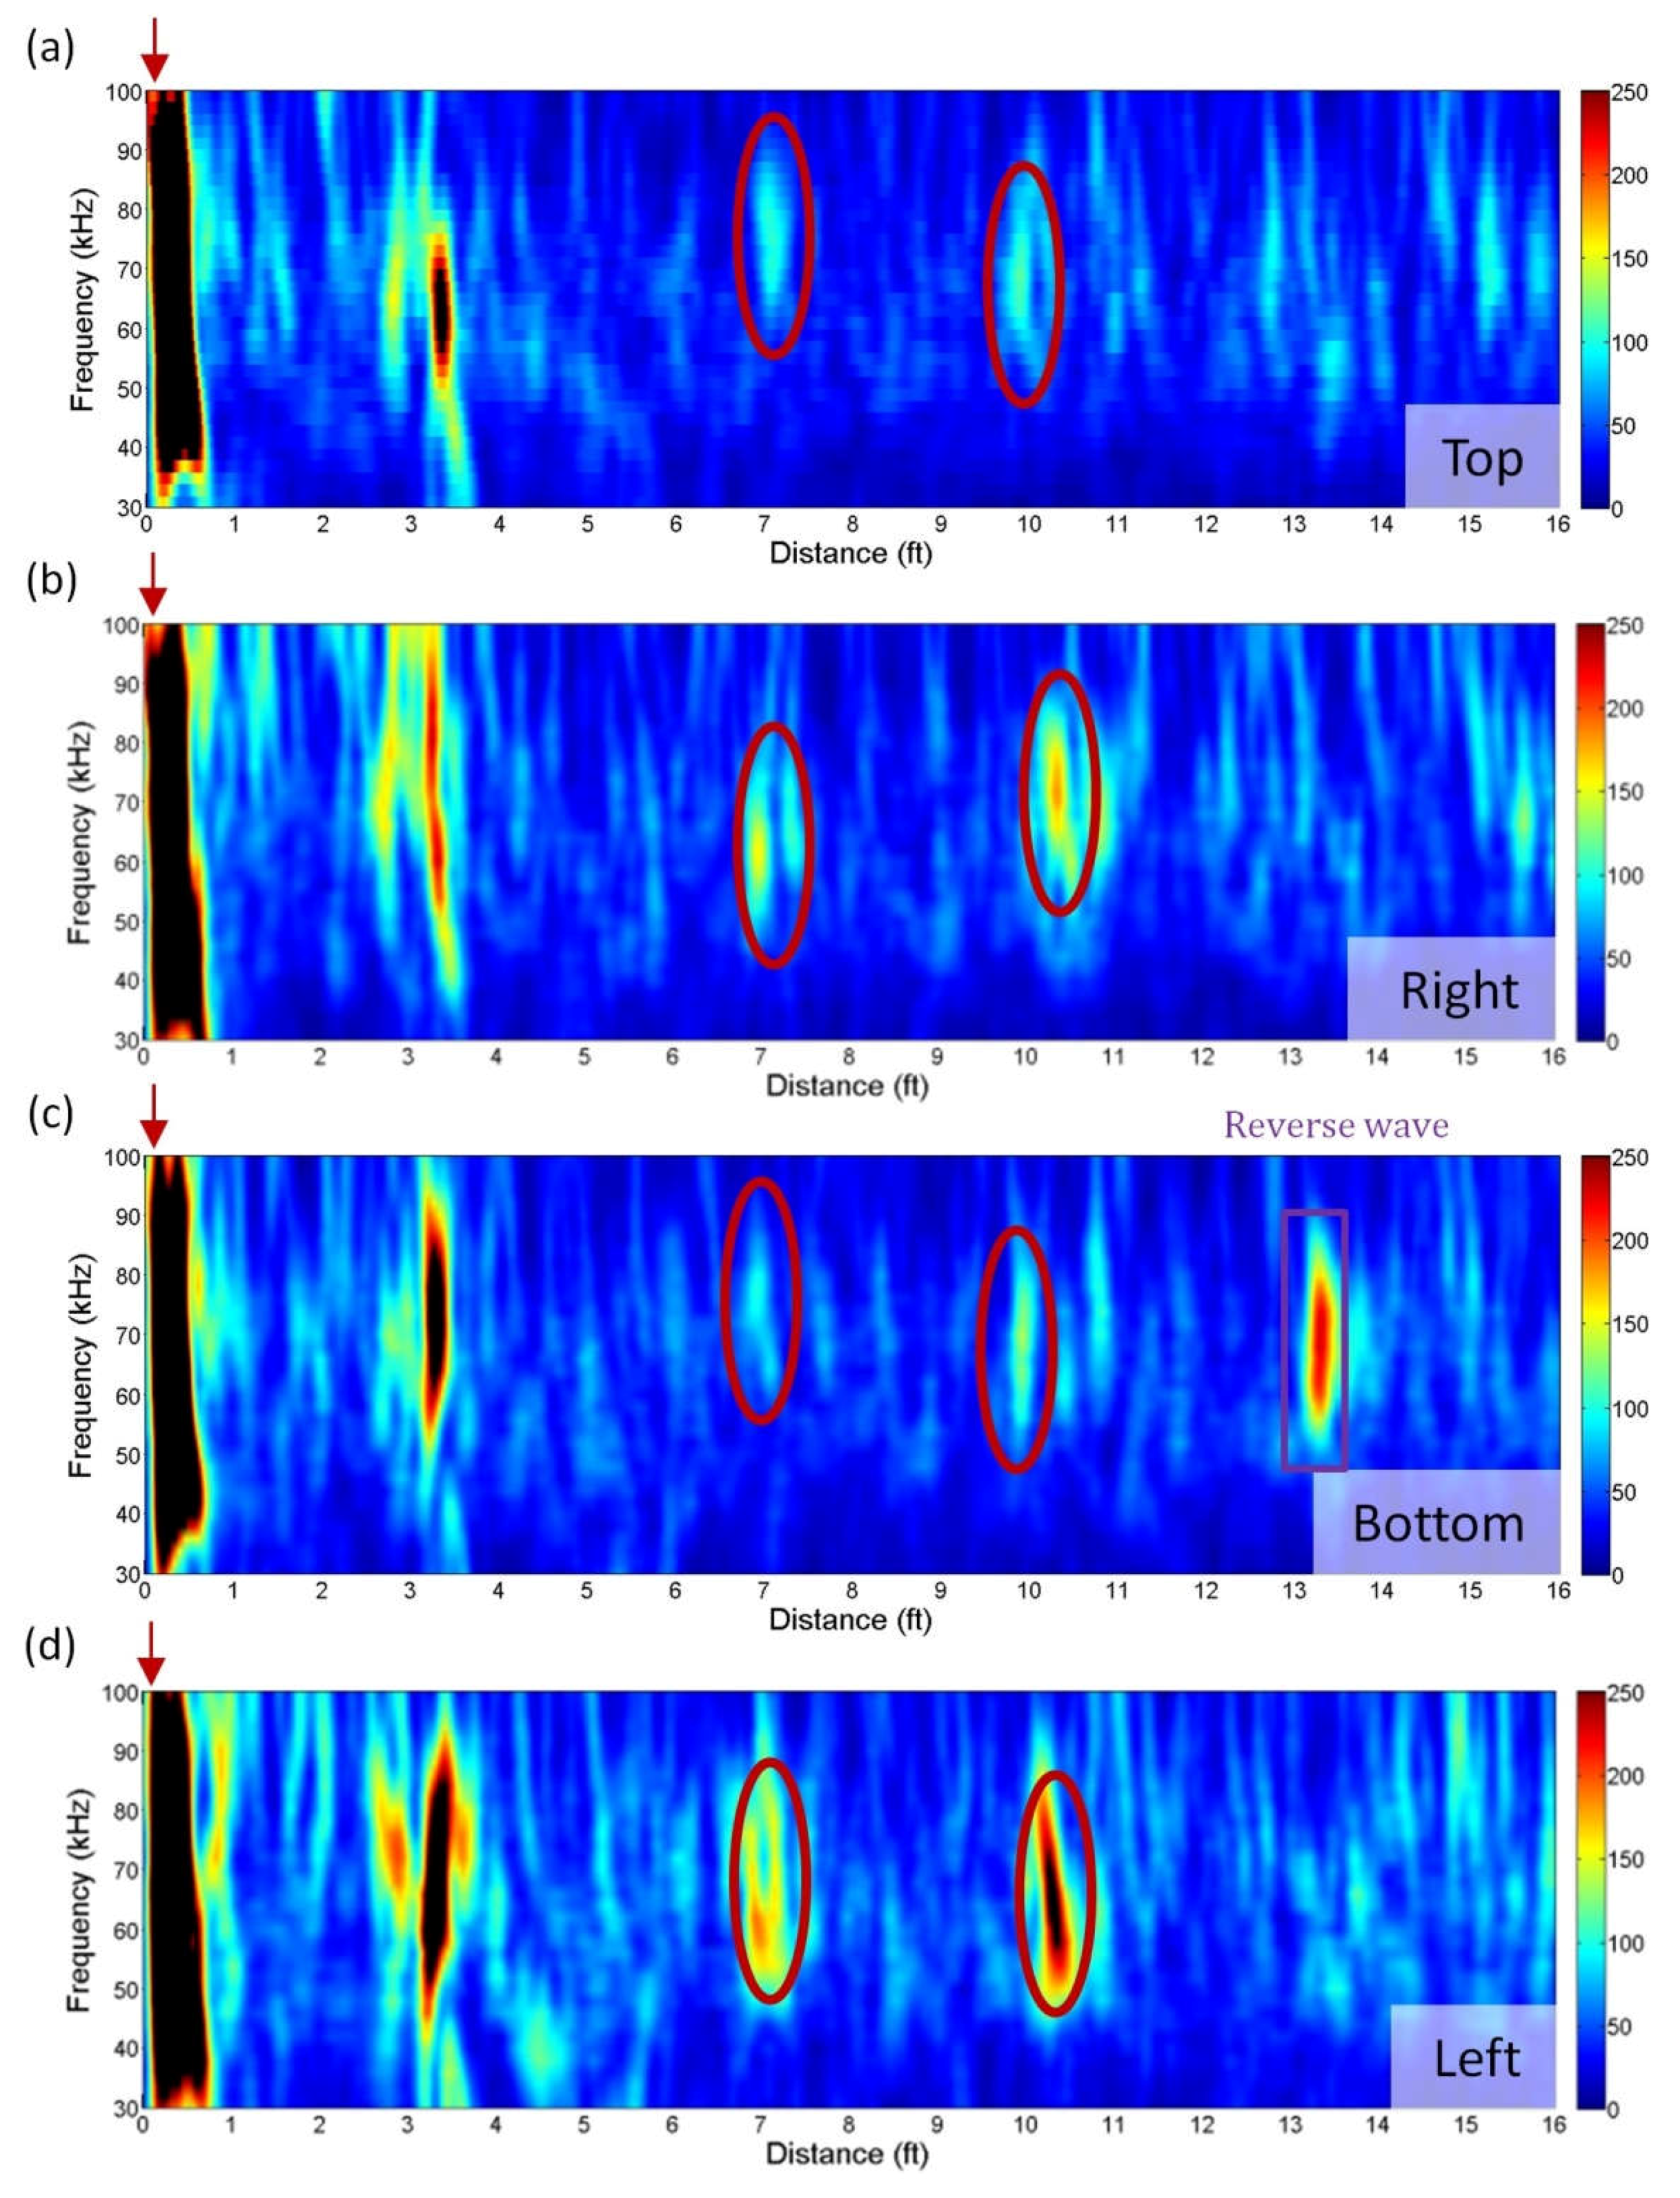
4.3. Individual FBG Sensor NDT

It is clear from Figure 4 and Figure 6 that the ultrasonic-optical approach can be effective for flaw detection. This section assesses the ability of a point-like receiver to reliably detect reflections from a particular flaw location. What is found is that if the flaw is relatively far from the receiving sensor, then detection is possible at all circumferential locations (see Figure 7). However, if the flaw is relatively close to the receiving sensor, then detection is less reliable as it is more dependent on the circumferential location of the FBG relative to the flaw (see Figure 8). This result will be dependent on the scattering field from the flaw at small sensor-flaw distances, which will vary according to flaw geometry and ultrasonic wavelength. However, at further distances, for circular and many corrosion-like flaws, the reflected wave will be detectable at nearly any circumferential location due to the wrapping of the reflected wave path circumferentially around the pipe. Additionally, sweeping inspection frequency to generate the F-scan further improves the likelihood of detection.
Figure 7 shows F-Scans collected with optical fiber sensors collocated with the collar at four distinct circumferential positions (top, right, bottom, and left sides). The axial distance to the two flaws is 7 feet and 10 feet, respectively. Compared to the pipe circumference, this axial distance is relatively large compared to the pipe circumference, at 4 and 5.8 times the circumference, respectively. At this axial distance, sensors at all four circumferential positions detect both flaw reflections. It is believed that detection is possible at all circumferential locations because the scattered wave generated by the interaction of the initial axisymmetric wave and the flaw has had sufficient time to spiral around the pipe by the time the waves return to the receiving sensor locations.
Figure 8 shows F-Scans collected with optical fiber sensors located 6 feet in front of the collar at four separate circumferential positions. In this setup, the axial distance to the two flaws is 1 foot and 4 feet, respectively. This is a relatively small axial distance between the sensors and flaws at 0.6 and 2.3 times the circumference, respectively. In this case, the sensor located on the opposite side of the pipe from the flaw has the lowest reflected wave amplitude from that position. In both cases, the sensor on the opposite side does not effectively detect the flaw, and the reliability of the other sensor locations for flaw detection is intermittent. This may be due to the smaller amount of energy in the scattered wave field travelling at high angles relative to the axis of the pipe, and also the natural angular reception efficiency of the optical sensor which decreases as incident angle increases relative to the pipe axis, with a maximum efficiency at 45°. The exception is for the sensor at the same circumferential location (directly in line) with the flaw. The sensor on the top of the pipe clearly detects the flaw at 10 feet, and the sensor on the right of the pipe clearly detects the flaw at 7 feet. These results suggest that to have 100% detection coverage of the pipe using point-like sensors, including at axial distances close to the sensors, an array of optical fiber sensors is preferred—either circumferentially around the pipe, axially around the pipe, or a combination of the two. An array of sensors can detect flaws regardless of the closeness of the optical sensors to the flaws.

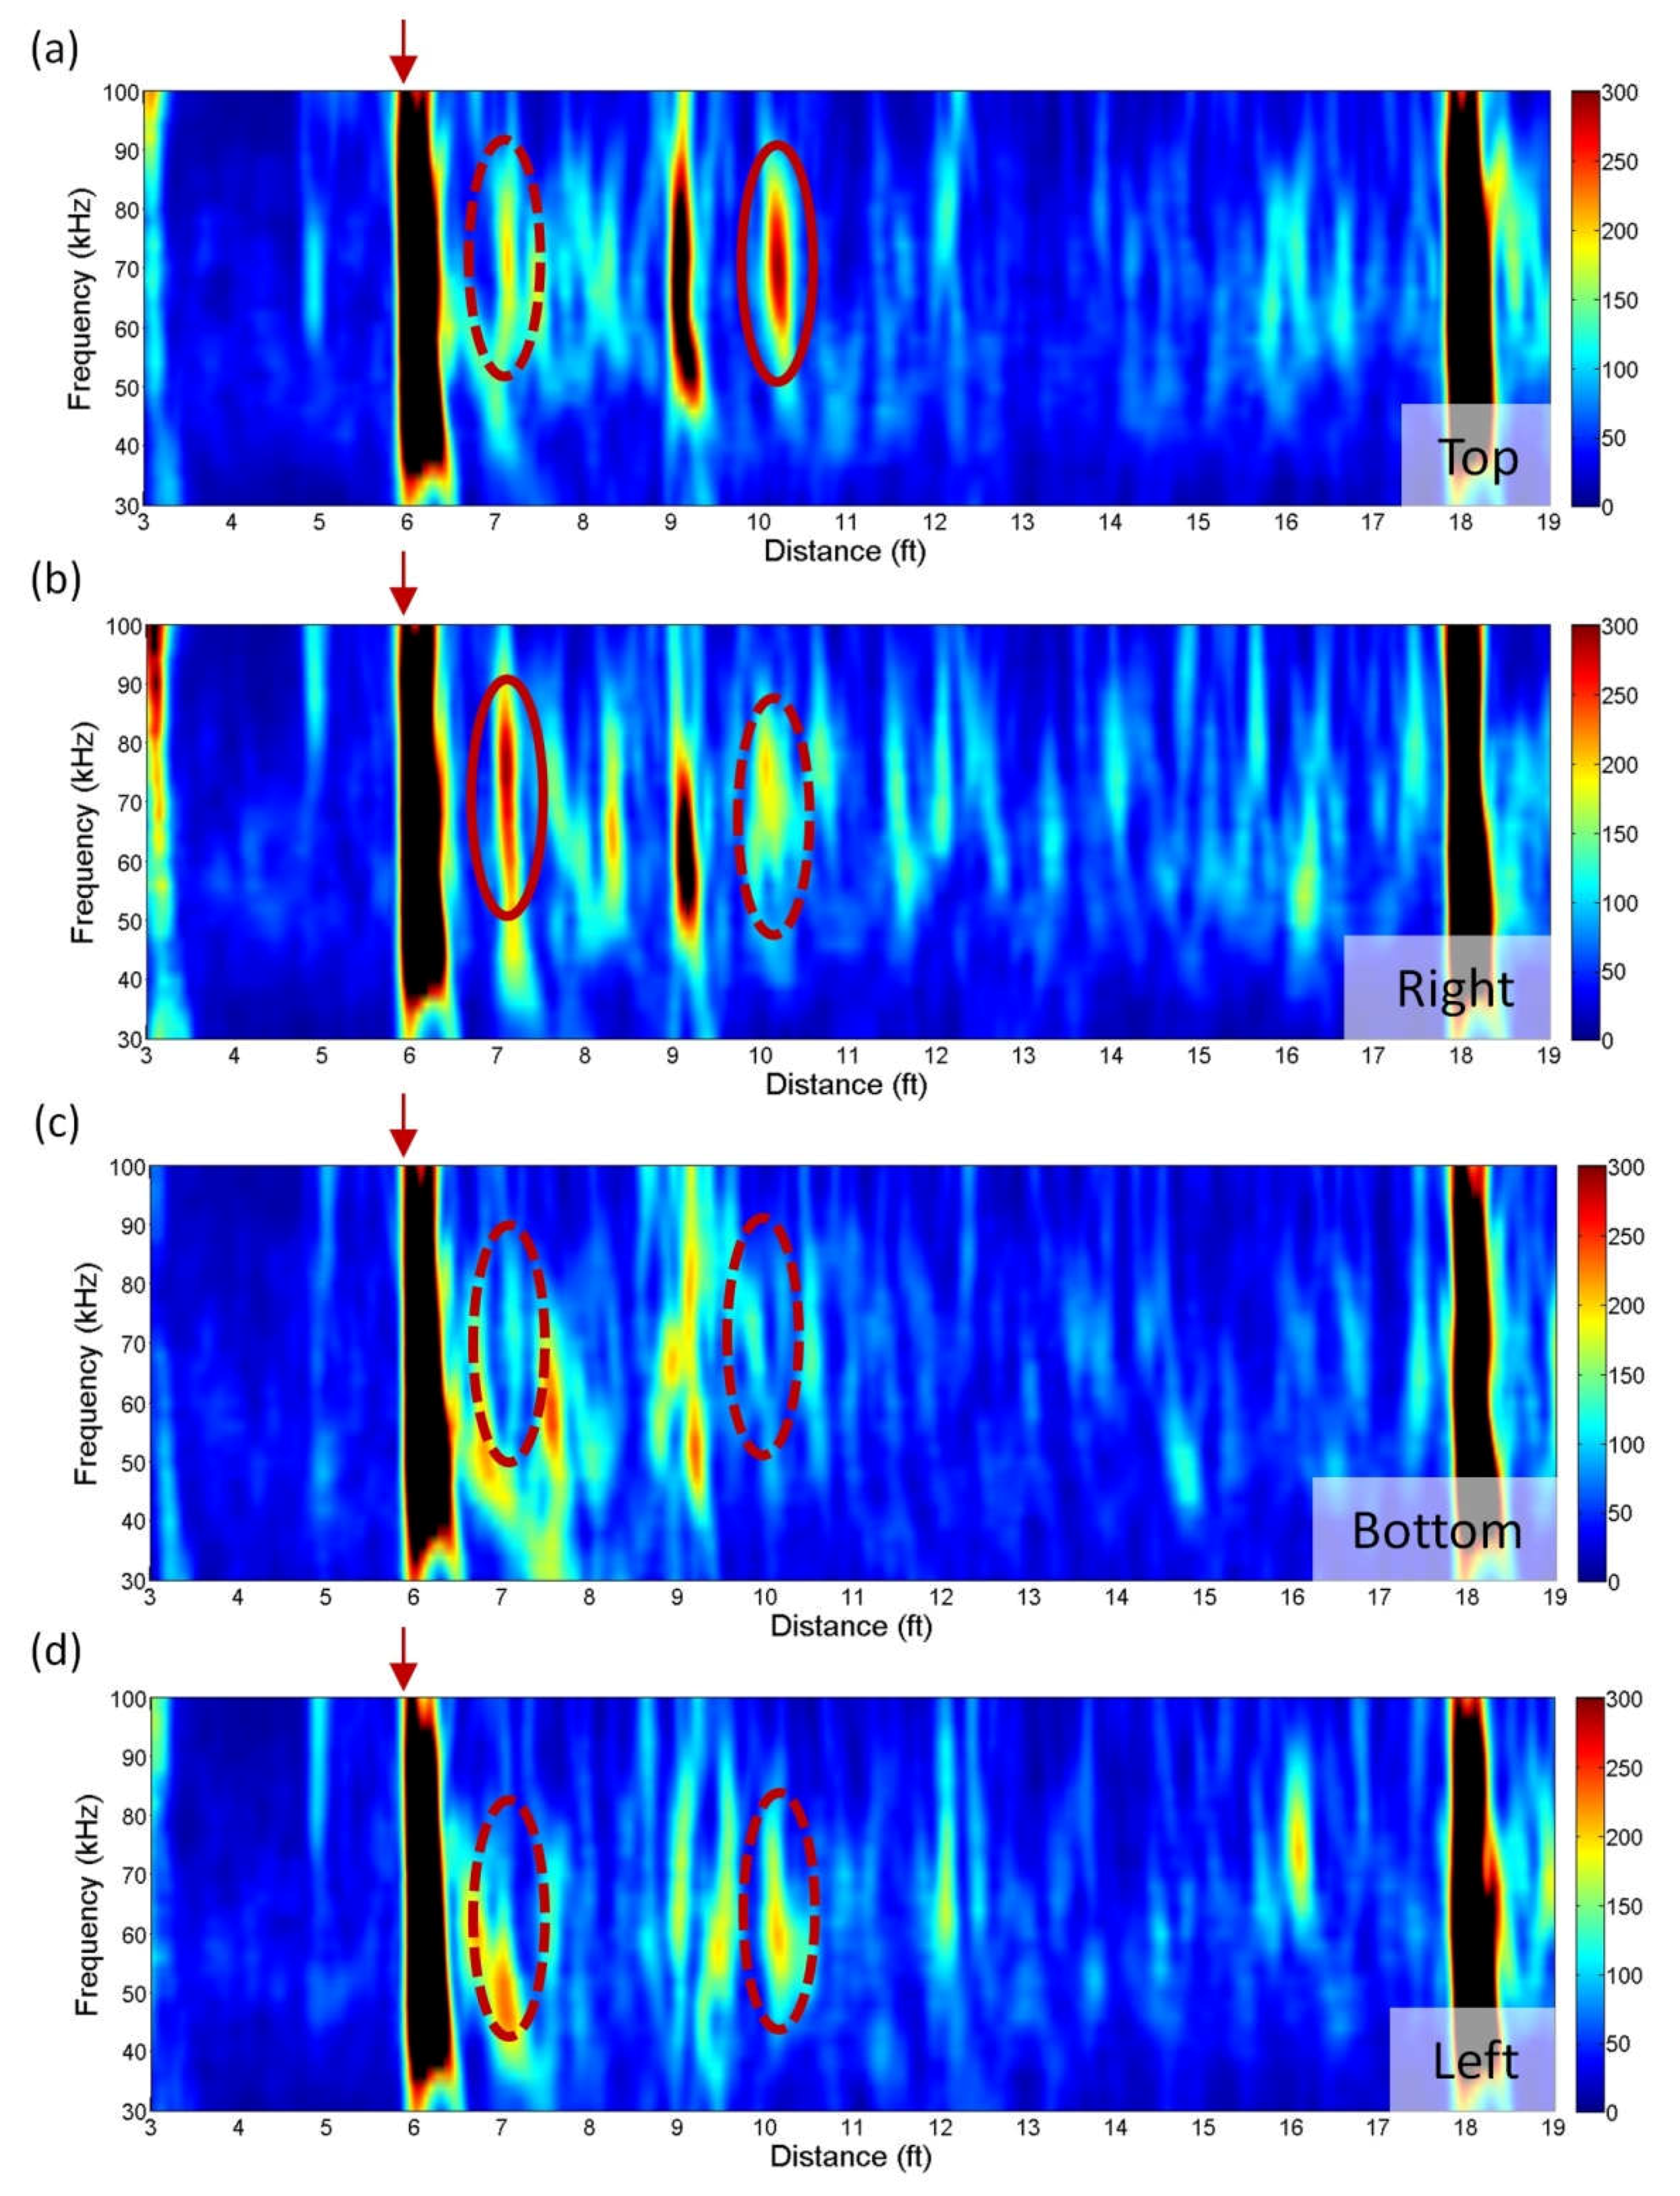
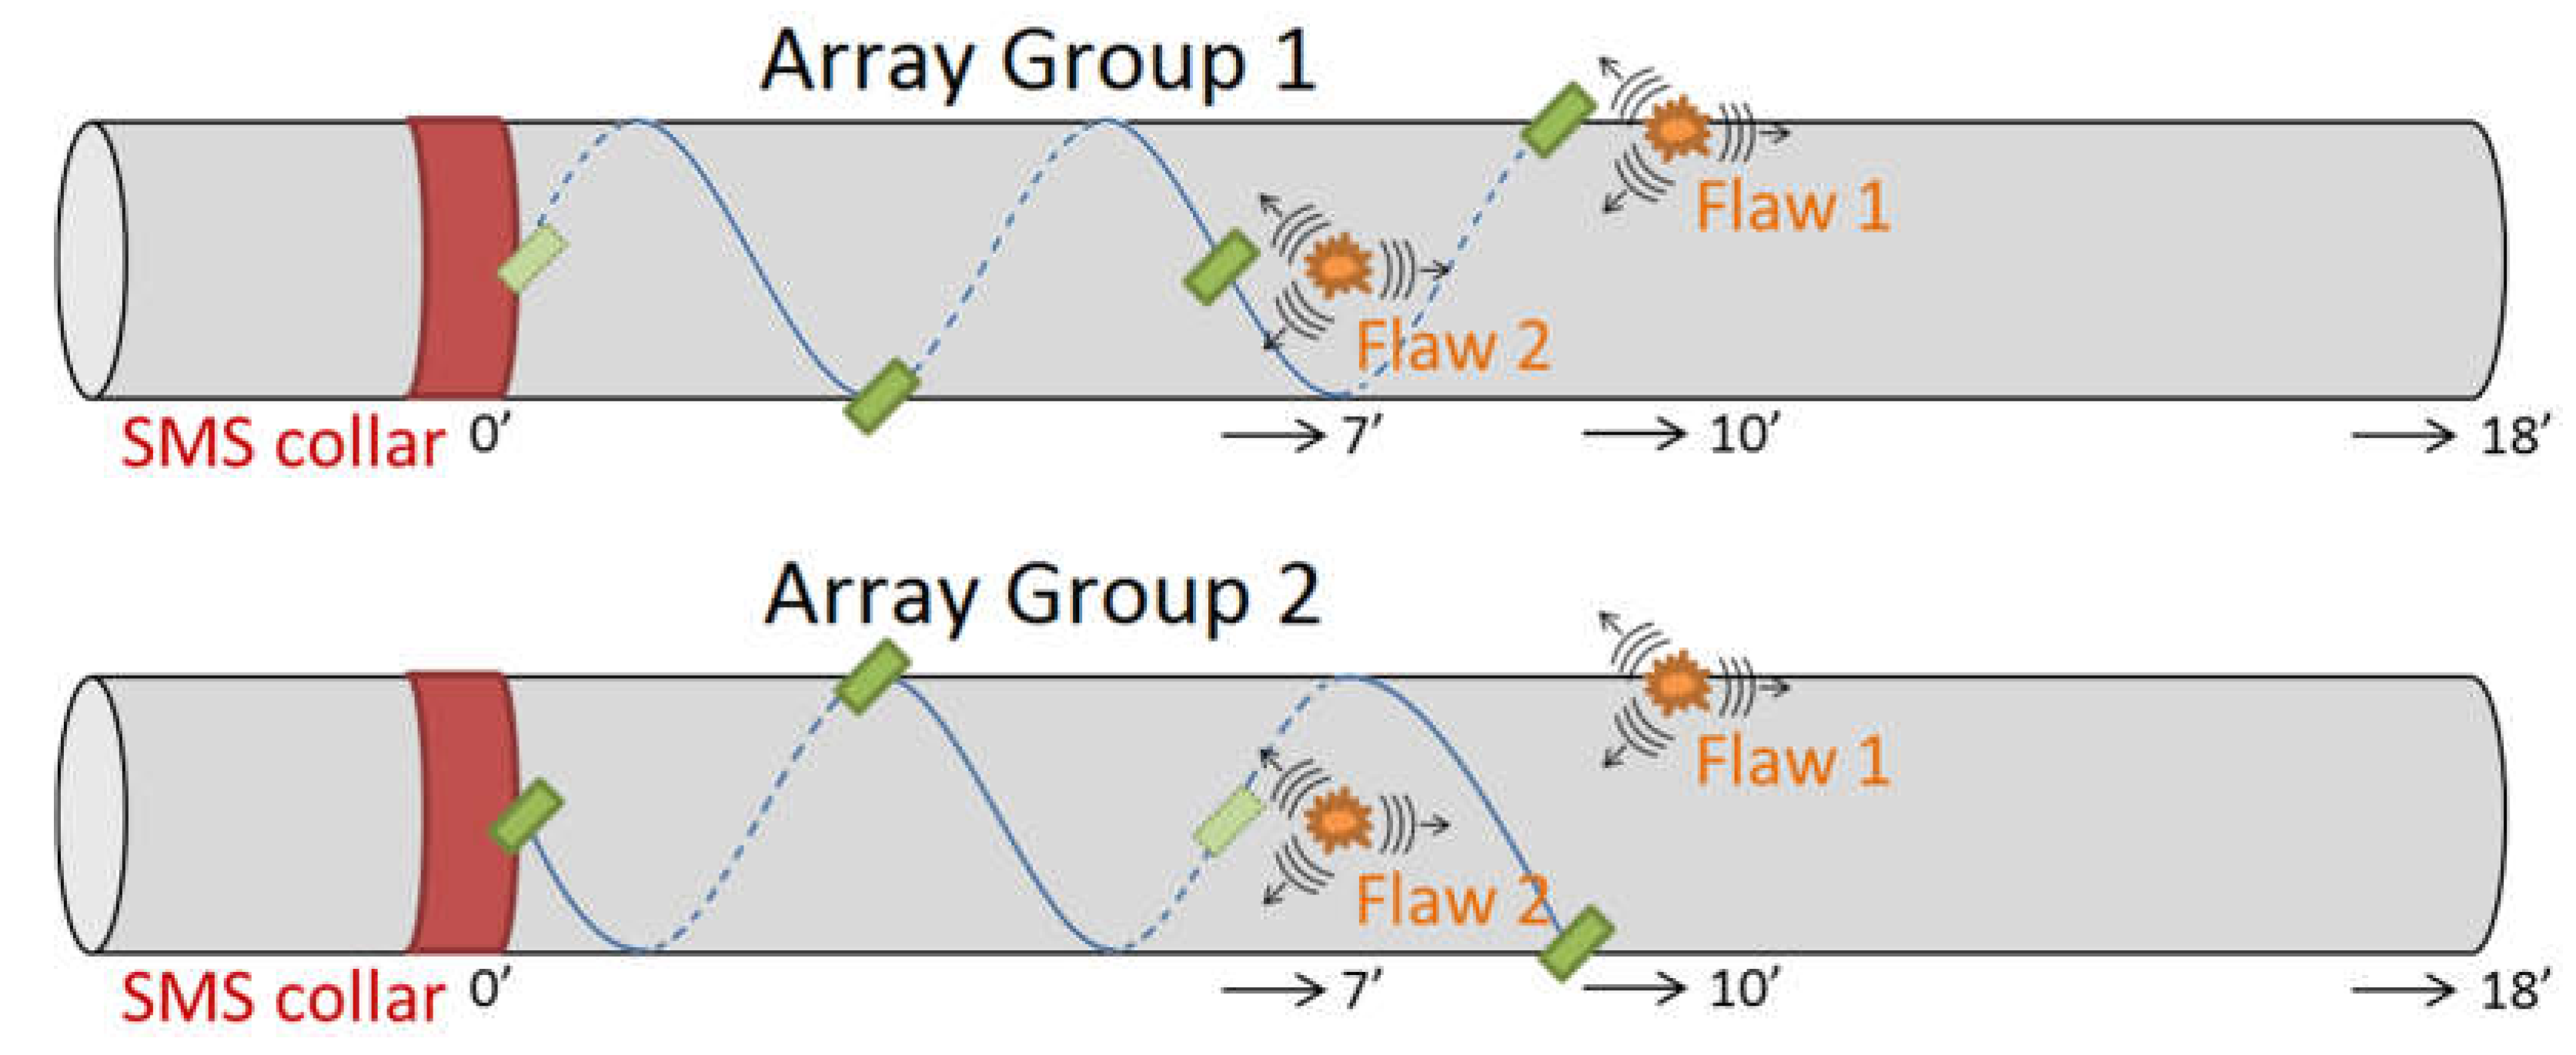
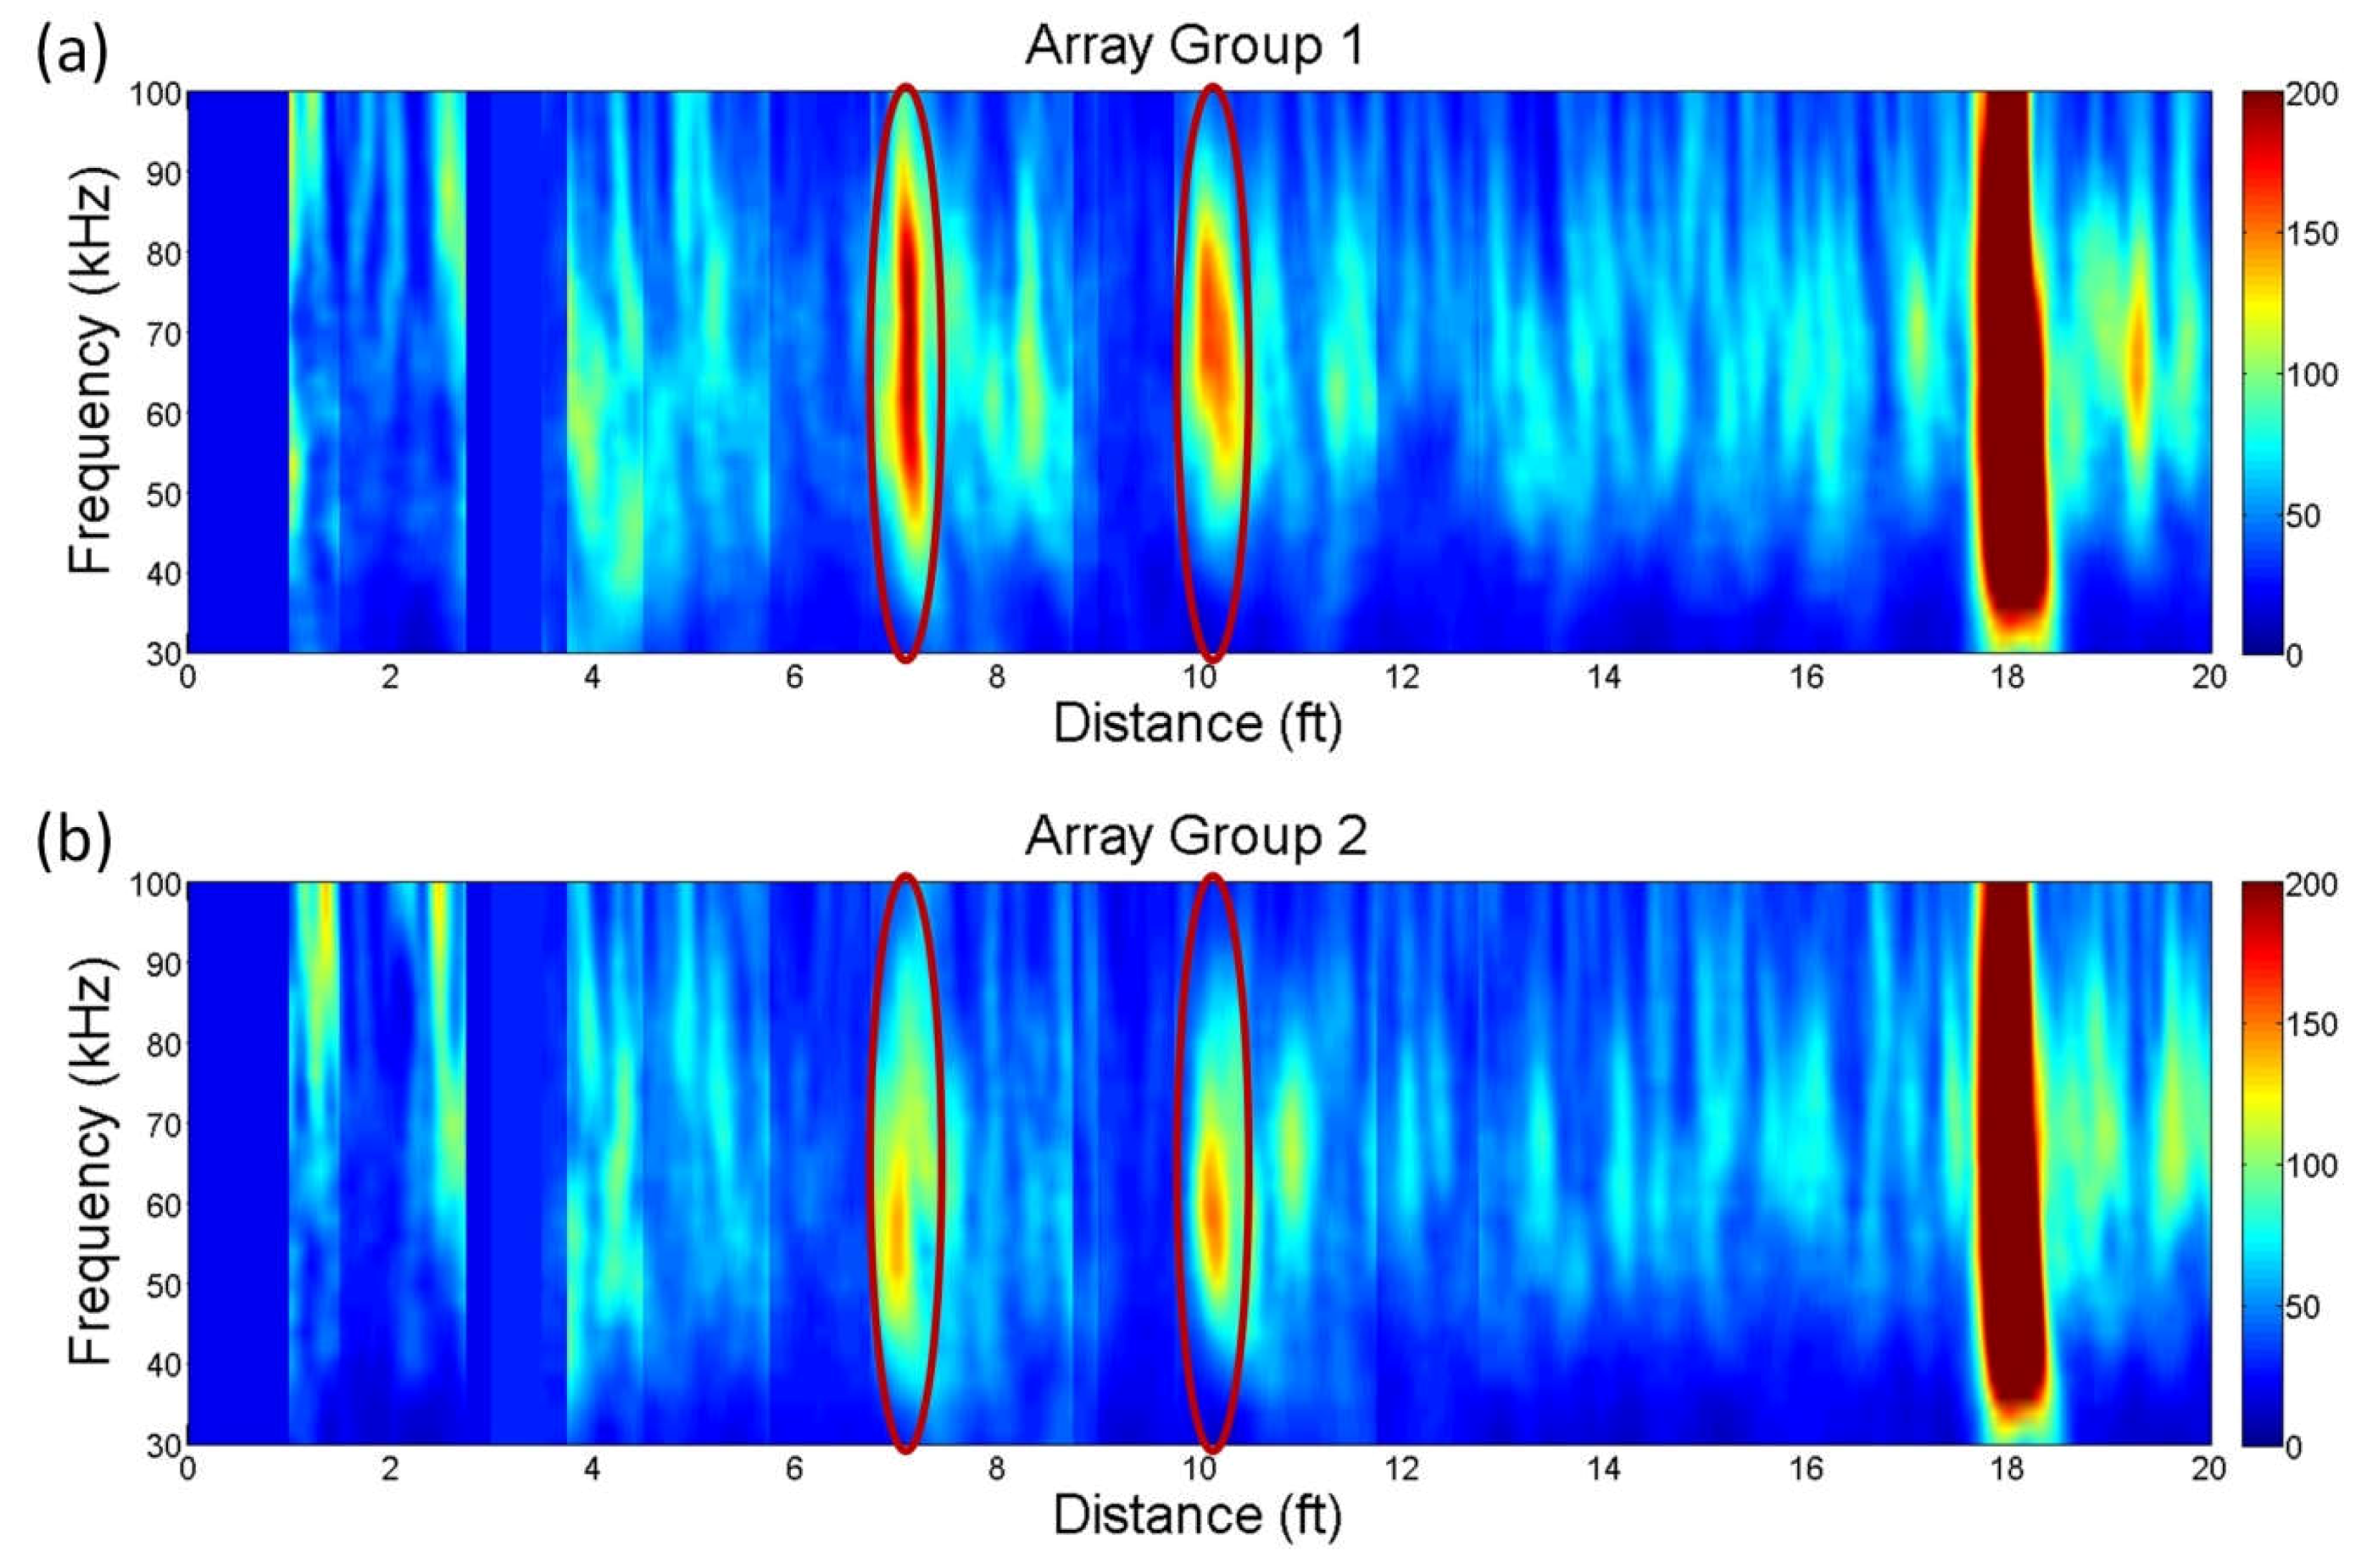
4.4. Sparse Array NDT

As mentioned at the end of the previous section, to increase flaw detection reliability, a sparse array of optical fiber sensors could be situated at different circumferential and/or axial locations along the pipe. This would allow detection of a flaw at any location along a pipe, because if it is close to one sensor it will also be sufficiently far from other sensors to allow for reliable detection. Several sparse arrays were simulated by moving the optical fiber sensors to different locations on the test pipe. An optical fiber sensor was located at 0 feet, 3 feet, 6 feet and 9 feet from the sending collar on the top, left, bottom, and right sides at each of those axial locations. Data was collected at two locations at a time until data from all 16 locations was collected. Data from multiple positions is then combined to allow for an assessment of a variety of sensor array geometries.
In the present work, two optical fiber sensor arrays are considered. Both spiral down the pipe so that there is one sensor located on the top, right, bottom, and left sides of the pipe, each at a different axial location. Group 1 contained sensors on the left, bottom, right, and top, and group 2 contained sensors on the right, top, left, and bottom of the pipe at axial locations of 0 feet, 3 feet, 6 feet and 9 feet, respectively. This is shown schematically in Figure 9. These groups were selected such that group 1 had sensors directly in front of the two flaws, while the sensors closest to the flaws in group 2 are on the opposite side of the pipe (and therefore those two sensors are not expected to easily detect the flaws). Note that the flaws are located on the top and right sides of the pipe at 10 feet and 7 feet from the sending collar, respectively.
To combine the four waveforms collected via the four FBGs in each array into a single “group waveform”, the individual waveforms are processed by suppressing known position-dependent signals including the dead zone, the direct wave arrival, and the reverse pipe end reflection. When these events are present in the signals, the amplitude is reduced to a value of 20 mV, chosen because it is close to the noise level. The amplitude envelope of each of the four waveforms is also shifted in time to correspond to their respective positions along the pipe axis. After time-shifting, the waveforms are added, and the average is calculated. Flaws are more easily detectable in the group waveform than in any individual waveform from a single FBG. Additionally, the combined waveform is more robust than data from a single location since we are unlikely to miss a flaw due to a particular flaw position relative to a single sensor. Note that in general, the arrival times of these suppressed features would be known a priori since the sensor locations are known. This suppression algorithm also adds a jaggedness to the waveforms, as the suppression is applied as a step function. For the data shown in Figure 10, this jaggedness occurs for the approximate length of the initial wave pulse (1 foot) as the wave passes each sensor location: 1–2 ft, 3–4 ft, 6–7 ft and 9–10 ft.
Figure 10 shows F-Scans of the processed group waveforms for both (a) group 1 and (b) group 2 fiber optic sensor arrays over 30 to 100 kHz frequencies generated with the SMS collar. The combined group 1 and group 2 signals both show good flaw detection capabilities. Both FBG sensor groups detect the flaws at 7 feet and 10 feet from the collar location, even though multiple sensors in group 2 are on the far side of the pipe from the flaw to which they are nearest. This confirms that the potential to miss a flaw based on its relative location to a single sensor is greatly diminished using this approach versus placing a single fiber sensor at a single axial location. The array approach can increase detection confidence. Creating a group signal from sensors at 4 circumferential locations at a single axial location can also give a similar result. Depending on inspection requirements and access limitations, different implementations of a sensor array may be desired. Additionally, the array group signals appear to be more stable over a wider frequency range, which makes for more reliable interpretation by the inspector. Due to these characteristics, the F-Scans in Figure 10 are easier to interpret and more reliable for flaw detection than the F-Scans shown in Figure 7 and Figure 8, for a single fiber sensor at a single axial and circumferential location.

5. Discussion

It is believed that the work presented here represents the first study of flaw detection in pipes using an ultrasonic-optical system and torsional ultrasonic guided waves. Torsional wave reception using FBG sensors was successful, and damage detection, monitoring, and localization were demonstrated. Additionally, one method for increased confidence for flaw detection was demonstrated, in which signals from a sparse array of optical fiber sensors were combined.
A hybrid ultrasonic-optical inspection system has a wide variety of potential applications. One application is with permanently-mounted long-range ultrasonic guided wave pipe inspection collars. The optical fiber could be far from the excitation area and can increase the effective inspection range from a single sending collar position. Optical fiber sensors may also be used in places with limited access for traditional collars. The optical cable is very thin (as little as 80 µm diameter for bare fiber), so it can easily be mounted under coatings. Additionally, the optical fiber sensors can withstand harsh environments such as high temperature, radiation, and high levels of electromagnetic interference (EMI). Finally, the optical fiber sensors have a much wider bandwidth than traditional piezoelectric or magnetostrictive sensors.
Future work should focus on the development of ruggedized and miniaturized optical components and the demonstration of system effectiveness in field tests. Tests demonstrating an increase in inspection range on buried pipe could open avenues for additional applications. Optical fiber sensors provide unique advantages over traditional sensor types which will encourage their use in challenging inspection problems in the future.

Author Contributions

Joseph L. Rose and Jason Philtron contributed the ultrasonic guided wave and hybrid aspect of the research work including theory, experiment, and the write up. Guigen Liu, Yupeng Zhu, and Ming Han contributed fiber optic Bragg grating experimental portion of the work and assisted in manuscript revision.

Funding

The work carried out by J. L. Rose and J. Philtron was funded by Naval Research Laboratory grant number N0001417RX00182. The work carried out by G. Liu, Y. Zhu, and M. Han was carried out primarily at University of Nebraska-Lincoln and funded by the Office of Naval Research under Grant N000141712819 and Grant N000141410456.

Acknowledgments

The authors would like to thank Bob Brown and James Tagert at the Naval Research Laboratory for making this work possible. The authors would also like to acknowledge Russell Love and Cody Borigo for assistance with software and the experimental setup.

Conflicts of Interest

The authors declare no conflict of interest.

References

  1. Rose, J.L. Ultrasonic Waves in Solid Media; Cambridge University Press: New York, NY, USA, 1999. [Google Scholar]
  2. Rose, J.L. Ultrasonic Guided Waves in Solid Media; Cambridge University Press: New York, NY, USA, 2014. [Google Scholar]
  3. Ditri, J.J.; Rose, J.L.; Chen, G. Mode Selection Guidelines for Defect Detection Optimization Using Lamb Waves. In Proceedings of the 18th Annual Review of Progress in Quantitative NDE, Brunswick, ME, USA, 28 July–2 August 1991; Plenum: New York, NY, USA, 1991; Volume 11, pp. 2109–2115. [Google Scholar]
  4. Pilarski, A.; Ditri, J.J.; Rose, J.L. Remarks on Symmetric Lamb Waves with Dominant Longitudinal Displacements. J. Acoust. Soc. Am. 1993, 93, 2228–2230. [Google Scholar] [CrossRef]
  5. Rose, J.L.; Soley, L.E. Ultrasonic Guided Waves for Anomaly Detection in Aircraft Components. Mater. Eval. 2000, 50, 1080–1086. [Google Scholar]
  6. Rose, J.L.; Sun, Z.; Mudge, P.J.; Avioli, M.J. Guided Wave Flexural Mode Tuning and Focusing for Pipe Inspection. Mater. Eval. 2003, 61, 162–167. [Google Scholar]
  7. Hayashi, T.; Song, W.J.; Rose, J.L. Guided Wave Dispersion Curves for a Bar with an Arbitrary Cross-section, a Rod and Rail Example. Ultrasonics 2003, 41, 175–183. [Google Scholar] [CrossRef]
  8. Gao, H.; Shi, Y.; Rose, J.L. Guided Wave Tomography on an Aircraft Wing with Leave in Place Sensors. In Review of Quantitative Nondestructive Evaluation; AIP: New York, NY, USA, 2005; Volume 24, pp. 1788–1794. [Google Scholar]
  9. Lee, C.M.; Rose, J.L.; Cho, Y. A Guided Wave Approach to Defect Detection under Shelling in Rail. NDT E Int. 2008, 42, 174–180. [Google Scholar] [CrossRef]
  10. Puthillath, P.; Rose, J.L. Ultrasonic Guided Wave Inspection of a Titanium Repair Patch Bonded to an Aluminum Aircraft Skin. Int. J. Adhes. Adhes. 2010, 30, 566–573. [Google Scholar] [CrossRef]
  11. Van Velsor, J.; Royer, R.; Owens, S.; Rose, J.L. A Magnetostrictive Phased Array System for Guided Wave Testing and Structural Health Monitoring of Pipe. Mater. Eval. 2013, 71, 1296–1301. [Google Scholar]
  12. Philtron, J.H.; Rose, J.L. Mode Perturbation Method for Optimal Guided Wave Mode and Frequency Selection. Ultrasonics 2014, 54, 1817–1824. [Google Scholar] [CrossRef] [PubMed]
  13. Rose, J.L.; Borigo, C.; Owens, S.; Reese, A. Rapid Large Area Inspection from a Single Sensor Position: A Guided Wave Phased Array Scan. Mater. Eval. 2017, 75, 671–678. [Google Scholar]
  14. Chen, L.; Choi, W.R.; Lee, J.G.; Kim, Y.G.; Moon, H.S.; Bae, Y.C. Oil-Tank Weld Detection Using EMAT. Int. J. Hum. Robot. 2017, 14, 1750008. [Google Scholar] [CrossRef]
  15. Kim, Y.G.; Chen, L.; Moon, H.S. Numerical Simulation and Experimental Investigation of Propagation of Guided Waves on Pipe with Discontinuities in Different Axial Angles. Mater. Eval. 2016, 74, 1168–1175. [Google Scholar]
  16. Chen, L.; Kim, Y.G.; Bae, Y.C. Long Range Displacement Measurements Systems Using Guided Wave. Int. J. Fuzzy Log. Intell. Syst. 2017, 17, 154–161. [Google Scholar] [CrossRef]
  17. Perez, I.; Cui, H.-L.; Udd, E. Acoustic emission detection using fiber Bragg gratings. In Proceedings of the SPIE’s 8th Annual International Symposium on Smart Structures and Materials, Newport Beach, CA, USA, 4–8 March 2001; International Society for Optics and Photonics: Bellingham, WA, USA, 2001. [Google Scholar]
  18. Wild, G.; Hinckley, S. Acousto-ultrasonic optical fiber sensors: Overview and state-of-the-art. IEEE Sens. J. 2008, 8, 1184–1193. [Google Scholar] [CrossRef]
  19. Li, F.; Murayama, H.; Kageyama, K.; Shirai, T. Guided wave and damage detection in composite laminates using different fiber optic sensors. Sensors 2009, 9, 4005–4021. [Google Scholar] [CrossRef] [PubMed]
  20. Harish, A.V.; Ray, P.; Rajagopal, P.; Balasubramaniam, K.; Srinivasan, B. Detection of fundamental shear horizontal mode in plates using fibre Bragg gratings. J. Intel. Mater. Syst. Struct. 2016, 27, 2229–2236. [Google Scholar] [CrossRef]
  21. Ray, P.; Rajagopal, P.; Srinivasan, B.; Balasubramaniam, K. Feature-guided wave-based health monitoring of bent plates using fiber Bragg gratings. J. Intel. Mater. Syst. Struct. 2017, 28, 1211–1220. [Google Scholar] [CrossRef]
  22. Liu, G.; Philtron, J.H.; Zhu, Y.; Rose, J.L.; Han, M. Detection of Fundamental Shear Horizontal Guided Waves Using a Surface-bonded Chirped-fiber-Bragg-grating Fabry-Perot Interferometer. IEEE J. Lightwave Technol. 2018, 36, 2286–2294. [Google Scholar] [CrossRef]
  23. Hu, Y.; Zhao, M.; Li, S. Pipeline Defect Detection Based on Ultrasonic Guided Wave Technique Using Fiber Bragg Gratings. In Proceedings of the International Conference on Pipelines and Trenchless Technology (ICPTT), Wuhan, China, 19–22 October 2012; pp. 996–1010. [Google Scholar]
  24. Ray, P.; Srinivasan, K.; Rajagopal, P. Fiber Bragg Grating-based Detection of Cross Sectional Irregularities in Metallic Pipes. In Proceedings of the SPIE, 25th International Conference on Optical Fiber Sensors, Jeju, South Korea, 24–28 April 2017; pp. 1–4. [Google Scholar]
  25. Trémolet de Lacheisserie, E. Magnetostriction: Theory and Applications of Magnetoelasticity; CRC Press: Boca Raton, FL, USA, 1993; Volumes 339–352, pp. 359–361. [Google Scholar]
  26. Zhang, Q.; Zhu, Y.; Luo, X.; Liu, G.; Han, M. Acoustic Emission Sensor System Using a Chirped Fiber-Bragg-grating Fabry-Perot Interferometer and Smart Feedback Control. Opt. Lett. 2017, 42, 631–634. [Google Scholar] [CrossRef] [PubMed]
Figure 1. Global hybrid ultrasonic guided wave and fiber optic inspection system concept. The range of a conventional collar at position 0 can be increased beyond position X using a fiber optic sensor attached near position X. This allows the hybrid system to detect a flaw at a further distance, position Y.
Applsci 08 00727 g001
Figure 2. Schematic of the 21-foot pipe specimen. The SMS collar and the initial FBG sensor locations were 3 feet from the pipe end. Flaws were introduced at 13 feet and 10 feet from the pipe end. The side with flaw 2 will be referred to as the right side. Number and locations of the optical fiber sensors vary in the different experiments.
Applsci 08 00727 g002
Figure 3. Schematic of the integrated ultrasonic-optical system setup. A servo controller was used to keep the laser wavelength locked to the slope of the FBG spectrum for each channel. The optical signal was converted to a voltage signal and recorded using conventional ultrasonic hardware.
Applsci 08 00727 g003
Figure 4. F-Scan generated using an FBG sensor directly bonded to the bottom side of the pipe at 3 feet from the pipe end, collocated with SMS sending collar. Flaw indications are shown at 7 feet and 10 feet from the sensor. Pipe end reflections are shown at −3 feet and 18 feet. Indications at 3 feet and 13 feet are due to waves traveling from the SMS collar in the reverse direction and bouncing off the near end of the pipe at −3 feet, a result of imperfect directional control. The optical fiber sensor can clearly be used for flaw detection.
Applsci 08 00727 g004
Figure 5. F-Scan generated using the SMS collar in pulse-echo mode at 3 feet from the pipe end. Flaw indications are shown at 7 feet and 10 feet from the sensor. Pipe end reflections are shown at −3 feet and 18 feet. There is a higher signal-to-noise ratio for this setup. Note also that the dual coils allow for directional control of the received wave, suppressing the reverse waves shown in Figure 4.
Applsci 08 00727 g005
Figure 6. Waveform data (amplitude envelope) for SHM states with flaw growth of 0 to 2% CSA for the flaw located 7 feet from the optical fiber sensor. Waveforms are shown for an excitation frequency of 76 kHz using the SMS collar and a single direct-bonded FBG optical fiber sensor used as a receiver. As the flaw grows, the reflected ultrasonic wave energy from the flaw increases. The optical fiber sensor can clearly be used for flaw sizing.
Applsci 08 00727 g006
Figure 7. F-Scans collected using a direct-bonded FBG receiver collocated with the sending collar at several circumferential locations: (a) top; (b) right side; (c) bottom; and (d) left side of the pipe. Since the receiver is relatively far from the flaws, both flaws (red ovals) are clearly detectable at all circumferential locations. Flaw indications are marked by the red ovals. Arrows indicate the axial location of the fiber optic receiver. Distance is indicated from source/receiver position. When the receiver is relatively far from the flaw, i.e., multiple pipe circumferences, flaw detection is reliable at any circumferential location. Note that the indication in (c) at 13 feet (rectangle) is due to a reverse wave reflection.
Applsci 08 00727 g007
Figure 8. F-Scans collected using a direct-bonded FBG receiver 6 feet in front of the sending collar at several circumferential locations: (a) top; (b) right side; (c) bottom; and (d) left side of the pipe. Since the receiver is relatively close to the flaws, the best flaw detection occurs directly in line with the flaw location, while the detection at other circumferential locations is unreliable. Clear flaw indications are marked by the red ovals and less clear or undetectable flaw indications are marked by dashed red ovals. Arrows indicate the axial location of the fiber optic receiver. Distance is indicated from the sending collar. When the receiver is near the flaw, but not at the same circumferential location, flaw detection is not reliable, due to the use of a point-like sensor.
Applsci 08 00727 g008
Figure 9. Schematic showing sensor locations for array groups 1 (above) and 2 (below). Fiber optic sensors are indicated by green rectangles and the optical fiber is indicated by the blue line. Dashed lines indicate the optical fiber and sensor on the far side of the pipe. The pipe is being viewed from the right side (flaw 2 side).
Applsci 08 00727 g009
Figure 10. F-Scans of the processed group waveforms for both (a) group 1 and (b) group 2 fiber optic sensor arrays. Flaws (red ovals) are clearly detected at 7 feet and 10 feet from the sending collar across a wide range of frequencies. The far pipe end reflection is detected at 18 feet. Note that groups 1 and 2 both detect the flaws even though group 2 has multiple sensors near flaws in non-ideal locations for efficient flaw detection.
Applsci 08 00727 g010

