Article

Deep Embedment (DE) FRP Shear Strengthening of Concrete Bridge Slabs under Loads Close to Supports

Department of Civil Engineering, Dongguan University of Technology, No. 1, University Road, Dongguan 523808, Guangdong, China
*
Author to whom correspondence should be addressed.
Appl. Sci. 2018, 8(5), 721; https://doi.org/10.3390/app8050721
Submission received: 10 April 2018 / Revised: 28 April 2018 / Accepted: 30 April 2018 / Published: 4 May 2018
(This article belongs to the Special Issue Emerging Construction Materials and Sustainable Infrastructure)

Abstract

:
Shear forces are the most common governing failure mechanism of reinforced concrete bridge deck slabs subjected to loads close to their supports. This paper reveals a comprehensive study of the behaviour of concrete slabs shear-strengthened with a deep embedment fibre reinforced polymer (FRP) technique. In the experimental investigation, a series of eight full scale concrete slabs were created and tested up to failure. Several structural variables were changed to assess the effectiveness of this shear strengthening technique. The behaviour of test slabs is discussed and the influence of this strategy was evaluated by comparing the test results. It was shown that brittle shear failures could be avoided by using this strengthening strategy. The ultimate capacity and deflection at the failure were both enhanced by using the deep embedment strengthening method. Additionally, a nonlinear finite element analysis (NLFEA) was proposed to develop further investigation. This NLFEA model gave excellent predictions for the structural behaviour of the test concrete slabs. Finally, a two-way theoretical model was proposed to predict the loading-carrying capacity of concrete slabs strengthened with deep embedment FRP bars. The ultimate strength predicted by this theoretical method showed good agreement with that from the test results.

Graphical Abstract

1. Introduction

Reinforced concrete slabs subjected to concentrated loads near linear supports are commonly found in practice, such as in bridge deck slabs [1]. The structural elements are characterized by high shear forces concentrated in the region between the concentrated loads and the linear support. Due to the increasing traffic loads and heavy truck loads close to supports, the existing bridge deck slabs could fail due to shear. Thus, more massive constructions or shear reinforcements are now required in bridge deck slabs [2]. This raises the question of whether there is a lack of safety for existing bridge deck slabs that were built mainly without shear reinforcement, or whether deck slabs under concentrated wheel loads exhibit reserves of shear capacity, which are neglected in current design codes [3].
Shear strengthening techniques based on the use of fibre reinforced polymer (FRP) materials have been proposed and developed in the past thirty years [4,5]. Externally bonded (EB) FRP is the most commonly used method for strengthening concrete structures using FRP material. To increase the shear behaviour of reinforced concrete structures, FRP sheets are generally applied on the side surface of concrete elements. Additionally, the near-surface-mounted (NSM) FRP rod method is another technique used to increase the shear resistance. In the NSM method, FRP rods are embedded grooves intentionally prepared on the concrete cover of the side faces of concrete structures. The efficiency of these strengthening schemes relies on the bond performance of concrete-adhesive-FRP interfaces. However, those two strengthening methods cannot be applied to increase the shear capacity of concrete deck slabs due to an inaccessible web of structures. Therefore, a new strengthening approach is adopted (see Figure 1): vertical holes are drilled into the deck slabs upwards from the soffit in the shear zones, high-viscosity epoxy resin is injected, and then FRP bars are embedded in place. This strengthening method is called deep embedment strengthening [6] or embedded through-section (ETS) strengthening [7]. Previous research [8,9,10] revealed that this strengthening technique provided higher strengthening efficiency compared to the EB and NSM strengthening methods. In addition, the shear capacity of strengthened concrete beams can be enhanced by this strengthening method [8,9,10].
The aim of this paper is to study the structural behaviour of one-way reinforced concrete slabs in bridge deck structures strengthened with deep embedment FRP bars, see Figure 2. A series of experimental tests were carried out to investigate some structural variables on the behaviours of those slabs, which included deep embedment strengthening materials, spacing and diameter of deep embedment strengthening FRP bars, and the drilling of holes. After comparing the results of different test specimens, the influence of the deep embedment strengthening scheme on ultimate strength and failure mode was discussed and presented. An understanding of the effect of deep embedment shear strengthening method on the behaviour of concrete deck slabs can be extended. In addition, a nonlinear finite element analysis (NLFEA) model was developed simulate the behaviour of test slabs. The results from this NLFEA model showed good convergence ability and gave good agreement with test results in the validation analysis. Finally, a tow-way design approach for the prediction of ultimate capacity of concrete slabs strengthened with deep embedment FRP bars is proposed. The loading-carrying capacity predicted by this method showed good correlation with the test results.

2. Background of Shear Behaviour of Concrete Bridge Deck Slabs

The desired failure mode of bridge deck slabs is a ductile failure model, allowing large deformations and significant redistribution of inner forces within the structures before collapse. Therefore, the typical concrete bridge deck slabs are designed for flexure and are checked according to the lower requirements for shear and punching of that area. Currently, due to an increase in traffic loads, heavy design truck loads are used in the live load modes in current design codes. In addition, the position of those heavy truck loads is close to the support of the deck structures. Therefore, the governing failure mechanism of reinforced concrete deck slabs subjected to the concentrated load close to the support is commonly shear, as it has been shown in experimental tests in the literature [11,12,13,14]. The experimental test results by Rodirgues [11] and Lantsoght et al. [13] showed that the observed reinforced concrete bridge decks might be hybrid situations between shear and punching shear, and the shear or punching shear was the determinant failure mechanism. Therefore, a large shear problem emerges for existing bridge deck slabs. Most of them do not contain any shear reinforcement in the area between the web of the bridge and the deck slab. Therefore, the requirement of structural safety often cannot be satisfied.

3. Experimental Programme

3.1. Details of Test Slabs

The experimental test specimens were created to investigate the behaviour of one-way slabs representative of the typical sections of full scale bridge deck slabs. According to previous tests of one-way shear behaviour of concrete deck slabs by the authors [15], the test slabs were 2400 mm long × 400 mm width × 200 mm depth, as illustrated in Figure 2 and Figure 3. A summary of the experimental details is presented in Table 1 and Figure 2. It is shown that the experimental programme involves eight test slabs. As presented in Table 1, the name of the test specimen includes all of its structural variables. For example, for the test specimen S-C-2-9, C is the strengthening material of CFRP (Carbon Fiber Reinforced Polymer), 2 is the strengthening configuration of two rows of embedment bars (see Figure 2c), and 9 is the diameter of embedment bars. Therefore, the variables to be investigated in this test are as follows:
  • Influence of strengthening materials, including steel, BFRP (Basalt Fiber Reinforced Polymer), GFRP (Glass Fiber Reinforced Polymer), and CFRP (test specimens labelled as S-S-2-10, S-B-2-9, S-G-2-9, and S-C-2-9);
  • Influence of quantity of strengthening embedment bars (test specimens labelled as S-C-2-9 and S-C-1-9). The strengthening configuration is shown in Figure 2c,d;
  • Influence of diameter of embedment bars (test specimens labelled as S-C-2-9 and S-C-1-13).
In addition, the control specimen, not strengthened with embedded bars, is labelled as S-Con. An unstrengthened test slab with drilling holes coded as S-D-1 is adopted to investigate the structural damage degree from the drilling-hole process. The test slabs were constructed by using normal-weight ready mixed concrete. The concrete average compressive strength (fcu) of the test slabs was evaluated at 28 days by carrying out direct compression tests on cube specimens of 100 mm × 100 mm × 100 mm. We obtained fcu values between 24.1 MPa to 26.1 MPa at 28 days. For the internal reinforcement of the slab strips, high bond steel bars of 16 and 18 mm diameter were used. The configuration of internal reinforcement in the test slabs is shown in Figure 4 and Figure 5. The yielding stress and tensile strength were obtained by means of uniaxial tensile tests. We obtained an average of 438 MPa and 458 MPa, respectively. The test method for the embedded steel bars was the same as the internal reinforcement. The test method for the embedment FRP bars was carried out according to the requirement of ACI 440-R06 [16] with the loading rate of 0.2 N/s. The test results of embedment strengthening bars are shown in Table 2. To bond the ETS steel bars to the concrete substrate, an FY-Z epoxy based adhesive was used. The tensile behaviour and elastic modulus of this adhesive were obtained by carrying out direct tensile tests. As shown in Table 2, the tensile strength and elastic modulus of the FY-Z epoxy are 40.5 MPa and 1.2 GPa, respectively.

3.2. Strengthening Technique

To simplify the drilling process and avoid intersecting the longitudinal bars, the deep embedment strengthening process was executed with a special drilling machine invented by the authors, as shown in Figure 6, which can be used in vertical and inclined embedment strengthening, as shown in Figure 6a,b. The strengthening steps are: (1) Holes = 1.5 times of the diameter of embedded bars are drilled through the depth of concrete slabs. During the drilling process, the concrete dust is aspired using a vacuum system (see Figure 1a); (2) The holes are cleaned using a helicoid-shaped steel brush capable of removing the particles from the walls of the hole, the particles are then eliminated by the vacuum system (see Figure 1b); the cleaning procedure is repeated until the dust is totally removed; (3) The epoxy resin is prepared according to the recommendations of the supplier, and is slowly poured into the holes (see Figure 1c); (4) The deep embedment bars are cut in the desired length, cleaned with acetone, and are slowly introduced into the holes, removing the excess resin (see Figure 1d). To guarantee a proper curing of the adhesive, the specimens are tested at least two weeks after the deep embedment application.

3.3. Test Set-Up and Monitoring System

As shown in Figure 7, the slab strips are tested in three-point load flexure. The load was applied at a distance of three times the effective depth of test slabs (see Figure 2), which was chosen to allow the shear capacity to be larger than the flexural capacity in the unstrengthened test slabs. To meet the objective and the scope of the study, a very comprehensive and carefully engineered measuring scheme was adopted for the study (Figure 7 and Figure 8). The vertical displacement of the test specimens was measured using six linear variable-displacement transducers as shown in Figure 7. The exact positions of those displacement transducers are shown in Figure 8a. As shown in Figure 8b, the vibrating wire strain gauges were located at the midspan, the one-fourth span, and the ends of the concrete slabs. The electrical resistant strain (ERS) gauges were glued to the transverse steel reinforcing bars and embedded steel/FRP bars to monitor strain values at different loading stages, such as yielding in steel and maximum strain in FRP. The positions of those ERS gauges are shown in Figure 8c. Readings of all the displacement transducers and strain gauges were recorded at each load increment.

3.4. Test Procedure

In each test, to ensure that the deflections were not influenced by the settling (e.g., softboard), two preliminary test loads (20–25 kN) were held for two minutes and the recovery measured. The test model was then loaded in 20 kN increments until cracking occurred on the bottom surface. After cracking on the bottom surface of the slab appeared, the load increment was decreased to 5–10 kN until failure. At each load increment, the surface was examined and the crack propagation recorded. After testing, the models were carefully removed and photographed to reveal the distribution of cracks on the two lateral sides of the slabs.

4. Discussion of Test Results

4.1. Failure Mode and Ultimate Loads

Figure 9a,b shows the propagation of crack patterns through the depth of the unstrengthened test slabs. For those two test specimens, it can be found that the first flexural cracks started to appear in the moment zone at an applied load of 25 kN. Those flexural cracks propagated upwards as the load was increased. Flexural cracks then formed over wider areas until a load of 100 kN, when diagonal shear cracks appeared in the shear zone. The unstrengthened test specimens both failed in brittle shear at around 130 kN. The loading procedure had to be terminated, as shown in Figure 10. Those two concrete slabs were separated to two components through this diagonal shear crack, see Figure 10a. In addition, the crack pattern of the test slabs with drilling holes (test specimen coded as S-D-1) was similar as that in the control model (S-Con). The ultimate capacities of those two models are also close, as shown in Table 1. This indicates that the drilling procedure does not cause significant structural damage for the concrete slabs.
The crack patterns of all the strengthened test slabs are shown in Figure 9c–h. Similar to the unstrengthened slabs, multiple flexural cracks formed in the moment zone up to the appearance of shear cracks (the applied load reached 100 kN). As the applied load increased, the inclined shear crack appeared in the shear zone, particularly in the area between two embedment strengthening bars, as shown in Figure 9c–f. Interestingly, these shear cracks are prevented from opening further by the deep embedment strengthening bars. In addition, no shear cracks formed in the test slabs strengthened with large embedment bars (test specimen S-C-1-13). This indicates that the embedment strengthening bars crossed by the cracks are successful in preventing shear failure. Thus, the strengthened specimens are forced to a ductile flexural failure, as shown in Figure 10 and Figure 11. When the applied load reached the ultimate strength, the failure mode of all the test slabs with deep embedment bars was concrete crush at the loading positions. In all the tests, no debonding failure of embedment strengthening bars occurred. Due to this high bond-slip behaviour, the embedment strengthening materials do not influence the crack pattern and failure mode significantly.
The ultimate loads of all the test slabs are shown in Table 1. The application of deep embedment strengthening methods results in larger ultimate capacity of test slabs. The loading carrying capacity was enhanced by more than 10% by this strengthening method. As discussed in the section on crack pattern and failure mode (see Figure 9 and Figure 10), the test slabs with deep embedment strengthening methods failed in flexure tests. Because this strengthening method has no effect on flexural behaviour and flexural capacity of the unstrengthened test slab is larger than the shear capacity, increasing the degree of the ultimate capacity (around 10%) is not as significant as that obtained in the test results of the embedment strengthened concrete beams (around 30–40%) [8,10]. Additionally, the variation of strengthening materials and strengthening ratios did not have a significant effect on ultimate capacity of the strengthened test slabs.

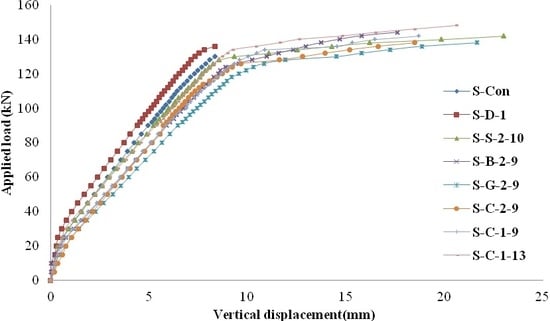
4.2. Load vs. Deflection Responses

Figure 11 shows the curves representing the load versus the maximum vertical deflection (T3 as shown in Figure 8a) at the loading position for all the test slabs. For the unstrengthened test slabs, the bilinear behaviour of the load-deflection curves is characteristic of a shear failure. The first part of this curve is up to flexural crack load (around 25 kN), while the second part represents the crack slab with reduction stiffness. When the applied load reached the shear capacity, the applied load was terminated suddenly. This corresponds to the observation of the test process (see Figure 10). Before the applied load reached the shear capacity of the concrete slabs, the behaviour of the load-deflection response of the strengthened test slabs was similar to that of the unstrengthened test slabs, see Figure 11. As the load increased, the application of the deep embedment shear strengthening method resulted in higher ductile structural response compared to the unstrengthened test slabs. Figure 11 reveals that the strengthened specimens showed a greater overall stiffness compared with the S-Con and S-D-1 slabs. Using this strengthening scheme, the test specimens strengthened with deep embedment bars, which reached their flexural capacity (see Figure 11), failed in a ductile manner. Therefore, the slabs with deep embedment strengthening methods exhibited a higher deflection at the loading point and maximum load at failure compared to unstrengthened test slabs (see Figure 11).
Generally, the ductility of reinforced concrete flexural components can be considered as the ability to sustain inelastic deformation without degeneration of loading-carrying capacity before structural failure. Based on this theoretical assumption, deformation or energy absorption can be defined as structural ductility. For steel reinforced concrete flexural components, ductility can be expressed as the ratio of ultimate deformation to deformation at yield. Therefore, the ductility of all the test slabs can be evaluated by means of a deformation factor (DF) [17]. This factor is defined as a ratio of the energy absorption at failure (area under load-deflection curve up to ultimate load) to that at service load (at the serviceability deflection limit of span/800 [18]). The results of DF values for all the test slabs are listed in Table 3. It was found that the embedment strengthening method improved the ductility of the strengthened test slabs significantly as reported in the test results of deep embedment strengthening concrete beams [6,7]. As shown in Table 3, it can be seen that using this strengthening scheme resulted in increasing the DF values by around 200%. This suggests that the ductility of concrete slabs subjected to loads close to the support is enhanced significantly by deep embedment strengthening methods. As expected, the concrete slabs strengthened with deep embedment steel bars attained the largest DF of 28.67, due to having the highest strengthening stiffness. As shown in Table 1, the decrease in stiffness of strengthening materials results in slightly smaller DF values of strengthened concrete slabs.

4.3. Strain Response

Figure 12 presents the curves of the load versus the maximum compressive strain of concrete slabs for the test specimens. It was observed that the curves have the same tendency for all the test specimens before the applied load reached the around 130 kN. This loading corresponds to the shear failure load of the unstrengthened test slab. Due to shear failure of the concrete slabs, the maximum compressive strain of concrete in the unstrengthened slab did not reach the crush strain (0.003) at the ultimate load. As the applied load increased, the compressive strain of all the strengthened test slabs increased more than the crush strain of concrete (0.003). It is noted that the failure mode of strengthened concrete slabs is flexural failure with concrete crush, which can be found in the observation of the test results (see Figure 10).
Figure 13 and Figure 14 illustrate the relationship of applied load and maximum tensile strain in longitudinal steel reinforcement and embedment strengthening bars. It can be seen in Figure 13 that all the curves of load versus maximum tensile strain in steel reinforcement have a similar tendency for all the test specimens. This means that using the deep embedment strengthening method does not have a strong effect on the contribution of steel reinforcement to the ultimate capacity of the concrete slabs. Examination of the curves in Figure 14 reveals that none of the deep embedment strengthening bars contributed to the loading carrying capacity before they reached the shear cracking load (around 100 kN). All the strain values reported in this paper are the maximum measured values. After the applied load increased beyond 100 kN, the strain in the deep embedment bars started to increase to a large value (see Figure 14), the level at which the concrete slabs failed. It can be summarised that the deep embedment strengthening material started to contribute to shear resistance after the formation of the concrete struts in the shear behaviour. After the embedment bars started to contribute to the shear capacity, the strain in all the test slabs was increased with a constant slope. Additionally, the maximum strain value of steel embedment bars at failure is smaller than those in embedment FRP bars, which could be due to the larger stiffness in steel bars compared to the FRP materials.

5. Finite Element Analysis

5.1. Proposed NLFEA Model

The proposed NLFEA model is a two-dimensional finite element (FE) model that was implemented in ABAQUS [19], as shown in Figure 15. This NLFEA model is on the basis of the smeared cracked approach so that the crack paths do no need to predefined, and it employs the crack band model to overcome the mesh sensitivity problem associated with the smeared crack model. An appropriate bond-slip model published in the literature [20,21] is adopted to simulate the bond-slip interaction between the concrete and deep embedment FRP bars. Further details of the NLFEA model are presented in the following section.

5.2. Modelling of Concrete Material

In this numerical study, a material model named Concrete Damage Plasticity Model [22,23] was adopted based on the previous testing of concrete deck slabs [24]. This model assumes non-associated potential plastic-flow where the flow potential is defined by the Drucker-Prager hyperbolic function and the yield function. The equation by Thorenfeldt et al. [25] combined with the Hognestad’s [26] assumption on the elastic modulus of concrete were used to model compressive stress vs. strain relationship of concrete material. This model was given by Equations (1) to (5).
f c f c = ε c ε c n n 1 + ( ε c / ε c ) n k
ε c = f c E c n n 1
n = 0.8 + f c 17
When ε / ε c is less than 1, k equals 1. When ε / ε c exceeds 1, k is a number larger than 1.
k = 0.67 + f c 62
E c = 4723 f c
The tensile response of reinforced concrete is modelled using a non-linear tension stiffening model. Tension stiffening is influenced by the reinforcement ratio, crack spacing, and quality of the bond between the concrete and reinforcement. Before the occurrence of cracks, the tension behaviour of concrete was assumed to be linear. After this stage, the stress and strain relationship of concrete under uniaxial tension was expressed as below [27,28,29]:
σ t f t = [ 1 + ( c 1 w t w c r ) 3 ] e ( c 2 w t w c r ) w t w c r ( 1 + c 1 3 ) e ( c 2 )
w c r = 5.14 G F f t
where wt is crack open displacement; wcr is cracking opening displacement at the complete release of stress or fracture energy; σt is tensile stress normal to crack direction; ft is concrete uniaxial tensile strength; GF is fracture energy required to create a stress-free crack over a unit area; and c1 = 3.0 and c2 = 6.93 = constants determined from tensile tests of concrete. In this study, GF could be estimated from the equation of CEB-FIB [30] as below:
G F = ( 0.0469 d a 2 0.5 d a + 26 ) ( f c 10 ) 0.7
Additionally, the damage parameters are defined for compressive failure and tension failure in this material model. The evolution of the compressive damage component dc is linked to the corresponding plastic strain ε c p l which is determined proportional to the inelastic strain ε c i n = ε c σ c E c 1 using constant bc with the expression of ε c p l = b c ε c i n .
d c = 1 σ c E c 1 ε c p l ( 1 / b c 1 ) + σ c E c 1
In Equation (9), bc is equal to 0.7 according to the reported experimental test results [31]. Similar to the Equation (9), the tensile damage dt depends on ε t p l   and experimentally determined parameter bt = 0.1 [32]. Therefore, the unloading is assumed to return almost back to the origin and to leave only a small residual strain (see Equation (10)).
d t = 1 σ t E c 1 ε t p l ( 1 / b t 1 ) + σ t E c 1
where ε t p l = b t ε t i n and ε t i n = ε t σ t E t 1 .

5.3. Modelling of Steel and FRP Bars

The deep embedment FRP bars and steel reinforcement were represented using truss elements. Those elements are only deformable in the axial direction, whilst bending and shear deformations are not allowed. In the proposed FE model, the material models for steel and FRP are assumed to be elastic-perfectly plastic and linear-elastic-brittle, respectively. Von Mises yield criterion with associated plastic flow and isotropic hardening are used for those two materials.

5.4. Modelling of FRP Bar–to-Concrete Interface

For modelling the interaction between the deep embedment FRP bars and the surrounding concrete, the interface element coded as COH2D4 in ABAQUS is used. For the direction parallel to the FRP-concrete interface, the properties of the interfacial elements are defined by using the bond-slip model by Mofidi et al. [20]. The ascending branch is this model is a parabolic bond stress-slip relationship, up to the bond strength ( τ m ), and given by
τ = τ m ( s / s m ) α
The descending branch is described by the following linear relationship:
  τ = τ m [ 1 p ( s / s m 1 ) ]
where τ is the bond stress at a specific slip s , s m is the slip value at τ m , α is a curve-fitting parameter, and p is a parameter controlling the descending part of the bond-slip relationship [20]. A series of direct pull-out tests were conducted to determine those variables, see Figure 16. On the basis of the similar experimental test results, those coefficients were determined as shown in Table 4.

5.5. Solution Strategy

Due to the brittle behaviour of shear failure, numerical instability and convergence problems could occur in the traditional static analysis-implicit analysis [24]. In this study, a dynamic approach in explicit analysis was employed for the numerical solution of the FE model [33]. In this method, the quasi-static analysis is developed with small load increments. However, this analysis procedure does not terminate after structural failure. Therefore, a failure criterion based on balances of forces is adopted in this numerical analysis. As shown in Figure 17, the reaction load is nearly equal to the applied load before the failure. The balance of those two loads was broken as soon as the occurrence of punching failure. A detailed description of the quasi-static solution strategy is given in Zheng et al. [33].

5.6. FE Model Validation

Based on the numerical model and failure criterion presented above, NLFEA of the deep embedment FRP strengthened concrete slabs was conducted. The accuracy of NLFEA model was evaluated by comparing the test results with the numerical predictions. Those comparisons included loading-carrying capacity, load-deflection response, crack patterns, and strain values in deep embedment FRP bars and steel reinforcement. The experimental and NLFEA predicted loading-carrying capacities are given in Table 5. The overall mean predicted/experimental ultimate strengths ratio is 1.01. The standard deviation and coefficient of variation of this validation study are both 0.03. Figure 18 demonstrates that there is a very good match between experimental and NLFEA-predicted load-vertical deflection response from initial loading up to structural failure. It was found that the trend of the load-deflection responses in the test and numerical results were similar, particularly in the ductile behaviour in the deep embedment FRP strengthened concrete slabs. However, it was found that the prediction from the NLFEA simulation was stiffer than that in the test results. This over-stiff phenomenon is also found in the comparison of load vs. maximum strain in steel reinforcement, see Figure 19. This could be due to the major drawback of smeared crack and perfect bonding assumptions used in this study [34]. Interestingly, the proposed NLFEA model accurately predicted the load-strain in deep embedment FRP bars based on the bond-slip model discussed above, as shown in Figure 20. The FE cracking patterns at ultimate loads are illustrated in Figure 21. By comparing to the cracking pattern in the test (see Figure 9 and Figure 10), the proposed numerical model gives accurate prediction in crack propagations and failure modes of deep embedment FRP strengthened concrete slabs. Based on the validation analysis results, it can be summarised that the proposed NLFEA model and solution strategy are suitable for the objective of this structural analysis. Therefore, this NLFEA model can be adopted to develop further studies of the structural performance of this strengthened concrete structure in the future.

6. Loading-Carrying Capacity Prediction Method

In this study, a design model is proposed to predict the loading-carrying capacity of concrete slabs shear strengthened with deep embedment FRP bars. It was found in the test that the failure mode of concrete slabs could be varied from brittle shear failure to ductile flexural failure by using the deep embedment strengthening method. As a result, a two-way prediction approach, including bending and shear ultimate strengths, is adopted in this paper as shown below:
Flexural Capacity: 
The flexural capacity of concrete slabs is predicted by using the equations in a bridge structure design code named BS5400 [35], which is given by:
M b = ρ f y b d 2 ( 1 0.59 ρ f y / f c u )
P b = l 0 ( l 0 a ) a M b
In Equation (13), ρ is the steel reinforcement percentage, b and d are width and effective depth of concrete slabs respectively, f y and f c u are yield strength of steel bars and concrete strength, respectively. In order to relate the bending moment (Mb) to the applied load (Pb), relevant elastic analysis is adopted as shown in Equation (14).
Shear Capacity: 
The shear capacity of concrete slabs shear strengthened with deep embedment FRP bars is considered as the combination of the contribution of concrete and deep embedment FRP bars. In this study, the contribution of concrete to shear capacity is predicted by the design method in BS 5400 [35], due to the consideration of the influence of longitudinal steel reinforcement in this theoretical model, which is given by Equation (15) [35].
  P c s = 0.79 · ( 100 ρ ) 1 3 · ( 400 d ) 1 4 · ( f c u 25 ) 1 3 b d
A theoretical model proposed by Mofidi et al. [20] is adopted to predict the shear capacity contributed by the application of deep embedment FRP shear strengthening method, as shown in Equation (16).
P F R P s = k l · k s A f r p · E f r p · ε f r p · D f r p ( sin θ + cos θ ) s f r p
where A f r p is deep embedment FRP bar cross-sectional area, d f r p is effective shear depth (the greater of 0.72 h and 0.9 d), θ is inclination angle of FRP bars (90 degrees for this test), s f r p is spacing between FRP bars. ε f r p is effective strain in FRP bars, which can be calculated as below:
ε f r p = 8 D f r p · E f r p ( τ m · s m 1 + α )   0.004
In Equation (16), D f r p is diameter of FRP bars used in deep embedment strengthening, E f r p is elastic modulus of FRP bars. τ m , s m , and α are coefficients in the BPE (Eligehausen, Popov, and Bertero Model) modified bond-slip model [36] using in this theoretical model. The values of those coefficients are shown in Table 4 based on the bonding test results. In addition, k l is a decreasing coefficient ( 0 k l 1 ) that represents the effect of FRP bars having an anchorage length shorter than the minimum anchorage length needed (Leff as shown in Equations (19) and (20)). The effective anchorage length coefficient ( k l ) can be determined using the following equations:
k l = {     1 d e f f 2 L e f f d f r p E f r p · D f r p 2 · s m τ m · 1 + α ( 1 α ) 2   d f r p 2 L e f f
L e f f ( s m ) = f ( s m ) · D f r p 4 τ m · 1 + α 1 α
f ( s m ) = 8 E f r p D f r p · τ m · s m 1 + α
Additionally, k s accounts for the effect of the internal stirrup on the effective strain of strengthening FRP bars. Due to no stirrup used in this test, k s can be set to 1 [20]. Therefore, the shear capacity of the concrete slabs shear strengthened with deep embedment FRP bars can be determined as:
P s = P c s + P F R P s
Based on the calculation procedure discussed above, the loading-carrying capacity of the test slabs in this study can be expressed as below:
I f   P b < P s P p = P b I f   P b > P s P p = P s
Table 6 presents the comparison of the loading-carrying capacities from the test results and the theoretical models discussed above. It can be noted that the adopted theoretical method yielded accurate and reliable predictions with an average Pp/Pt of 0.96 and a corresponding COV (Coefficient of variation) of 3%. Additionally, using the deep embedment strengthening scheme results in increasing shear strength of the concrete slabs, which is enhanced to be equal to or more than the flexural strength of those slabs in this theoretical prediction (see Table 6). This indicates that the failure mode is varied from brittle shear failure to ductile flexural failure, which corresponds to the test results.

7. Conclusions

This paper presents the results of an experimental investigation involving eight tests on concrete slabs strengthened with deep embedment FRP bars subjected to loads close to the supports. A NLFEA model was proposed to simulate the structural behaviour of the test slabs. The accuracy of the proposed numerical model was validated by using the experimental results in this study. Additionally, a design method for prediction of loading-carrying capacity, including flexural and shear capacity, was adopted. The ultimate capacity predicted by this method showed good agreement with the test results. The main findings of this research are shown as follows:
  • Due to the loading location close to the support, shear failure occurred in the unstrengthened test slabs. The failure mode is brittle and sudden. The deep embedment shear strengthening technique can be used to avoid the occurrence of shear failure of concrete slabs subjected to load close to supports. It was found that the failure mode of concrete slabs varied from brittle shear failure to ductile flexural failure. This was attributed to the broken continuity of shear cracking development by the deep embedment strengthening method.
  • It was found that the material type of embedment strengthening materials does not influence the behaviour of strengthened test slabs. Interestingly, increasing the diameter of embedded FRP bars results in larger ultimate capacity and higher ductility.
  • Due to the small flexural stiffness of test slabs, the ultimate capacity was enhanced by around 10% by using the deep embedment strengthening method. However, the ductility of the test slabs was improved significantly. The maximum vertical deflection of concrete slabs at failure was increased by more than 100%, and the ductility was increased by more than 200%.
  • A NLFEA model for the concrete slabs shear strengthened with deep embedment FRP bars was developed and validated using the test results in this study. This NLFEA model shows a good capability of simulating the structural behaviour of the test slabs accurately, including the ultimate capacity, strain response, and cracking patterns. This numerical model can be used by engineers and researchers for the structural analysis and assessment of the structural performance of concrete slabs strengthened with deep embedment FRP bars.
  • By using the model by Modifi et al. [20] to predict the shear resistance contributed by deep embedment FRP bars, a two-way design approach was proposed in this study, in which flexural and shear capacity were predicted separately. With the comparison of the test results, it was found that this theoretical model can predict the loading-carrying capacity and failure mode of the strengthened concrete slabs accurately.

Author Contributions

Lipeng Xia and Yu Zheng conceived and designed the experiments; Lipeng Xia performed the experiments; Lipeng Xia and Yu Zheng analyzed the data; Lipeng Xia and Yu Zheng wrote the paper.

Acknowledgments

The authors wish to express their sincere appreciation of the Guangdong Science and Technology Planning (No. 2016A010103045), the Innovation Research Project by Department of Education of Guangdong Province (No. 2015KTSCX141), the National Science Natural Science Foundation of China (No. 51678149), and Division of Transportation Guangdong Province (No. 2013-02-029) in supporting this research.

Conflicts of Interest

The authors declare that there are no conflicts of interest regarding the publication of this paper.

References

  1. Francisco, N.; Miguel, F.R.; Aurelio, M. Shear strength of RC slabs under concentrated loads near clamped linear support. Eng. Struct. 2014, 76, 10–23. [Google Scholar]
  2. Rombach, G.A.; Latte, S. Shear resistance of bridge decks without shear reinforcement. In Tailor Made Concrete Structures; Walraven, J.C., Stoelhorst, D., Eds.; Taylor & Francis Group: London, UK, 2008. [Google Scholar]
  3. Rombach, G.; Kohl, M. Shear design of RC bridge Deck slabs according to Eurocode 2. J. Bridg. Eng. 2013, 18, 1261–1269. [Google Scholar] [CrossRef]
  4. Teng, J.G.; Chen, J.F.; Smith, S.T.; Lam, L. Behaviour and strength of FRP-strengthened RC structures: A state-of-the-art review. Proc. ICE—Struct. Build. 2003, 156, 51–62. [Google Scholar] [CrossRef]
  5. Lorenzis, D.L.; Teng, J.G. Near-surface mounted FRP reinforcement: An emerging technique for strengthening structures. Compos. Part B Eng. 2007, 38, 119–143. [Google Scholar] [CrossRef]
  6. Valerio, P.; Ibell, T.J.; Darby, A.P. Deep embedment of FRP for concrete shear strengthening. Proc. Inst. Civ. Eng. Struct. Build. 2009, 162, 311–321. [Google Scholar] [CrossRef]
  7. Chaallal, O.; Mofidi, A.; Benmokrane, B.; Neale, K. Embedded through-section FRP rod method for shear strengthening of RC beams: Rerformance and comparison with existing techniques. J. Compos. Constr. ASCE 2011, 15, 374–383. [Google Scholar] [CrossRef]
  8. Valerio, P.; Ibell, T.; Darby, A. Shear assessment and strengthening of contiguous-beam concrete bridges using FRP bars. In Proceedings of the 7th International Symposium on Fiber Reinforced Polymer Reinforcement for Concrete Structures (FRPRCS-7), Kansas City, MO, USA, 6–9 November 2005; pp. 825–848. [Google Scholar]
  9. Jemaa, Y.; Jones, C.; Dirar, S. Deep embedment strengthening of full-scale shear deficient reinforced concrete beams. In Proceedings of the 12th International Symposium on Fiber Reinforced Polymers for Reinforced Concrete Structures (FRPRCS-12), Nanjing, China, 14–16 December 2015. [Google Scholar]
  10. Barros, J.A.O.; Dalfré, G.M.; Trombini, E.; Aprile, A. Exploring the possibilities of a new technique for the shear strengthening of RC elements. In Proceedings of the International Conference of Challenges Civil Construction (CCC2008), Porto, Portugal, 16–18 April 2008. [Google Scholar]
  11. Rodrigues, V.R. Shear Strength of Reinforced Concrete Bridge Deck Slabs. Ph.D. Thesis, Ecole Polytechnique F′ed′erale de Lausanne, Lausanne, Switzerland, 2007. [Google Scholar]
  12. McComb, C.; Tehrani, F.M. Enhancement of shear transfer in composite deck with mechanical fasteners. Eng. Struct. 2014, 76, 10–23. [Google Scholar] [CrossRef]
  13. Lantsoght, E.; Veen, C.V.; Walraven, J. Shear tests of reinforced concrete slabs with concentrated load near to supports. In Proceedings of the 8th fib-PhD Symposium, Kongens Lyngby, Denmark, 20–23 June 2010; pp. 81–86. [Google Scholar]
  14. Breveglieri, M.; Aprile, A.; Barros, J.A.O. Embedded Through-Section shear strengthening technique using steel and CFRP bars in RC beams of different percentage of existing stirrups. Compos. Struct. 2015, 126, 101–113. [Google Scholar] [CrossRef] [Green Version]
  15. Zheng, Y.; Li, C.H.; Yang, J.B.; Sun, C. Influence of arching action on shear behaviour of laterally restrained concrete slabs reinforced with GFRP bars. Compos. Struct. 2015, 132, 20–34. [Google Scholar] [CrossRef]
  16. American Concrete Institute (ACI). Guide for the Design and Construction of Concrete Reinforced with FRP Bars; ACI 440.1R-06; ACI: Farmington Hills, MI, USA, 2006. [Google Scholar]
  17. Mohamed, S.I.; Ibrahim, M.M.; Sherif, M.E. Influence of fibers on flexural behavior and ductility of concrete beams reinforced with GFRP rebars. Eng. Struct. 2011, 33, 1754–1763. [Google Scholar]
  18. American Association of State Highway and Transportation Officials (AASHTO). Standard Specifications for Design of Highway Bridges; American Association of State Highway and Transportation Officials: Washington, DC, USA, 2000. [Google Scholar]
  19. HKS (Hibbitt, Karlsson & Sorensen, Inc.). ABAQUS Theory Documentation Version 6.10; HKS: Providence, RI, USA, 2010. [Google Scholar]
  20. Mofidi, A.; Chaallal, O.; Benmokrane, B.; Neale, K. Experimental tests and design model for RC beams strengthened in shear using the embedded through-section FRP Method. J. Compos. Constr. ASCE 2012, 16, 540–550. [Google Scholar] [CrossRef]
  21. Michael, Q.; Samir, D.; Yaser, J. Finite element parametric study of reinforced concrete beams shear-strengthened with embedded FRP bars. Compos. Struct. 2016, 149, 93–105. [Google Scholar]
  22. Lubliner, J.; Oliver, J.S.; Oñate, O.E. A plastic-damage model for concrete. Int. J. Solids Struct. 1989, 25, 299–329. [Google Scholar] [CrossRef]
  23. Lee, J.; Fenves, G.L. Plastic-damage model for cyclic loading of concrete structures. J. Eng. Mech. 1988, 124, 892–900. [Google Scholar] [CrossRef]
  24. Zheng, Y.; Robinson, D.; Taylor, S.; Cleland, D. Finite element investigation of structural behaviours of deck slabs in composite bridges. Eng. Struct. 2009, 31, 1762–1776. [Google Scholar] [CrossRef]
  25. Thorenfeldt, E.; Tomaszemicz, A.; Jensen, J.J. Mechanical properties of high-strength concrete application in design. In Proceedings of the Symposium Utilization of High Strength Concrete, Tapir Trondheim, Norway; 1978; pp. 149–159. [Google Scholar]
  26. Mattock, A.H.; Kriz, L.B.; Hognestad, E. Rectangular concrete stress distribution in ultimate strength design. Proc. ACI 1961, 57, 875–928. [Google Scholar]
  27. Hordijk, D.A. Local Approach to Fatigue of Concrete. Ph.D. Thesis, Delft University of Technology, Delft, The Netherlands, 1991. [Google Scholar]
  28. Jendele, L.; Cervenka, J. Finite element modelling of reinforcement with bond. Comput. Struct. 2006, 84, 1780–1791. [Google Scholar] [CrossRef]
  29. Chen, G.M.; Teng, J.G.; Chen, J.F. Finite-Element modeling of intermediate crack debonding in FRP-plated RC beams. J. Compos. Constr. ASCE 2011, 15, 339–353. [Google Scholar] [CrossRef]
  30. CEB-FIP. CEB-FIP Model Code 90; Thomas Telford: London, UK, 1993. [Google Scholar]
  31. Sinha, B.P.; Gerstle, K.H.; Tulin, L.G. Stress-strain relations for concrete under cyclic loading. J. ACI 1964, 61, 195–211. [Google Scholar]
  32. Reineck, K.H. Hintergründe zur Querkraftbemessung in DIN 1045-1 für Bauteile aus Konstruktionsbeton mit Querkraftbewehrung. Bauingenieur 2001, 76, 168–179. [Google Scholar]
  33. Zheng, Y.; Robinson, D.; Taylor, S.E.; Cleland, D. Non-linear finite-element analysis of punching capacities of steel–concrete bridge deck slabs. Proc. Inst. Civ. Eng. Struct. Build. 2012, 165, 255–269. [Google Scholar] [CrossRef]
  34. Ricardo, E.A.; Martha, L.F.; Bitttenourt, T.N. Combination of smeared and discrete approaches with the use of interface elements. In Proceedings of the European Congress on Computational Methods in Applied Sciences and Engineering, Barcelona, Spain, 11–14 September 2000. [Google Scholar]
  35. BSI. BS 5400: Part 4: British Standard for the Design of Steel, Concrete and Composite Bridges; BSI: London, UK, 1990. [Google Scholar]
  36. Cosenza, E.; Manfredi, G.; Realfonzo, R. Behaviour and modeling of bond of FRP rebars to concrete. J. Compos. Constr. ASCE 1997, 1, 40–51. [Google Scholar] [CrossRef]
Figure 1. Deep embedment strengthening process: (a) Drill the hole; (b) Clean the hole; (c) Pour the epoxy resin into the slab; (d) Embed fibre reinforced polymer (FRP) rod into slab.
Applsci 08 00721 g001
Figure 2. Details of test specimens in elevation: (a) Specimen coded as S-Con; (b) Specimen coded as S-D-1; (c) Specimen coded as S-S-2-10, S-B-2-9, S-G-2-9, S-C-2-9; (d) Specimen coded as S-C-1-9; and (e) Specimen coded as S-C-1-13.
Applsci 08 00721 g002
Figure 3. Details of test specimens in cross section.
Applsci 08 00721 g003
Figure 4. Reinforcement layout in frame work before casting.
Applsci 08 00721 g004
Figure 5. Details of reinforcement configuration.
Applsci 08 00721 g005
Figure 6. Details of invented drilling equipment: (a) Vertical drilling; (b) Inclined drilling; (c) Drilling equipment.
Applsci 08 00721 g006
Figure 7. Loading configuration in the test.
Applsci 08 00721 g007
Figure 8. Measurement set-up in this test: (a) Displacement transducers (T1-T6: displacement transducers); (b) Strain gauges for concrete slabs; (c) Strain gauges for embedded bars and steel reinforcement (R1-R6: electrical resistant strain (ERS)).
Applsci 08 00721 g008aApplsci 08 00721 g008b
Figure 9. Crack patterns in test slabs.
Applsci 08 00721 g009aApplsci 08 00721 g009b
Figure 10. Comparisons of failure modes in the strengthened test slabs and unstrengthened test slabs. (a) S-Con; (b) S-C-2-9; (c) S-C-1-9; (d) S-C-1-13.
Applsci 08 00721 g010
Figure 11. Comparisons of load vs. vertical deflection at loading point in test slabs.
Applsci 08 00721 g011
Figure 12. Applied load vs. maximum compressive strain of concrete slabs.
Applsci 08 00721 g012
Figure 13. Applied load vs. maximum tensile strain in longitudinal reinforcement.
Applsci 08 00721 g013
Figure 14. Applied load vs. maximum tensile strain in deep embedment strengthening bars.
Applsci 08 00721 g014
Figure 15. Proposed numerical model for concrete slabs.
Applsci 08 00721 g015
Figure 16. Bond-slip test for deep embedment FRP bars and concrete: (a) Test specimen; (b) Test results.
Applsci 08 00721 g016
Figure 17. Applied load and reaction load vs. loading time in nonlinear finite element analysis (NLFEA) (Model S-C-2-9, Test failure load = 138 kN, NLFEA failure load = 144 kN).
Applsci 08 00721 g017
Figure 18. Comparison of load-vertical deflection responses: (a) Test model coded as S-Con; (b) Test model coded as S-C-2-9; (c) Test model coded as S-C-1-9.
Applsci 08 00721 g018aApplsci 08 00721 g018b
Figure 19. Comparison of load vs. strain in longitudinal reinforcement: (a) Test model coded as S-Con; (b) Test model coded as S-C-2-9; (c) Test model coded as S-C-2-1.
Applsci 08 00721 g019aApplsci 08 00721 g019b
Figure 20. Comparison of load vs. strain in deep embedment strengthening bars: (a) Test model coded as S-C-2-9; (b) Test model coded as S-C-1-9.
Applsci 08 00721 g020
Figure 21. Finite element (FE) crack patterns of test slabs.
Applsci 08 00721 g021
Table 1. Experimental variables.
ModelReinforcement Percentage (%)fcu (MPa) *Embedment Bar TypeEmbedment Strengthening Configuration Diameter of Embedment Bar/Hole (mm)Failure Load (kN)Failure Mode **Maximum Deflection at Failure (mm)
S-Con1.124.5N/AN/AN/A130SF8.67
S-D-11.127N/AN/A-/16134SF8.34
S-S-2-101.124.5Steel2 × 210/16142BF22.54
S-B-2-91.125.1BFRP2 × 29/16144BF17.61
S-G-2-91.125.6GFRP2 × 29/16140BF19.36
S-C-2-91.125.3CFRP2 × 29/16142BF17.4
S-C-1-91.125.4CFRP2 × 19/16142BF + SF18.7
S-C-1-131.125.8CFRP2 × 113/20148BF20.58
* Compressive strength based on cube tests; ** SF = shear failure; BF = bending failure.
Table 2. Mechanical property of embedment bars and adhesives.
Deep Embedment Bar/EpoxyDiameter (mm)Tensile Strength (MPa)Elastic Modulus (GPa)Ultimate Strain
Steel105042000.0025
CFRP915811560.0101
BFRP91011830.0122
GFRP98354800.0174
FY-Z epoxyN/A40.51.20.0017
Table 3. Deformability factors of all the test slabs.
Model RP * (%)fcu (MPa)EBT **ESC *** Diameter of Embedment Bar/Hole (mm)DFIncrease in DF Compared to S-Con Beam (%)
S-Con1.124.5N/AN/AN/A7.7N/A
S-D-11.127N/AN/A-/166.54−15%
S-S-2-101.124.5Steel2 × 210/1628.67272%
S-B-2-91.125.1BFRP2 × 29/1623.03199%
S-G-2-91.125.6GFRP2 × 29/1623.05199%
S-C-2-91.125.3CFRP2 × 29/1625.01225%
S-C-1-91.125.4CFRP2 × 19/1620.79170%
S-C-1-131.125.8CFRP2 × 113/2025.44230%
* RP = Reinforcement percentage; ** EBT = Embedment bar type; *** ESC = Embedment strengthening configuration; DF = Deformation factor.
Table 4. The coefficients for bond-slip constitutive model.
Type of FRPτm (MPa)sm (mm)αp
BFRP7.420.130.0850.0935
GFRP7.750.130.0980.05
CFRP7.690.110.0870.068
Table 5. Experimental and NLFEA prediction loading-carrying capacity.
Test SpecimenPt-Test * (kN)Pp-NLFEA ** (kN)Pp/Pt-NlFEA
S-Con130133.061.02
S-S-2-10142144.281.02
S-B-2-9144141.840.98
S-G-2-9138140.711.02
S-C-2-9138144.781.05
S-C-1-9142142.931.00
S-C-1-13148143.920.97
Average =1.01
Standard deviation =0.03
Coefficient of variation =0.03
* Pt = Ultimate capaciyt in test; ** Pp-NLFEA= Predicted ultimate capacity in the NlFEA method.
Table 6. Experimental and theoretical prediction loading-carrying capacity.
Test SpecimenPt (kN)Pcs (kN)PFPRs (kN)Ps (kN)Pb (kN)Pp * (kN)Pp */Pt
S-Con130120.4120.4137.41120.40.93
S-B-2-9144120.415.87136.27137.41136.270.95
S-G-2-9138120.414.65135.05137.41135.050.98
S-C-2-9138120.435.4155.8137.41137.411.00
S-C-1-9142120.438.62159.02137.41137.410.97
S-C-1-13148120.462.94183.34137.41137.410.93
Average =0.96
Standard deviation =0.03
Coefficient of variation =0.03
* Pp = Predicted ultimate capacity in the proposed method.

