Abstract
Multimodal signal analysis based on sophisticated sensors, efficient communication systems and fast parallel processing methods has a rapidly increasing range of multidisciplinary applications. The present paper is devoted to pattern recognition, machine learning, and the analysis of sleep stages in the detection of sleep disorders using polysomnography (PSG) data, including electroencephalography (EEG), breathing (Flow), and electro-oculogram (EOG) signals. The proposed method is based on the classification of selected features by a neural network system with sigmoidal and softmax transfer functions using Bayesian methods for the evaluation of the probabilities of the separate classes. The application is devoted to the analysis of the sleep stages of 184 individuals with different diagnoses, using EEG and further PSG signals. Data analysis points to an average increase of the length of the Wake stage by 2.7% per 10 years and a decrease of the length of the Rapid Eye Movement (REM) stages by 0.8% per 10 years. The mean classification accuracy for given sets of records and single EEG and multimodal features is 88.7% ( standard deviation, STD: 2.1) and 89.6% (STD:1.9), respectively. The proposed methods enable the use of adaptive learning processes for the detection and classification of health disorders based on prior specialist experience and man–machine interaction.
1. Introduction
Polysomnography (PSG) represents a diagnostical tool of sleep medicine based on biophysiological changes that occur during the sleep. Multimodal data acquired in sleep laboratories form multichannel records that require wire attachments to the patients in most cases. Selected physiological signals are simultaneously monitored by specific sensors [1,2,3] and they form time series that are recorded with different sampling frequencies and often combined with videosequences acquired by infra and thermographic imaging cameras. Figure 1(a1,a2) present an example of a multichannel PSG record 5 s long used for diagnosis and classification of sleep disorders either by an experienced neurologist or by an automatic classification model.
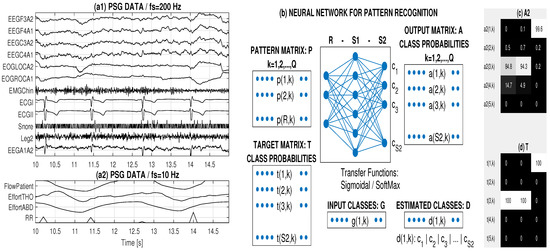
Figure 1.
Principle of sleep feature classification using a two-layer neural network with sigmoidal and softmax transfer functions presenting (a1,a2) a sample record of multichannel data 5 s long recorded with the sampling frequency of 200 and 10 Hz, respectively; (b) neural network structure for pattern recognition estimating probabilities of individual classes and evaluating the most probable class for each column vector of input features; and (c,d) evaluated and target probabilities (%) of output classes for selected patterns (detail of Figure 3d and = 5).
The segmentation and pattern recognition process is based either on the analysis of the whole set of multimodal and multichannel PSG data or on the processing of data acquired by selected sensors only. The recorded PSG signals include an electroencephalogram (EEG), electro-oculogram (EOG), electrocardiogram (ECG), electromyogram (EMG), sound, movement, and breathing records (Flow), among others. Features detected by specific computational methods [4,5,6,7,8] are then used to help neurologists to make a diagnosis and propose the appropriate treatment. Sleep features are very specific and there exist many studies proposing machine learning [9,10] for the automatic detection of sleep stages [11,12,13,14]. A specific interest is devoted to the use of hidden Markov models for automatic sleep staging [15,16,17], to the relation between the adjacent sleep segments, and to deep convolutional neural network [18,19] as well.
Figure 2 presents the rapidly growing interest in the PSG data analysis as illustrated by the number of papers registered in the Web of Science (WoS) database. This increase can be observed both in the area of sleep stages classification (Figure 2a) and machine learning for detection of sleep disorders (Figure 2b). The mostly cited papers (according to the WoS) published recently and devoted to PSG include those of sleep stages classification [20] and machine learning for sleep disorders detection [21,22] with detail comparative reviews of methods and results achieved.
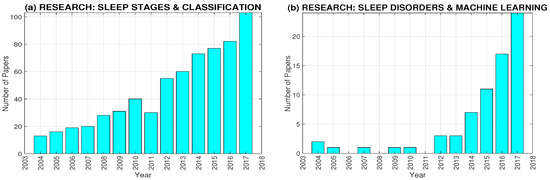
Figure 2.
The time evolution of number of journal papers devoted to analysis of (a) sleep stages and their classification and (b) sleep disorders and machine learning according to the Web of Science.
The present paper is devoted to the statistical distribution of sleep stages related to age and diagnosis [23] and to their classification, using neural networks [24,25,26,27] with sigmoidal and softmax transfer functions. The mathematical features of each segment are summarized in the pattern matrix and associated with target classes specified by an experienced neurologist. The classification system is presented in Figure 1b. The proposed adaptive process incorporates the prior experience of a neurologist into the decision process using man–machine interaction.
The proposed algorithm was applied for the adaptive recognition and classification of sleep stages [20,28,29,30,31,32] using both EEG data [13,33] and PSG signals, using their spectral components for the estimation of sleep features. Sleep scoring assumes the knowledge of the Flow, EMG, and EOG records in addition to EEG signals but they affect EEG records as well. This fact has motivated some authors to use EEG channels only [21] to classify sleep stages.
The training process analysed in the present paper results in the evaluation of the coefficients of a mathematical model for multiclass pattern recognition [34,35,36,37]. The classification accuracy and cross-validation error were then used for comparing the results. The resulting mathematical model can be further updated using expanded databases of individuals and visual sleep scoring as well as the experience of a neurologist in the associated interactive process.
The proposed mathematical model forms a contribution to further automatic systems of sleep stages classification and data analysis for the evaluation of proportion of Wake and REM segments associated with the age of an individual. These information can provide an additional diagnostic tool in the clinical environment.
The present paper is organized as follows. Section 2 presents PSG data acquisition, pattern matrix construction and the methodology of machine learning for pattern recognition of sleep stages. Section 3 describes results of the age analysis of sleep stages and their classification using both multimodal and EEG features of individuals with different diagnosis. The final Section 4 is dedicated to the discussion and conclusion.
2. Methods
2.1. PSG Data Acquisition
The data studied include the own database of 184 polysomnography overnight observations [38,39,40] of patients recorded, diagnosed and classified by the authors in the sleep neurological laboratory. Table 1 presents a summary of the data for (i) 63 healthy individuals (36 males, 27 females); (ii) 77 individuals with sleep apnea (M = 48, F = 29); (iii) 16 individuals with restless leg syndrome (M = 8, F = 8); and (iv) 28 individuals with the restless leg syndrome combined with sleep apnea (M = 19, F = 9). Each of these records is about 8 hours long, segmented and classified into 5 sleep stages:

Table 1.
Specification of the set of 184 individuals under study (M: number of males, F: number of females) with their age distribution, including (i) healthy individuals; (ii) individuals with sleep apnea (SA); (iii) individuals with the restless leg (RL) syndrome; and (iv) individuals with RL syndrome and sleep apnea syndrome
- Wake stage (Wake): normal body functions,
- No Rapid Eye Movement 1 (NonREM1): the initial sleep stage with eyes closed,
- No Rapid Eye Movement 2 (NonREM2): the light sleep stage with slower heart rate and body temperature going down,
- No Rapid Eye Movement 3 (NonREM3): the deep sleep stage during which the body repairs and regrows tissues,
- Rapid Eye Movement (REM): the specific sleep period with faster brain activities, faster breathing and heart rate (period of dreams).
These stages were specified by a neurologist specializing in sleep analysis.
The matrix of recorded sleep PSG data of each individual include an information text file and 8 EDF files with subsequent one hour long multichannel records of 22 variables acquired during the night. While EEG, EOG, ECG, sound and movement data were observed with a sampling frequency of 200 Hz, breathing records (Flow) were acquired with a sampling frequency of 10 Hz.
A selected EEG data segment 2 h long of a chosen individual together with its manual classification into 5 classes is presented in Figure 3a. The time localization of these classes specified by an experienced neurologist is shown in Figure 3c.
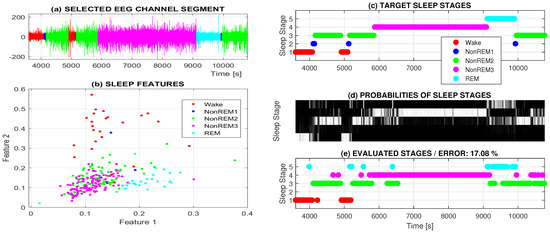
Figure 3.
Two-hour long analysis presenting (a) EEG signal segmented into 5 classes and (b) features standing for the mean power in selected frequency ranges (1–4 Hz, 4–8 Hz) in subsequent 30 s long windows forming neural network pattern values; (c) target sleep classes forming desired neural network output; (d) probabilities of evaluated classes by the two layer neural network; and (e) resulting classes with the highest classification probability.
2.2. Pattern Matrix Construction
The classification of sleep stages was based on time segments 30 s long with the corresponding target classes specified by the neurologist during the learning process after the preceded signal preprocessing stage. This initial process included digital filtering for noise rejection and artefact removal [41,42].
Common preprocessing methods include the rejection of noise components present in each individual channel. Denoting a channel signal by , it is possible to use a selected digital filter with specified cutoff frequencies to define a new sequence . Finite impulse response (FIR) band pass filters of the 30th order were used in this case. Their cutoff frequencies corresponded with the frequency ranges of specific PSG channels used for classification. The selection of these frequencies was related to the physiological background of these signals and it included frequency ranges Hz for EEG channels, Hz for the flow channel, and Hz for the EOG channel.
A selected spectral feature of a signal segment was evaluated by the discrete Fourier transform as a relative power in the specified frequency band by relation
where is the set of indices for which frequency values .
The construction of the pattern matrix presented in Figure 1b assumes the evaluation of R features for each signal segment for , forming Q column vectors of R values. As the length of each PSG segment is 30 s, the whole overnight record about 8 h (480 min) long includes on average segments for each individual. Each segment is described by R features that represent characteristics evaluated mostly in the time or frequency domains for one or more observed variables.
Figure 3b presents an example of a distribution of EEG features evaluated from one EEG channel only, specifying the average power in selected frequency bands (1–4 and 4–8 Hz). For each feature vector, the associated sleep stage (class) is specified by the neurologist, thus forming the target class for the following classification process as specified in Figure 3c.
2.3. Machine Learning for Pattern Recognition
The pattern matrix formed an input for the two-layer neural network presented in Figure 1b having R inputs, neurons in the first layer and neurons in the second layer. The outputs of individual layers included the values
where
define the arguments of the transfer functions .
An associated matrix of target values with rows was defined by the corresponding sleep stages specified by a neurologist in the learning stage (as presented in Figure 1b). For each column vector in the pattern matrix, the corresponding target vector has one unit element in the row pointing to the correct target value. The network coefficients included elements of the matrices , and associated vectors , . The proposed model used the sigmoidal transfer function in the first layer and the probabilistic softmax transfer function in the second layer. The values of the output layer, based on the Bayes theorem [43], using the function
provided the probabilities of each class. Figure 1c,d present an example of estimated and target probabilities for selected sleep pattern vectors. Each column of the output matrix presents class membership to individual classes.
The training of the neural network was performed in the MATLAB (R2017b, The MathWorks, Inc., Natick, MA, United States, 2017) environment using 70% of pattern vectors for training, 15% for validation, 15% for testing, and random initial conditions. Model coefficients were updated for each new sleep record that decreased (with the upper 3% limit) the performance value calculated as the average squared error between the network outputs and target values. The optimization process was done by a single PC with the i7-6500U CPU (2.5 GHz), 16 GB RAM and the 64-bit operating system (Windows 10 Pro).
The evaluation of the classification results was performed by the analysis of the multi-class Receiver Operating Characteristic (ROC) [44,45] to illustrate the performance of the classifier system, and by a confusion matrix presented in Table 2 for classification into S classes. The associated common performance metrics are summarized in Table 3. The ROC analysis was performed on the basis of a pairwise comparison of one class against all other classes [46].
Table 2.
The confusion matrix for the evaluation of a model classifying pattern vectors belonging to true (target) classes and estimating their (predicted) classes for the multi-class classification into S categories.
Table 3.
Common performance metrics of the confusion matrix for the multi-class classification.
3. Results
Figure 3a presents the results for a two hour long sleep record selected from the observation of an entire night in the sleep laboratory. The target sleep stages (input classes) associated with 30 s long EEG data windows diagnosed by the experienced neurologist are presented in Figure 3c. The adaptive system was constructed as a two layer neural network with the sigmoidal and softmax transfer functions. Figure 3d presents the evaluated probabilities of the individual classes. The estimated sleep stages pointing to sleep stages with the highest probability are presented in Figure 3e.
The classification results obtained by the neural network system were compared with those achieved with the k-nearest neighbour and decision tree methods (Table 4). The process of class selection and evaluation of class boundaries of the sleep stages is illustrated in Figure 4 for the two features and their classification.
Table 4.
Comparison of the accuracy and cross-validation for classification of sleep features evaluated during the two-hour long observation and 30 s long time windows by the neural network, nearest neighbour, and decision tree models.
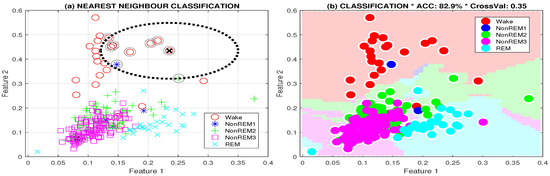
Figure 4.
Classification of sleep stages presenting (a) class selection for the 5-nearest neighbour method and (b) class boundaries of the computational model and two features evaluated as the mean power in selected frequency ranges (1–4 Hz, 4–8 Hz).
The classification accuracies and cross-validation errors evaluated by the leave-one-out method for a sample two-hour long EEG record are presented in Table 4. Input features include relative power in 4 frequency bands (1–4, 4–8, 8–12, 12–20 Hz). For the given set of features, the neural network model provide classification results with higher accuracy and lower cross-validation error than did the k-nearest neighbour and decision tree methods.
The methodology of sleep stages processing verified for short records was then applied for an extensive set of 184 individuals specified in Table 1. The results of its analysis with statistical distribution of sleep stages related to age is presented in Figure 5. Linear approximation of these values together with estimation of 95% confidence bounds were evaluated. Resulting regression coefficients point to an average increase of the length of the Wake stage by 2.7% per 10 years and a decrease of the length of the REM stage by 0.8% per 10 years.
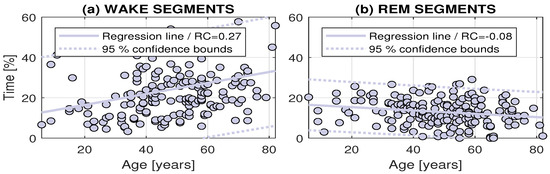
Figure 5.
The distributions of the lengths of the Wake and REM sleep stages related to age for the whole set of 184 individuals under study.
Figure 6 presents more detail analysis of the resulting lengths of the sleep stages [47] related to the age for the whole set of 184 individuals divided according to their diagnosis as determined by experienced neurologists. A well documented increase of the Wake stages and decrease of REM stages related to age is confirmed for healthy individuals and patients with sleep apnea. For patients with restless leg syndrome, no such distribution was observed. The summary of associated regression coefficients with their 95% confidence bounds are presented in Table 5.
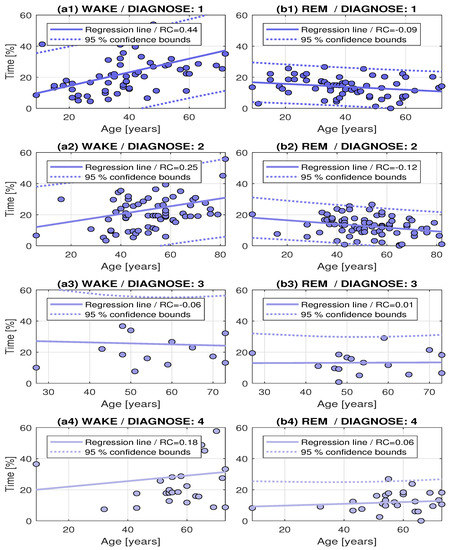
Figure 6.
Distributions of Wake and REM sleep stages related to age for (a1,b1) healthy individuals and patients with (a2,b2) sleep apnea; (a3,b3) restless leg syndrom; and (a4,b4) restless leg syndrom and sleep apnea.
Table 5.
The summary of regression coefficients (RC) of the age dependence of Wake and REM sleep stages with their 95% confidence bounds.
Table 6 presents the summary of the results for the individuals specified in Table 1 with 4 different diagnoses and their classification into three classes (: Wake, : NonREM, : REM). The learning performance was evaluated by the cross-entropy for given targets and network outputs. The last column of Table 6 presents cross-validation errors evaluated by the K-fold cross-validation method (for ). A comparison of the classification results was performed using
Table 6.
Evaluation of sleep stage classification (Classes: —Wake, —NonREM, —REM) of sets of (i) healthy individuals; (ii) individuals with sleep apnea (SA); (iii) individuals with the restless leg (RL) syndrome, and (iv) individuals with sleep apnea and RL syndrome using the single EEG channel for 5 (F5) mean EEG power features (in bands 1–4, 4–8, 8–12, 12–16, and 16–20 Hz), and 12 (F12) features with additional 4 features evaluated from the flow channel (for frequency bands 0.05–0.2, 0.2–0.3, 0.3–0.4, 0.4–0.8 Hz) and 3 features related to the electro-oculogram channels (4–15, 15–30, 30–40 Hz).
- the EEG channels only, with patterns evaluated as mean energies in 5 selected frequency bands (1–4, 4–8, 8–12, 12–16, 16–20 Hz),
- additional features evaluated from the 4 frequency bands (0.05–0.2, 0.2–0.3, 0.3–0.4, 0.4–0.8 Hz) of the flow channel and 3 frequency bands (4–15, 15–30, 30–40 Hz) of the electro-oculogram channel.
The values in Table 6 show nearly no difference between males and females and a slight improvement of the performance and accuracy of the neural network model using multimodal features consisting of 12 items instead of 5 EEG features associated with each segment.
The results presented in Table 6 are based on the manual classification of the PSG records performed by an experienced neurologist incorporating his experience. The adaptive optimization of the network coefficients can be further performed for newly acquired records.
An analysis of the features in each 30 s long PSG segment was then performed for spectral components in selected regions for the EEG, Flow and OCG channels for all 184 individuals. This resulted in the specification of the pattern matrix for the adaptive classification by the two layer neural network after the learning process based on associated target values. Results for the training, validation and test sets for healthy individuals (after about 15,000 training epochs) are presented in associated confusion matrices presented in Table 7 for classification into three classes using 12 (F12) multimodal (EEG, Flow and ECG) features. The highest true-positive rate was achieved for the second (NonREM) class and all these sets.
Table 7.
Confusion matrix of the classification neural network model for the training, validation, and test sets of sleep stages (for healthy individuals) with true positive values on the matrix diagonal (in the bold).
Figure 7 presents the target and predicted classes of three selected patients with sleep apnea classified into three classes, including (a) class 1 (Wake), (b) class 2 (NonREM), and (c) class 3 (REM). The associated ROC characteristics in Figure 7d show the true positive rate of each class against the false positive rate of all other classes.

Figure 7.
Target and predicted classes of three selected patients with sleep apnea classified by the adaptive neural network model into three classes including (a) class 1 (Wake); (b) class 2 (NonREM); and (c) class 3 (REM) together with (d) associated ROC characteristics.
The final results including the accuracy and the performance of neural network models for different sleep disorders and male/female sets of individuals are presented in Figure 8. The results show the similarity in the accuracy for features evaluated from the single EEG channel (F5) and different multimodal (EEG, Flow and OCG) channels (F12). The slightly lower accuracy achieved for females in this case can be explained by the higher deviations of the associated features. The mean classification accuracy is 88.7% (STD: 2.1) and 89.6% (STD: 1.9), respectively, for the given sets of records and classification using single (F5) and multimodal (F12) features. This result can be explained by the presence of additional attributes in the EEG channel. The accuracy achieved corresponds with that published in [25] for a smaller group of individuals and different feature sets.
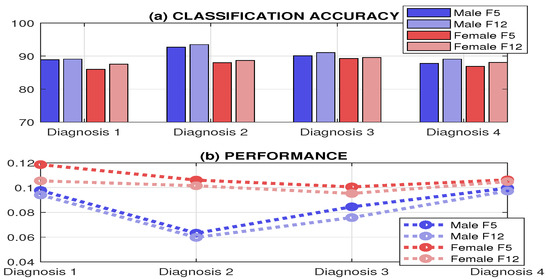
Figure 8.
Results of the training process presenting (a) the accuracy and (b) the performance of the resulting model for different sleep disorders for sets of male and female individuals using EEG (F5) and multimodal EEG, Flow and OCG (F12) features.
Table 8 presents the summary of both the achieved global classification accuracy, the K-fold cross-validation errors (for ) and the precision of classification into three classes over all sleep disorders with associated detailed values summarized in Table 6.
Table 8.
Classification accuracy and the 10-fold cross-validation errors of the sets of males and females and precision of individual classes over all sleep disorders for 5 (F5) mean EEG power features and 12 (F12) features with an additional 4 features evaluated from the flow and electro-oculogram channels.
4. Conclusions
This paper presents a method involving multi-class classification applied to the recognition of sleep stages using a two layer neural network with the sigmoidal and the softmax transfer functions to evaluate the probabilities of the output classes. The training set includes overnight PSG records of 184 individuals forming an own database acquired and classified by the authors.
The proposed method allows the construction of a neural network and its training to recognize sleep stages with a mean classification accuracy of 88.7% (STD: 2.1) specified in Table 6 and Table 8 for selected spectral features of the single EEG channel. The accuracy increased to 89.6% (STD: 1.9) for multimodal features obtained from EEG, flow and EOG channels was not too high, probably owing to the presence of corresponding artifacts in the EEG channels. The mean 10-fold cross-validation error decreased from 0.16 (for 5 EEG features) to 0.12 (for 12 multimodal features).
The novel approach of the proposed method is the possibility of constructing a mathematical model incorporating the individual experience of a neurologist, allowing a data classification close to his previous strategy and an adaptive modification of model coefficients. Results obtained are compared with selected existing methods in Table 9. The accuracy of sleep stages classification is generally between 70% and 92% [22] and the accuracy of the current model is close to the upper limit of this range.
Table 9.
A comparison of the proposed method with further published results.
It is projected that the neural network model will be further used for more extensive datasets and adaptation of the results to the experience of the neurologist to reduce the time necessary for manual classification. A special attention will be paid to deep convolutional neural networks [17,18] that allow row data processing without specification of separate features.
Author Contributions
A.P. was responsible for the mathematical and algorithmic tools allowing the data processing, J.K. was responsible for PSG data acquisition, O.V. interpreted the acquired data and results obtained from the neurological point of view, P.C. contributed to the data preprocessing, M.V. contributed to interpretation of results from the neurology point of view and V.M. was responsible for computational processing and visualization. All authors have read and approved the final manuscript.
Acknowledgments
Real data were kindly provided by the Department of Neurology of the Faculty Hospital of the Charles University in Hradec Kralove. All procedures involving human participants were in accordance with the ethical standards of the institutional research committee and with the 1964 Helsinki declaration and its later amendments. Informed consent was obtained from all individual participants included in the study. This study was partially supported by the grant projects of the Ministry of Health of the Czech Republic (FN HK 00179906) and of the Charles University in Prague, Czech Republic (PROGRES Q40).
Conflicts of Interest
The authors declare that there is no conflict of interest.
References
- Looney, D.; Goverdovsky, V.; Rosenzweig, I.; Morrell, M.; Mandic, D. Wearable In-Ear Encephalography Sensor for Monitoring Sleep. Ann. Am. Thorac. Soc. 2016, 13, 2230–2233. [Google Scholar] [CrossRef] [PubMed]
- Procházka, A.; Schätz, M.; Centonze, F.; Kuchyňka, J.; Vyšata, O.; Vališ, M. Extraction of Breathing Features Using MS Kinect for Sleep Stage Detection. Signal Image Video Process. 2016, 10, 1278–1286. [Google Scholar] [CrossRef]
- Procházka, A.; Schätz, M.; Vyšata, O.; Vališ, M. Microsoft Kinect Visual and Depth Sensors for Breathing and Heart Rate Analysis. Sensors 2016, 16, 996. [Google Scholar] [CrossRef] [PubMed]
- Liaw, S.; Chen, J. Characterizing sleep stages by the fractal dimensions of electroencephalograms. Biostat. Biom. 2017, 2, 555584:1–555584:7. [Google Scholar]
- Kianzad, R.; Kordy, H. Automatic Sleep Stages Detection Based on EEG Signals Using Combination of Classifiers. J. Electr. Comput. Eng. Innov. 2013, 1, 99–105. [Google Scholar]
- Metsis, V.; Kosmopoulos, D.; Athitsos, V.; Makedon, F. Non-invasive analysis of sleep patterns via multimodal sensor input. Pers. Ubiquitous Comput. 2014, 18, 19–26. [Google Scholar] [CrossRef]
- Diykh, M.; Li, Y.; Wen, P. EEG Sleep Stages Classification Based on Time Domain Features and Structural Graph Similarity. IEEE Trans. Neural Syst. Rehabil. Eng. 2016, 24, 1159–1168. [Google Scholar] [CrossRef] [PubMed]
- Fraiwan, L.; Lweesy, K.; Khasawneh, N.; Fraiwan, M.; Wenz, H.; Dickhaus, H. Classification of Sleep Stages Using Multi-wavelet Time Frequency Entropy and LDA. Methods Inf. Med. 2010, 49, 230–237. [Google Scholar] [CrossRef] [PubMed]
- Lajnef, T.; Chaibi, S.; Ruby, P.; Aguera, P.; Eichenlaub, J.; Samet, M.; Kachouri, A.; Jerbi, K. Learning machines and sleeping brains: Automatic sleep stage classification using decision-tree multi-class support vector machines. J. Neurosci. Methods 2015, 250, 94–105. [Google Scholar] [CrossRef] [PubMed]
- Fonseca, P.; Long, X.; Radha, M.; Haakma, R.; Aarts, R.; Rolink, J. Sleep stage classification with ECG and respiratory effort. Physiol. Meas. 2015, 36, 2027–2040. [Google Scholar] [CrossRef] [PubMed]
- Rodríguez-Sotelo, J.; Osorio-Forero, A.; Jiménez-Rodríguez, A.; Cuesta-Frau, D.; Cirugeda-Roldán, E.; Peluffo, D. Automatic Sleep Stages Classification Using EEG Entropy Features and Unsupervised Pattern Analysis Techniques. Entropy 2014, 16, 6573–6589. [Google Scholar] [CrossRef]
- Sharma, R.; Pachori, R.; Upadhyay, A. Automatic sleep stages classification based on iterative filtering of electroencephalogram signals. Neural Comput. Appl. 2017, 28, 2959–2978. [Google Scholar] [CrossRef]
- Huang, C.S.; Lin, C.L.; Ko, L.W.; Liu, S.Y.; Sua, T.P.; Lin, C.T. A hierarchical classification system for sleep stage scoring via forehead EEG signals. In Proceedings of the IEEE Symposium on Computational Intelligence, Cognitive Algorithms, Mind, and Brain (CCMB), Singapore, 16–19 April 2013; pp. 1–5. [Google Scholar]
- Zhu, G.; Li, Y.; Wen, P.P. Analysis and Classification of Sleep Stages Based on Difference Visibility Graphs From a Single-Channel EEG Signal. IEEE J. Biomed. Health Inform. 2014, 18, 1813–1821. [Google Scholar] [CrossRef] [PubMed]
- Pan, S.-T.; Kuo, C.-E.; Zeng, J.-H.; Liang, S.-F. A transition-constrained discrete hidden Markov model for automatic sleep staging. Biomed. Eng. Online 2012, 11, 52. [Google Scholar] [CrossRef] [PubMed]
- Song, C.; Liu, K.; Zhang, X.; Chen, L.; Xian, X. An Obstructive Sleep Apnea Detection Approach Using a Discriminative Hidden Markov Model From ECG Signals. IEEE Trans. Biomed. Eng. 2016, 63, 1532–1542. [Google Scholar] [CrossRef] [PubMed]
- Li, K.; Pan, W.; Li, Y.; Jiang, Q.; Liu, G. A method to detect sleep apnea based on deep neural network and hidden Markov model using single-lead ECG signal. Neurocomputing 2018, 294, 94–101. [Google Scholar] [CrossRef]
- Sors, A.; Bonnet, S.; Mirek, S.; Vercueil, L.; Payen, J.-F. A convolutional neural network for sleep stage scoring from raw single-channel EEG. Biomed. Signal Process. Control 2018, 42, 107–114. [Google Scholar] [CrossRef]
- Chambon, S.; Galtier, M.N.; Arnal, P.J.; Wainrib, G.; Gramfort, A. A Deep Learning Architecture for Temporal Sleep Stage Classification Using Multivariate and Multimodal Time Series. IEEE Trans. Neural Syst. Rehabil. Eng. 2018, 26, 758–769. [Google Scholar] [CrossRef] [PubMed]
- Boostani, R.; Karimzadeh, F.; Nami, M. A comparative review on sleep stage classification methods in patients and healthy individuals. Comput. Methods Programs Biomed. 2017, 140, 71–91. [Google Scholar] [CrossRef] [PubMed]
- Aboalayon, K.; Faezipour, M.; Almuhammadi, W.; Saeid Moslehpour, S. Sleep Stage Classification Using EEG Signal Analysis: A Comprehensive Survey and New Investigation. Entropy 2016, 18, 272. [Google Scholar] [CrossRef]
- Peker, M. An efficient sleep scoring system based on EEG signal using complex-valued machine learning algorithms. Neurocomputing 2016, 207, 165–177. [Google Scholar] [CrossRef]
- Krefting, D.; Jansen, C.; Penzel, T.; Han, F.; Kantelhardt, J.W. Age and gender dependency of physiological networks in sleep. Physiol. Meas. 2017, 38, 959–975. [Google Scholar] [CrossRef] [PubMed]
- Lee, J.; Yoo, S. Electroencephalography Analysis Using Neural Network and Support Vector Machine during Sleep. Engineering 2013, 5, 88–92. [Google Scholar] [CrossRef]
- Ozsen, S. Classification of sleep stages using class-dependent sequential feature selection and artificial neural network. Neural Comput. Appl. 2013, 23, 1239–1250. [Google Scholar] [CrossRef]
- Langkvist, A.; Karlsson, A.; Loutfi, A. Sleep Stage Classification Using Unsupervised Feature Learning. Adv. Artif. Neural Syst. 2012, 12, 1–9. [Google Scholar] [CrossRef]
- Hsu, Y.L.; Yang, Y.T.; Wang, J.S.; Hsu, C.Y. Automatic sleep stage recurrent neural classifier using energy features of EEG signals. Neurocomputing 2013, 104, 105–114. [Google Scholar] [CrossRef]
- Hashizaki, M.; Nakajima, H.; Kume, K. Monitoring of Weekly Sleep Pattern Variations at Home with a Contactless Biomotion Sensor. Sensors 2014, 15, 18950–18964. [Google Scholar] [CrossRef] [PubMed]
- Sen, B.; Peker, M.; Cavusoglu, A.; Celebi, F. A Comparative Study on Classification of Sleep Stage Based on EEG Signals Using Feature Selection and Classification Algorithms. J. Med. Syst. 2014, 38, 1–21. [Google Scholar] [CrossRef] [PubMed]
- Bušková, J.; Ibarburu, V.; Šonka, K.; Ružička, E. Screening for REM sleep behavior disorder in the general population. Sleep Med. 2016, 24, 147. [Google Scholar] [CrossRef] [PubMed]
- Tagluk, E.; Sezgin, N.; Akin, M. Estimation of Sleep Stages by an Artificial Neural Network Employing EEG, EMG and EOG. J. Med. Syst. 2010, 34, 717–725. [Google Scholar] [CrossRef] [PubMed]
- Kouchaki, K.S.; Eftaxias, K.; Sanei, S. An Adaptive Filtering Approach Using Supervised SSA for Identification of Sleep Stages From EEG. Front. Biomed. Technol. 2014, 1, 233–239. [Google Scholar]
- Venkatesh, K.; Poonguzhali, S.; Mohanavelu, K.; Adalarasu, K. Sleep Stages Classification Using Neural Network with Single Channel EEG. Int. J. Recent Adv. Eng. Technol. 2014, 2, 1–8. [Google Scholar]
- Ahuja, Y.; Yadav, S. Multiclass classification and support vector machine. Glob. J. Comput. Sci. Technol. 2012, 12, 15–19. [Google Scholar]
- Ou, G.; Murphey, Y. Multi-class pattern classification using neural networks. Pattern Recognit. 2007, 40, 4–8. [Google Scholar] [CrossRef]
- Procházka, A.; Vyšata, O.; Ťupa, O.; Mareš, J.; Vališ, M. Discrimination of Axonal Neuropathy Using Sensitivity and Specificity Statistical Measures. Neural Comput. Appl. 2014, 25, 1349–1358. [Google Scholar] [CrossRef]
- Procházka, A.; Kuchyňka, J.; Suarez Araujo, C.P.; Vyšata, O. Adaptive Segmentation of Multimodal Polysomnography Data for Sleep Stages Detection. In Proceedings of the 22nd International Conference on Digital Signal Processing, London, UK, 23–25 August 2017; pp. 1–4. [Google Scholar]
- Dursun, M.; Ozsen, S.; Yucelbas, C.; Yucelbas, S.; Tezel, G.; Kuccukturk, S.; Yosunkaya, S. A new approach to eliminating EOG artifacts from the sleep EEG signals for the automatic sleep stage classification. Neural Comput. Appl. 2017, 28, 3095–3112. [Google Scholar] [CrossRef]
- Saeid, S. Adaptive Processing of Brain Signals; John Wiley & Sons Ltd.: Chichester, UK, 2013. [Google Scholar]
- Saeid, S.; Chambers, J. EEG Signal Processing; John Wiley & Sons Ltd.: Chichester, UK, 2007. [Google Scholar]
- Chaparro-Vargas, R.; Cvetkovic, D. A single-trial toolbox for advanced sleep polysomnographic preprocessing. In Proceedings of the Annual International Conference of the IEEE Engineering in Medicine and Biology Society, Osaka, Japan, 3–7 July 2013; pp. 5829–5832. [Google Scholar]
- Mares, J.; Vysata, O.; Prochazka, A.; Valis, M. Age-Dependent Complex Noise Fluctuation in the Brain. Physiol. Meas. 2013, 34, 1269–1279. [Google Scholar] [CrossRef] [PubMed]
- Procházka, A.; Vyšata, O.; Vališ, M.; Ťupa, O.; Schatz, M.; Mařík, V. Bayesian classification and analysis of gait disorders using image and depth sensors of Microsoft Kinect. Digit. Signal Process. 2015, 47, 169–177. [Google Scholar] [CrossRef]
- Everson, R.; Fieldsend, J. Multi-class ROC analysis from a multi-objective optimisation perspective. Pattern Recognit. Lett. 2006, 27, 918–927. [Google Scholar] [CrossRef]
- Carlos, J.; Caballero, F.; Martinez, F.; Hervas, C.; Gutierrez, P. Sensitivity versus Accuracy in Multiclass Problems Using Memetic Pareto Evolutionary Neural Network. IEEE Trans. Neural Netw. 2010, 21, 750–770. [Google Scholar]
- Landgrebe, T.; Duin, R. Approximating the multiclass ROS by pairwise analysis. Pattern Recognit. Lett. 2007, 28, 1747–1758. [Google Scholar] [CrossRef]
- Espiritu, J. Aging-Related Sleep Changes. Clin. Geriatr. Med. 2008, 24, 1–14. [Google Scholar] [CrossRef] [PubMed]

© 2018 by the authors. Licensee MDPI, Basel, Switzerland. This article is an open access article distributed under the terms and conditions of the Creative Commons Attribution (CC BY) license (http://creativecommons.org/licenses/by/4.0/).