Article

Nature Inspired Plasmonic Structures: Influence of Structural Characteristics on Sensing Capability

by
Gerardo Perozziello
1,*,
Patrizio Candeloro
1,
Maria Laura Coluccio
1,
Godind Das
2,
Loredana Rocca
1,
Salvatore Andrea Pullano
1,
Antonino Secondo Fiorillo
1,
Mario De Stefano
3 and
Enzo Di Fabrizio
1,2
1
Laboratory BioNEM, Department of Experimental and Clinical Medicine, University Magna Graecia of Catanzaro, Loc. Germaneto, 88110 Catanzaro, Italy
2
Physical Sciences and Engineering (PSE), King Abdullah University of Science and Technology (KAUST), Thuwal 23955-6900, Kingdom of Saudi Arabia
3
Environmental Science Department, Second University of Naples, 81100 Caserta, Italy
*
Author to whom correspondence should be addressed.
Appl. Sci. 2018, 8(5), 668; https://doi.org/10.3390/app8050668
Submission received: 15 March 2018 / Revised: 13 April 2018 / Accepted: 23 April 2018 / Published: 26 April 2018
(This article belongs to the Special Issue Optics and Spectroscopy for Fluid Characterization)

Abstract

:

Featured Application

The Plasmonic structures presented can be integrated in optical sensors applicable to complex biological mixtures.

Abstract

Surface enhanced Raman scattering (SERS) is a powerful analytical technique that allows the enhancement of a Raman signal in a molecule or molecular assemblies placed in the proximity of nanostructured metallic surfaces, due to plasmonic effects. However, laboratory methods to obtain of these prototypes are time-consuming, expensive and they do not always lead to the desired result. In this work, we analyse structures existing in nature that show, on a nanoscale, characteristic conformations of photonic crystals. We demonstrate that these structures, if covered with gold, change into plasmonic nanostructures and are able to sustain the SERS effect. We study three different structures with this property: opal, a hydrated amorphous form of silica (SiO2·nH2O); diatoms, a kind of unicellular alga; and peacock tail feather. Rhodamine 6G (down to 10−12 M) is used to evaluate their capability to increase the Raman signal. These results allow us to define an alternative way to obtain a high sensitivity in Raman spectroscopy, currently achieved by a long and expensive technique, and to fabricate inexpensive nanoplasmonic structures which could be integrated into optical sensors.

1. Introduction

Raman spectroscopy is a powerful vibrational spectroscopy technique that has many advantages. It is an analytical technique with high specificity for the identification of various chemical compounds [1,2,3]. In addition, it is a non-invasive approach that allows measurements to be performed without any sample preparation, and the measurement time is generally very short. However, the Raman signal is very low and difficult to detect. Statistically, for every 1–10 million photons bombarding a sample, only one will result in Raman scattering [4,5]. For this reason, Raman spectroscopy is often coupled to substrates integrating metal plasmonic nanostructures that reproduce an SERS (surface enhanced Raman scattering) effect [6,7,8]. The molecules, which need to be analysed, are deposited on these substrates and are excited by an electromagnetic (EM) field, which is enhanced by the proximal metal nanostructures. The amplified EM field interacts with molecules and produces Raman scattering which is again amplified by the metal nanostructures [9,10,11]. In greater detail, the incident EM waves excite plasmon resonances within the metal nanostructures. Due to resonance effects, the local electric field is enhanced in the proximity of metal nanoparticles. The molecules at the metal surface then experience an enhanced local EM wave, and produce higher Raman signals than those molecules far from the metal surface. Moreover, since Raman signals are a type of EM wave, the same route through plasmon resonances will further enhance the outgoing Raman field. In the end, plasmon resonances are responsible for the double amplification Raman signals of molecules close to metal nanostructures, thus producing a surface-enhanced Raman effect. A detailed review of plasmon-enhanced spectroscopies can be found in [12]. The Raman signal enhancement strongly depends on the size and shape of the metal particles [13,14,15], and different methods to fabricate them exist in the literature [16,17,18]. The combination of a top down method, that is, electron beam lithography, with a bottom up technique, that is, chemical electroless deposition, allows a SERS substrate of a self-similar chain of silver nanospheres to be obtained [19]. Plasmonic nanoholes can be made with a template-stripping technique that involves the fabrication of a Si template obtained with electron beam lithography [20]. The Ag-decorated nanotip array, obtained with Electron Beam Induced Deposition and Silver Electroless Deposition, is another efficient 3D plasmonic device, that can be used to obtain a SERS effect [21]. The prototypes described above, although very efficient, are difficult, expensive and time-consuming to fabricate. Other techniques allow the fabrication of nanoplasmonic structures using faster and inexpensive processes. In this regard, metallic colloids [22,23,24], metallic films [25,26], sensors fabricated by nanosphere lithography [27], and plasmonic systems exploiting nanoparticle self-assembly properties [28,29] have been developed. However, some of the processes to achieve these kinds of low-cost SERS substrates lack reliability in regard to obtaining large sensing surfaces [30,31]. These disadvantages in contrast to the benefits of Raman spectroscopy, which allows information to be obtained easily and without any particular sample preparation [32,33]. Consequently, research involving alternative ways to maintain the SERS effect [34], is of crucial importance. Some structures existing in nature show, on the nanoscale, a conformation called photonic crystal. Photonic crystal, a periodic structure in an optical medium, creates unusual optical dispersion properties, which cause the iridescent colours in some butterfly wings and beetle armours and other structures present in nature [35,36]. These structures, if metallized, can be assimilated to the SERS devices and used as optical sensors [37,38,39]. Here, we focus on the peacock feather, opal and diatoms, because they are easy to find in nature. We cover their surfaces with gold to change the photonic nanostructure in a plasmonic nanostructure, and we characterize them by detecting Rhodamine, using Raman spectroscopy. Each element shows a different behaviour due to structural characteristics (which we discuss in the following sections). The best response is obtained with opal, allowing the analysis of molecules at very low concentrations and thus confirming their potential application for biosensing devices.

2. Materials and Methods

Metallic nanoparticle aggregates are able to maintain high enhancement of the SERS signal (in the order of 1011) [40]. Experimental evidence shows that by placing two spherical nanoparticles at a distance of less than 5 nm, there is an amplification of the local electric field of several orders of magnitude greater than when the nanoparticles are isolated, at the midpoint between the two. This enhancement of the electric field results from the constructive interference of the surface plasmonic resonances of the two particles. The antiparticle regions with field amplification are called hot spots [41,42]. By metallizing the surface (e.g., with gold), it is possible to assimilate natural nanophotonic structures to metal nanoparticle aggregates, producing plasmonic nanostructures, which can cause high amplification of the SERS signal [43,44].

2.1. Natural Nanophotonic Structures

We used the following natural components:

2.1.1. Peacock Feather

The peacock livery is a typical example of sexual dimorphism. Indeed, the male peacock tail consists of very lengthy feathers that extend to form a ‘palette’ with the typical eyespot and iridescent colours. This feature is supposed to attract mates and to disorient predators. To investigate the structural properties of the peacock feather, we collected a feather from a male peafowl (Pavo cristatus) and focused on its eyespot. At the nanoscale, it is characterized by the presence of cellular organelles, called melanosomes, which are arranged to form a typical two-dimensional crystalline lattice. This arrangement causes the characteristic iridescent colours. The size of the melanosomes vary but on average, they are about 105 nm long, and the distance between the centre of a melanosome and another is about 175 nm. There is a correlation between the diameter of a melanosome and the brightness of cells—brightness increases as the melanosome diameter increases [45].

2.1.2. Opal

Opal is a mineral made of silica, formed by the slow geological deposition of a colloidal gel at a low temperature. Various types of opal exist in nature; the kind of opal we analysed is called Ethiopian Welo Opal. It is characterized by its transparency and its vibrant reflections which show all the colours of the rainbow, in particular, yellow, orange, red and green. On the nano-cale, it can be considered a typical example of colloidal crystal, due to its orderly aggregate of particles similar to standard crystal, with subunits of atoms or molecules. The arrangement of amorphous silicon dioxide spheres and their sizes give the structure its optical properties. In fact, the internal colours are determined by the interference and diffraction of light passing through the microstructure of the opal. The spheres are about 10 nm in diameter, while the space between one sphere and another is of a smaller order of magnitude.

2.1.3. Diatoms

Diatoms are unicellular and eukaryotic algae, which can live in isolation or form colonies either in freshwater or marine environments. Diatoms are hundreds of µm in size [46], with a distinctive shell wall consisting of two hydrated silica valves, interconnected in a structure called a frustule. Frustules present patterns of regular arrays of holes, the areolae, which are characterized by sub-micrometric dimensions. There are about 105 species of diatoms, whose frustules differ in shape, morphology and size. The dimensions of the frustule pores, typically hundreds of nanometres, provide diatom frustules with peculiar optical properties. In the present work, we considered C. wailesii diatoms, in which organic matter was removed by means of strong acid solutions [47]. The diameter of the valves ranged from 100 to 200 µm, while the average thickness of the wall was about 1 µm. Every single valve is formed by two co-joined plates. The external plate comprises a complex hexagonal arrangement of hollow pores with a diameter (≅200 nm) below the visible wavelength. On the other side, the internal plate of the valve is characterized by hexagonally-spaced pores with diameters in the range of 50 nm and by a lattice constant of about 50 nm.

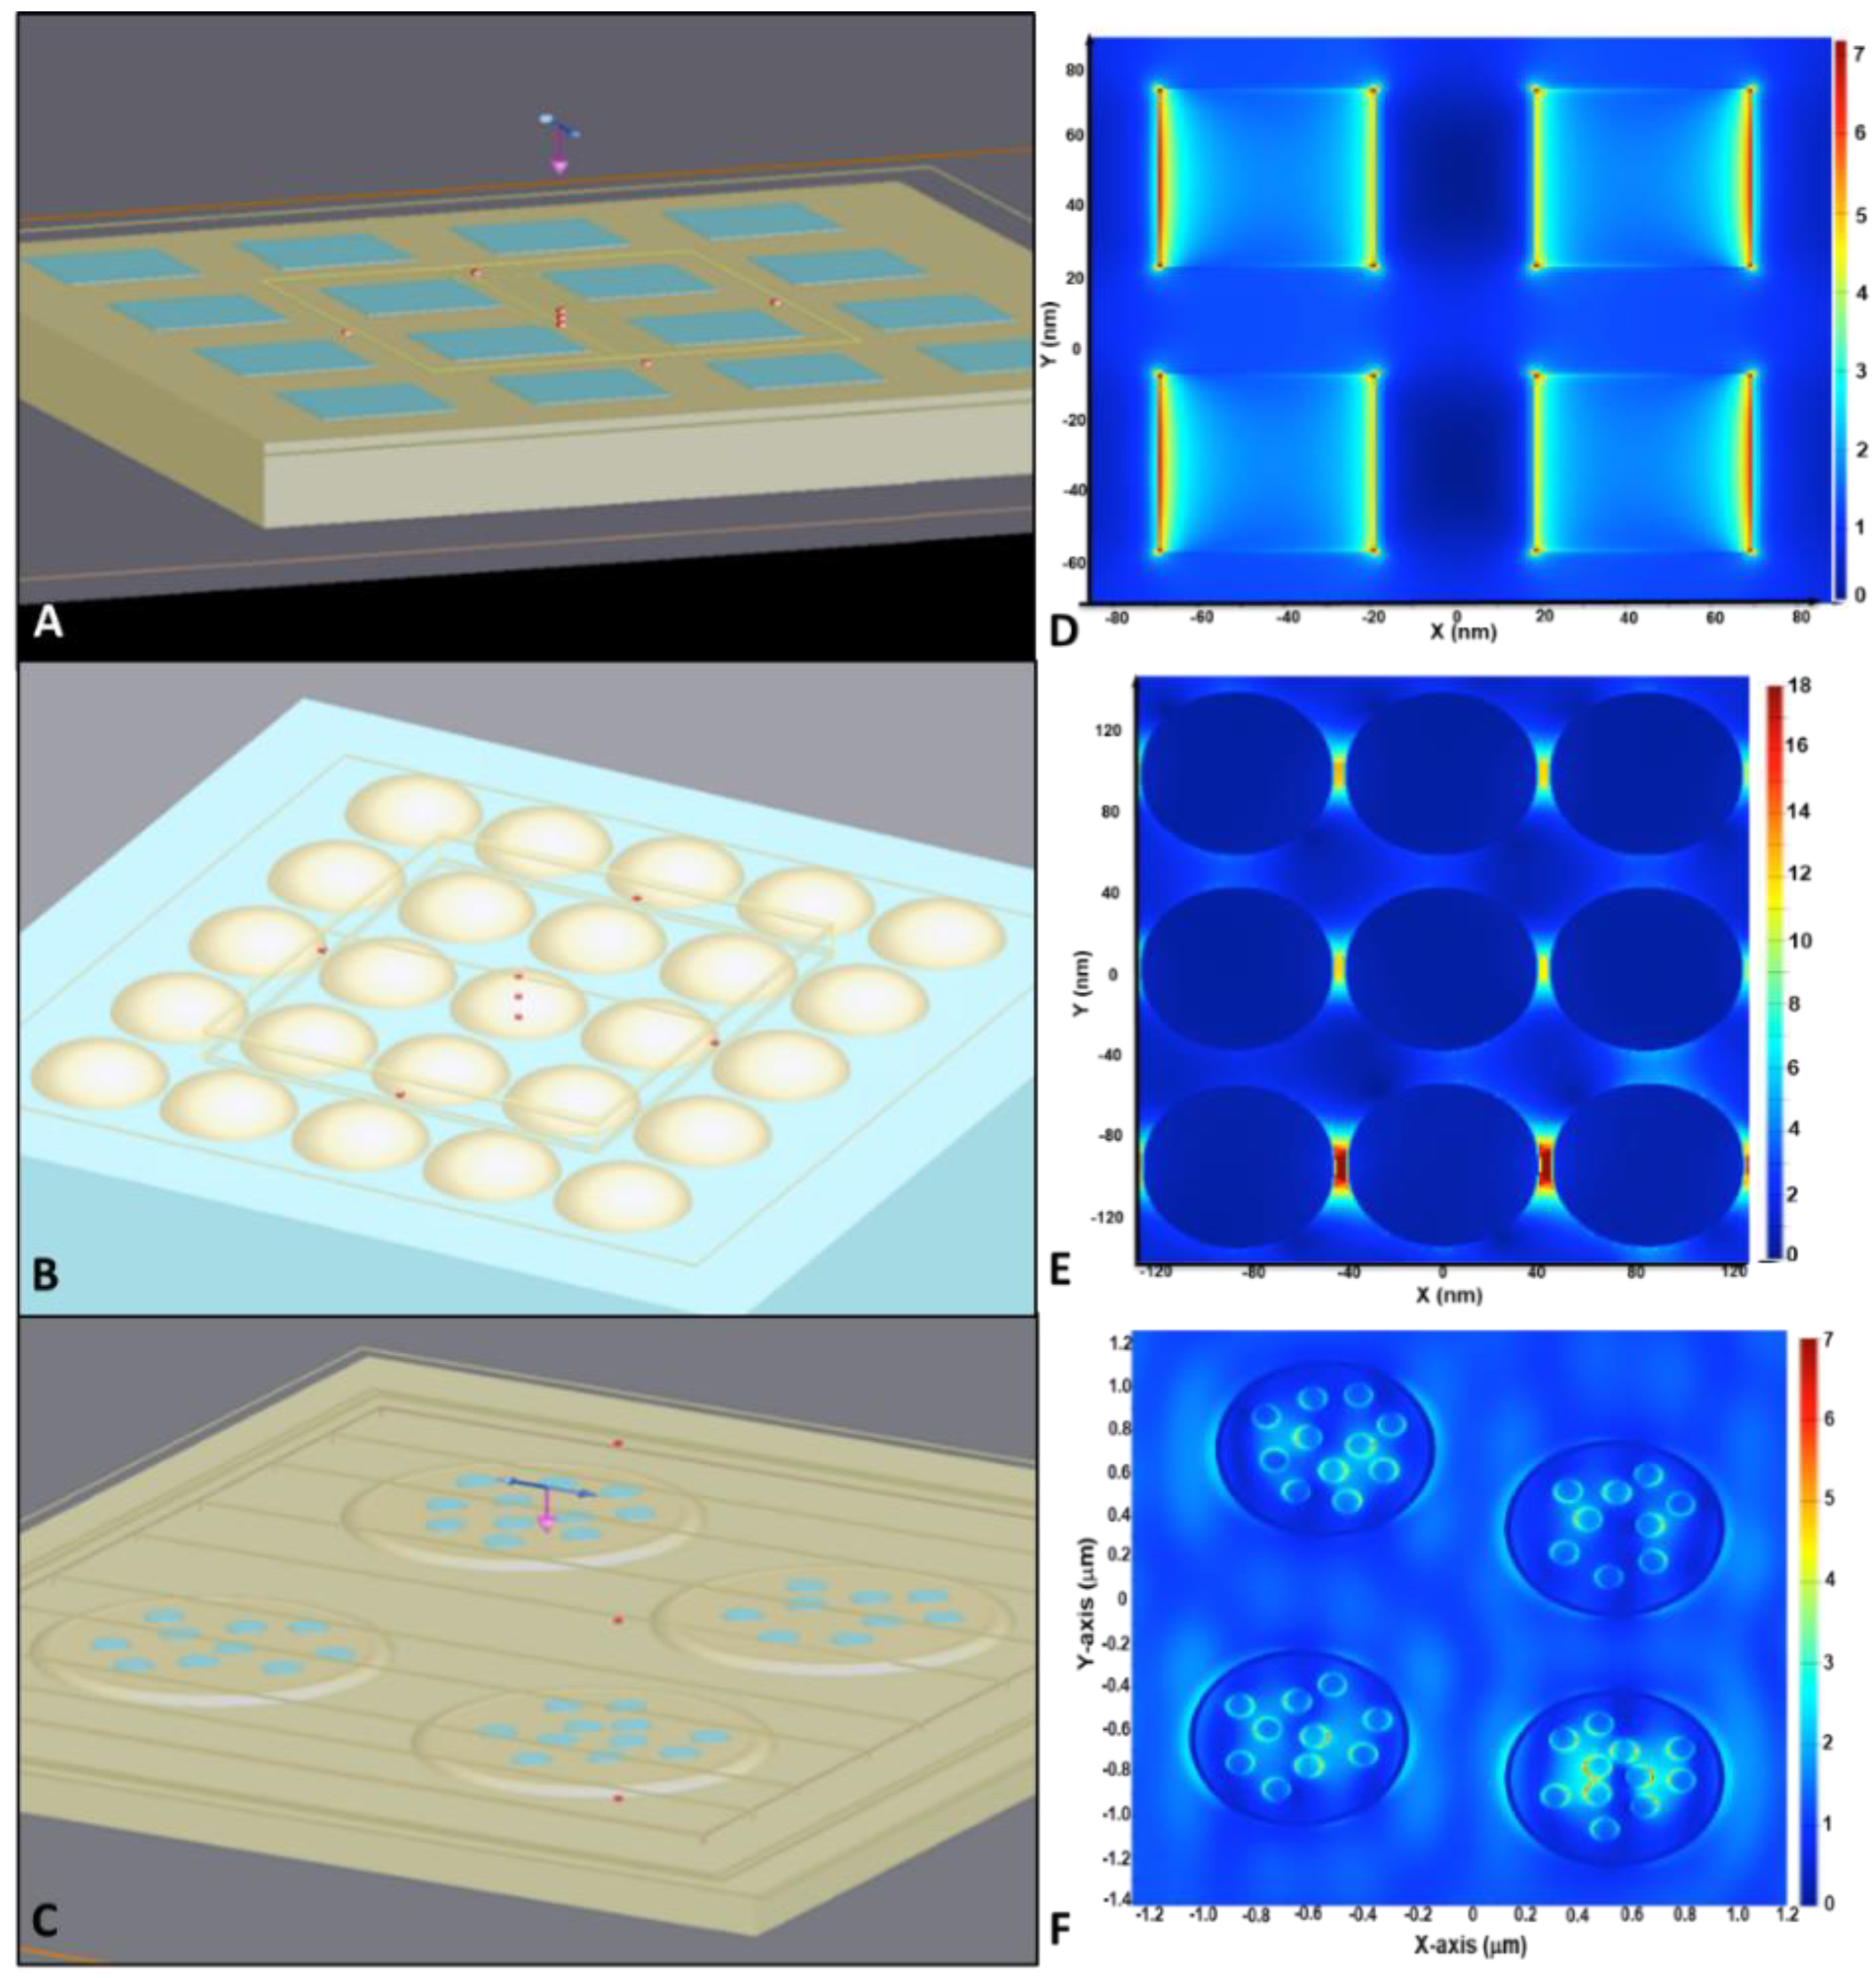
2.2. Theoretical Simulations

Theoretical simulations of different natural SERS substrates (peafowl, diatoms and opal) were performed using the finite difference time domain method [48]. The designs of these structures were constructed to mimic the actual structures of the devices. The electric field distribution over the nanostructures was calculated using Lumerical, a commercial software package. The mesh size was fixed to 1 nm in the X, Y and Z directions for all calculations. Regarding peafowl, a gold bar (side length = 370 nm, material dispersion from Johnson and Christy [49]) with many overriding functions of dielectric materials (refractive index = 1, side length = 50 nm) was designed in such a manner that the refractive index of the metal area where dielectric bars were inserted became equal to the dielectric one. The gap between the adjacent dielectric materials wais 35 nm. Periodic boundary conditions in the X and Y directions were chosen to calculate the distribution of the electric field (EF). A plane wave with polarization along the horizontal axis at 633 nm was employed to illuminate the peafowl device from the top. Regarding the opal’s structure, many gold spheres (radius = 40 nm, material dispersion from Johnson and Christy [49]) were immersed in the dielectric material to resemble the design of an opal. The gap between two gold nanosphere was fixed to 5 nm. Periodic boundary conditions in the X and Y directions were adopted to calculate the distribution of the EF. An incident wavelength of 633 nm was chosen to illuminate the device, and polarization was fixed to an angle of 45°. Regarding the diatoms, we first constructed four circular toroid structures with inner radii of 905 nm and ring widths of 100 nm. The height of the gold ring structures was 92 nm. Within this toroid, many small, circular toroid structures of 105 nm radius (height of gold ring = 10 nm, ring width = 10 nm) were placed randomly. These structures were placed over a dielectric surface (refractive index = 1) deposited over a gold bar. The calculations were made by illuminating the device with an incident wavelength of 633 nm. The incident field considered was 1 V/m.

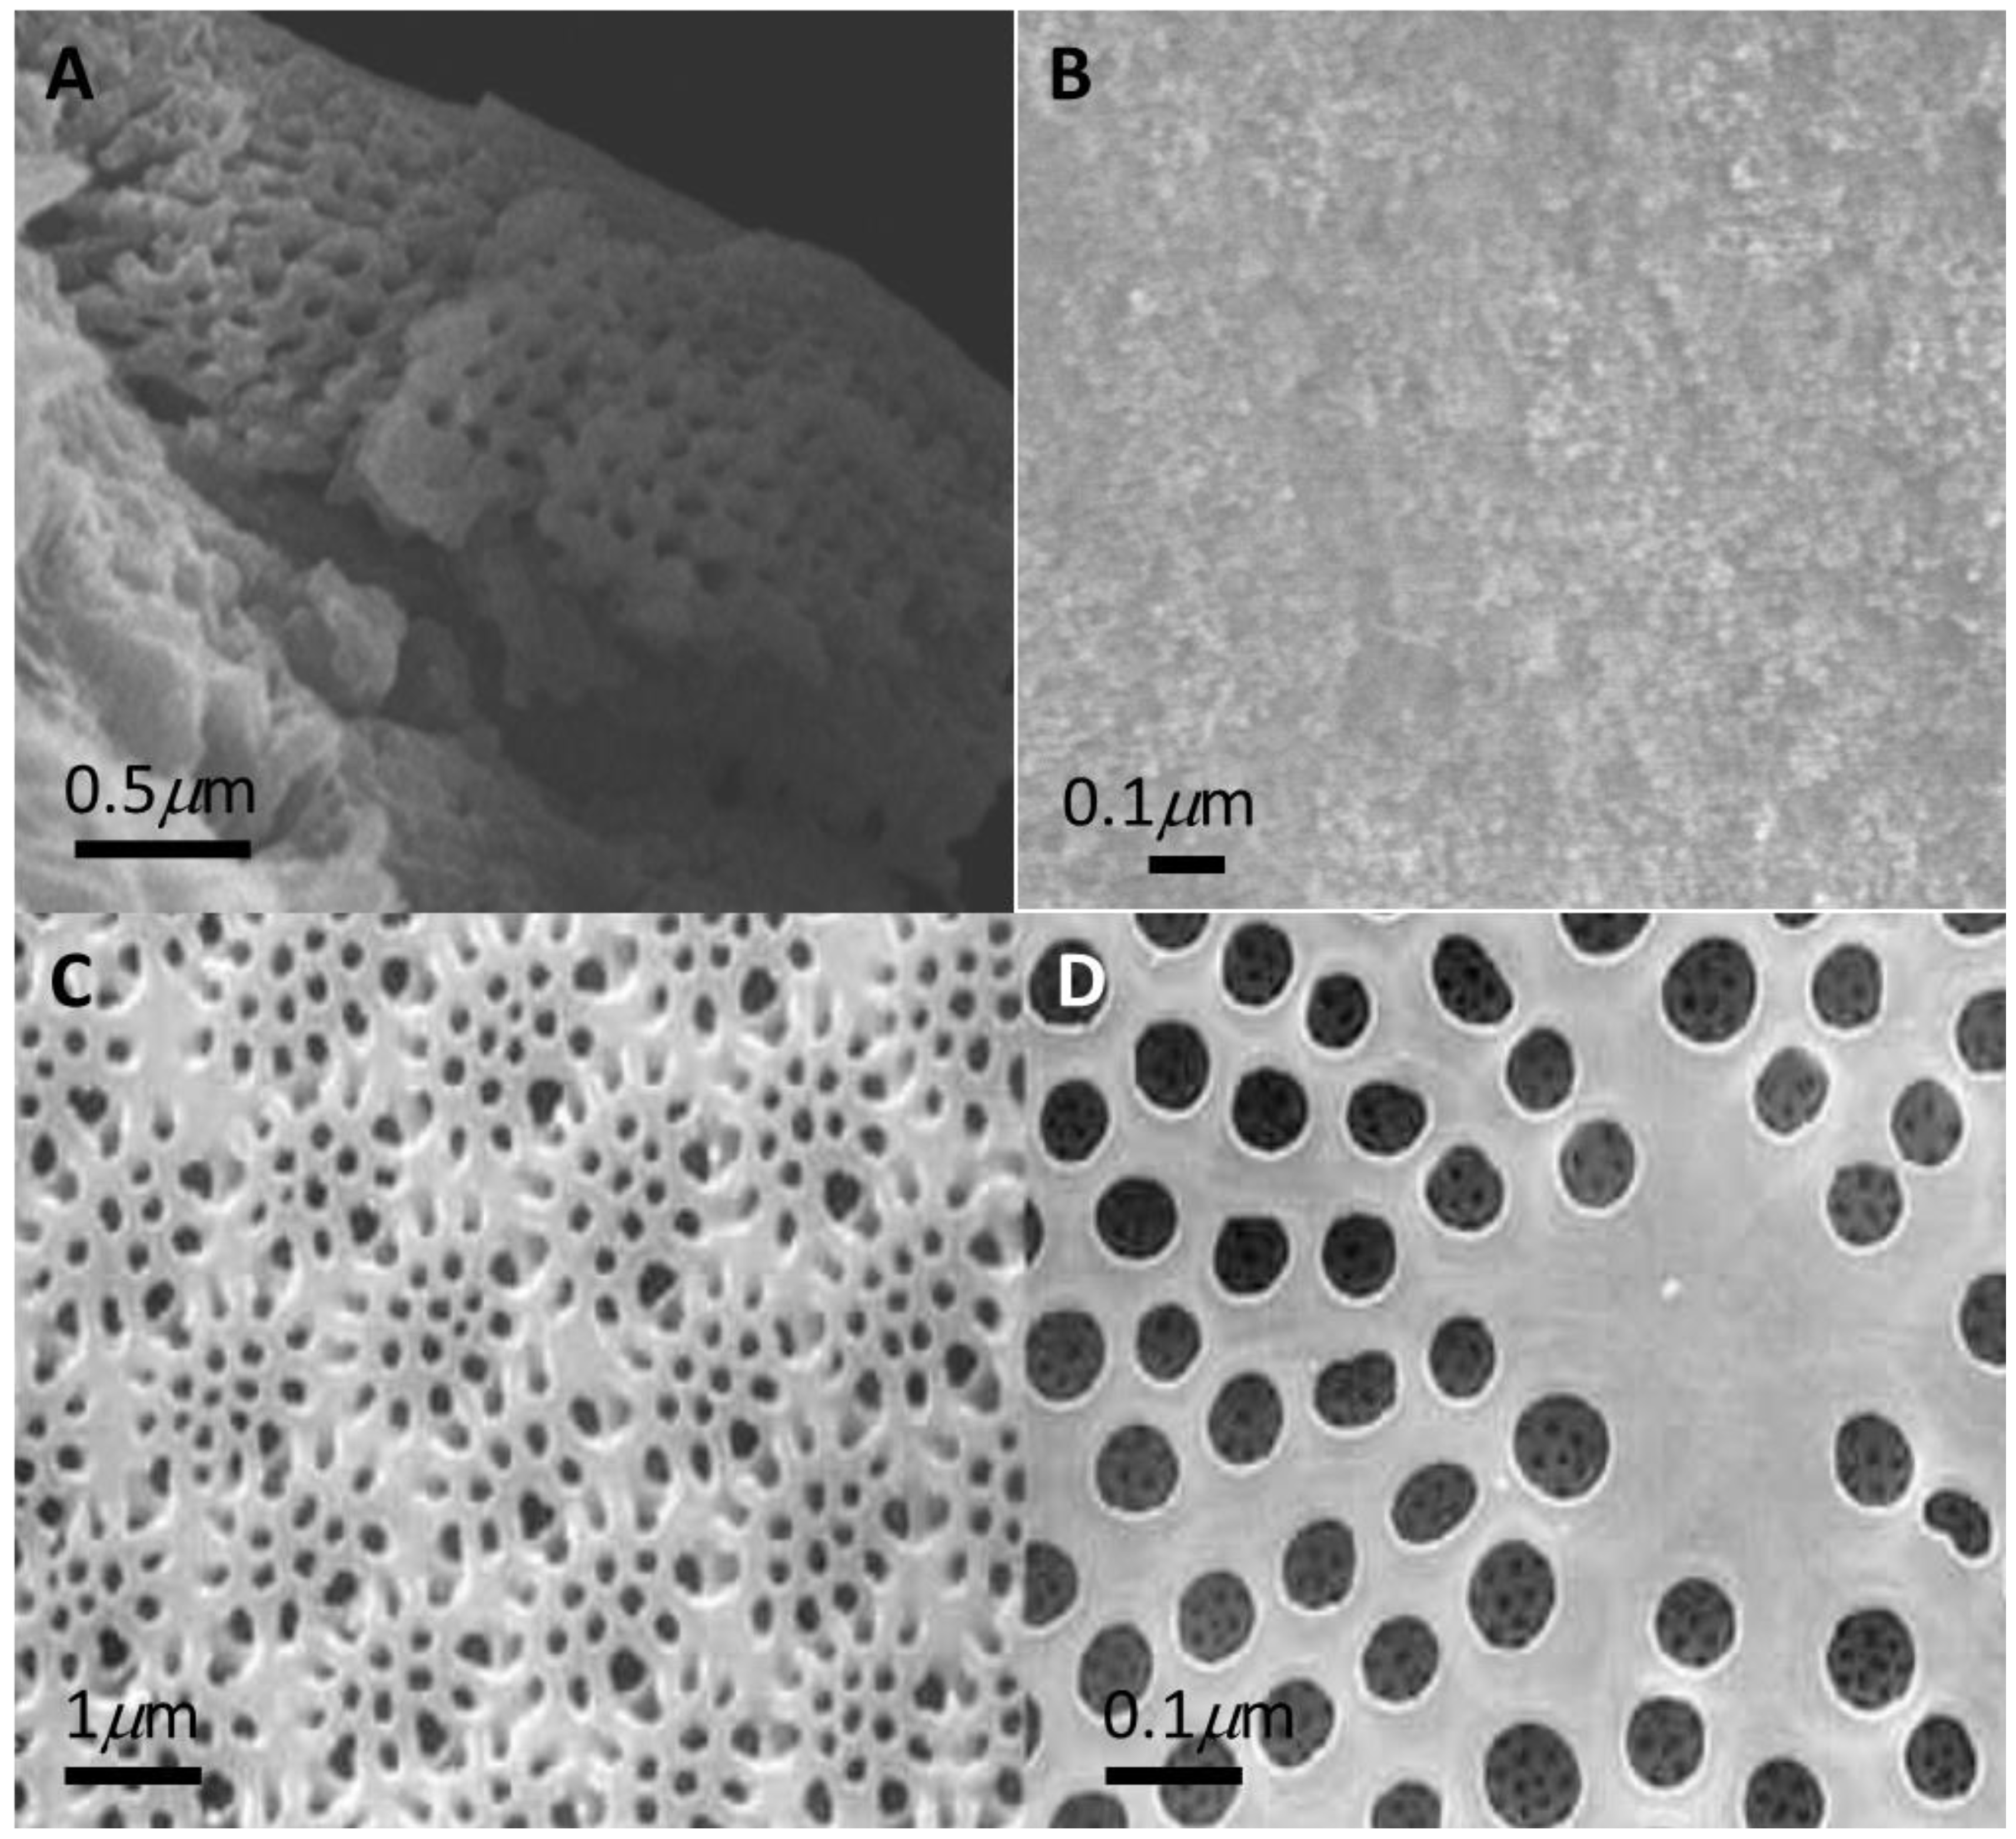
2.3. SEM Characterization

Several scanning electron microscope (SEM) images of the samples were captured to investigate the sub-micrometre features of the feathers, opals and diatoms, utilizing a Dual Beam scanning electron microscope-focused ion beam (SEM-FIB) Nova 600 NanoLab system (FEI Company, Eindhoven, Netherlands). During the acquisitions, beam energies of 5 and 15 keV, and 45 corresponding electron currents of 0.98 pA and 0.14 nA, were used. Optical images were taken on a Nikon Ti-E, on which a colour camera Nikon DS-Fi2 was mounted (Nikon Instruments SpA, Firenze, Italy).

2.4. Raman Spectroscopy Characterization of the Natural Plasmonic Nanostructures

To determine the effect of SERS on the natural structures, we metallized their surfaces. An apparatus for deposition by sputtering was used to deposit a thin layer of gold (Au) onto the structures. The opal, 10 × 14.5 mm in size, a sample of a few centimetres cut out from the feather eyespot and diatoms were processed for 30 s, using a current of 50 mA at a voltage of 230 Volts (50 Hz) and a pressure of 100 mbar, to deposit around 10 nm of gold on the samples’ surfaces. An Au thickness of 10 nm was chosen to avoid excessive filling of the nanohole structures (this is especially visible in Figure 1C,D). Obviously, the Au thickness was kept constant for all samples to allow a comparison between them. An inVia confocal Raman microscope was used for the optical characterization of the natural plasmonic nanostructures. We set used a wavelength of 633 nm for the laser, a 50× objective and an integration time of 10 s, while the power was set to 2.5 mW for each sample. Spectra were recorded by raster scanning the samples’ surfaces, collecting at least 100 spectra, so that for each sample, the point-to-point variation could be estimated. The SERS capabilities of the natural structures were probed using Rhodamine-6G, a fluorescent organic molecule purchased from Sigma Aldrich. A drop of 200 µL of Rhodamine-6G at a concentration of 10−5 M was deposited on the opal and feather samples. Meanwhile, 5 mg of diatoms were dissolved in 100 µL of Rhodamine-6G at a concentration of 10−5 M and placed on a calcium fluoride slide. Each sample was analysed by recording the Raman signal after the samples had been completely dried in air. Because the opal showed the highest amplification effect (as will be seen in the next sections), 200 µL of Rhodamine-6G at concentrations of 10−7 M and 10−12 M were deposited on these samples and measurements were recorded. To demonstrate the amplification effect of the mentioned natural structures on Raman spectroscopy, we compared the response of the signal coming from Rhodamine-6G deposited on a flat silicon substrate, covered with gold.
The SERS spectra shown in this work represent the average spectrum of ten spectra recorded at different positions on the samples. Before the comparison between the SERS spectra, a background subtraction was carried out using the spectra recorded on the same samples without R6G (under the same experimental conditions).

3. Results and Discussion

3.1. Optical and SEM Images of the Characterized Samples

Regarding the diatoms, on a micrometric scale it is possible to highlight the sub-micrometric structures randomly placed in the space from regular and repeated perforations in the thickness of the frustules. The diameters of the pores vary, and their dimensions range from 50 nm to 0.5 μm (Figure 1C,D). The opal, on the scanning electron microscope, as shown in Figure 1B, appeared as a homogenous agglomerate of nanospheres with a diameter of tens of nanometres. Taking a SEM image of the peacock feather was very difficult (Figure 1A). In fact, on the micrometre scale, it showed a complex three-dimensional structure. This did not allow us to deposit a thin homogenous layer of gold on it; therefore, SEM imaging was not always clear. However, the SEM image in Figure 1 clearly shows the sub-micrometric structures of the feather.

3.2. Simulated Enhanced Fields
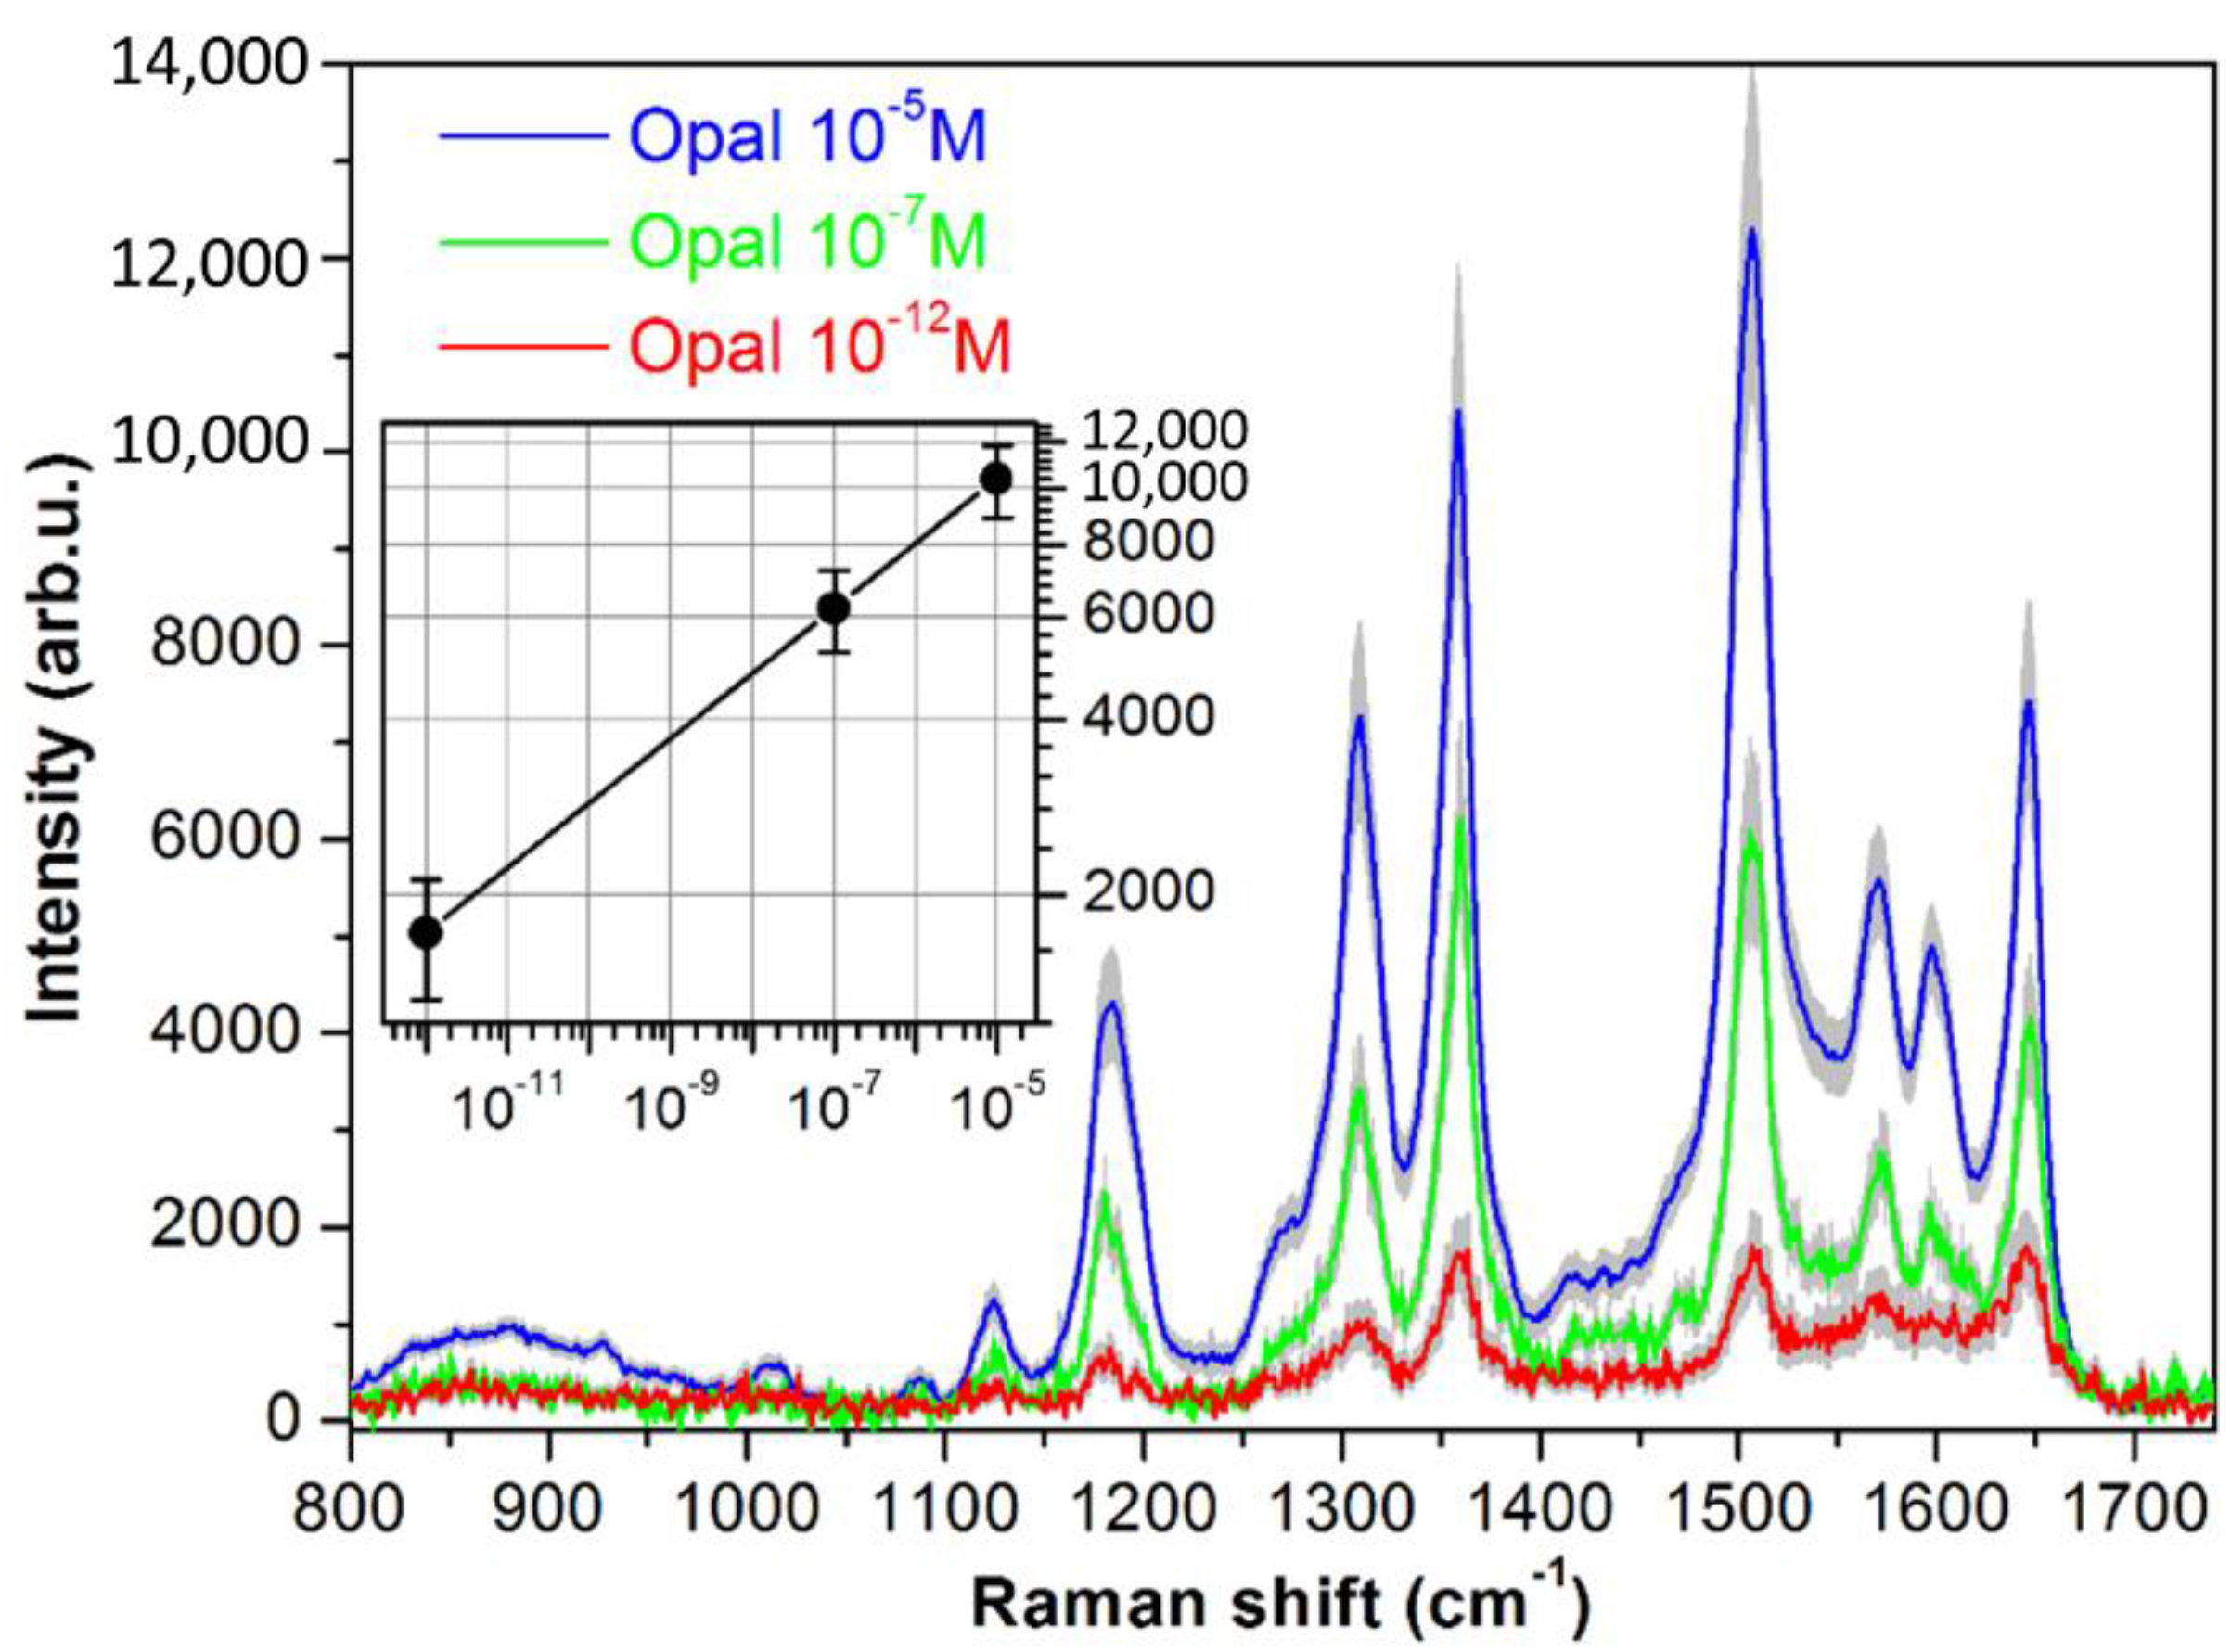
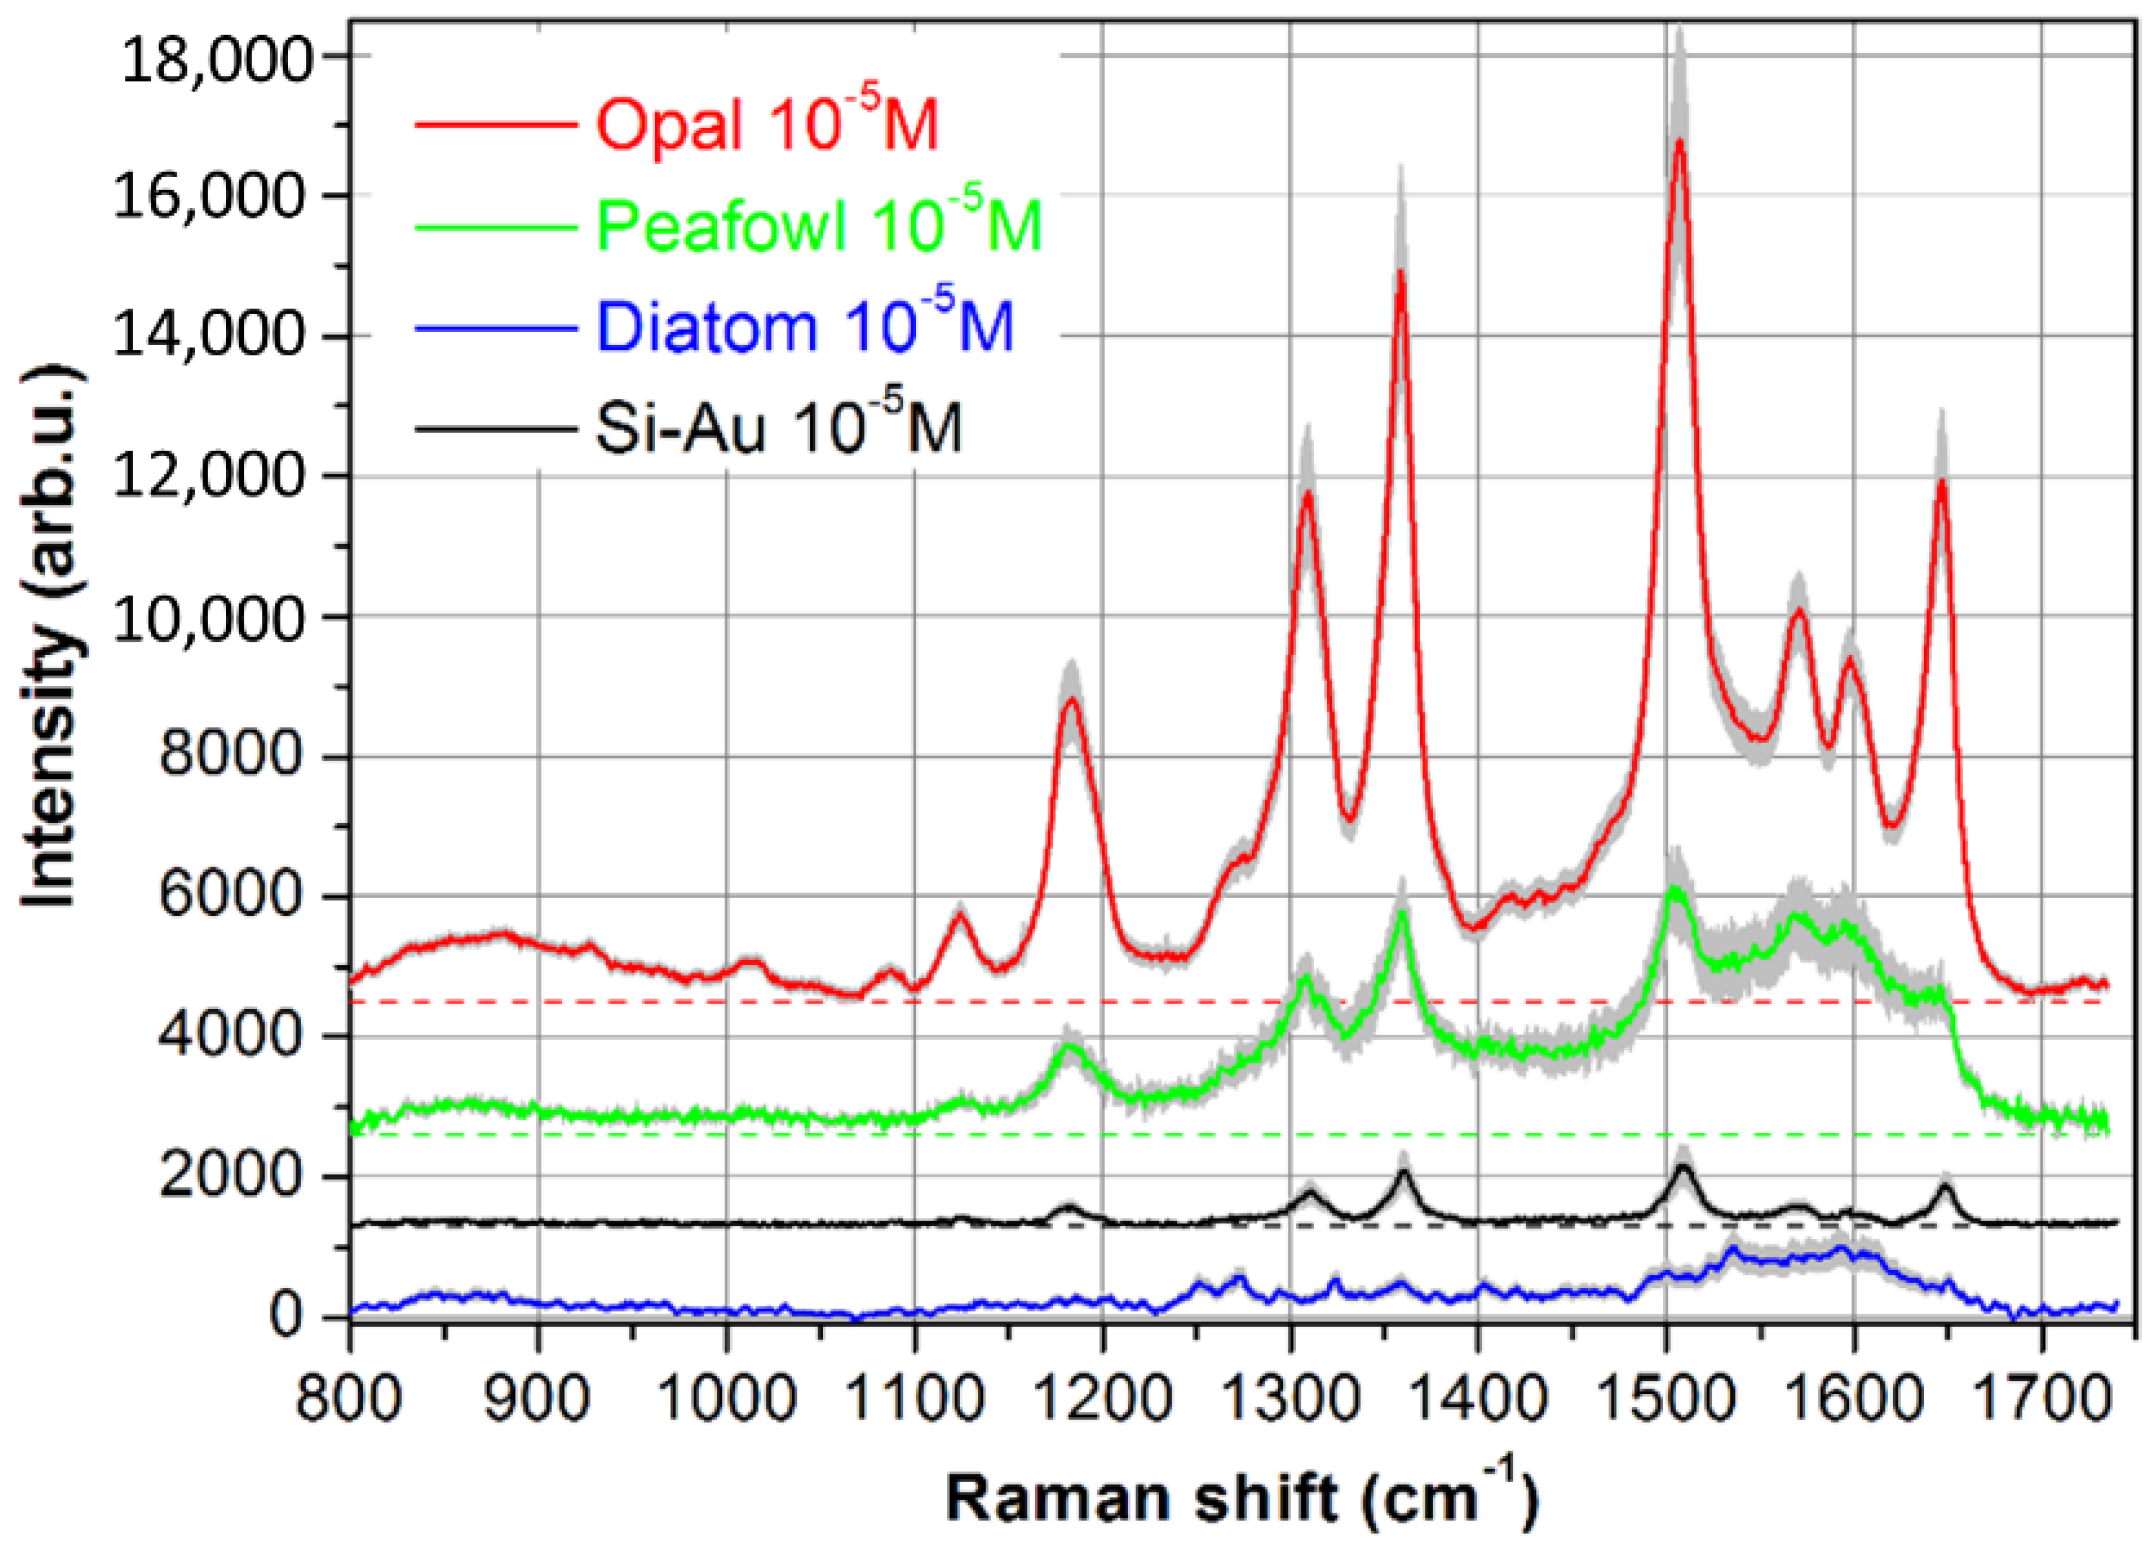
Three different calculations were made for different structures to resemble their associated SERS structures using the FDTD (Finite-Domain Time-Domain) method. The design of the peacock feather is shown in Figure 2A, representing the perspective view of the structure. The calculation shows the confinement of the electric field at the corners of the peafowl structure. The maximum electric field was reached at close to 7 V/m, as shown in Figure 2B. In the case of the opal structure, the localization of electric field in the gap can be observed clearly (Figure 2D). The maximum electric field was 18 V/m. Regarding the diatom structure, non-homogeneous confinement was observed at the edge of the toroid structure and the maximum amplitude was found to be 7 V/m (Figure 2F). The above findings indicate the superior performance of the opal structure as a SERS substrate exited at a wavelength of 633 nm.

3.3. Raman Analysis

The preparation of the natural nano structures to be applied in the Raman analysis did not require any particular technique as explained in the Section 2.4. These were used as substrates to perform Raman measurements on samples of Rhodamine 6G. Under the action of the laser excitation, Rhodamine 6G showed peaks at 614, 774, 1182, 1362, 1507 and 1648 cm−1. The 614 cm−1 peak corresponds to the C–C–C ring in-plane bending mode. The C–H out-of-plane bending mode for R6G was observed at 774 cm−1 while the C–O–C stretching frequency appeared at 1182 cm−1. Peaks centred at 1362, 1507, 1571 and 1648 cm−1 were attributed to the aromatic C–C stretch of the R6G molecule [50]. As is evident from the spectra images (Figure 3), typical characteristic peaks from Rhodamine-6G are observed our measurements.
The spectra obtained from each natural structure were processed with the aim of highlighting the qualitative aspects of the results and comparing the measurements. Each sample showed a different behaviour, mainly due to structural reasons. The best response came from the opal (marked in red in the image above). This was due to the small size of its nanospheres, whose diameters are a few dozens of nm, as well as its regular and flat conformation, which allowed, in addition to complete gold coverage, direct interaction between the source laser and the molecule. The spectrum obtained using the peacock feather as support for the Raman analysis, showed visible, but low intensity, peaks (marked in green in the image above). In fact, the irregular structure of the peacock feather does not allow complete gold coverage, and consequently part of the sample was not able to produce the SERS effect. Moreover, since the surface of the feather, at the microscale, was not flat, the deposited solution containing Rhodamine did not stand in position, falling out of the sample in a few minutes. Another limitation was the usable power intensity as high powers can damage the feather. The detected peaks concerning the diatoms (marked in blue in the image above) were indistinguishable from baseline and did not allow the characterization of the molecule. This happened because, while in the peacock feather and the opal, the nanostructures were in direct contact with the analyte and largely exposed to the laser beam, the diatoms 3D tubular structures were casually arranged in the space. In addition, the 3D structure caused the absorption of a portion of the molecule; thus, most of the signal came from diatoms and not from Rhodamine, and that is why the silicon pattern (marked in black in the image above), even without nanostructures, showed peaks higher than those of the diatoms. Furthermore, the irregularity of the diatoms does not allow total gold coverage; the size of the diatom nanostructure is bigger than the nanostructure of the other samples, causing a decrease in the enhancement obtainable. Improvements in the SERS signals were computed as intensity ratios between the natural nanostructures and flat Si–Au samples for the peak at 1358 cm−1. We found that the SERS improvement for opal was approximately 13.88, peafowl had a much lower value of 1.88, while for diatom, the value of 0.63 indicated that the Si–Au substrate behaved much better as SERS substrate. Considering that SERS intensities scale like the fourth power of the electric field, the just-mentioned ratios correspond to the following improvements in the enhancing factors: 1.93 for opal, 1.17 for peafowl, and 0.89 for diatom. It is worth remarking that these values are not the absolute enhancing factors of the electric field, but only the relative values with reference to Si–Au SERS enhancing factor. As already reported the literature (see as an example [51]), the overall SERS intensity in plasmonic nanostructures is strongly dominated by only few positions where the highest electric field enhancement is achieved (hot spots). By comparing the signal intensities at 1361 cm−1, we observed a SERS ratio of approximately 3 between the opal and the peacock feather samples. On the other hand, by comparing the maximum enhancement factors of the electric fields obtained with the FDTD simulations, the same SERS ratio was approximately 36 between the opal and peacock samples (taking into account that SERS signal scale up like the fourth power of the electric field). However, it should be considered that the spatial pitch (1D) of the opal structures was double that of the pitch of the peacock feather, and consequently the opal sample had a number of hot spots per surface unit that were four times smaller than those of the peacock feather. As a conclusion, the FDTD simulations provided an SERS ratio of approximately 9 between the opal and peacock samples. The further disagreement between the FDTD and experimental values was likely due to the structural variations intrinsically expected in natural nanostructures. Finally, even though the maximum enhancement factor of the electric field in the diatom hot spots was similar to that of peacock feather, the number of hot spots per unit surface was much smaller in diatoms, thus explaining the low SERS intensity observed in the experiments. In conclusion, the positive performance shown by the opal allowed a greater decrease in the Rhodamine-6G concentration. Using this sample, Rhodamine-6G was detected at a value of 10−12 M (Figure 4).

4. Conclusions

Nowadays, the fabrication of prototypes able to sustain the SERS effect requires high costs and time-consuming procedures, which do not always allow the expected result to be achieved. In this work, we exploited samples existing in nature to obtain SERS devices capable of increasing the Raman signal. The integration of natural structures into Raman analysis is linked to a lower cost, speed and greater ease of use. Each analysed sample showed a different response due to structural reasons. The diatoms were not suitable for the experiment, the peacock feather could be suitable with some modifications and improvements, and the opal was an efficient medium that was able to determine a positive response even at very low concentrations. This result could become a relevant device for the Raman spectroscopy community.

Author Contributions

E.D.F., A.S.F. and G.P. conceived and designed the experiments; L.R., S.A.P. and M.L.C. performed the experiments; G.D. performed the simulations; G.D. and P.C. analyzed the data; M.D.S. contributed reagents/materials/analysis tools; G.P., L.R. and G.D. wrote the paper.

Acknowledgments

This work was supported by the project for Young researchers financed from the Italian Ministry of Health “High Throughput analysis of cancer cells for therapy evaluation by microfluidic platforms integrating plasmonic nanodevices” (CUP J65C13001350001, project No. GR-2010-2311677) granted to the nanotechnology laboratory of the Department of Experimental and Clinical Medicine of the University “Magna Graecia” of Catanzaro.

Conflicts of Interest

The authors declare no conflict of interest.

References

  1. DeVetter, B.M.; Mukherjee, P.; Murphy, C.J.; Bhargava, R. Measuring binding kinetics of aromatic thiolated molecules with nanoparticles via surface-enhanced Raman spectroscopy. Nanoscale 2015, 7, 8766–8775. [Google Scholar] [CrossRef] [PubMed]
  2. Geng, J.; Aioub, M.; El Sayed, M.A.; Barry, B.A. An Ultraviolet Resonance Raman Spectroscopic Study of Cisplatin and Transplatin Interactions with Genomic DNA. J. Phys. Chem. B 2017, 121, 8975–8983. [Google Scholar] [CrossRef] [PubMed]
  3. Vo-Dinh, T.; Fales, A.M.; Griffin, G.D.; Khoury, C.G.; Liu, Y.; Ngo, H.; Norton, S.J.; Register, J.K.; Wang, H.N.; Yuan, H. Plasmonic nanoprobes: From chemical sensing to medical diagnostics and therapy. Nanoscale 2013, 5, 10127–10140. [Google Scholar] [CrossRef] [PubMed]
  4. Zavaleta, C.L.; Kircher, M.F.; Gambhir, S.S. Raman’s “Effect” on Molecular Imaging. J. Nucl. Med. 2011, 52, 1839–1844. [Google Scholar] [CrossRef] [PubMed]
  5. Le Ru, E.; Etchegoin, P.G. Principles of Surface-Enhanced Raman Spectroscopy; Elsevier: New York, NY, USA, 2008; ISBN 978-0-444-52779-0. [Google Scholar]
  6. Kim, D.; Campos, A.R.; Datt, A.; Gao, Z.; Rycenga, M.; Burrows, N.D.; Greeneltch, N.G.; Murphy, C.A.M.C.J.; van Duyne, R.P.; Haynes, C.L. Microfluidic-SERS Devices for One Shot Limit-of-Detection. Analyst 2014, 139, 3227–3234. [Google Scholar] [CrossRef] [PubMed]
  7. Hamon, C.; Liz-Marzán, L.M. Colloidal Design of Plasmonic Sensors Based on Surface Enhanced Raman Scattering. J. Colloid Interface Sci. 2018, 512, 834–843. [Google Scholar] [CrossRef] [PubMed]
  8. Gentile, F.; Das, G.; Coluccio, M.L.; Mecarini, F.; Accardo, A.; Tirinato, L.; Tallerico, R.; Cojoc, G.; Liberale, C.; Candeloro, P.; et al. Ultra low concentrated molecular detection using super hydrophobic surface based biophotonic devices. Microelectron. Eng. 2010, 87, 798–801. [Google Scholar] [CrossRef]
  9. Das, G.; Coluccio, M.L.; Alrasheed, S.; Giugni, A.; Allione, M.; Torre, B.; Perozziello, G.; Candeloro, P.; Di Fabrizio, E. Plasmonic nanostructures for the ultrasensitive detection of biomolecules. Riv. Nuovo Cimento 2016, 39, 547–586. [Google Scholar]
  10. Perozziello, G.; Giugni, A.; Allione, M.; Torre, B.; Das, G.; Coluccio, M.L.; Marini, M.; Tirinato, L.; Moretti, M.; Limongi, T.; et al. Nanoplasmonic and microfluidic devices for biological sensing. In NATO Science for Peace and Security Series B: Physics and Biophysics; Springer: Berlin, Germany, 2017; pp. 247–274. [Google Scholar]
  11. Perozziello, G.; Candeloro, P.; de Grazia, A.; Esposito, F.; Allione, M.; Coluccio, M.L.; Tallerico, R.; Valpapuram, I.; Tirinato, L.; Das, G.; et al. Microfluidic device for continuous single cells analysis via Raman spectroscopy enhanced by integrated plasmonic nanodimers. Opt. Express 2016, 24, A180–A190. [Google Scholar] [CrossRef] [PubMed]
  12. Itoh, T.; Yamamoto, Y.S.; Ozaki, Y. Plasmon-enhanced spectroscopy of absorption and spontaneous emissions explained using cavity quantum optics. Chem. Soc. Rev. 2017, 46, 3904–3921. [Google Scholar] [CrossRef] [PubMed]
  13. Gao, Z.; Burrows, N.D.; Valley, N.A.; Schatz, G.C.; Murphy, C.J.; Haynes, C.L. In Solution SERS Sensing Using Mesoporous Silica-Coated Gold Nanorods. Analyst 2016, 141, 5088–5095. [Google Scholar] [CrossRef] [PubMed]
  14. Hooshmand, N.; Mousavi, H.S.; Panikkanvalappil, S.R.; Adibi, A.; El-Sayed, M.A. High-sensitivity molecular sensing using plasmonic nanocube chains in classical and quantum coupling regimes. Nano Today 2017, 17, 14–22. [Google Scholar] [CrossRef]
  15. Kanipe, K.N.; Chidester, P.P.F.; Stucky, G.D.; Meinhart, C.D.; Moskovits, M. Properly Structured, Any Metal Can Produce Intense Surface Enhanced Raman Spectra. J. Phys. Chem. C 2017, 121, 14269–14273. [Google Scholar] [CrossRef]
  16. Coluccio, M.L.; Gentile, F.; Das, G.; Nicastri, A.; Perri, A.M.; Candeloro, P.; Perozziello, G.; Proietti, R.; Totero-Gongora, J.S.; Alrasheed, S.; et al. Detection of single amino acid mutation from human breast cancer by plasmonic self-similar chain. Sci. Adv. 2015, 1, e1500487. [Google Scholar] [CrossRef] [PubMed]
  17. Perozziello, G.; Candeloro, P.; Gentile, F.; Nicastri, A.; Perri, A.M.; Coluccio, M.L.; Parrotta, E.; de Grazia, A.; Tallerico, M.; Pardeo, F.; et al. A microfluidic dialysis device for complex biological mixture SERS analysis. Microelectron. Eng. 2015, 144, 37–41. [Google Scholar] [CrossRef]
  18. Perozziello, G.; Candeloro, P.; Gentile, F.; Nicastri, A.; Perri, A.; Coluccio, M.L.; Adamo, A.; Pardeo, F.; Catalano, R.; Parrotta, E.; et al. Microfluidics & Nanotechnology: Towards fully integrated analytical devices for the detection of cancer biomarkers. RSC Adv. 2014, 4, 55590–55598. [Google Scholar]
  19. Coluccio, M.L.; Gentile, F.; Francardi, M.; Perozziello, G.; Malara, N.; Candeloro, P.; Di Fabrizio, E. Electroless Deposition and Nanolithography Can Control the Formation of Materials at the Nano-Scale for Plasmonic Applications. Sensors 2014, 14, 6056–6083. [Google Scholar] [CrossRef] [PubMed]
  20. Candeloro, P.; Iuele, E.; Perozziello, G.; Coluccio, M.L.; Gentile, F.; Malara, N.; Mollace, V.; Di Fabrizio, E. Plasmonic nanoholes as SERS devices for biosensing applications: An easy route for nanostructures fabrication on glass substrates. Microelectron. Eng. 2017, 175, 30–33. [Google Scholar] [CrossRef]
  21. Coluccio, M.L.; Francardi, M.; Gentile, F.; Candeloro, P.; Ferrara, L.; Perozziello, G.; Di Fabrizio, E. Plasmonic 3D-structures based on silver decorated nanotips for biological sensing. Opt. Lasers Eng. 2016, 76, 45–51. [Google Scholar] [CrossRef]
  22. Vinod, M.; Gopchandran, K.G. Au, Ag and Au:Ag colloidal nanoparticles synthesized by pulsed laser ablation as SERS substrates. Prog. Nat. Sci. Mater. Int. 2014, 24, 569–578. [Google Scholar] [CrossRef]
  23. Cyrankiewicz, M.; Wybranowski, T.; Kruszewski, S. Study of SERS efficiency of metallic colloidal systems. J. Phys. Conf. Ser. 2007, 79, 012013. [Google Scholar] [CrossRef]
  24. Kneipp, K.; Kneipp, H.; Manoharan, R.; Hanlon, E.B.; Itzkan, I.; Dasari, R.R.; Feld, M.S. Extremely Large Enhancement Factors in Surface-Enhanced Raman Scattering for Molecules on Colloidal Gold Clusters. Appl. Spectrosc. 1998, 52, 1493–1497. [Google Scholar] [CrossRef]
  25. Lee, C.; Robertson, C.S.; Nguyen, A.H.; Kahraman, M.; Wachsmann-Hogiu, S. Thickness of a metallic film, in addition to its roughness, plays a significant role in SERS activity. Sci Rep. 2015, 5, 11644. [Google Scholar] [CrossRef] [PubMed]
  26. Botta, R.; Rajanikanth, A.; Bansal, C. Silver nanocluster films for glucose sensing by Surface Enhanced Raman Scattering (SERS). Sens. Bio-Sens. Res. 2016, 9, 13–16. [Google Scholar] [CrossRef]
  27. Pisco, M.; Galeotti, F.; Quero, G.; Grisci, G.; Micco, A.; Mercaldo, L.V.; Veneri, P.D.; Cutolo, A.; Cusano, A. Nanosphere lithography for optical fiber tip nanoprobes. Light Sci. Appl. 2017, 6, e16229. [Google Scholar] [CrossRef]
  28. Garoff, S.; Weitz, D.A.; Alvarez, M.S.; Chung, J.C. Electromagnetically Induced Changes in Intensities, Spectra and Temporal Behavior of Light Scattering from Molecules on Silver Island Films. J. Phys. Colloq. 1983, 44, C10-345–C10-348. [Google Scholar] [CrossRef]
  29. Edel, J.B.; Kornyshev, A.A.; Urbakh, M. Self-Assembly of Nanoparticle Arrays for Use as Mirrors, Sensors and Antennas. ACS Nano 2013, 7, 9526–9532. [Google Scholar] [CrossRef] [PubMed]
  30. Zhang, X.; Young, M.A.; Lyandres, O.; van Duyne, R.P. Rapid detection of an anthrax biomarker by surface-enhanced Raman spectroscopy. J. Am. Chem. Soc. 2005, 127, 4484–4489. [Google Scholar] [CrossRef] [PubMed]
  31. Cho, H.; Kumar, S.; Yang, D.; Vaidyanathan, S.R.; Woo, K.; Garcia, I.; Shue, H.J.; Yoon, Y.; Ferreri, K.; Choo, H. SERS-Based Label-Free Insulin Detection at Physiological Concentrations for Analysis of Islet Performance. ACS Sens. 2018, 3, 65–71. [Google Scholar] [CrossRef] [PubMed]
  32. Ngo, H.T.; Wang, H.; Burke, T.; Ginsburg, G.S.; Vo-Dinh, T. Multiplex detection of disease biomarkers using SERS molecular sentinel-on-chip. Anal. Bioanal. Chem. 2014, 406, 3335–3344. [Google Scholar] [CrossRef] [PubMed]
  33. Ngo, H.T.; Wang, H.; Fales, A.M.; Vo-Dinh, T. Plasmonic SERS biosensing nanochips for DNA detection. Anal. Bioanal. Chem. 2016, 408, 1773–1781. [Google Scholar] [CrossRef] [PubMed]
  34. Kanipe, K.N.; Chidester, P.P.F.; Stucky, G.D.; Moskovits, M. Large Format Surface-Enhanced Raman Spectroscopy Substrate Optimized for Enhancement and Uniformity. ACS Nano 2016, 10, 7566–7571. [Google Scholar] [CrossRef] [PubMed]
  35. Srinivasarao, M. Nano-Optics in the biological World: Beetles, Butterflies, Birds, and Moths. Chem. Rev. 1999, 99, 1935–1961. [Google Scholar] [CrossRef] [PubMed]
  36. Wu, L.Y.; Ross, B.M.; Hong, S.; Lee, L.P. Bioinspired nanocorals with decoupled cellular targeting and sensing functionality. Small 2010, 6, 503–507. [Google Scholar] [CrossRef] [PubMed]
  37. Zhang, Q.X.; Chen, Y.X.; Guo, Z.; Liu, H.L.; Wang, D.P.; Huang, X.J. Bioinspired multifunctional hetero-hierarchical micro/nanostructure tetragonal array with self-cleaning, anticorrosion, and concentrators for the SERS detection. ACS Appl. Mater. Interfaces 2013, 5, 10633–10642. [Google Scholar] [CrossRef] [PubMed]
  38. Ren, F.; Campbell, J.; Hasan, D.; Wang, X.; Rorrer, G.L.; Wang, A.X. Bio-inspired plasmonic sensors by diatom frustules. In Proceedings of the Lasers and Electro-Optics (CLEO), San Jose, CA, USA, 9–14 June 2013; IEEE: Piscataway, NJ, USA, 2013; pp. 1–2. [Google Scholar]
  39. Hong, S.; Lee, M.Y.; Jackson, A.O.; Lee, P.L. Bioinspired optical antennas: Gold plant viruses. Light Sci. Appl. 2015, 4, e267. [Google Scholar] [CrossRef]
  40. Gentile, F.; Coluccio, M.L.; Accardo, A.; Marinaro, G.; Rondanina, E.; Santoriello, S.; Marra, S.; Das, G.; Tirinato, L.; Perozziello, G.; et al. Tailored Ag nanoparticles/nanoporous superhydrophobic surfaces hybrid devices for the detection of single molecule. Microelectron. Eng. 2012, 97, 349–352. [Google Scholar] [CrossRef]
  41. Li, W.; Camargo, P.H.C.; Lu, X.; Xia, Y. Dimers of Silver Nanospheres: Facile Synthesis and Their Use as Hot Spots for Surface-Enhanced Raman Scattering. Nano Lett. 2009, 9, 485–490. [Google Scholar] [CrossRef] [PubMed]
  42. Velleman, L.; Scarabelli, L.; Sikdar, D.; Kornyshev, A.A.; Liz-Marzán, L.M.; Edel, J.B. Monitoring Plasmon Coupling and SERS Enhancement Through in situ Nanoparticle Spacing Modulation. Faraday Discuss 2017, 205, 67–83. [Google Scholar] [CrossRef] [PubMed]
  43. Geldmeier, J.A.; Mahmoud, M.A.; Jeon, J.W.; El-Sayed, M.; Tsukruk, V.V. The effect of plasmon resonance coupling in P3HT-coated silver nanodisk monolayers on their optical sensitivity. J. Mater. Chem. C 2016, 4, 9813–9822. [Google Scholar] [CrossRef]
  44. Bosnick, K.A.; Wang, H.M.; Haslett, T.L.; Moskovits, M. Quantitative Determination of the Raman Enhancement of Ag30(CO)25 and Ag50(CO)40 Matrix Isolated in Solid Carbon Monoxide. J. Mater. Chem. C 2016, 120, 20506–20511. [Google Scholar] [CrossRef]
  45. Han, J.; Su, H.; Song, F.; Gu, J.; Zhang, D.; Jiang, L. Novel Photonic Crystals: Incorporation of Nano-CdS into the Natural Photonic Crystals within Peacock Feathers. Langmuir 2009, 25, 3207–3211. [Google Scholar] [CrossRef] [PubMed]
  46. De Tommasi, E.; Rea, I.; Mocella, V.; Moretti, L.; De Stefano, M.; Rendina, I.; De Stefano, L. Multi-wavelength study of light transmitted through a single marine centric diatom. Opt. Express 2010, 18, 12203–112212. [Google Scholar] [CrossRef] [PubMed]
  47. De Stefano, M.; De Stefano, L. Nanostructures in diatom frustules: Functional morphology of valvocopulae in cocconeidacean monoraphid Taxa. J. Nanosci. Nanotechnol. 2005, 5, 1–10. [Google Scholar] [CrossRef]
  48. Yu, R.; Liz-Marzán, L.M.; García de Abajo, F.J. Universal Analytical Modeling of Plasmonic Nanoparticles. Chem. Soc. Rev. 2017, 46, 6710–6724. [Google Scholar] [CrossRef] [PubMed]
  49. Johnson, P.B.; Christy, R.W. Optical Constants of the Noble Metals. Phys. Rev. B 1972, 6, 4370. [Google Scholar] [CrossRef]
  50. Sil, S.; Kuhar, N.; Acharya, S.; Umapathy, S. Is Chemically Synthesized Graphene‘Really’ a Unique Substrate for SERS and Fluorescence Quenching? Sci. Rep. 2013, 3, 3336. [Google Scholar] [CrossRef] [PubMed]
  51. Yoshida, K.; Itoh, T.; Tamaru, H.; Biju, V.; Ishikawa, M.; Ozaki, Y. Quantitative evaluation of electromagnetic enhancement in surface-enhanced resonance Raman scattering from plasmonic properties and morphologies of individual Ag nanostructures. Phys. Rev. B 2010, 81, 115406. [Google Scholar] [CrossRef]
Figure 1. SEM image of the peacock feather (A); scanning electron microscope (SEM) images of an opal fragment (B); the outer (C) and inner (D) plates of a single valve of C. wailesii.
Applsci 08 00668 g001
Figure 2. From top left: perspective view of the peacock feather (A); opal (B) and diatom (C) nanostructures. From top right: simulated enhanced electric field of the peacock feather (D); opal (E) and diatom (F) nanostructures.
Applsci 08 00668 g002
Figure 3. Raman spectra of Rhodamine-6G dispersed in a solution at a concentration of 10−5 M measured on opal fragments (opal), peacock feathers (peafowl), diatoms (diatom) and flat silicon surface (Si–Au). It is possible to note the characteristic peaks of the Rhodamine at 1182, 1361, 1508 and 1647 cm−1. The gray shadow of each curve displays the standard deviations of the SERS spectra.
Applsci 08 00668 g003
Figure 4. Raman spectra of Rhodamine-6G measured at a different concentration on opal fragments. The grayshadow of each curve displays the standard deviations of the SERS spectra. In the inset, the 1361 cm−1 peak intensity is reported as a function of the R6G concentration, in a log–log plot.
Applsci 08 00668 g004

