Article

Effects of Electrode Structure and Electron Energy on Abatement of NO in Dielectric Barrier Discharge Reactor

1
Shanghai Key Laboratory of Atmospheric Particle Pollution and Prevention (LAP3), Institute of Environmental Science, Fudan University, Shanghai 200433, China
2
State Grid Rizhao Power Supply Company, Rizhao 276826, China
*
Author to whom correspondence should be addressed.
Appl. Sci. 2018, 8(4), 618; https://doi.org/10.3390/app8040618
Submission received: 24 February 2018 / Revised: 5 April 2018 / Accepted: 11 April 2018 / Published: 15 April 2018
(This article belongs to the Section Chemical and Molecular Sciences)

Abstract

:

Featured Application

In this special issue, we only investigated the compare of two type DBD reactors (CC-DBD and TM-DBD). However, further studies are required about the mathematic relation between electrode structure parameters (electrode length, discharge gap and so on) and electron energy. It is important for industrial application of DBD to understand the effect of O2 content for NOx removal because O2 usually exist in industrial waste gas. The research for electron energy of DBD by using VSim is an effective way, while relevant studies are rare. DBD technologies are paid considerable attention by many scientists and I think the research results in the paper would provide helpful information for the future investigation in the relevant research filed.

Abstract

Electrode structure and electron energy effects on NO abatement were studied in two different structure DBD reactors. Final product analysis of NO abatement in coaxial cylinder dielectric barrier discharge (CC-DBD) and tubular multilayer dielectric barrier discharge (TM-DBD) reactors indicated that the electrode structure of TM-DBD was better under low O2 concentration conditions, but the result was opposite because the new NOx was produced in TM-DBD when O2 concentration was increasing. In addition, results of particle-in-cell with Monte Carlo collisions (PIC-MCC) simulation manifested that the largest and the average electron energy were 12.09 eV and 3.35 eV in TM-DBD reactor, respectively, while they were 5.25 eV and 2.96 eV in CC-DBD reactor, respectively. CC-DBD electrode structures are preferable for better NO abatement and no new NOx under oxygen-containing condition.

Graphical Abstract

1. Introduction

NOx, one of the primary air pollutants, can cause various effects such as photochemical smog, secondary aerosols, and tropospheric ozone [1,2,3,4,5], although NOx plays a positive role in biology [6]. Therefore, abatement of NOx is a subject of great concern around the world. Nonthermal plasma (NTP) can destroy NOx in the gas stream with relatively low energy consumption, ease of operation, and compact system. Dielectric barrier discharge (DBD), one of the most promising NTP generation technologies at an atmospheric pressure with highly efficient and eco-friendly advantages, has even paid attention by ‘plasma medicine’ [7] and particularly distinguished performance in the decomposition of NOx via conventional methods [8,9,10].
Given that NO is the main component of NOx in exhaust gas, the removal of NO is the core problem involved in the denitration field [11,12,13]. Recently, substantial research work using DBD reactors were developed for NO abatement [14,15,16,17,18,19]. Moreover, in most studies, high electron energy was considered the key factor in controlling plasma processes for NO removal [20,21]. Therefore, many researchers have paid attention to the investigation of improving the electron energy of DBD reactors to achieve higher destruction and removal efficiency (DRE) of NO [22,23]. However, high electron energy can lead to the production of new NOx by the oxidation of N generated from N2 dissociation in the DBD reactor. Therefore, preventing new NOx production and improving the better by-product selectivity gradually becomes a great concern on the NO abatement by DBD technique [24,25]. Many researchers investigated the role of electron energy in NO abatement and studied several influencing factors such as input power, electrode gaps and dielectric relative permittivity [26,27,28,29,30,31,32,33,34,35,36,37,38,39,40]. Nevertheless, limited attention has been given to the relation between electron energy and electrode structure although the latter is considered as one of the most important factors in controlling electron energy [41,42].
Numerical simulation, an effective tool in developing the NTP theories and determining the operating parameters, has been developed in recent years [43,44]. Numerical study of the DBD operation is conventionally focused on plasma modeling approaches, namely, fluid and kinetic plasma description. Particle-in-cell with Monte Carlo collisions (PIC-MCC), a new plasma modeling approach, has been verified to predict different types of discharge and to describe the breakdown stage of discharge or plasma decay stage [45]. These modeling results can provide important information about the qualitative description of the electron energy and the force generation by DBD plasma [46]. These results have illustrated the distribution of electron energy and active particles in the atmospheric air. However, electron energy and its distribution in DBD reactors with different electrode structures for NO abatement were not discussed.
This study aims to investigate the effect of electron energy and electrode structure on the abatement of NOx and preferable by-product selectivity in two different DBD reactors. Reaction products and chemical reaction mechanism of NO abatement were performed by Fourier transform infrared (FTIR) to provide further analysis information on NO destruction and new NOx production. Then, electron energy, electron energy distribution and partial discharge of two different plasma reactors were investigated in a NO-N2-O2 system using PIC-MCC simulation method. The electrical signals in DBD reactors were also analyzed to explore the discharge effect of electrode structures. Based on experimental and numerical research, the mechanism involved and preferable means of controlling the new NOx production in DBD reactor are also suggested. The results can provide useful information on DBD application for NO abatement.

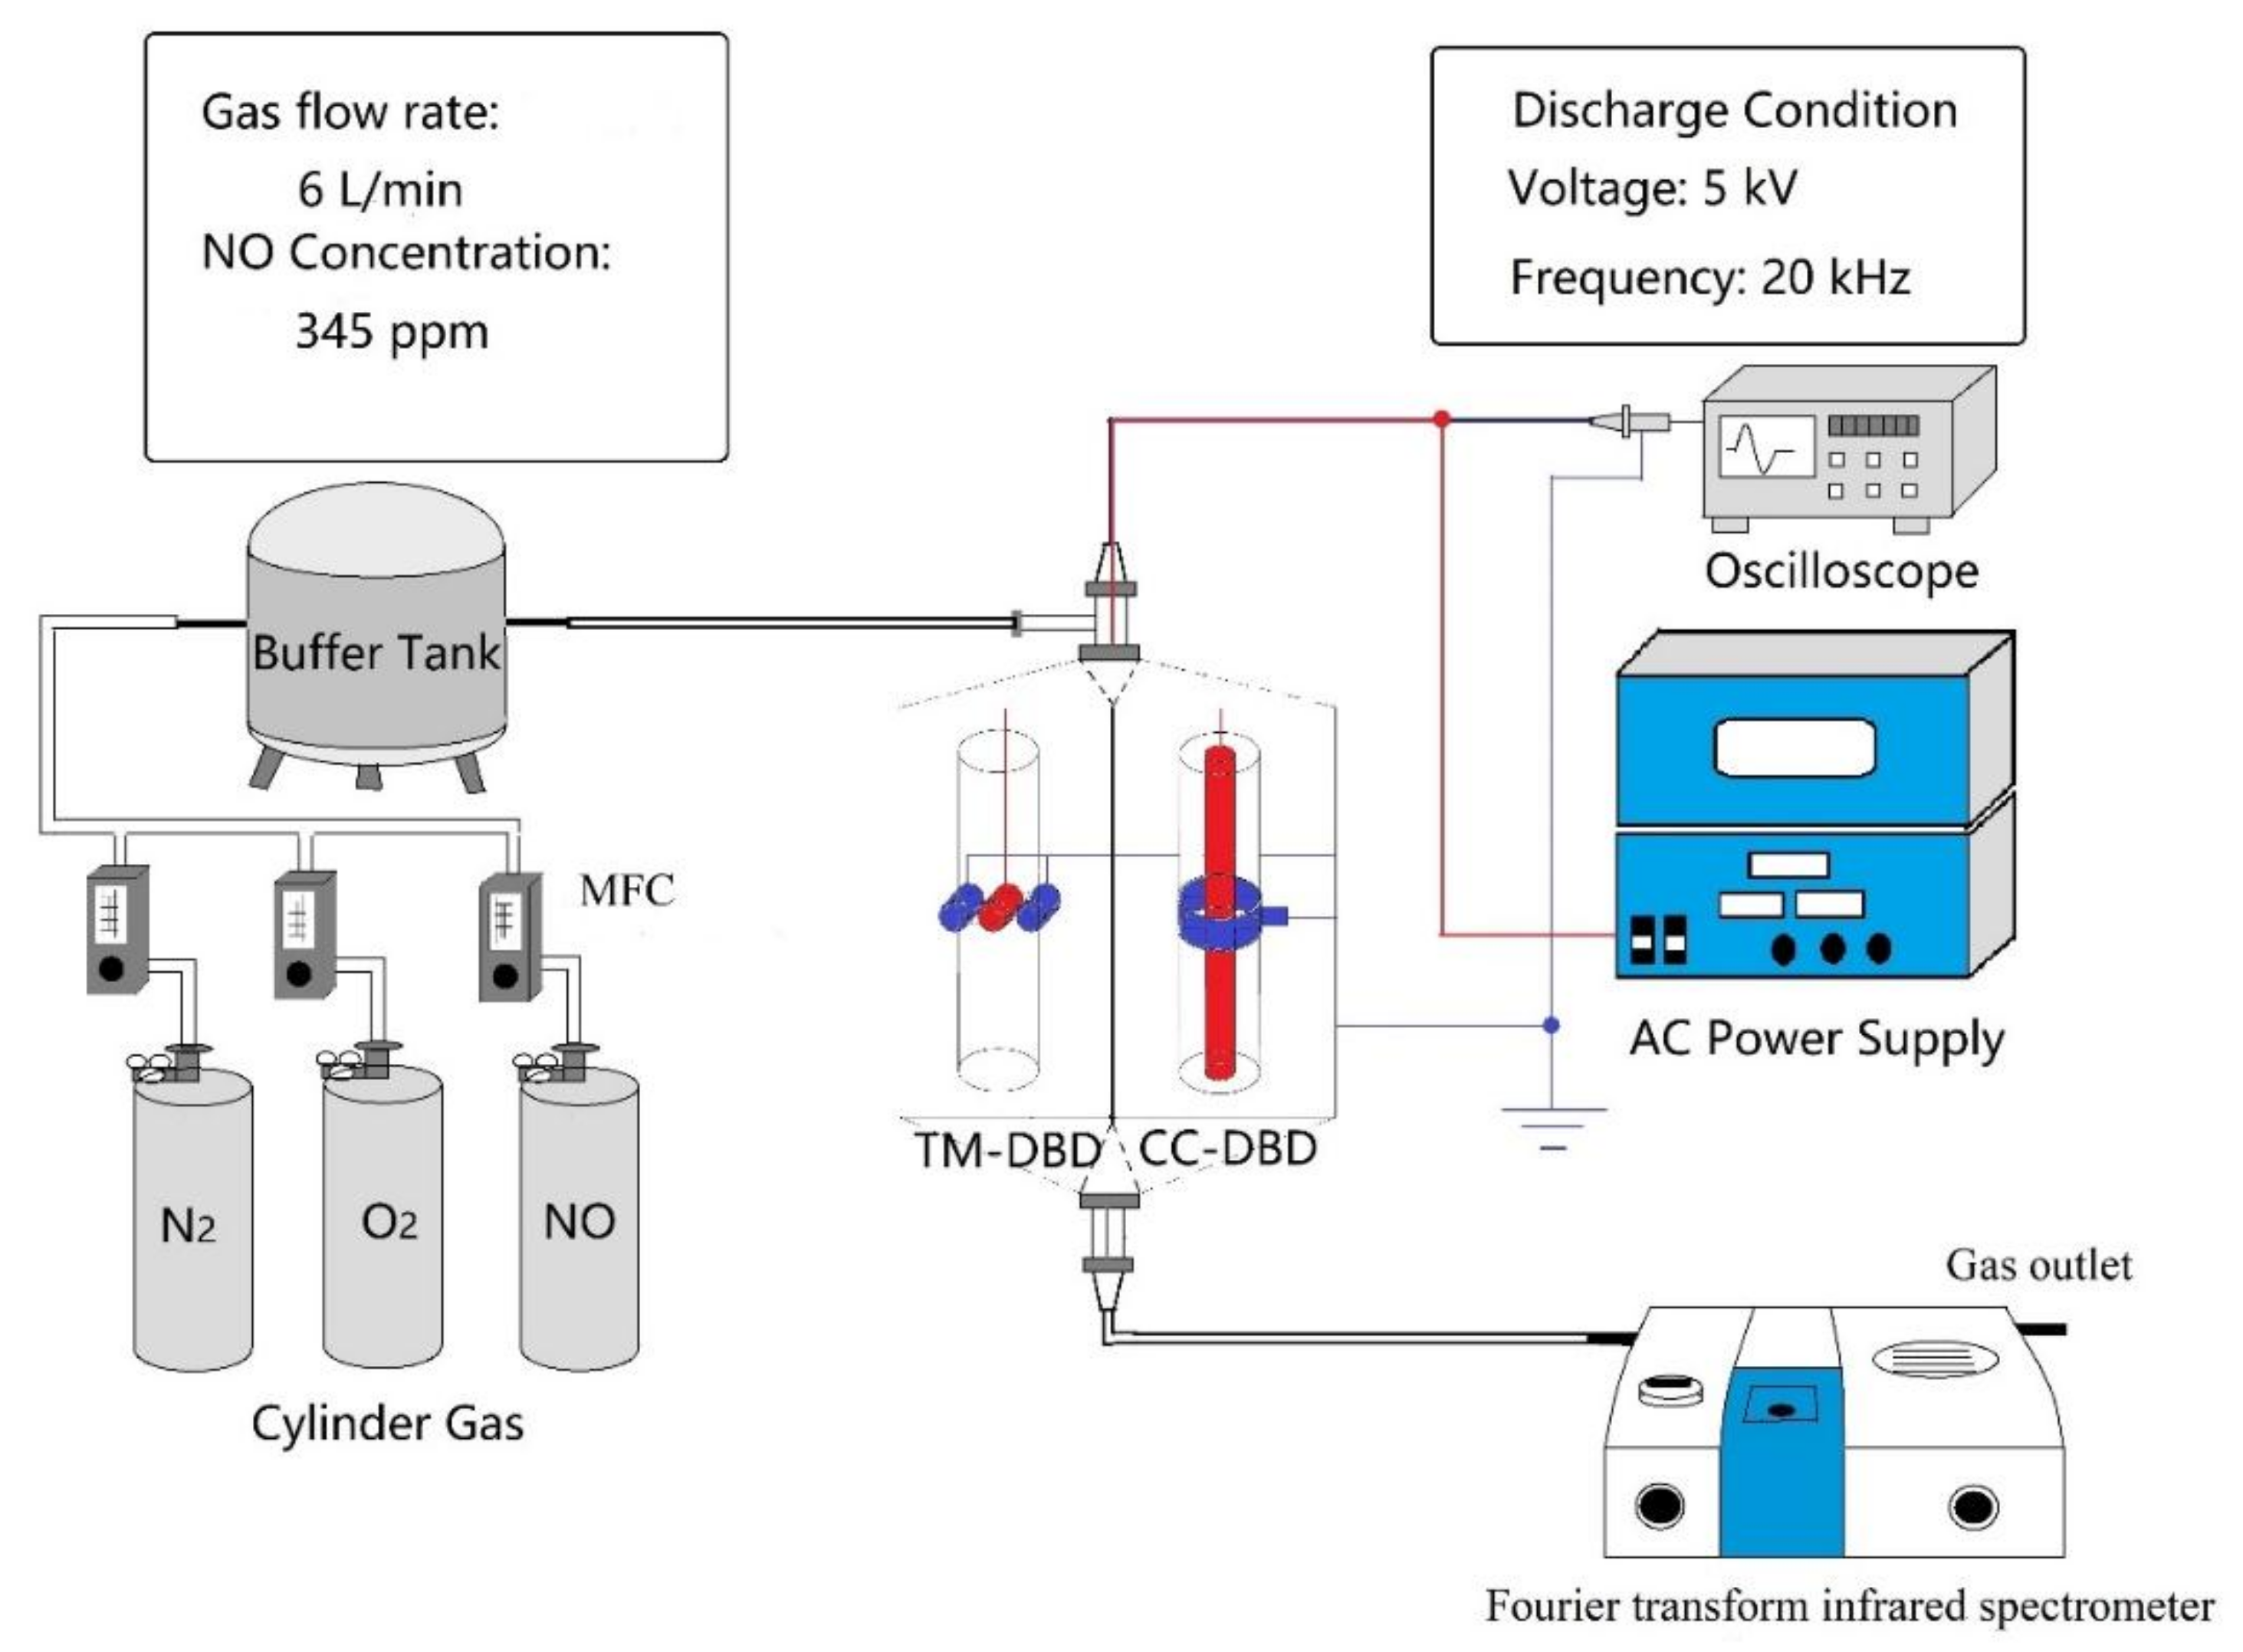
2. Experiment and Methods

2.1. Experiment

The schematic of the experimental system shown in Figure 1 was composed of a gas distribution system, a reaction system and an analysis system. Figure 2 shows the two electrode structures of plasma reactors that were designated as coaxial cylinder dielectric barrier discharge (CC-DBD) and tubular multilayer dielectric barrier discharge (TM-DBD). The CC-DBD reactor consisted of an inner high-voltage electrode (stainless steel sheet), two quartz tubes (outer tube with 20 mm diameter and 200 mm length, inner tube with 12 mm diameter and 200 mm length), and an outer electrode (aluminum foil). The quartz tubes were coaxial cylinder in shape with 4 mm gap.
The TM-DBD reactor consisted of three quartz tubes arranged in a row with 6.0 mm diameter inner electrode and 31 mm length. The stainless-steel electrodes were inserted into the quartz tubes. NO was prepared in cylinder containing very few N2O (1.98 × 10⁻³ ppm). The NO concentration was 345 ppm and gas flow rate was fixed at 6 L/min. Mass flow controller (MFC) (SEC-4400, Horbia, Kyoto, Japan) was used to adjust the flow of NO, O2, N2, and reactant gases.
The final products of NO degradation were measured by FTIR spectroscopy (Nicolet Nexus 470, Thermo Fisher, Waltham, MA, USA) and the resolution of the FTIR is 1 cm−1. The plasma reactor was driven by AC power supply (homemade power). The voltage was maintained at 5 kV (driven frequency of 20 kHz) and input power was 128 W measured by power meter (PF9800, Everfine, Hangzhou, China).
Destruction and removal efficiency (DRE) of NO and NOx was calculated from the equations
DRE   of   N O ( % ) = [ N O ] i n [ N O ] o u t [ N O ] i n × 100 %
DRE   of   N O X ( % ) = [ N O x ] i n [ N O x ] o u t [ N O x ] i n × 100 %

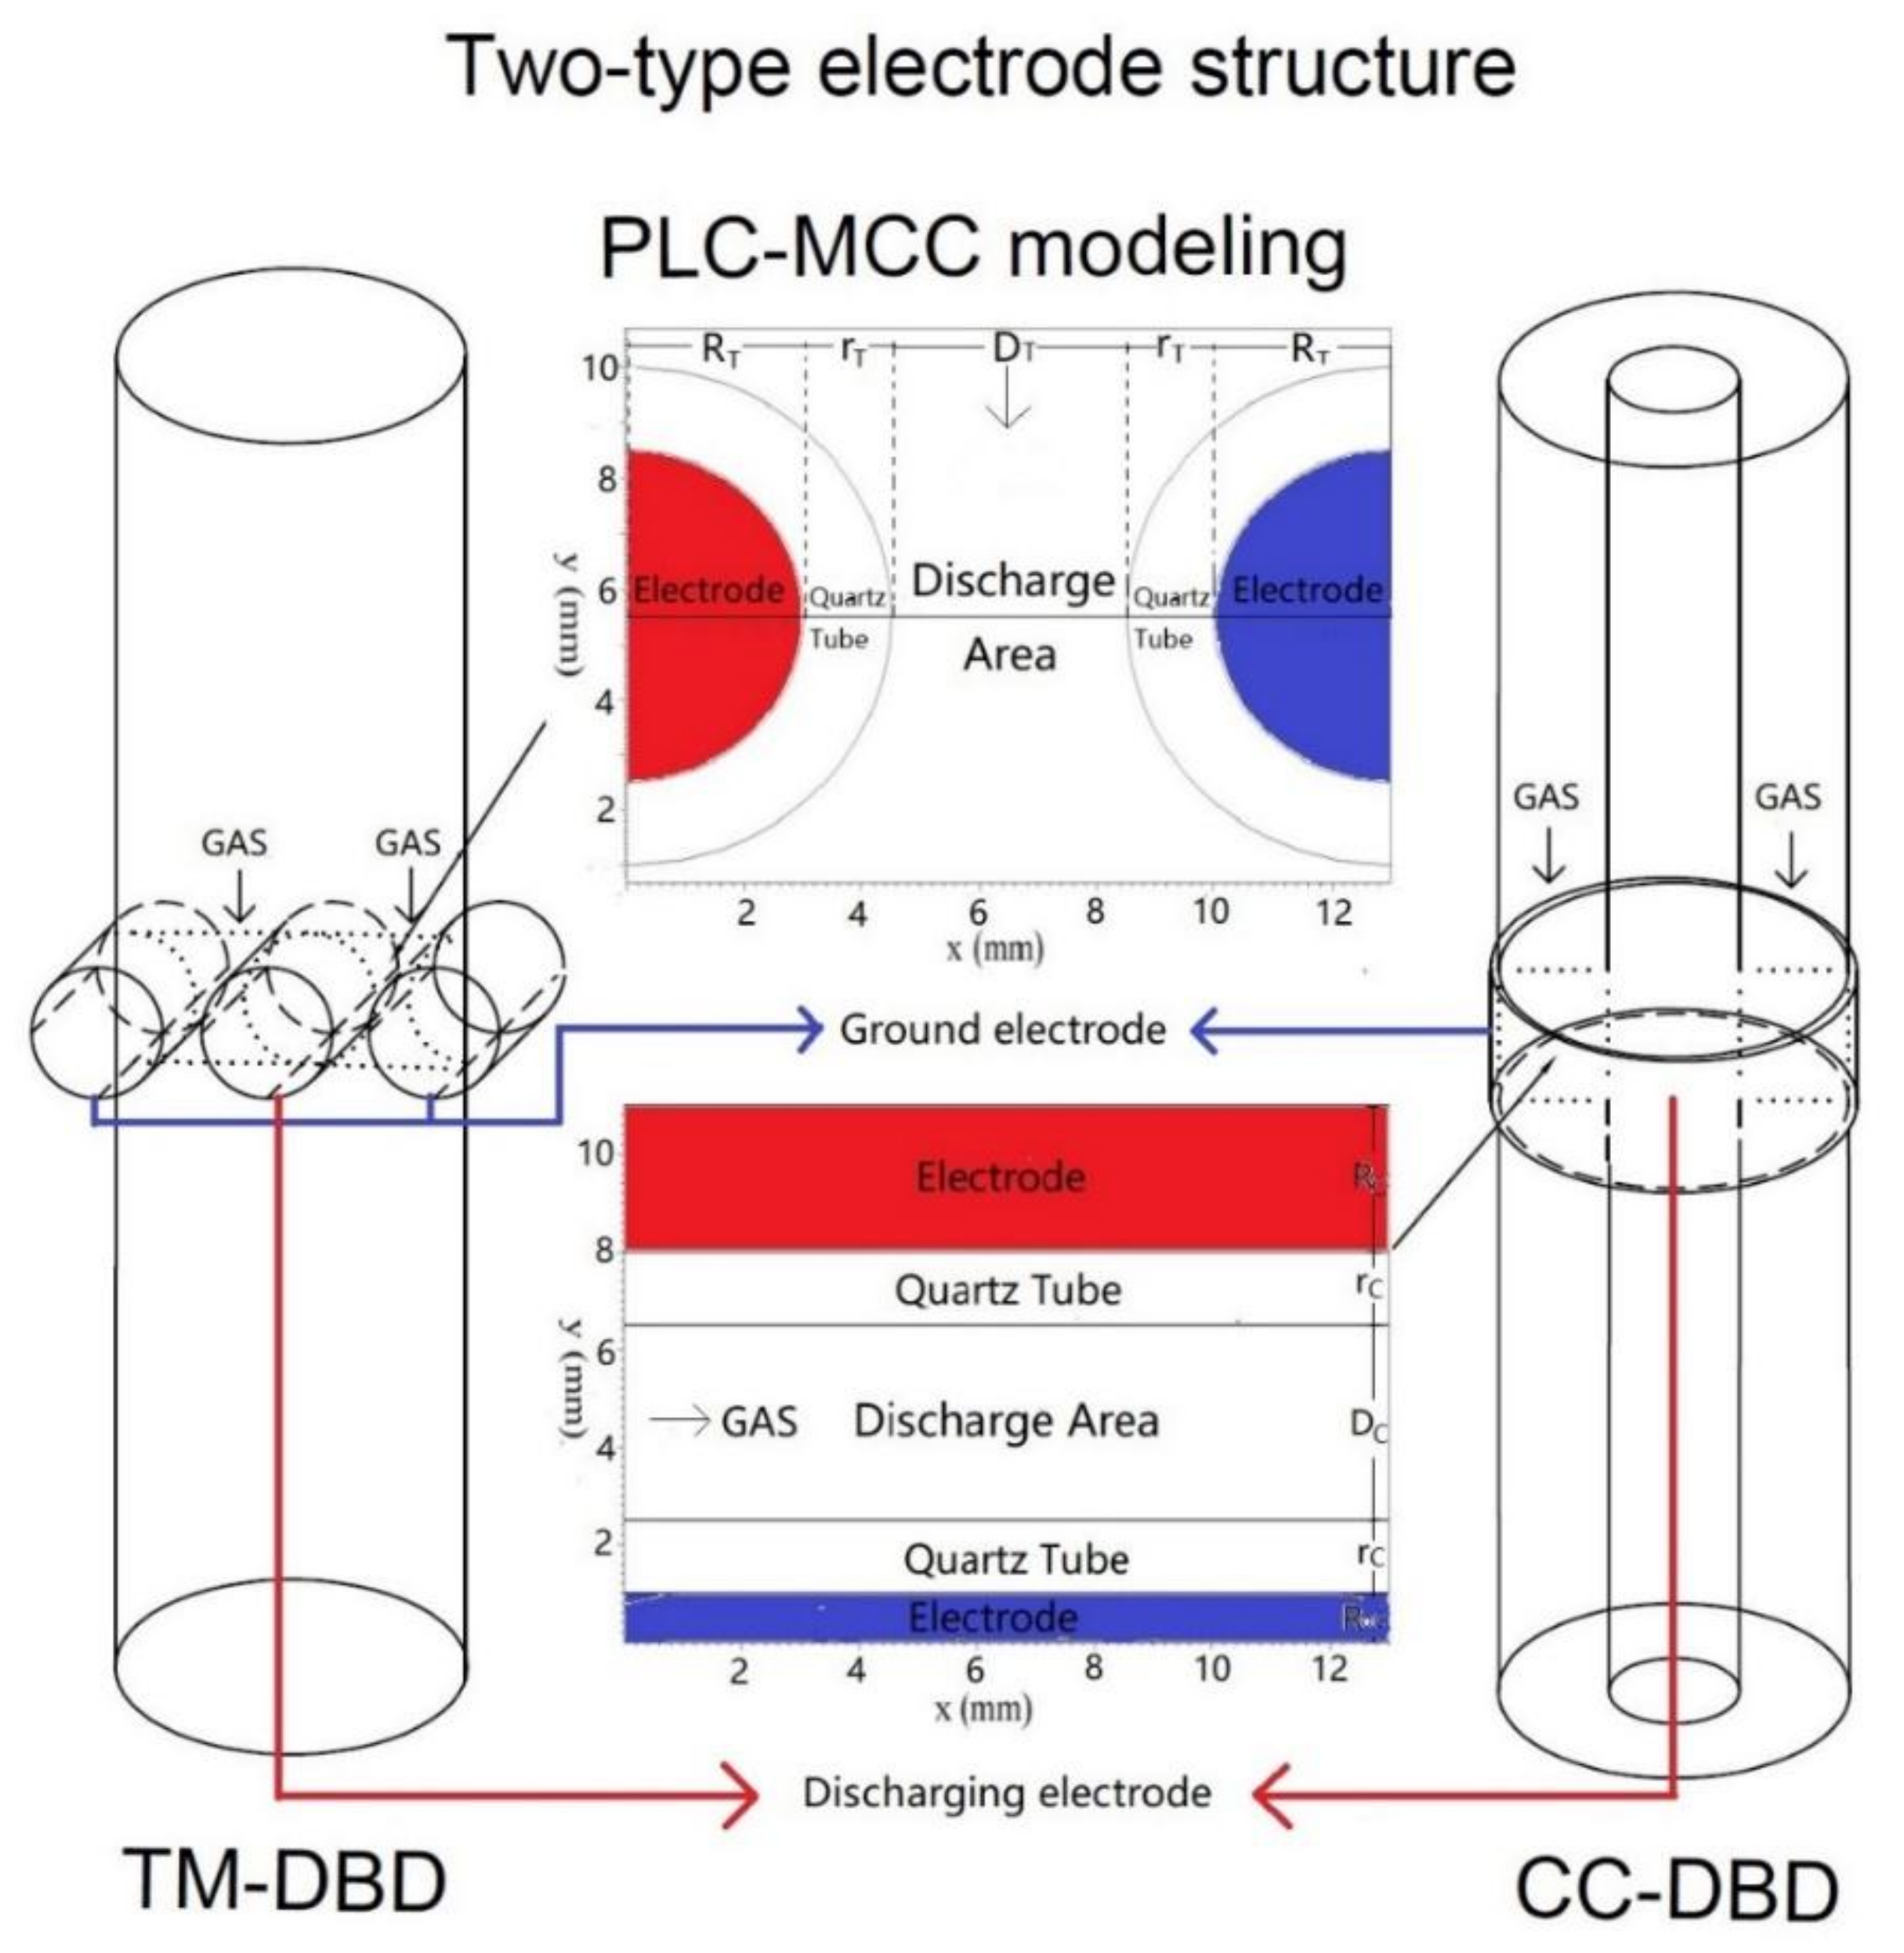
2.2. Numerical Simulation

The simulation is performed by PIC-MCC method using the software VSim8.0 (Boulder, CO, America, 2016) by Tech-X Corporation. The two types of DBD reactors with different electrode structures are shown in Figure 2. The geometric structure and discharge modeling as well as geometry parameters used in the simulation are also shown in Figure 2.
VSim is an efficient parallel PIC model, but few DBD simulations using VSim have been reported. Therefore, the key setting of parameters is presented. In the simulation, the electromagnetic field was calculated by 2D modeling based on Maxwell’s equations, and particle collision was handled by Monte Carlo collisions. Only the collisions and movement process of electron have been taken into account in model to simplify simulation. This simulation is 2D CFDTD (conformal finite-difference time-domain) PIC code, which can run parallel with CPU cores. Those parameters used in PIC-MCC model are shown in Table 1. We mainly used the electron movement data to examine the electron energy and the effect on NO abatement by the numerical simulation in the TM-DBD and CC-DBD reactors. Other data were VISM built-in data. The entire model was based on 2D Cartesian coordinates.

3. Results

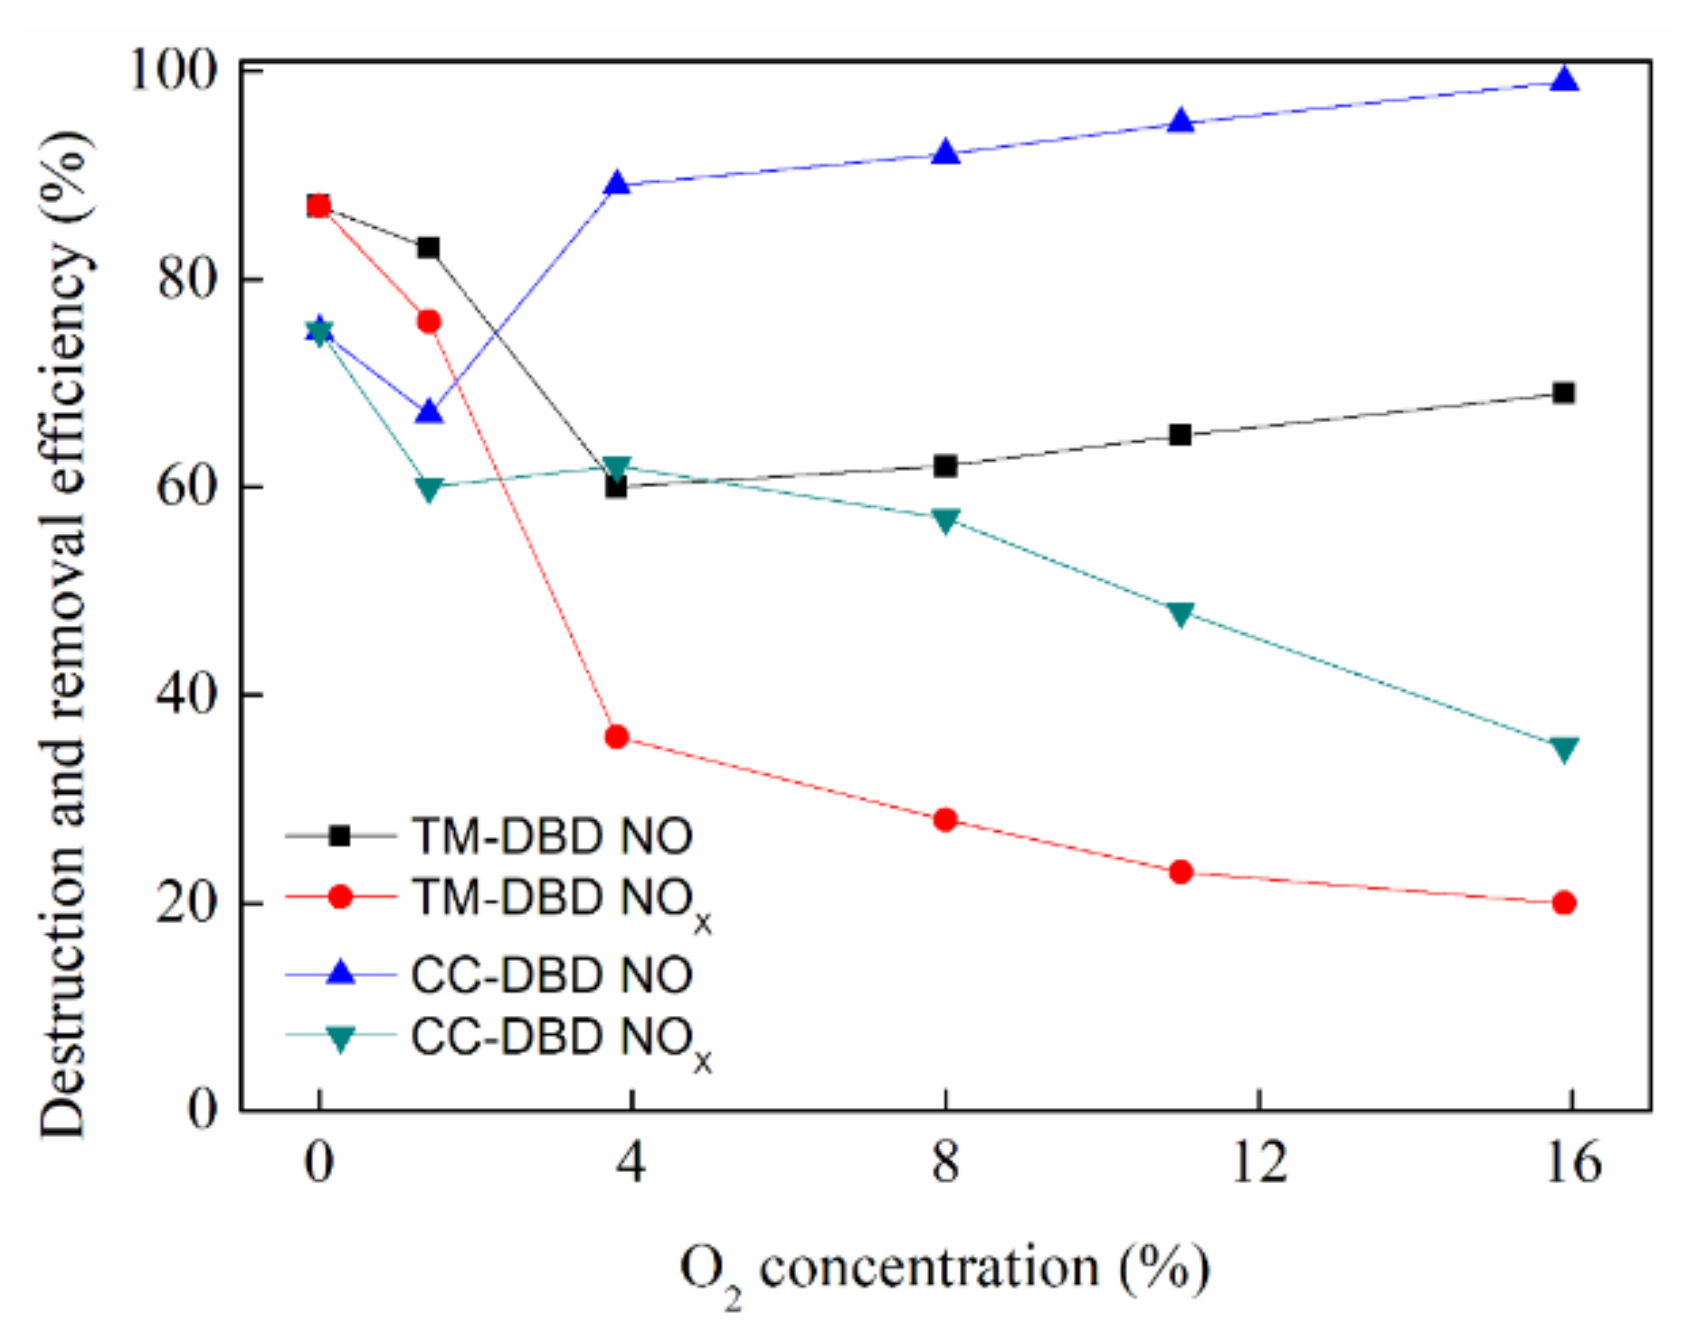
3.1. Effect of O2 Concentration on DRE of NO and NOx

Figure 3 showed the DRE of NO and NOx under different O2 concentration in the TM-DBD and CC-DBD reactors. O2 not only competitively shares the input power, but contributes to the oxidation of NO. Therefore, the DRE of NOx decreases from 75% to 35% in CC-DBD reactor and from 87% to 20% in the TM-DBD reactor with an increase of O2 from 0 to 15.9%. However, DRE of NO first decreases and then sharply increases to 99% in CC-DBD reactor, while the DRE of NO first decreases and then keeps little change at about 69% in the TM-DBD reactor. In addition, the results also indicated that the DRE of NO and NOx in the TM-DBD reactor was better than in the CC-DBD reactor when O2 concentration was low, and the opposite result was seen under higher O2 concentration. Thus, it can be seen that the electrode structure has important impact on the DRE of NO and NOx.

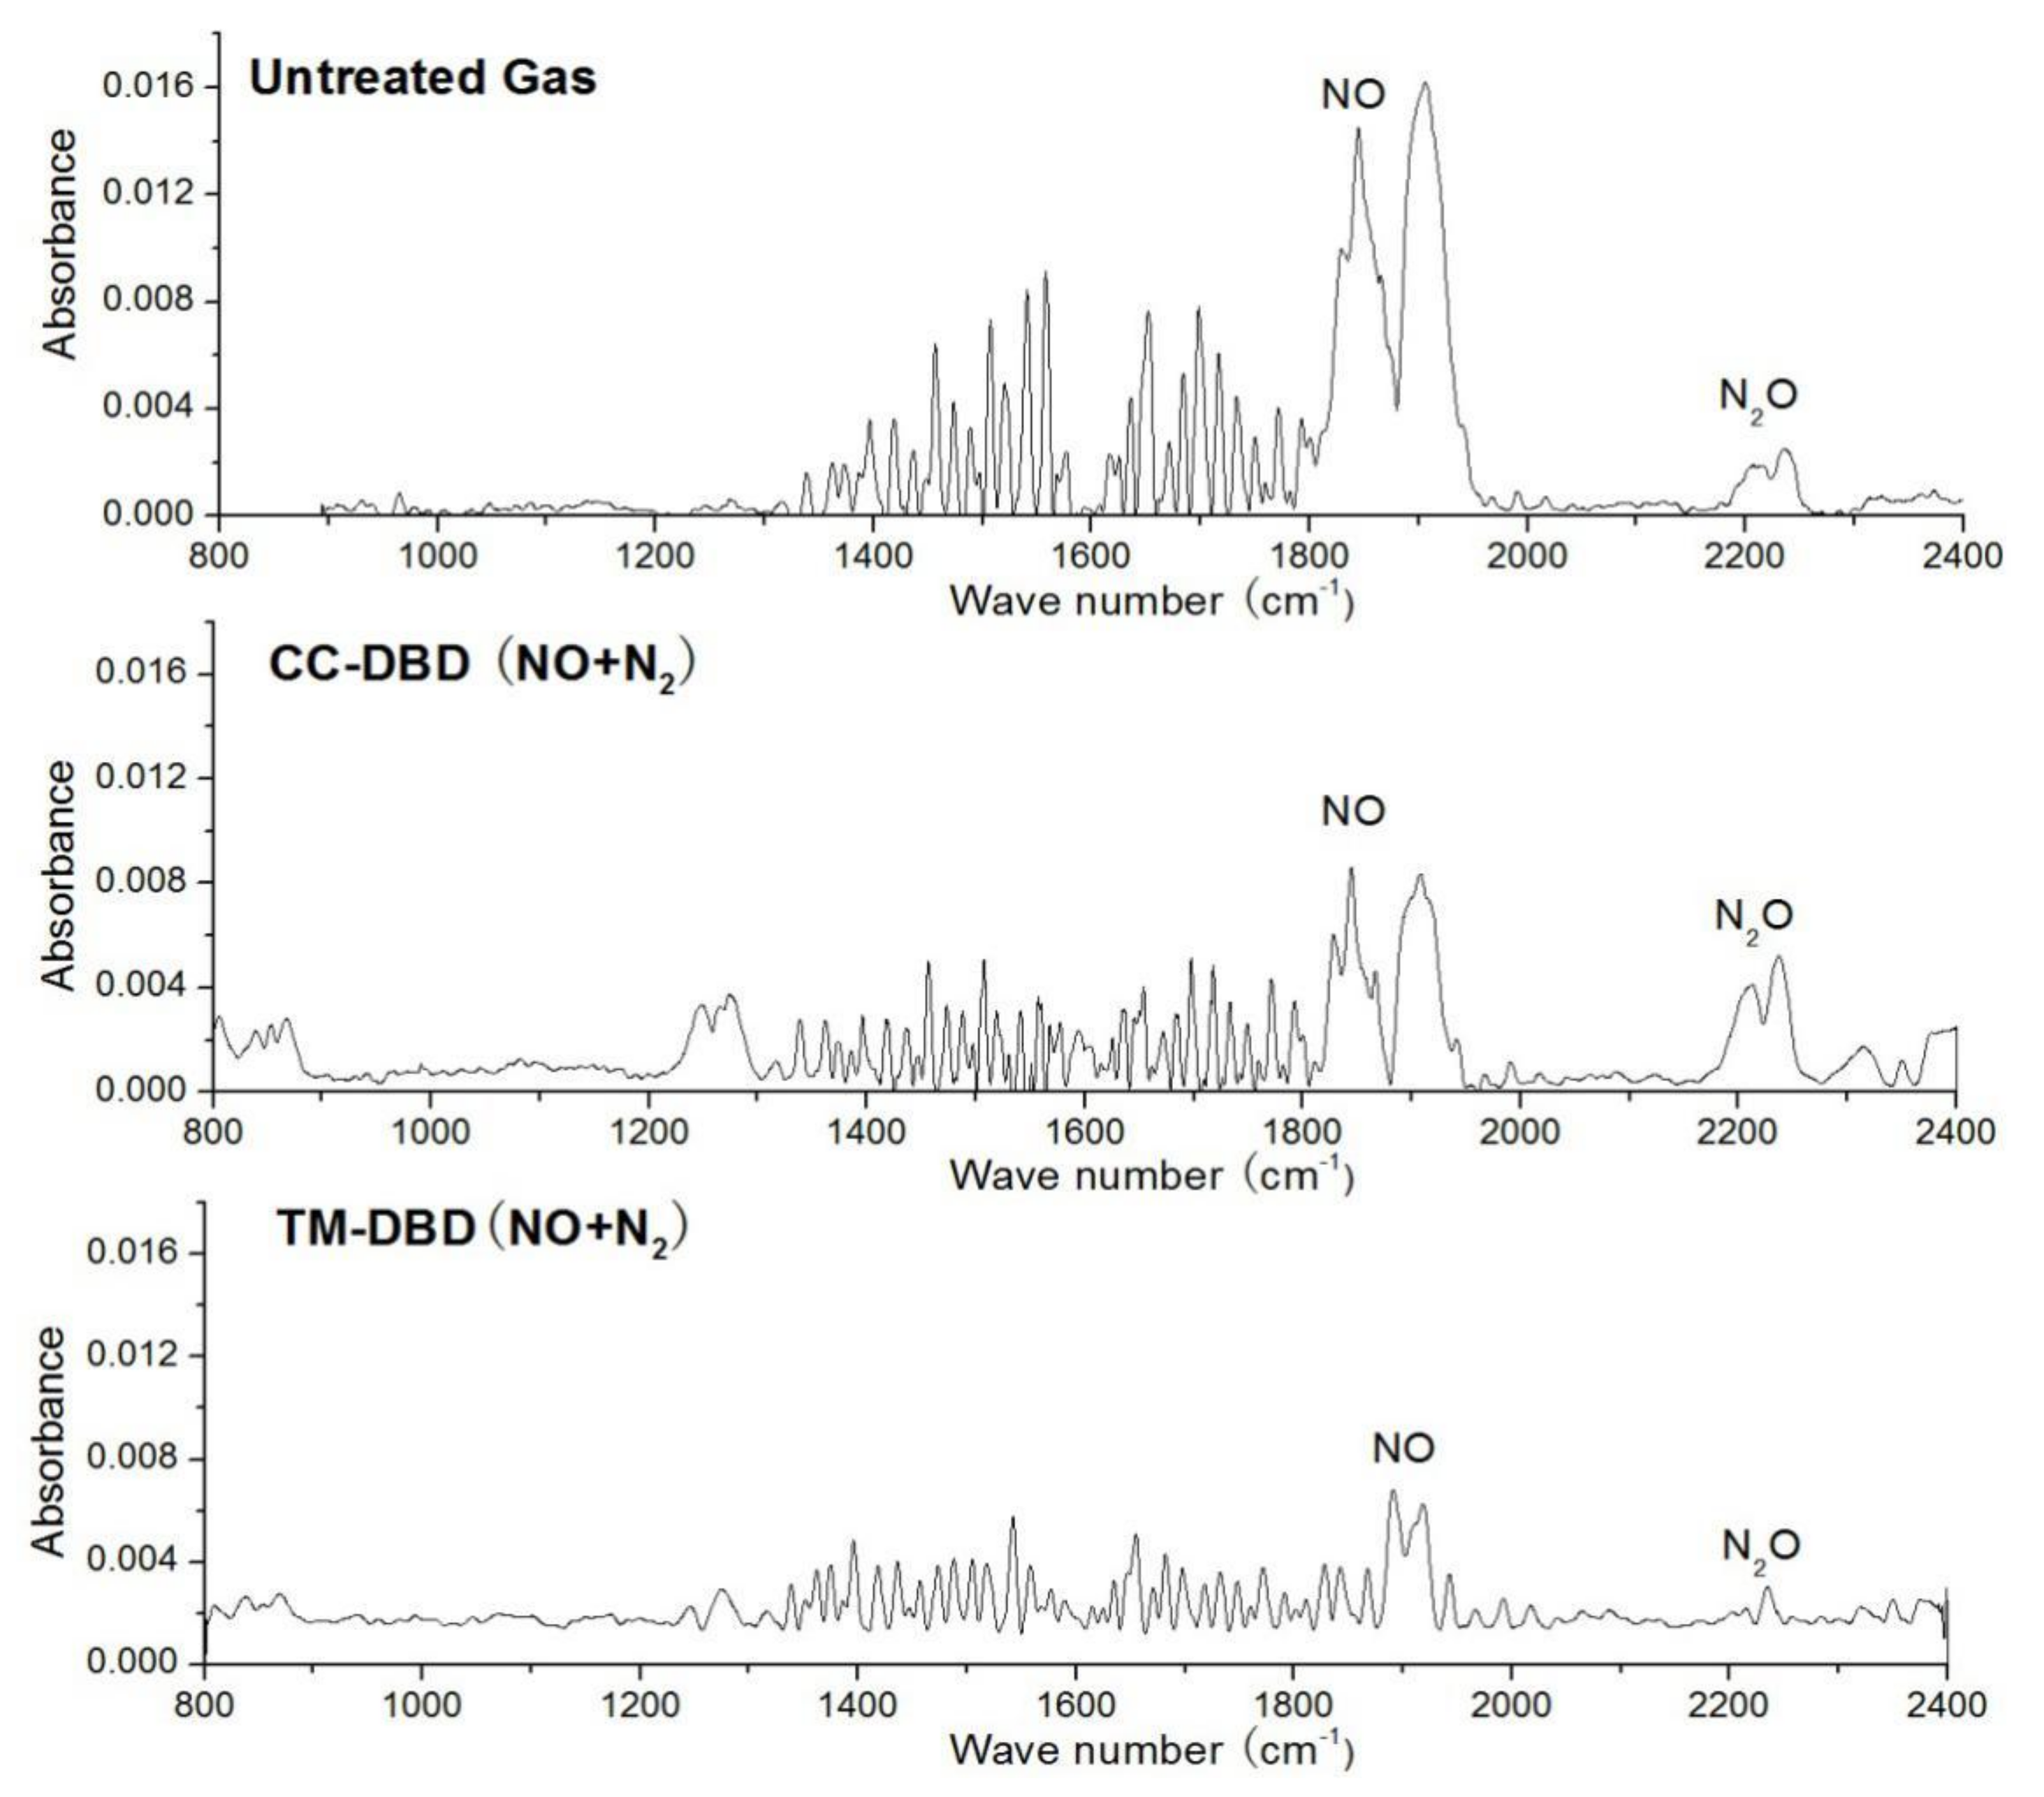
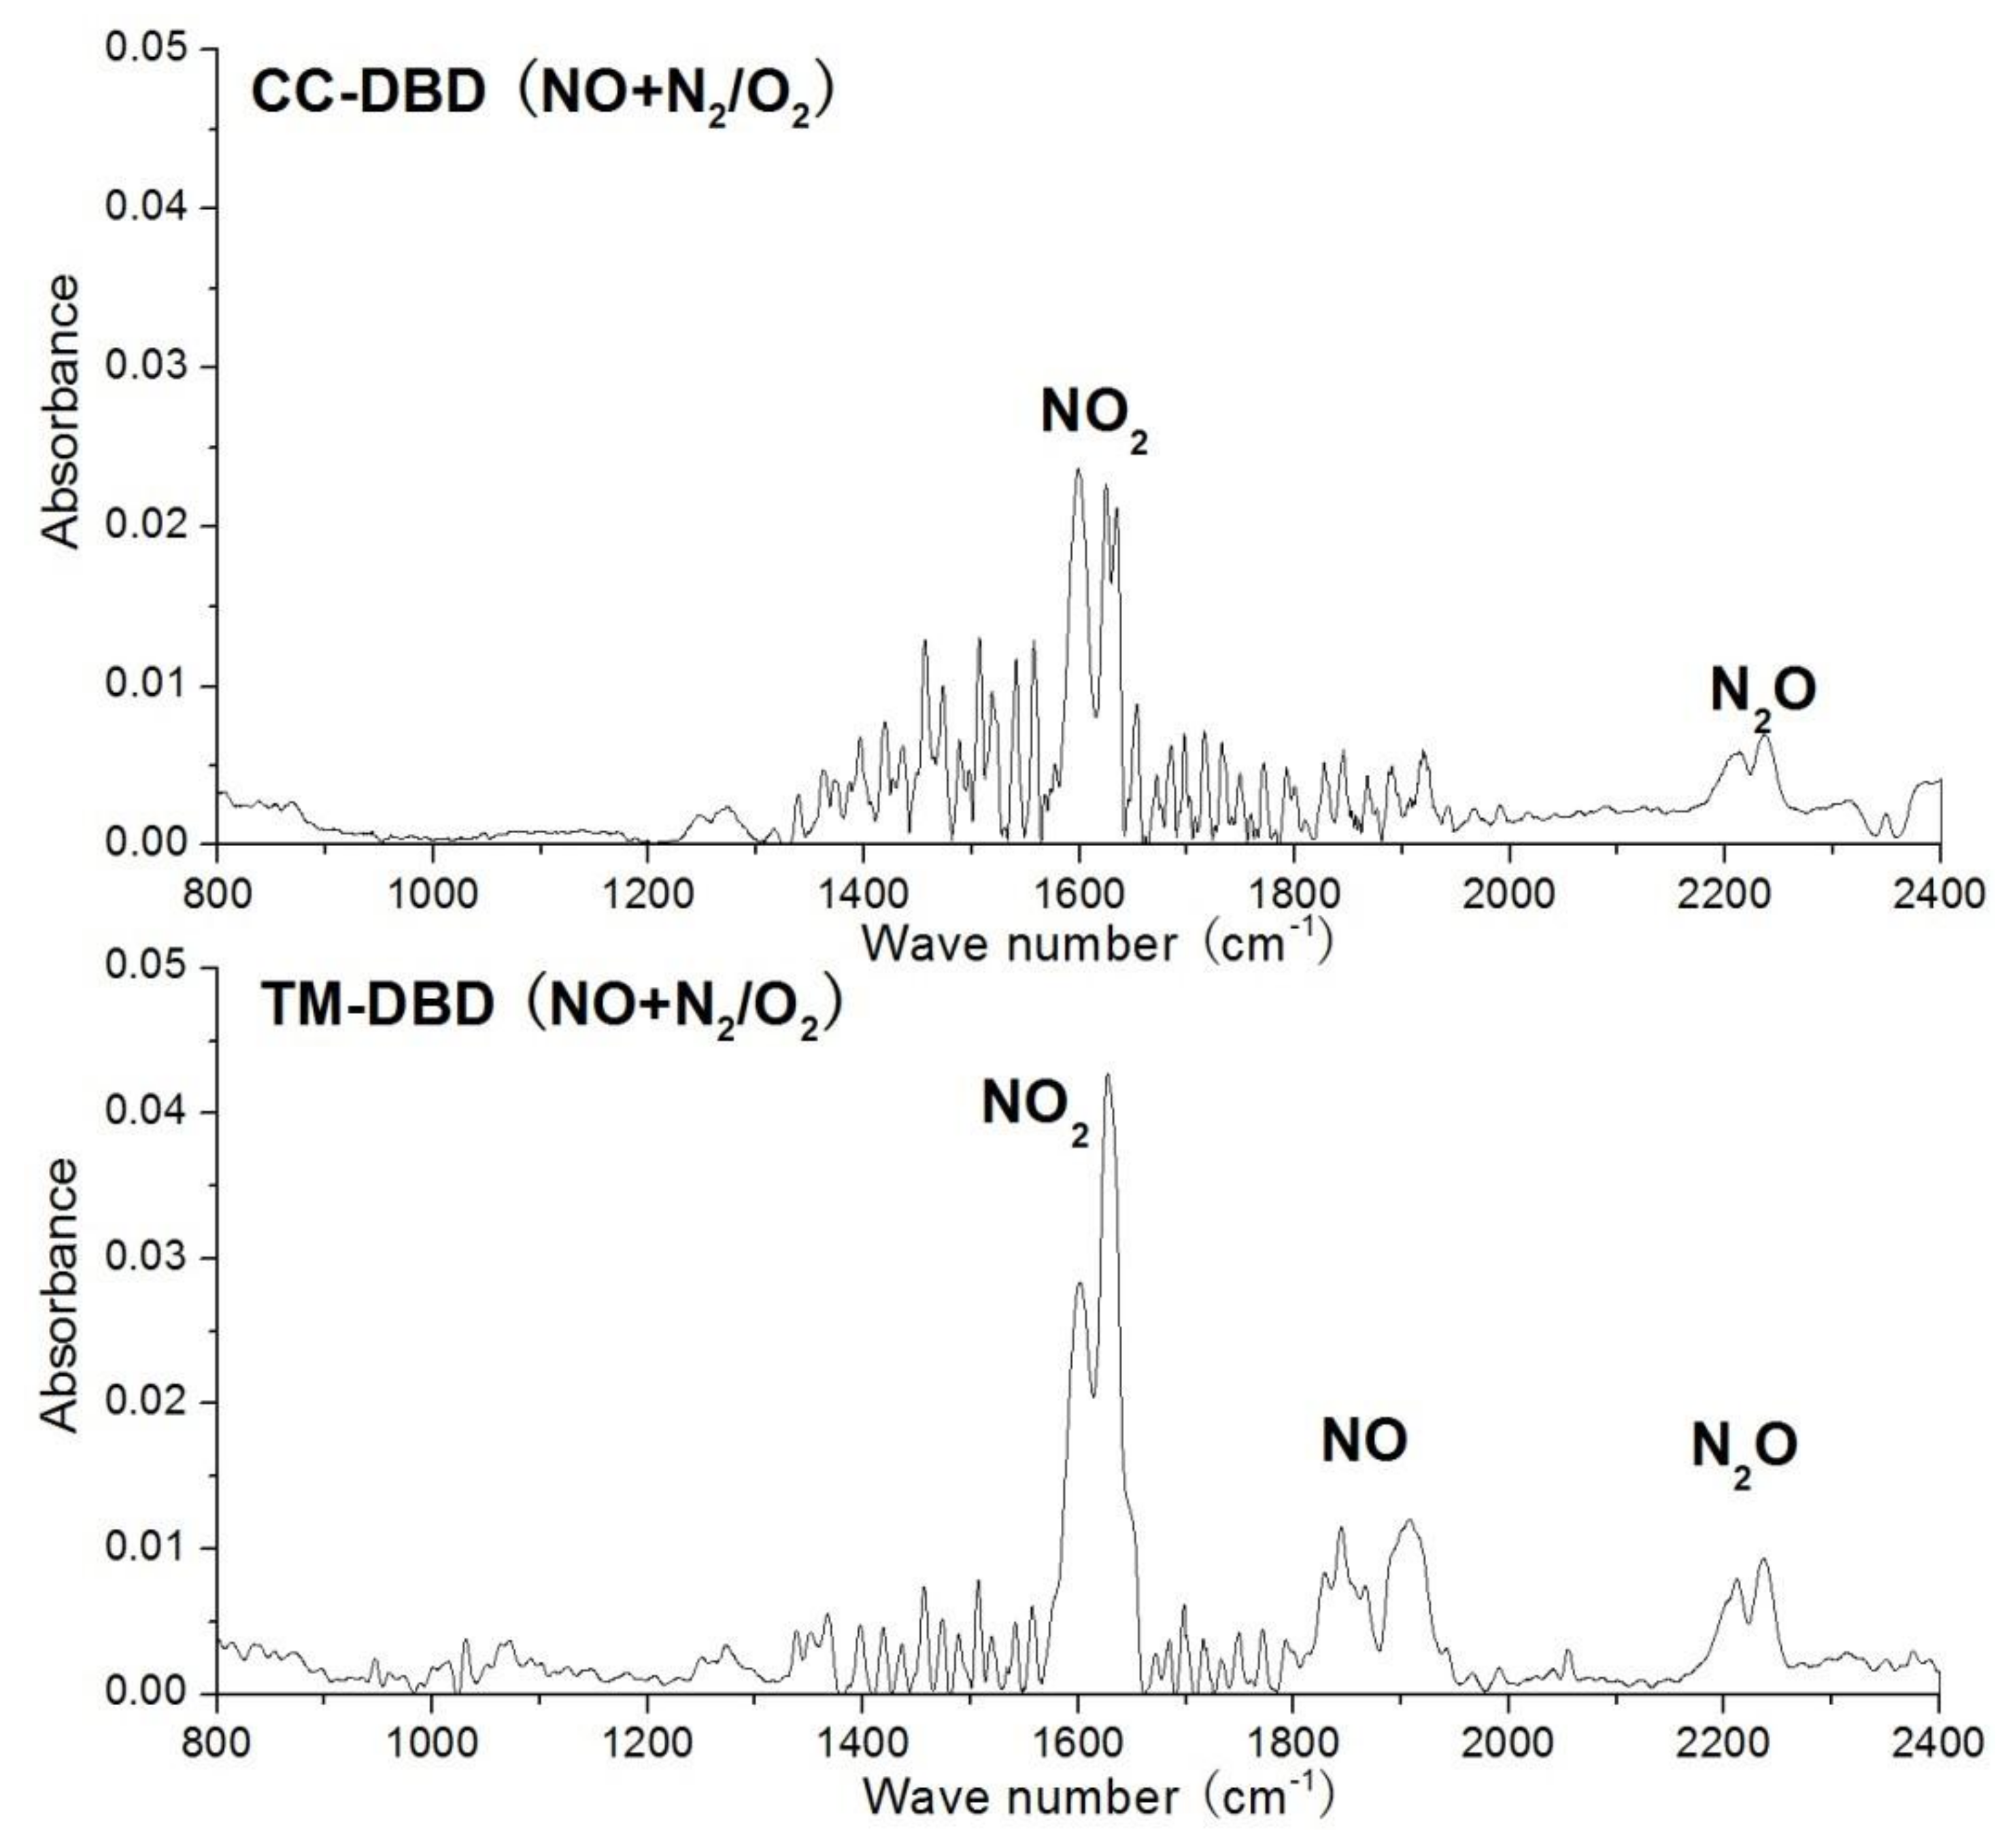
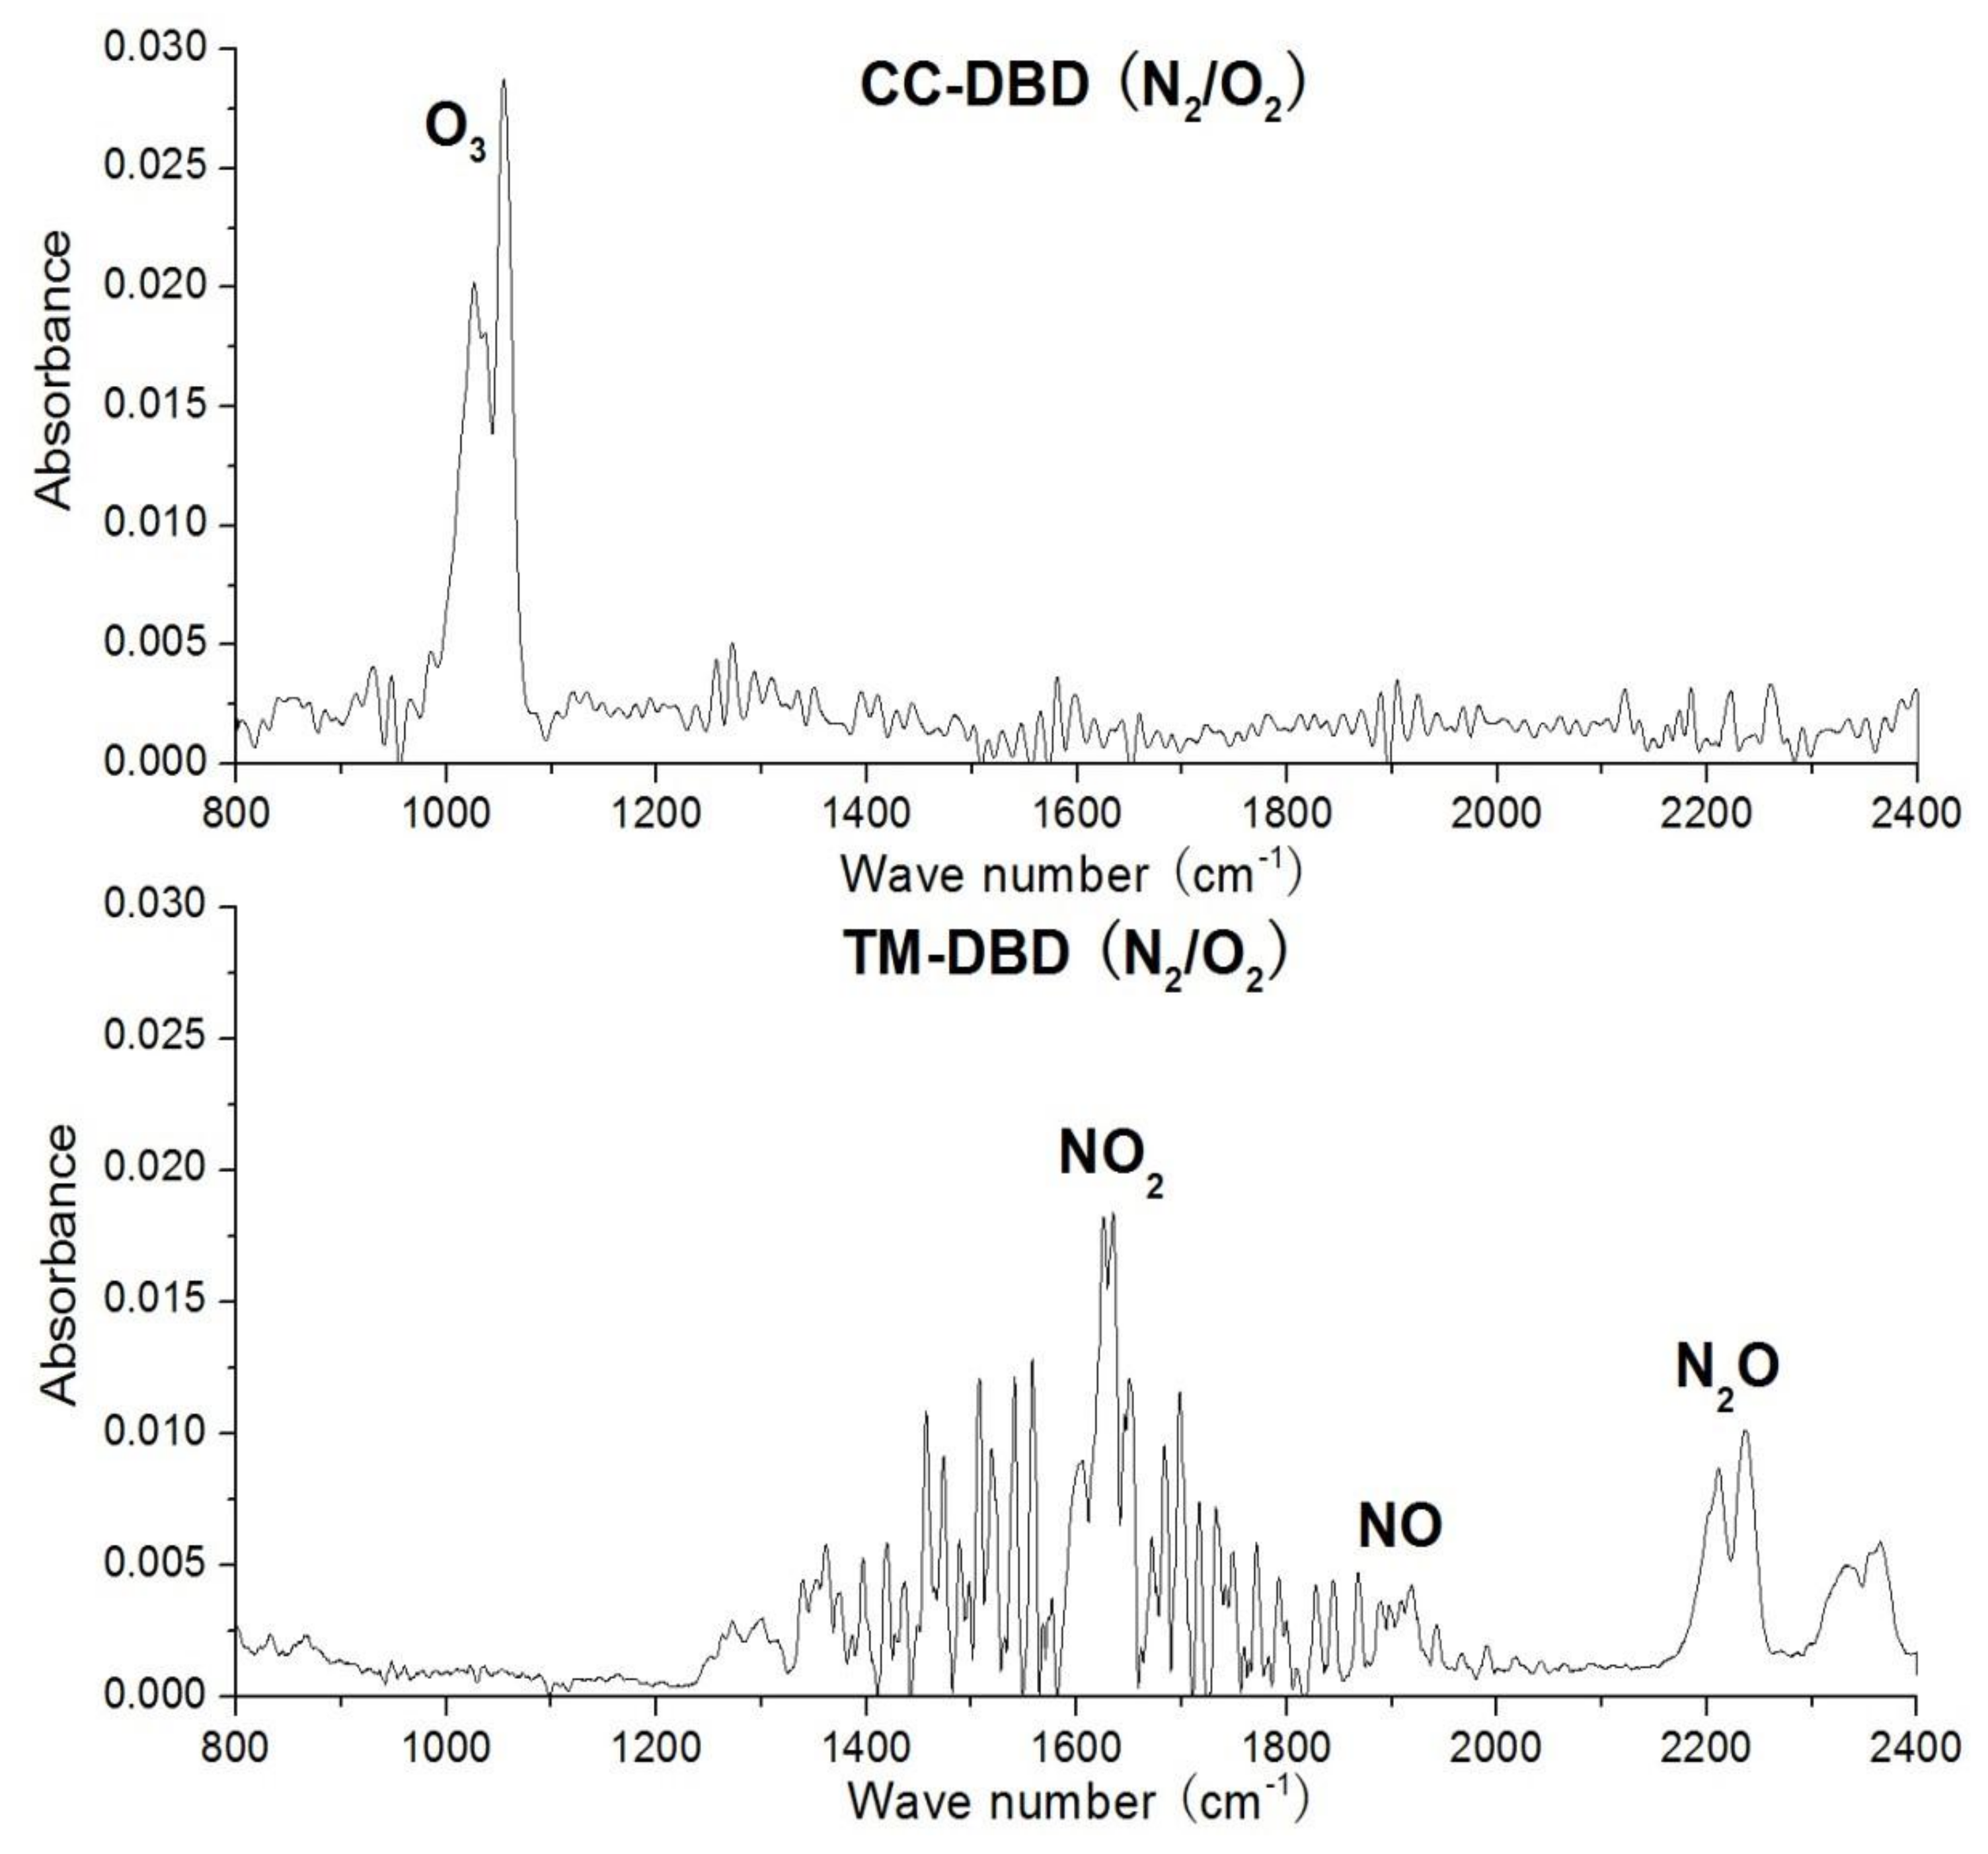
3.2. Final Product Analysis by FTIR

In order to get further information about NO abatement, the final products in the two reactors were identified by FTIR.
Figure 4 showed the FTIR spectra of the final products for NO abatement in TM-DBD and CC-DBD reactors when N2 was taken as the buffer gas. The results showed a decrease behavior for NO abatement in two reactors except for the peak intensity.
Compared with the untreated gas, the intensity of NO absorption decreased after discharge in all reactors. The peak of N2O increased in CC-DBD, but it decreased in TM-DBD. Based on the facts, the final products of NO abatement included N2O in CC-DBD. In addition, the peak intensity of NO and N2O in TM-DBD correspondingly became weaker than them in CC-DBD. The results indicated that the electrode structure of TM-DBD was better for abatement of NO and NOx under low O2 concentration.
Figure 5 showed the FTIR spectra for NO abatement with 345 ppm NO under the buffer gas of 8% O2 and 92% N2 in the TM-DBD and CC-DBD reactors. Compared with the untreated gas shown in Figure 4, the peak intensity of NO2 and N2O with the peaks at 2200 cm‒1 and 1600 cm‒1 all increased obviously in the two reactors. The results indicated that the final products in the TM-DBD and CC-DBD reactor included few N2O (about 9.9 × 10⁻³ ppm) and NO2, respectively. According to Figure 5, there was still quite a peak intensity of NO in TM-DBD reactor while NO was almost not identified in the CC-DBD reactor; moreover, the intensity of NO2 and N2O absorption in TM-DBD was higher than that in CC-DBD. The difference between TM-DBD and CC-DBD was ascribed to the conclusion that the DRE of NO as well as NOx was better in CC-DBD reactor under high O2 concentration.
To explore the difference of above experiment results, the mixture of 92% N2 and 8% O2 without NO was induced into the TM-DBD and CC-DBD reactors. Figure 6 showed the FTIR spectra of the final products produced in the TM-DBD and CC-DBD reactors, respectively. It can be seen that NO, NO2 and N2O were identified with the peaks at around 1900, 1600 and 2200 cm‒1 in TM-DBD reactor, while the final product was only O3 with the peak at around 1000 cm‒1 in the CC-DBD reactor. The different results indicated that N2 was dissociated by electron impact dissociation reactions in TM-DBD reactor, namely, e+N2→e+2N and N would recombine with O and O2 to produce new NOx in the TM-DBD reactor, which also verified the results of the final products shown in Figure 5. O2 dissociation could occur in TM-DBD but O3 was not detectable, because it is selectively consumed by NO. However, in the CC-DBD reactor, only the identification of O3 production was determined and no evidence of N2 dissociation reactions could be seen.
Above all, NO abatement was performed mainly through the reduction channel in the TM-DBD and CC-DBD reactors under low O2 concentration, and moreover, the electrode structure of TM-DBD was preferable. However, When O2 concentration increased, O· produced by the dissociation of O2 in reaction system rapidly enhanced and the channel of oxidation reaction was predominant. The new NOx, generated from the reaction of N+O→NO, N+O2→NO+O, and NO+O→NO2 [21] cannot be ignored in the TM-DBD. The electrode structure of the CC-DBD reactor was advantageous under high oxygen conditions. The results also revealed that the electrode structure was the key role in the new NOx produced in the DBD reactors.

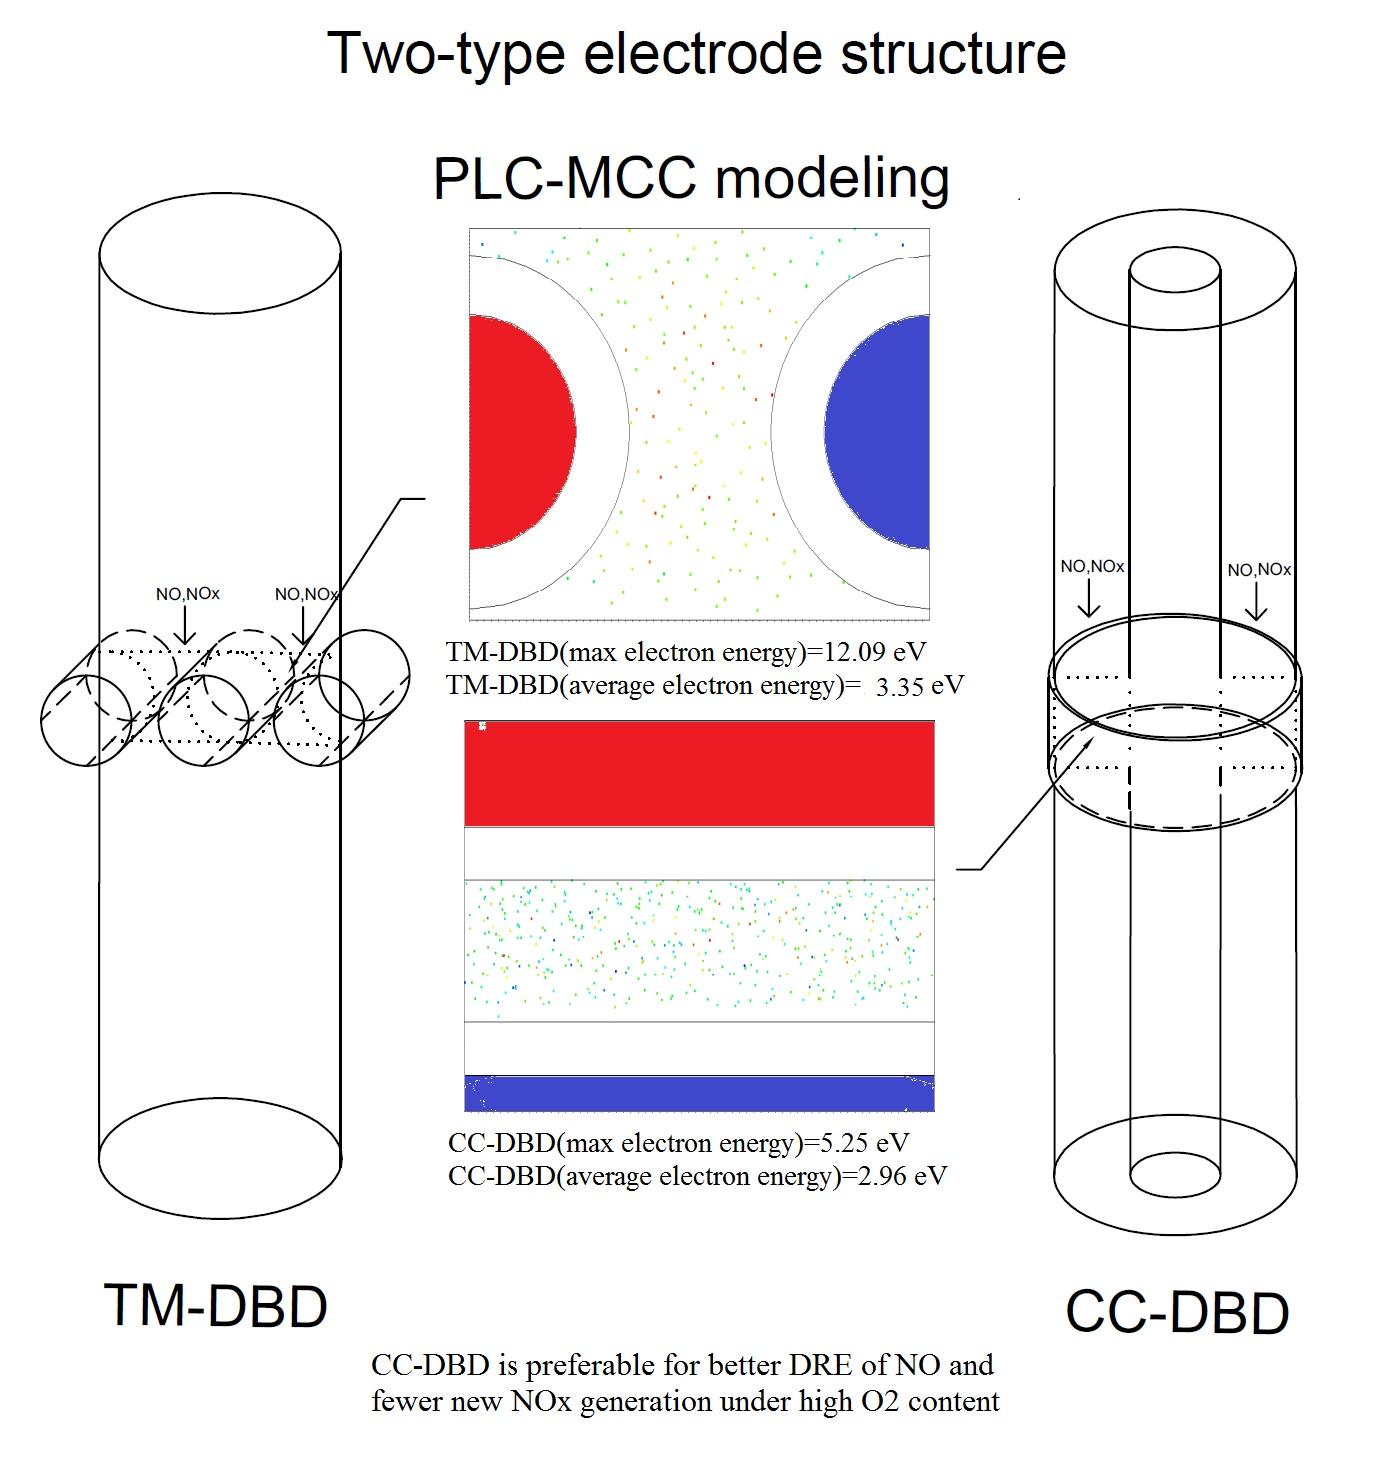
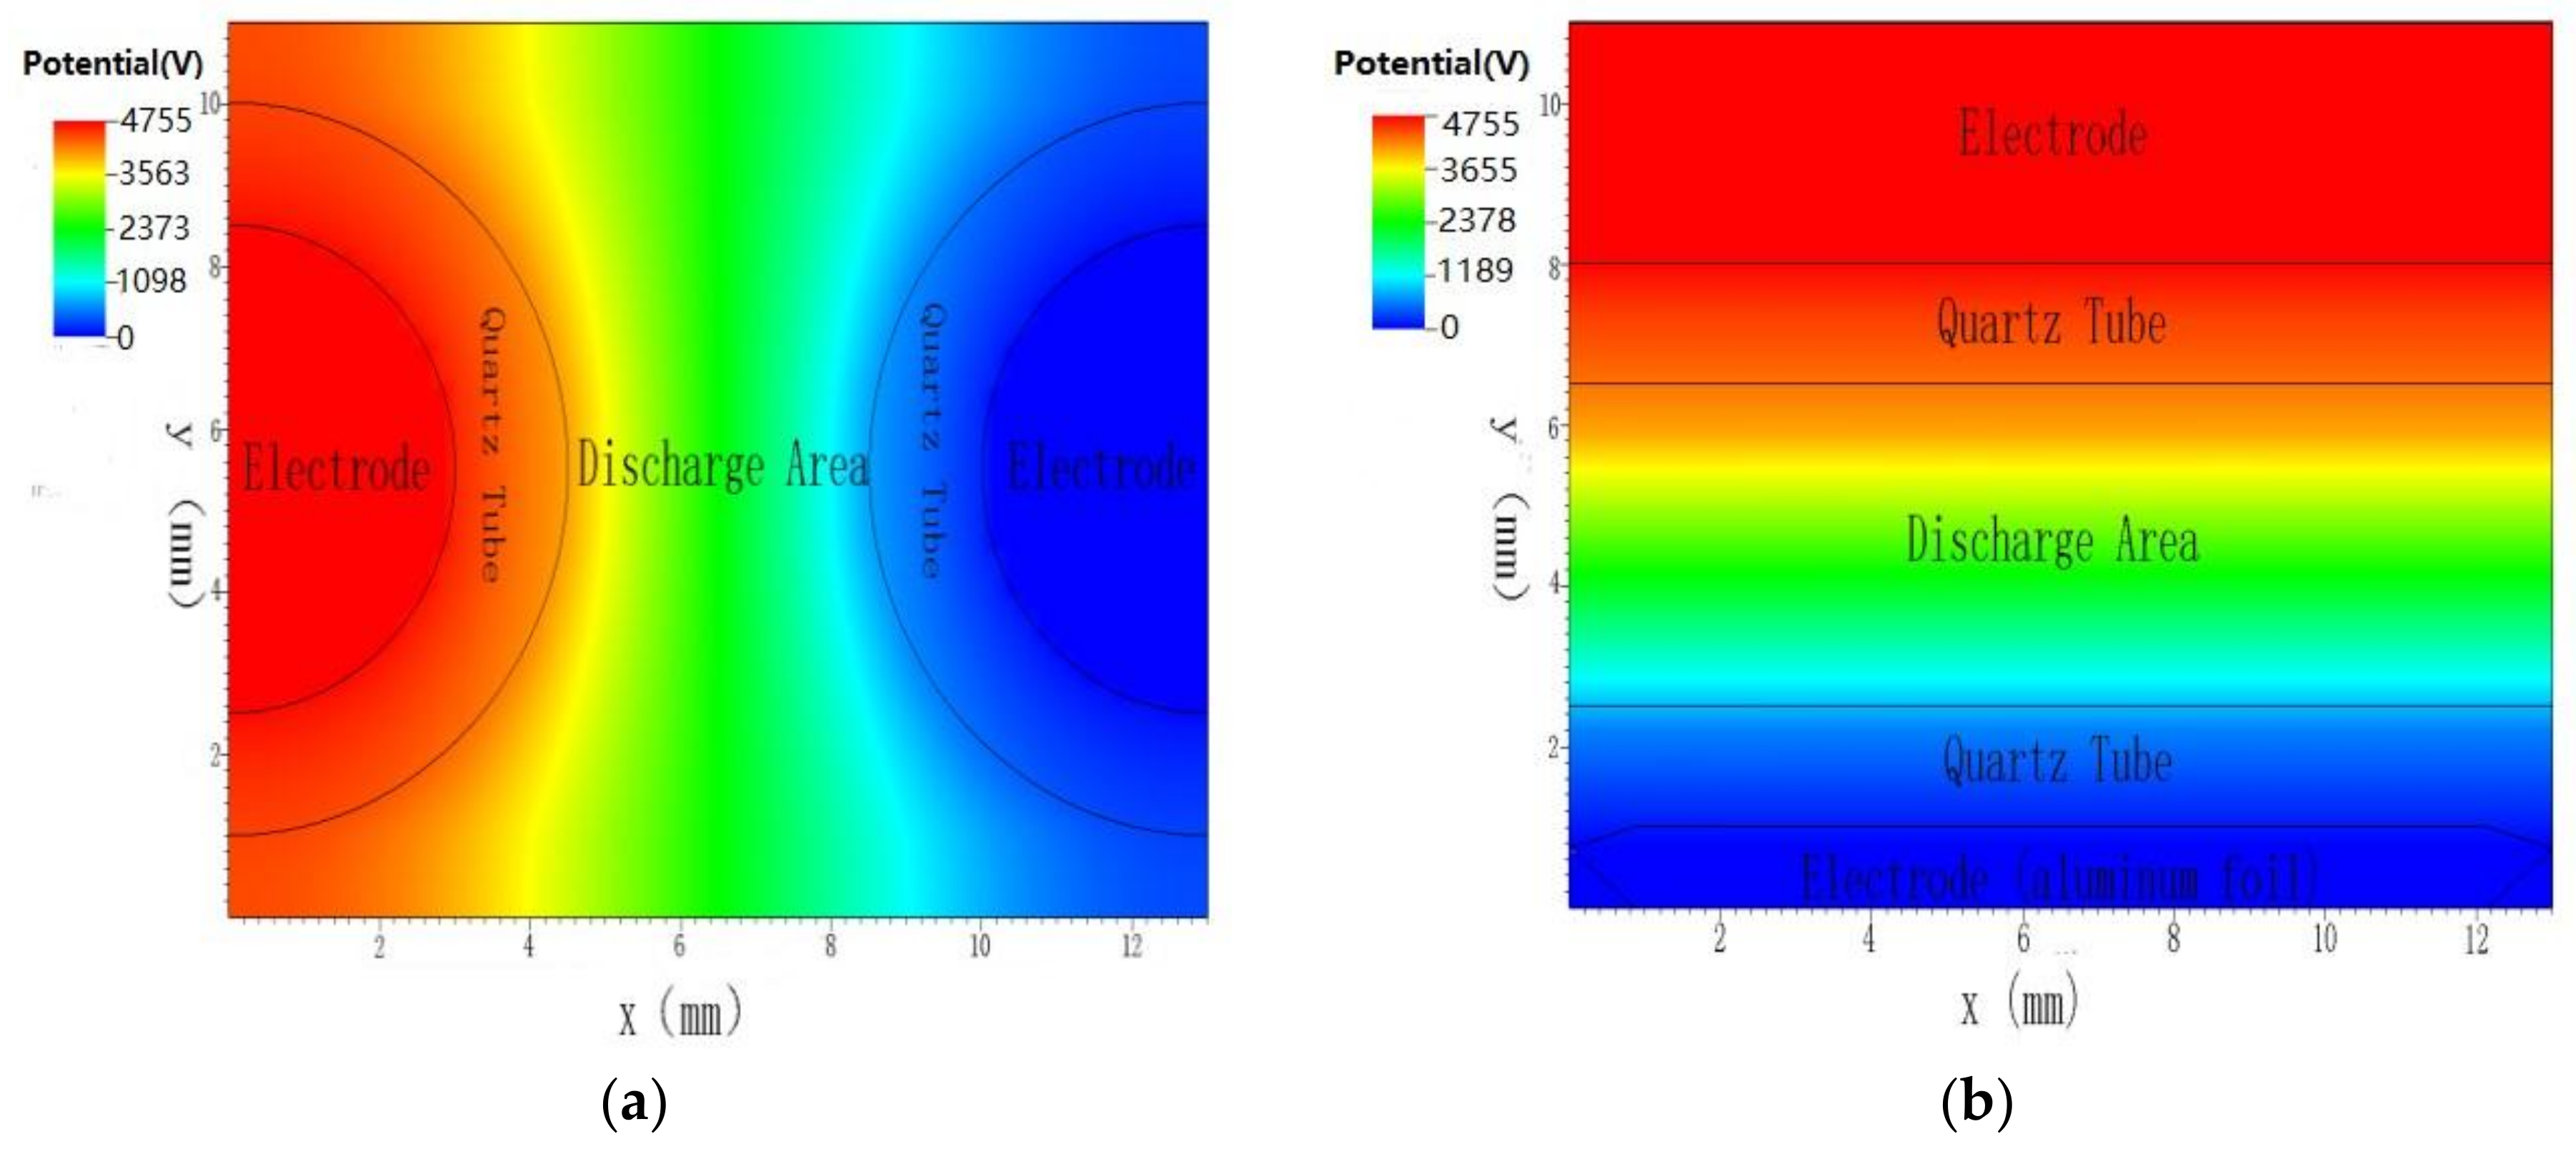
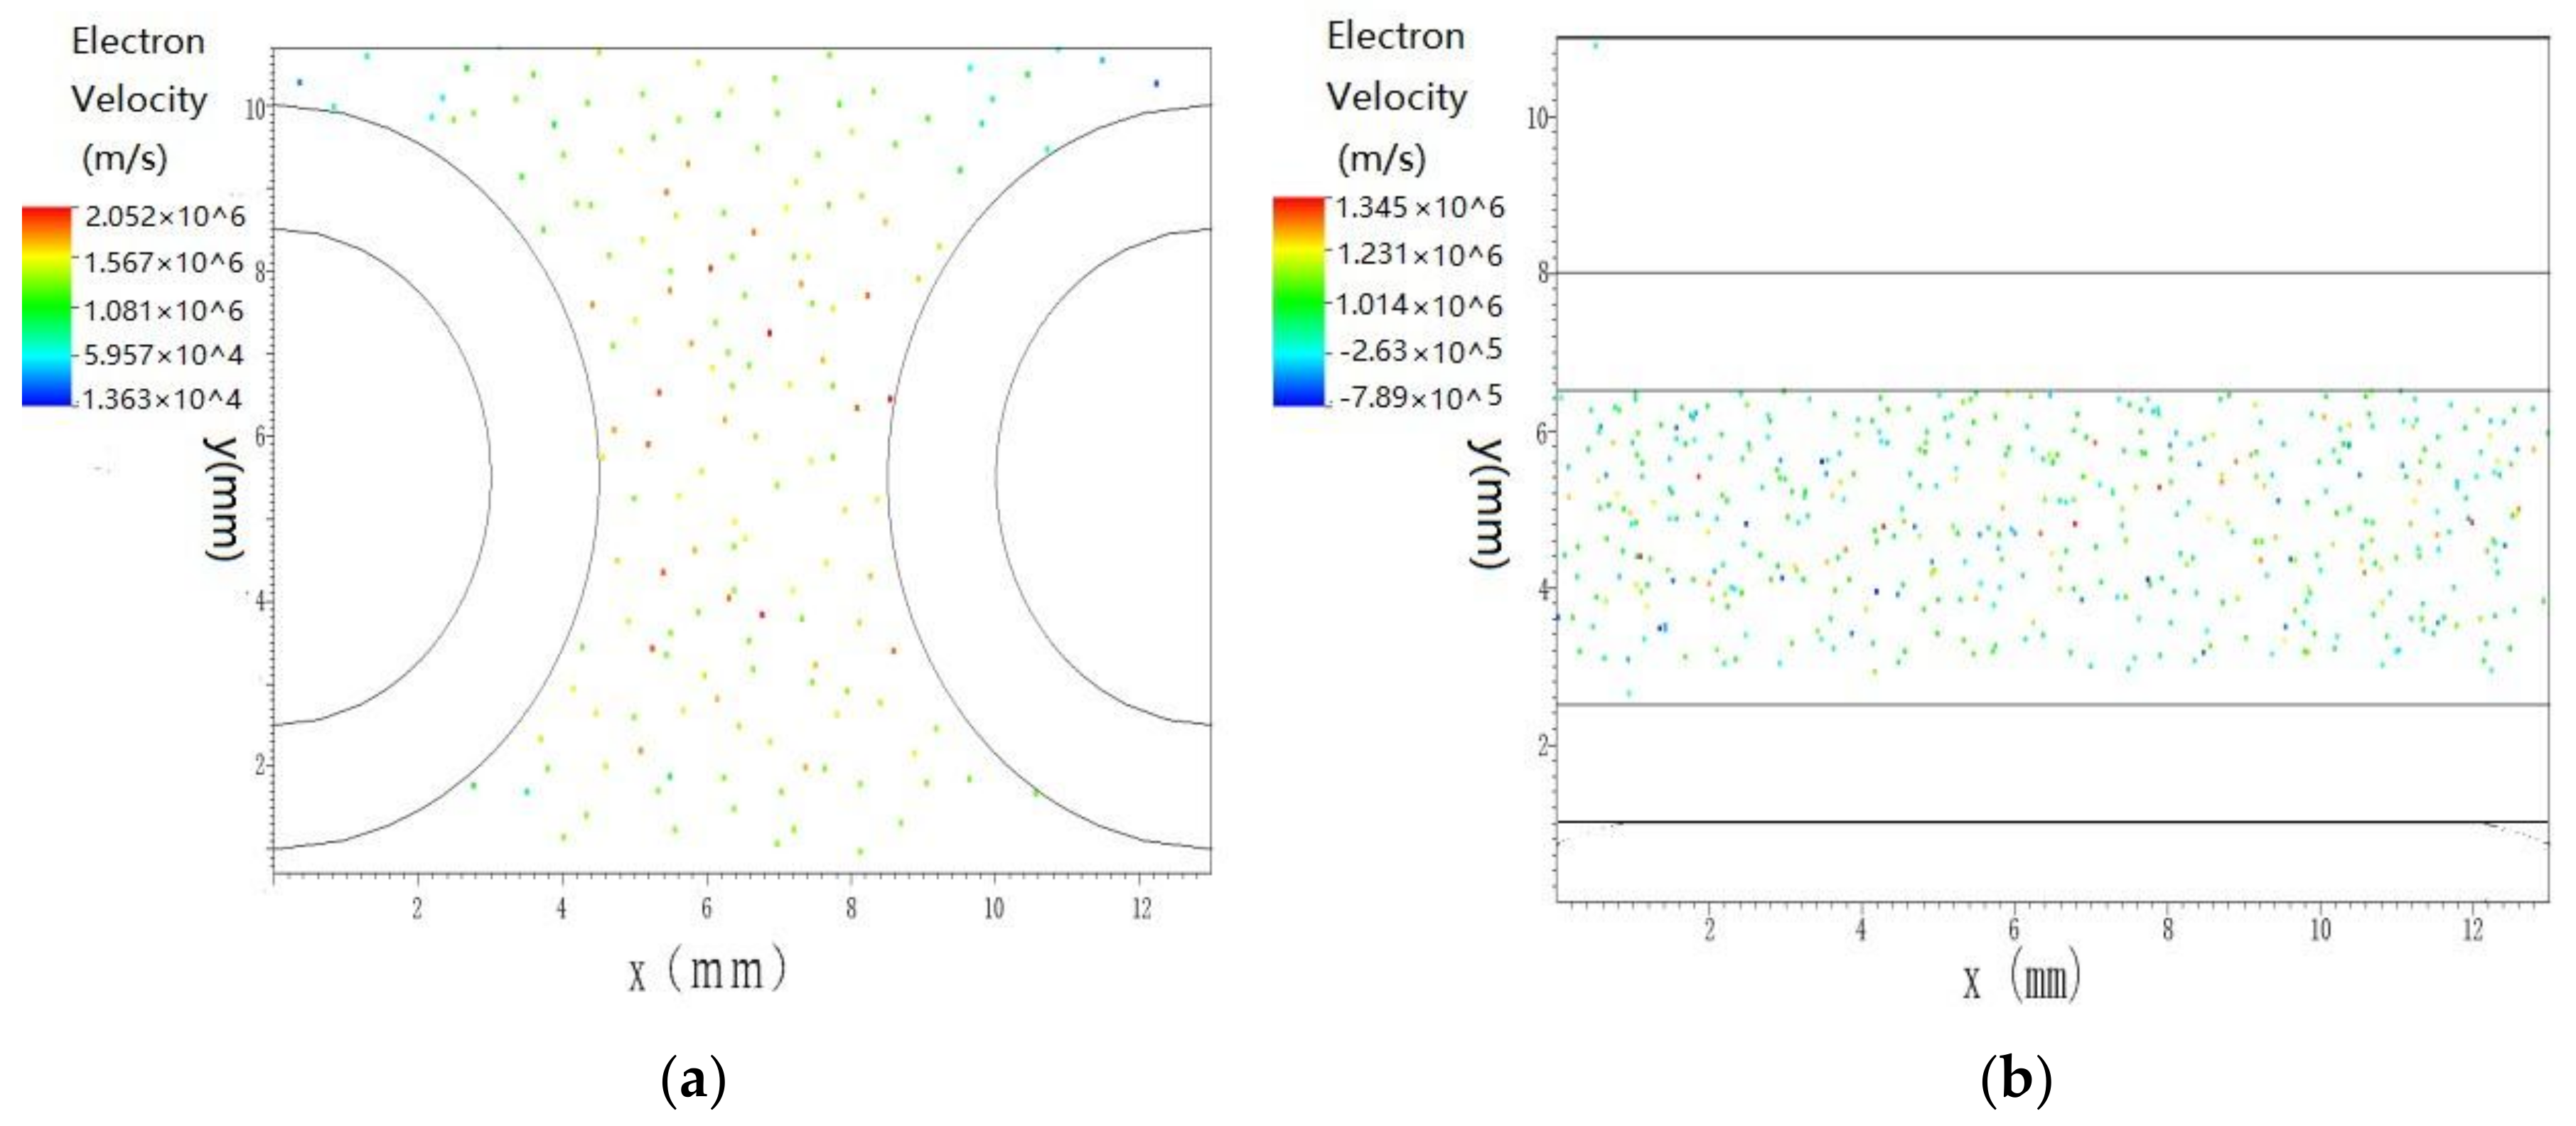
3.3. Numerical Simulation Result

Numerical simulation was a method of investigating the relationship between discharge parameters and electron energy. Figure 7 demonstrated the electric potential distribution of two types of electrode structures in the TM-DBD and CC-DBD reactors. Similarly, the voltage was linearly decreasing from anode to cathode in the two reactors, and the electromagnetic field was uniform distribution in the CC-DBD reactor, while that was stronger in the central discharge zone in the TM-DBD reactor with nonuniform voltage distribution.
The distribution of electron velocity and electron drift in the space of the CC-DBD and TM-DBD reactors are shown in Figure 8. Once the plasma was generated and the number of micro-discharges inside the cell exceeded the threshold limit (10 macro-particles per particle), the particles were combined into larger micro-discharge [47]. Electron velocity distribution presented periodic drift as a variation of discharge voltage. According to Figure 8, electron velocity distribution was more balanced in the CC-DBD reactor. Summing up the electron velocity data of simulation, the largest electronic velocity and average electron velocity were 1.345 × 10⁶ m/s and 1.014 × 10⁶ m/s in the CC-DBD reactor, respectively. On the other hand, electron velocity distribution in the TM-DBD reactor was typical Poisson distribution [48] and stronger in the center area between the two electrodes. The maximum and average of electron velocity were 2.052 × 10⁶ m/s and 1.081 × 10⁶ m/s in the TM-DBD reactor, respectively.
Considering that the motion energy of the electron is predominant in a plasma reactor, we determined the electron energy based on electron velocity distribution. The largest electron energy and average electron energy in the TM-DBD reactor were 12.09 eV and 3.35 eV, respectively. While they were 5.25 eV and 2.96 eV in the CC-DBD reactor, respectively.
The bond energies for N2, NO and O2 were 9.76, 6.5 and 5.12 eV, respectively [49]. Thus, O2 could be dissociated all in TM-DBD and CC-DBD reactors in view of the largest electron energy of 12.09 eV and 5.25 eV respectively in the two reactors, but N2 could be decomposed into N· by the electron impact dissociation reaction only in the TM-DBD reactor.

4. Discussion

Based on the above facts, the possible reaction channels [28] involved in two reactors under different O2 concentration were shown in Table 2.
In the TM-DBD and CC-DBD reactors, the reduction reactions were the main channels for NO abatement under low O2 concentration, while the channel of oxidation reaction was predominant when O2 concentration increased.
As the result, the electrode structure of TM-DBD was preferable when O2 concentration was low, but the electrode structure of CC-DBD was better under high O2 concentration condition. In other words, at low O2 concentration, a higher electron energy yielded a better DRE of NO and NOx, while the opposite result was seen when O2 concentration increased. These results verified that the electrode structure influenced the electron energy and further decided the production of new NOx in a DBD reactor.

5. Conclusions

The DRE of NO and NOx were obviously influenced by electrode structure. Under deficient oxygen, better DRE of NO and NOx is realized in the TM-DBD, and the electron impact dissociation mainly determined the destruction rate of NO with the conversion products of N2 as well as N2O. When O2 concentration increased, the DRE of NOx decreased, whereas the DRE of NO decreased and then increased in the two DBD reactors. Under O2 abundant conditions, NO was actively turned into NO2 by the oxidation reaction. Higher DRE of NO and NOx is realized in the CC-DBD reactor because new NOx was produced by the oxidation of N generated from N2 dissociation in the TM-DBD reactor.
The simulation results showed that the electron energy distribution in the TM-DBD reactor was typical Poisson distribution differing from the CC-DBD reactor. The largest electron energy and average electron energy were 12.09 eV and 3.35 eV in the TM-DBD reactor, respectively, while they were 5.25 eV and 2.96 eV in the CC-DBD reactor, respectively.
These experimental and simulation results verified that enough energy could initiate the reaction of N2→2N and then produce new NOx in the presence of O2 in the TM-DBD reactor. Therefore, the electrode structure of the CC-DBD reactor is preferable for better NO abatement and fewer new NOx generation in the DBD reactor under higher O2 concentration condition.

Acknowledgments

The financial support for this research was provided by National Natural Science Foundation of China (no. 21577023), the Key Project supported by the Science and Technology Commission of Shanghai Municipality (no. 15DZ1205904), and Technology Innovation and Energy Saving Enhancement Project supported by Shanghai SASAC (no. 2013019). The authors thank Jianyuan Hou and Jingting Wang for their help in the research work.

Author Contributions

Weixuan Zhao and Feng Wang designed the experiments. Weixuan Zhao and Yanghaichao Liu performed the experiments. Weixuan Zhao wrote the paper and analyze the data. Feng Wang contributed simulation tools. Renxi Zhang and Huiqi Hou supervise the whole work.

Conflicts of Interest

The authors declare no conflict of interest.

References

  1. Devahasdin, S.; Fan, C, Jr.; Li, K.; Chen, D. TiO2, photocatalytic oxidation of nitric oxide: Transient behavior and reaction kinetics. J. Photochem. Photobiol. A Chem. 2003, 156, 161–170. [Google Scholar] [CrossRef]
  2. Vestreng, V.; Ntziachristos, L.; Semb, A.; Reis, S.; Isaksen, I.S.A.; Tarrason, L. Evolution of NOx emissions in Europe with focus on road transport control measures. Atmos. Chem. Phys. 2009, 9, 1503–1520. [Google Scholar] [CrossRef] [Green Version]
  3. Forzatti, P. Present status and perspectives in de-NOx, SCR catalysis. Appl. Catal. A Gen. 2001, 222, 221–236. [Google Scholar] [CrossRef]
  4. Zhao, L.; Li, C.; Wang, Y.; Wu, H.; Gao, L.; Zhang, J.; Zeng, G. Simultaneous removal of elemental mercury and NO from simulated flue gas using a CeO2 modified V2O5–WO3/TiO2 catalyst. Catal. Sci. Technol. 2016, 6, 420–430. [Google Scholar] [CrossRef]
  5. Boulter, P.G.; Borken-Kleefeld, J.; Ntziachristos, L. The evolution and control of NOx, emissions from road transport in Europe. In Urban Air Quality in Europe; Springer: Berlin, Germany, 2012; pp. 31–53. [Google Scholar]
  6. Vasilets, V.N. Nitric oxide plasma sources for bio-decontamination and plasma therapy. In NATO Science for Peace and Security Series A: Chemistry and Biology; Springer: Berlin, Germany, 2012; pp. 393–402. [Google Scholar]
  7. Collet, G.; Robert, E.; Lenoir, A.; Vandamme, M.; Darny, T.; Dozias, S.; Kieda, C.; Pouvesle, J.M. Plasma jet-induced tissue oxygenation: Potentialities for new therapeutic strategies. Plasma Sour. Sci. Technol. 2014, 23, 184–195. [Google Scholar] [CrossRef]
  8. Guo, Y.; Liao, X.; Fu, M.; Huang, H.; Ye, D. Toluene decomposition performance and NOx, by-product formation during a DBD-catalyst process. J. Environ. Sci. 2015, 28, 187–194. [Google Scholar] [CrossRef] [PubMed]
  9. Wang, J.; Cai, Y.; Wang, J.; Zhang, L.; Li, X. Research on the Effect of C3H6 on NO Conversion Rate in a NTP Reactor. In Proceedings of the 2010 International Conference on Optoelectronics and Image Processing (ICOIP 2010), Haiko, China, 11–12 November 2010; IEEE: Piscataway, NJ, USA, 2010; pp. 297–300. [Google Scholar]
  10. Anaghizi, S.J.; Talebizadeh, P.; Rahimzadeh, H.; Ghomi, H. The Configuration Effects of Electrode on the Performance of Dielectric Barrier Discharge Reactor for NOx, Removal. IEEE Trans. Plasma Sci. 2015, 43, 1944–1953. [Google Scholar] [CrossRef]
  11. Wu, Y.; Wu, W.; Long, X.; Liang, P. NOx Formation Mechanism and Control Technology in Process of Orimulsion Combustion. Pollut. Control Technol. 2005, 3, 243–247. [Google Scholar]
  12. Lieplapa, L.; Blumberga, D. Assessing methods of PM10 and NOx emission for EIA of roads. Manag. Environ. Qual. 2012, 23, 163–172. [Google Scholar] [CrossRef]
  13. Wang, Z.; Zhou, J.; Zhu, Y.; Wen, Z.; Liu, J.; Cen, K. Simultaneous removal of NOx, SO2 and Hg in nitrogen flow in a narrow reactor by ozone injection: Experimental results. Fuel Process. Technol. 2007, 88, 817–823. [Google Scholar] [CrossRef]
  14. Dell’Acqua, S.; Pauleta, S.R.; Monzani, E.; Pereira, A.S.; Casella, L.; Moura, J.J.G.; Moura, I. Electron transfer complex between nitrous oxide reductase and cytochrome c552 from Pseudomonas nautica: Kinetic, nuclear magnetic resonance, and docking studies. Biochemistry 2014, 47, 10852–10862. [Google Scholar] [CrossRef] [PubMed]
  15. Jani, M.A.; Toda, K.; Takaki, K.; Fujiwara, T. An experimental comparison between electrode shapes for NOx treatment using a dielectric barrier discharge. J. Phys. D Appl. Phys. 2000, 33, 3078. [Google Scholar] [CrossRef]
  16. Chen, G.; Sun, Q.; Shi, L.; Song, Z. Effect of Combination Way of Dielectric Barrier Discharge and CuZSM-5 on NOx Removal. Chin. J. Catal. 2010, 31, 817–821. [Google Scholar]
  17. Penetrante, B.M.; Hsiao, M.C.; Merritt, B.T.; Vogtlin, G.E.; Wallman, P.H.; Neiger, M.; Wolf, O.; Hammer, T.; Broer, S. Pulsed corona and dielectric-barrier discharge processing of NO in N2. Appl. Phys. Lett. 1996, 68, 3719–3721. [Google Scholar] [CrossRef]
  18. Li, X.H.; Wei, X.; Han, W.H.; Cai, Y.X.; Shi, Y.X. Effects of argon on NO conversion by NTP in NO/N2/O2 mixtures through emission spectroscopy analysis. J. Chem. Eng. Chin. Univ. 2015, 29, 346–351. [Google Scholar]
  19. Bai, M.; Leng, B.; Mao, S.; Li, C. Flue Gas Desulfurization by Dielectric Barrier Discharge. Plasma Chem. Plasma Process. 2016, 36, 511–521. [Google Scholar] [CrossRef]
  20. Sun, B.M.; Gao, X.D.; Xiao, H.P.; Du, X.; Duan, E.; Zeng, J. Influence of power frequency on energy consumption of NOx removal by DBD technology. J. Chin. Soc. Power Eng. 2012, 32, 47–51. [Google Scholar]
  21. Rajasekaran, P.; Opländer, C.; Hoffmeister, D.; Bibinov, N.; Suschek, C.V.; Wandke, D.; Awakowicz, P. Characterization of Dielectric Barrier Discharge (DBD) on Mouse and Histological Evaluation of the Plasma Treated Tissue. Plasma Processes Polym. 2011, 8, 246–255. [Google Scholar] [CrossRef]
  22. Li, X.; Wei, X.; Han, W.; Cai, Y.; Wang, J.; Li, K. Experimental study on NO conversion in N2/NO mixtures by non-thermal plasma based on spectroscopy diagnosis. In Proceedings of the 2012 Asia-Pacific Power and Energy Engineering Conference, Shanghai, China, 27–29 March 2012; pp. 1–4. [Google Scholar]
  23. Penetrante, B.M.; Hsiao, M.C.; Merritt, B.T.; Vogtlin, G.E.; Wallman, P.H. Comparison of electrical discharge techniques for nonthermal plasma processing of NO in N2. IEEE Trans. Plasma Sci. 1995, 23, 679–687. [Google Scholar] [CrossRef]
  24. Sun, Q.; Zhu, A.; Yang, X.; Niu, J.; Xu, Y. Formation of NOx from N2 and O2 in catalyst-pellet filled dielectric barrier discharges at atmospheric pressure. Chem. Commun. 2003, 12, 1418–1419. [Google Scholar] [CrossRef]
  25. Kim, H.H.; Teramoto, Y.; Ogata, A.; Takagi, H.; Nanba, T. Plasma Catalysis for Environmental Treatment and Energy Applications. Plasma Chem. Plasma Process. 2016, 36, 45–72. [Google Scholar] [CrossRef]
  26. Wang, J.; Cao, X.; Zhang, R.; Gong, T.; Hou, H.; Chen, S.; Zhang, R. Effect of Water Vaporon Toluene Removal in Catalysis-DBD Plasma Reactors. Plasma Sci. Technol. 2016, 18, 370–375. [Google Scholar] [CrossRef]
  27. Mahammadunnisa, S.; Reddy, E.L.; Reddy, P.R.M.K.; Subrahmanyam, C. A Facile Approach for Direct Decomposition of Nitrous Oxide Assisted by Non-Thermal Plasma. Plasma Process. Polym. 2013, 10, 444–450. [Google Scholar] [CrossRef]
  28. Mohapatro, S.; Rajanikanth, B.S. Cascaded cross flow DBD-adsorbent technique for NOx, abatement in diesel engine exhaust. IEEE Trans. Dielectr. Electr. Insul. 2010, 17, 1543–1550. [Google Scholar] [CrossRef]
  29. Song, C.; Bin, F.; Tao, Z.; Li, F.; Huang, Q. Simultaneous removals of NOx, HC and PM from diesel exhaust emissions by dielectric barrier discharges. J. Hazard. Mater. 2009, 166, 523–530. [Google Scholar] [CrossRef] [PubMed]
  30. Wang, T.; Sun, B.; Xiao, H.; Zeng, J.; Duan, E.; Xin, J.; Li, C. Effect of Reactor Structure in DBD for Nonthermal Plasma Processing of NO in N2, at Ambient Temperature. Plasma Chem. Plasma Process. 2012, 32, 1189–1201. [Google Scholar] [CrossRef]
  31. Ma, S.; Zhao, Y.; Yang, J.; Zhang, S.; Zhang, J.; Zheng, C. Research progress of pollutants removal from coal-fired flue gas using non-thermal plasma. Renew. Sustain. Energy Rev. 2017, 67, 791–810. [Google Scholar] [CrossRef]
  32. Xia, L.; Huang, L.; Shu, X.; Zhang, R.; Dong, W.; Hou, H. Removal of ammonia from gas streams with dielectric barrier discharge plasmas. J. Hazard. Mater. 2008, 152, 113–119. [Google Scholar] [CrossRef] [PubMed]
  33. Pawłat, J.; Diatczyk, J.; Stryczewska, H.D. Low-temperature plasma for exhaust gas purification from paint shop—A case study. Prz. Elektrotech. 2011, 87, 245–248. [Google Scholar]
  34. Kim, H.H. Nonthermal Plasma Processing for Air-Pollution Control: A Historical Review, Current Issues, and Future Prospects. Plasma Process. Polym. 2004, 1, 91–110. [Google Scholar] [CrossRef]
  35. Ran, J.; Luo, H.; Wang, X. Experimental study of homogeneous dielectric barrier discharge in air at atmospheric pressure. In Proceedings of the 2012 Abstracts IEEE International Conference on Plasma Science, Edinburgh, UK, 8–13 July 2012; IEEE: Piscataway, NJ, USA, 2012. [Google Scholar]
  36. Mizuno, A.; Rajanikanth, B.S.; Shimizu, K.; Kinoshita, K.; Yanagihara, K.; Okumoto, M.; Katsura, S. Non-Thermal Plasma Applications at Very Low Temperature. Combust. Sci. Technol. 1998, 133, 49–63. [Google Scholar] [CrossRef]
  37. Takaki, K.; Jani, M.A.; Fujiwara, T. Removal of nitric oxide in flue gases by multi-point to plane dielectric barrier discharge. IEEE Trans. Plasma Sci. 1999, 27, 1137–1145. [Google Scholar] [CrossRef]
  38. Bai, M.; Zhang, Z.; Bai, M.; Bai, X.; Gao, H. Synthesis of Ammonia Using CH/N Plasmas Based on Micro-Gap Discharge under Environmentally Friendly Condition. Plasma Chem. Plasma Process. 2008, 28, 405–414. [Google Scholar] [CrossRef]
  39. Blin-Simiand, N.; Jorand, F.; Magne, L.; Pasquiers, S.; Postel, C.; Vacher, J.-R. Plasma Reactivity and Plasma-Surface Interactions during Treatment of Toluene by a Dielectric Barrier Discharge. Plasma Chem. Plasma Process. 2008, 28, 429–466. [Google Scholar] [CrossRef]
  40. Rubio, S.J.; Rodero, A.; Quintero, M.C. Application of a Microwave Helium Plasma Torch Operating at Atmospheric Pressure to Destroy Trichloroethylene. Plasma Chem. Plasma Process. 2008, 28, 415–428. [Google Scholar] [CrossRef]
  41. Hagelaar, G.J.M.; Pitchford, L.C. Solving the Boltzmann equation to obtain electron transport coefficients and rate coefficients for fluid models. Plasma Sour. Sci. Technol. 2005, 14, 722–733. [Google Scholar] [CrossRef]
  42. Abdollahzadeh, M.; Pascoa, J.C.; Oliveira, P.J. Implementation of the classical plasma–fluid model for simulation of dielectric barrier discharge (DBD) actuators in Open FOAM. Comput. Fluids 2016, 128, 77–90. [Google Scholar] [CrossRef]
  43. Cristofolini, A.; Borghi, C.A.; Neretti, G. Charge distribution on the surface of a dielectric barrier discharge actuator for the fluid-dynamic control. J. Appl. Phys. 2012, 113, 370–410. [Google Scholar] [CrossRef]
  44. Sato, S.; Ohnishi, N. Theoretical Modeling of Pulse Discharge Cycle in DBD Plasma Actuator. Jpn. J. Appl. Phys. 2016, 55. [Google Scholar] [CrossRef]
  45. Geng, S.F.; Qiu, X.M.; Cheng, C.M.; Chu, P.K.; Tang, D.L. Three-dimensional particle-in-cell simulation of discharge characteristics in cylindrical anode layer hall plasma accelerator. Phys. Plasmas 2012, 19, 043507. [Google Scholar] [CrossRef]
  46. Atkinson, R.; Baulch, D.L.; Cox, R.A.; Hampson, R.F., Jr.; Kerr, J.A.; Rossi, M.J.; Troe, J. Evaluated Kinetic, Photochemical and Heterogeneous Data for Atmospheric Chemistry: Supplement V. IUPAC Subcommittee on Gas Kinetic Data Evaluation for Atmospheric Chemistry. J. Phys. Chem. Ref. Data 1997, 26, 521–1011. [Google Scholar] [CrossRef]
  47. Hemker, R.G. Particle-in-Cell Modeling of Plasma-Based Accelerators in Two and Three Dimensions; University of California: Los Angeles, CA, USA, 2015; p. 338. [Google Scholar]
  48. Singh, H.; Graves, D.B. Measurements of the electron energy distribution function in molecular gases in an inductively coupled plasma. J. Appl. Phys. 2000, 87, 4098–4106. [Google Scholar] [CrossRef]
  49. Okabe, H. Photochemistry of Small Molecules; John Wiley and Sons, Inc.: Hoboken, NJ, USA, 1978. [Google Scholar]
Figure 1. Flow diagram of experiment.
Applsci 08 00618 g001
Figure 2. Simplified geometric modeling of TM-DBD and CC-DBD reactor.
Applsci 08 00618 g002
Figure 3. Destruction and removal efficiency (DRE) of NO and NOx in TM-DBD and CC-DBD reactors under different O2 concentration.
Applsci 08 00618 g003
Figure 4. FTIR spectra of the final products for NO abatement (NO concentration was 345 ppm, and buffer gas was N2).
Applsci 08 00618 g004
Figure 5. FTIR spectra of final products for NO abatement in TM-DBD and CC-DBD reactor (NO concentration was 345 ppm; buffer gas was 8% O2 and 92% N2).
Applsci 08 00618 g005
Figure 6. FTIR spectra of final products for N2/O2 system in the TM-DBD and CC-DBD reactors.
Applsci 08 00618 g006
Figure 7. Electric potential distribution of the TM-DBD and CC-DBD reactors (DBD was driven by 5 kV, 20 kHz AC power). (a) TM-DBD; (b) CC-DBD.
Applsci 08 00618 g007
Figure 8. Distribution of electron velocity in the CC-DBD and TM-DBD reactors (5000 particles were randomly selected for this plot). (a) TM-DBD; (b) CC-DBD.
Applsci 08 00618 g008
Table 1. Model parameters of DBD in VSim and Geometry parameters of CC-DBD and TM-DBD in VSim.
Model Parameters of DBD in VSim
Grid numbersX ∗ Y ∗ Z = 100 ∗ 100 ∗ 200
Numbers of gyrating circles50
Numbers of microparticle50,000
Geometry Parameters of CC-DBD and TM-DBD in VSim
TM-DBDRT/mmrT/mmDT/mm
31.54
CC-DBDRC/mmrC/mmDC/mmRoC/mm
31.541
Table 2. The reactions in CC-DBD and TM-DBD under different O2 concentrations.
CC-DBDLow O2e+NO→e+NO*
NO*+NO*→N2O+O
NO*+NO*→N2+O2
High O2e+NO→e+NO*
e+O2→e+2O
NO*+O→NO2
NO*+NO*→N2O+O
O+O2 O 3 *
O 3 * +M→ O 3
O3+NO→NO2+O2
TM-DBDLow O2e+N2→e+2N
e+NO→e+N+O
NO+N→N2+O
High O2e+N2→e+2N
e+O2→e+2O
e+NO→e+N+O
NO+O→NO2
N+O→NO
N+O2→NO+O
N+NO2→N2O+O

