Article

The Influence of Forming Directions and Strain Rate on Dynamic Shear Properties of Aerial Aluminum Alloy

Department of Mechanical Engineering, University of Jinan, No. 336, Nanxinzhuang West Road, Jinan 250022, China
*
Author to whom correspondence should be addressed.
Appl. Sci. 2018, 8(4), 520; https://doi.org/10.3390/app8040520
Submission received: 14 March 2018 / Revised: 26 March 2018 / Accepted: 26 March 2018 / Published: 29 March 2018
(This article belongs to the Section Mechanical Engineering)

Abstract

:
Dynamic shear properties under high strain rate are an important basis for studying the dynamic mechanical properties and microscopic mechanisms of materials. Dynamic impact shear tests of aerial aluminum alloy 7050-T7451 in rolling direction (RD), transverse direction (TD) and normal direction (ND) were performed at a range of strain rates from 2.5 × 10⁴ s−1 to 4.5 × 10⁴ s−1 by High Split Hopkinson Pressure Bar (SHPB). The influence of different forming directions and strain rates on the dynamic shear properties of material and the microstructure evolution under dynamic shear were emphatically analyzed. The results showed that aluminum alloy 7050-T7451 had a certain strain rate sensitivity and positive strain rate strengthening effect, and also the material had no obvious strain strengthening effect. Different forming directions had a great influence on dynamic shear properties. The shear stress in ND was the largest, followed by that in RD, and the lowest was that in TD. The microstructure observation showed that the size and orientation of the grain structure were different in three directions, which led to the preferred orientation of the material. All of those were the main reasons for the difference of dynamic shear properties of the material.

1. Introduction

Aerial aluminum alloy is a lightweight structural material widely used in the field of aeronautics and astronautics at present, because of its good comprehensive properties, such as high structural strength, fracture toughness and stress corrosion cracking [1], and usually it is machined using a high speed machining process. Basic data of dynamic mechanical properties of materials is the prerequisite and basis for the simulation of the high speed cutting process and the analysis of the machining mechanism. High temperature dynamic compression tests of 2219 aluminum alloy were carried out by Zhang et al. [2], and the deformation characteristics of material and the change rules of flow stress were studied at high temperature. The results showed that 2219 aluminum alloy had high temperature sensitivity, and the flow stress decreased with the increase of temperature. Xie et al. [3] used the Split Hopkinson Tension Bar (SHTB) device to carry out high strain rate dynamic mechanical test of 7075-T6 aluminum alloy at room temperature, and obtained the stress-strain curves of material at high strain rate. Chen et al. [4] studied the dynamic mechanical properties of refractory high-entropy alloys with high plasticity, and the microstructure under different kinds of refractory high-entropy alloys were analyzed by scanning electron microscope (SEM) and other microanalysis methods. Based on the dynamic compression and tensile tests, mechanical properties of some materials had been achieved in initial research results. However, there was a distinct difference between the shear and extrusion forces in the material removal process of high speed cutting.
Compared with the dynamic compression test, the dynamic shear test data is more accurately to characterize the dynamic mechanical properties of material during the high speed cutting process. The dynamic loading tests of three kinds of AISI D2 steel cap specimens were carried out by the High Split Hopkinson Pressure Bar (SHPB) device by Yu et al. [5], and it was proved that the flow stress and failure strain increased with the decrease of shear band widths. However, because of the complexity of the machining process of cap specimens, the error of specimens preparation directly affected the test results.
At present, the studies of dynamic mechanical properties of most high strength light alloy materials are based on isotropy theory [6,7]. However, the matrix, precipitation and microscopical grain of materials had been changed a lot after rolling or other forming processes [8,9], which showed obvious anisotropic characteristics [10]. Studies on the evolutions of microstructures and textures of 7050 Al alloy plate during solution heat treatment [11] and the influence of texture on dynamic mechanical properties of TC4 rolling plate [12] have shown that the dynamic mechanical properties of metal were different in different forming directions after rolling and other forming processes, especially the rolling direction (RD), transverse direction (TD) and normal direction (ND).
In this paper, the dynamic shear tests were carried out to analyze the influence of forming directions and strain rate on dynamic shear properties of aeronautical aluminum alloy 7050-T7451, and the main reasons for the anisotropic characteristics of dynamic shear mechanical properties of aluminum alloy 7050-T7451 plate were discussed based on microscopic observation. Based on the effect of forming directions of aeronautic aluminum alloy materials, the dynamic shear property parameters of the materials were obtained, which provided an important basis and premise for building the constitutive model of aeronautical materials considering the direction effect and the reliable analysis of numerical simulation.

2. Experimental Procedures

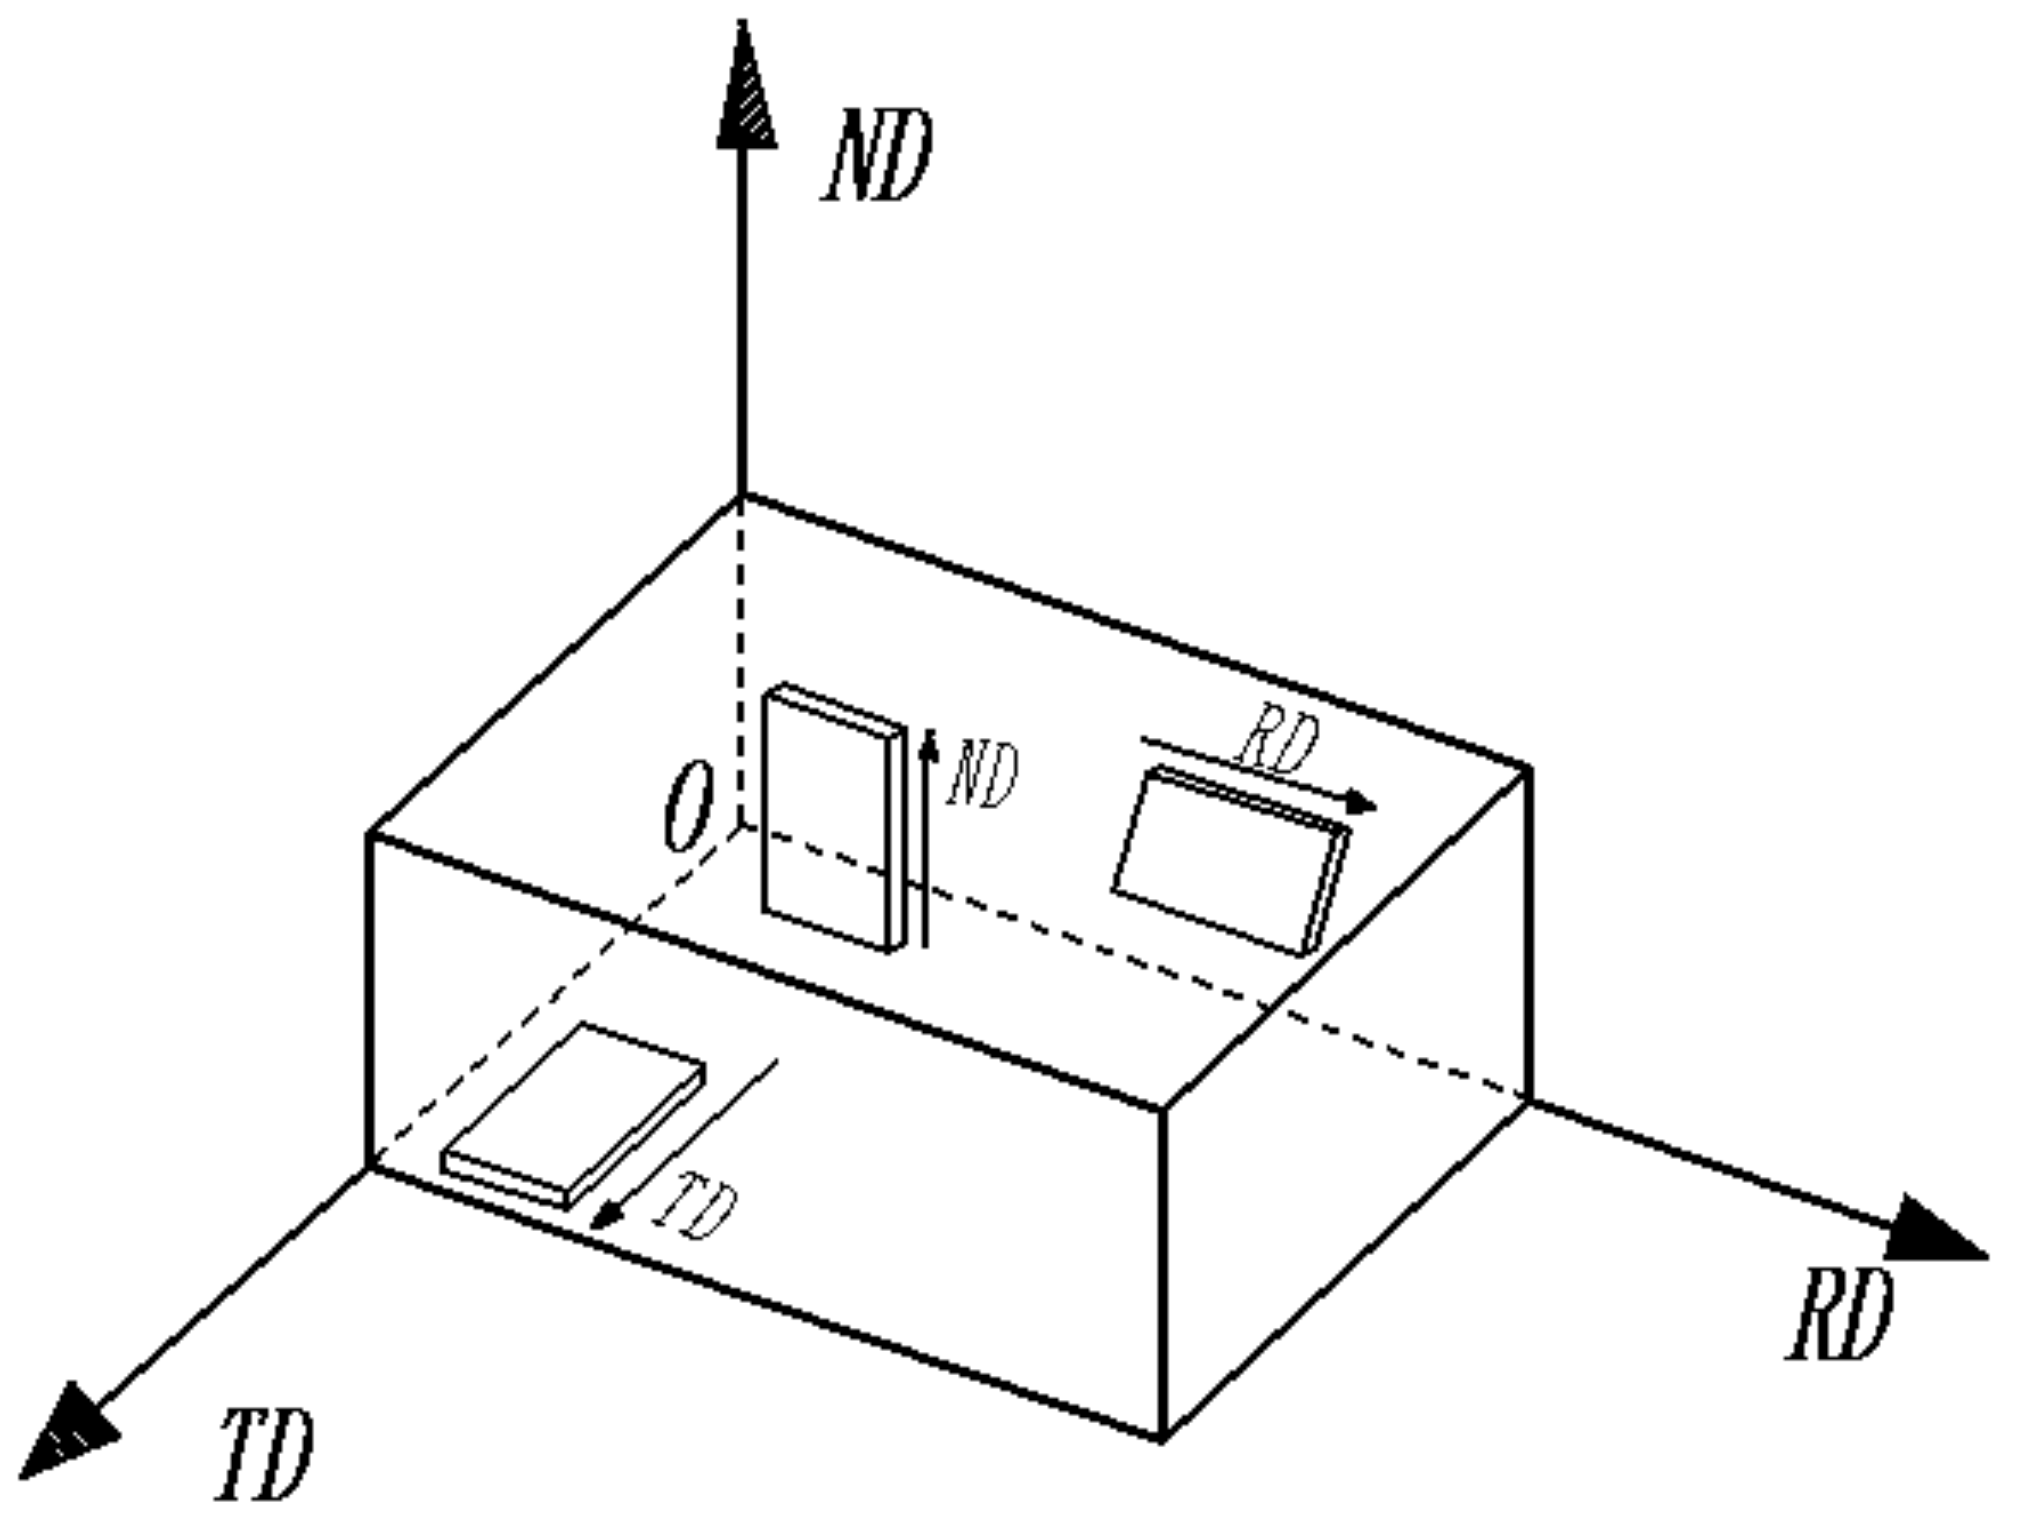
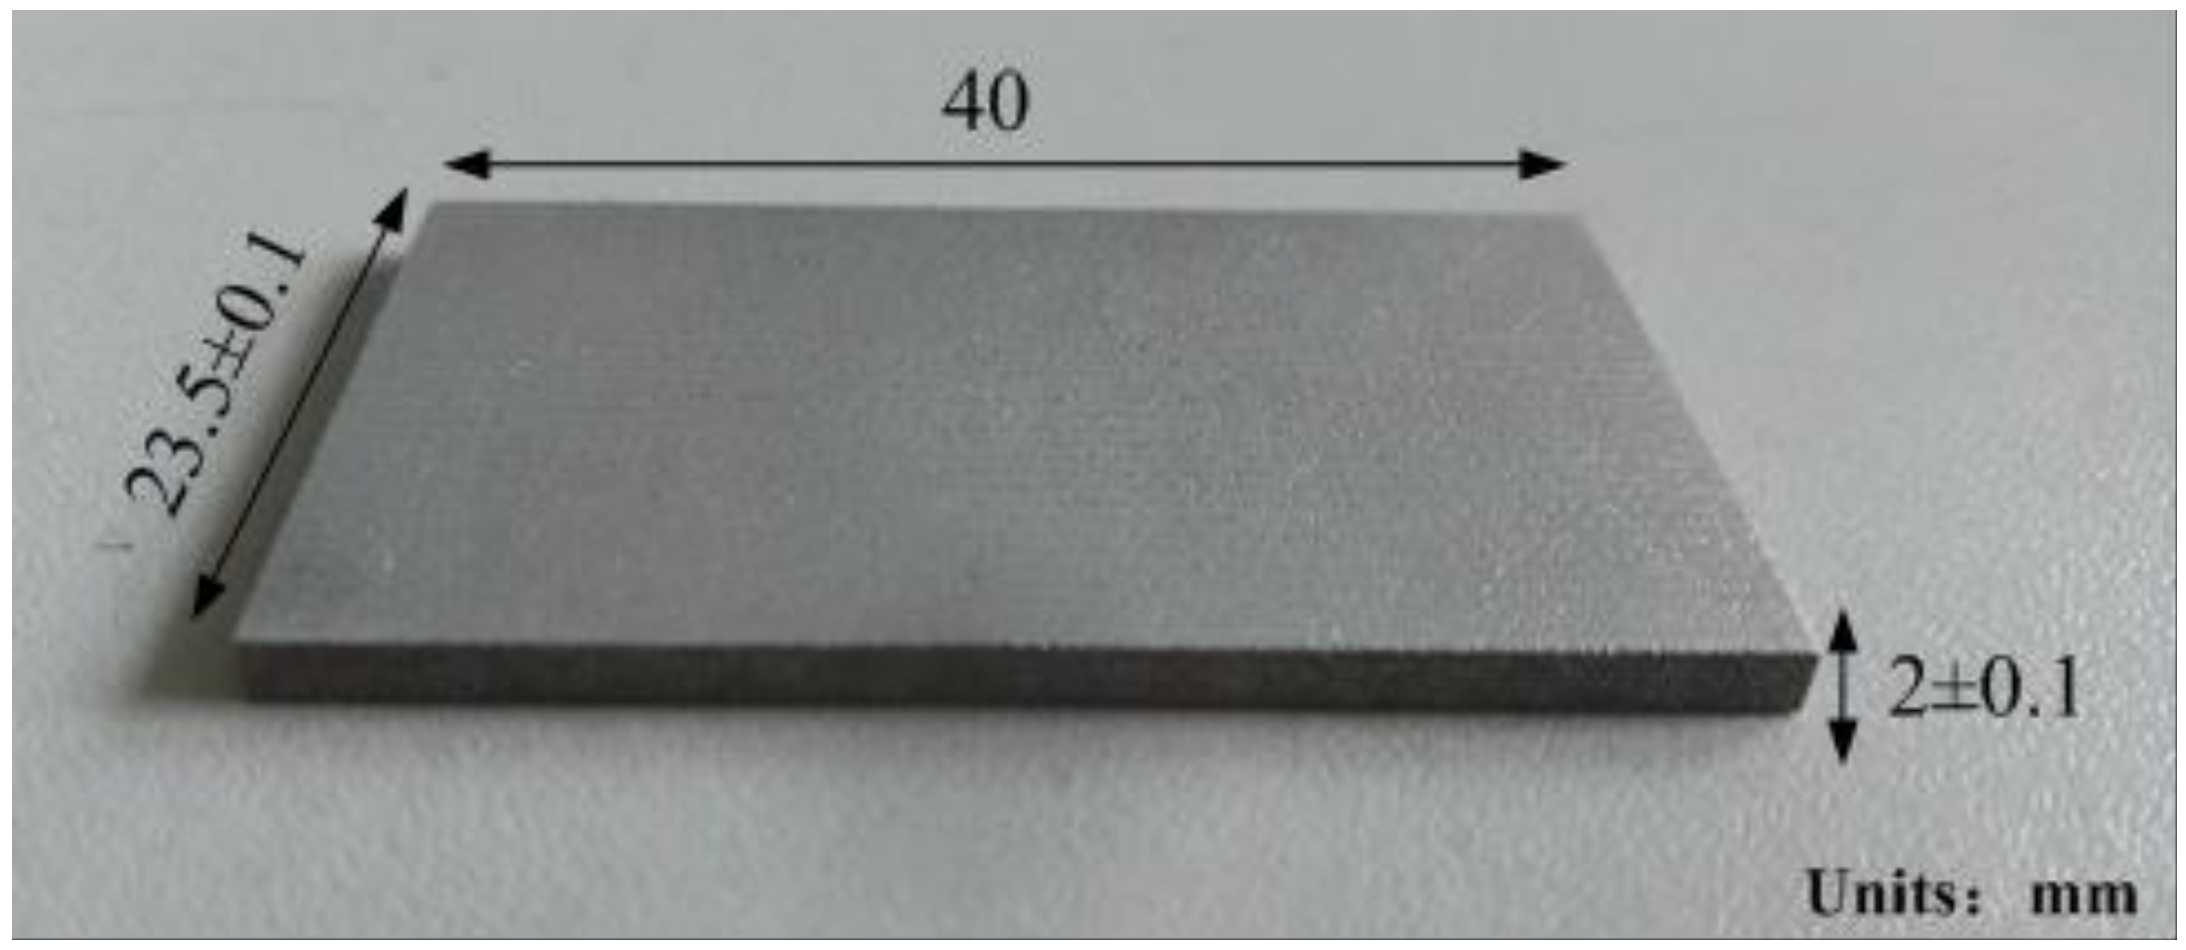
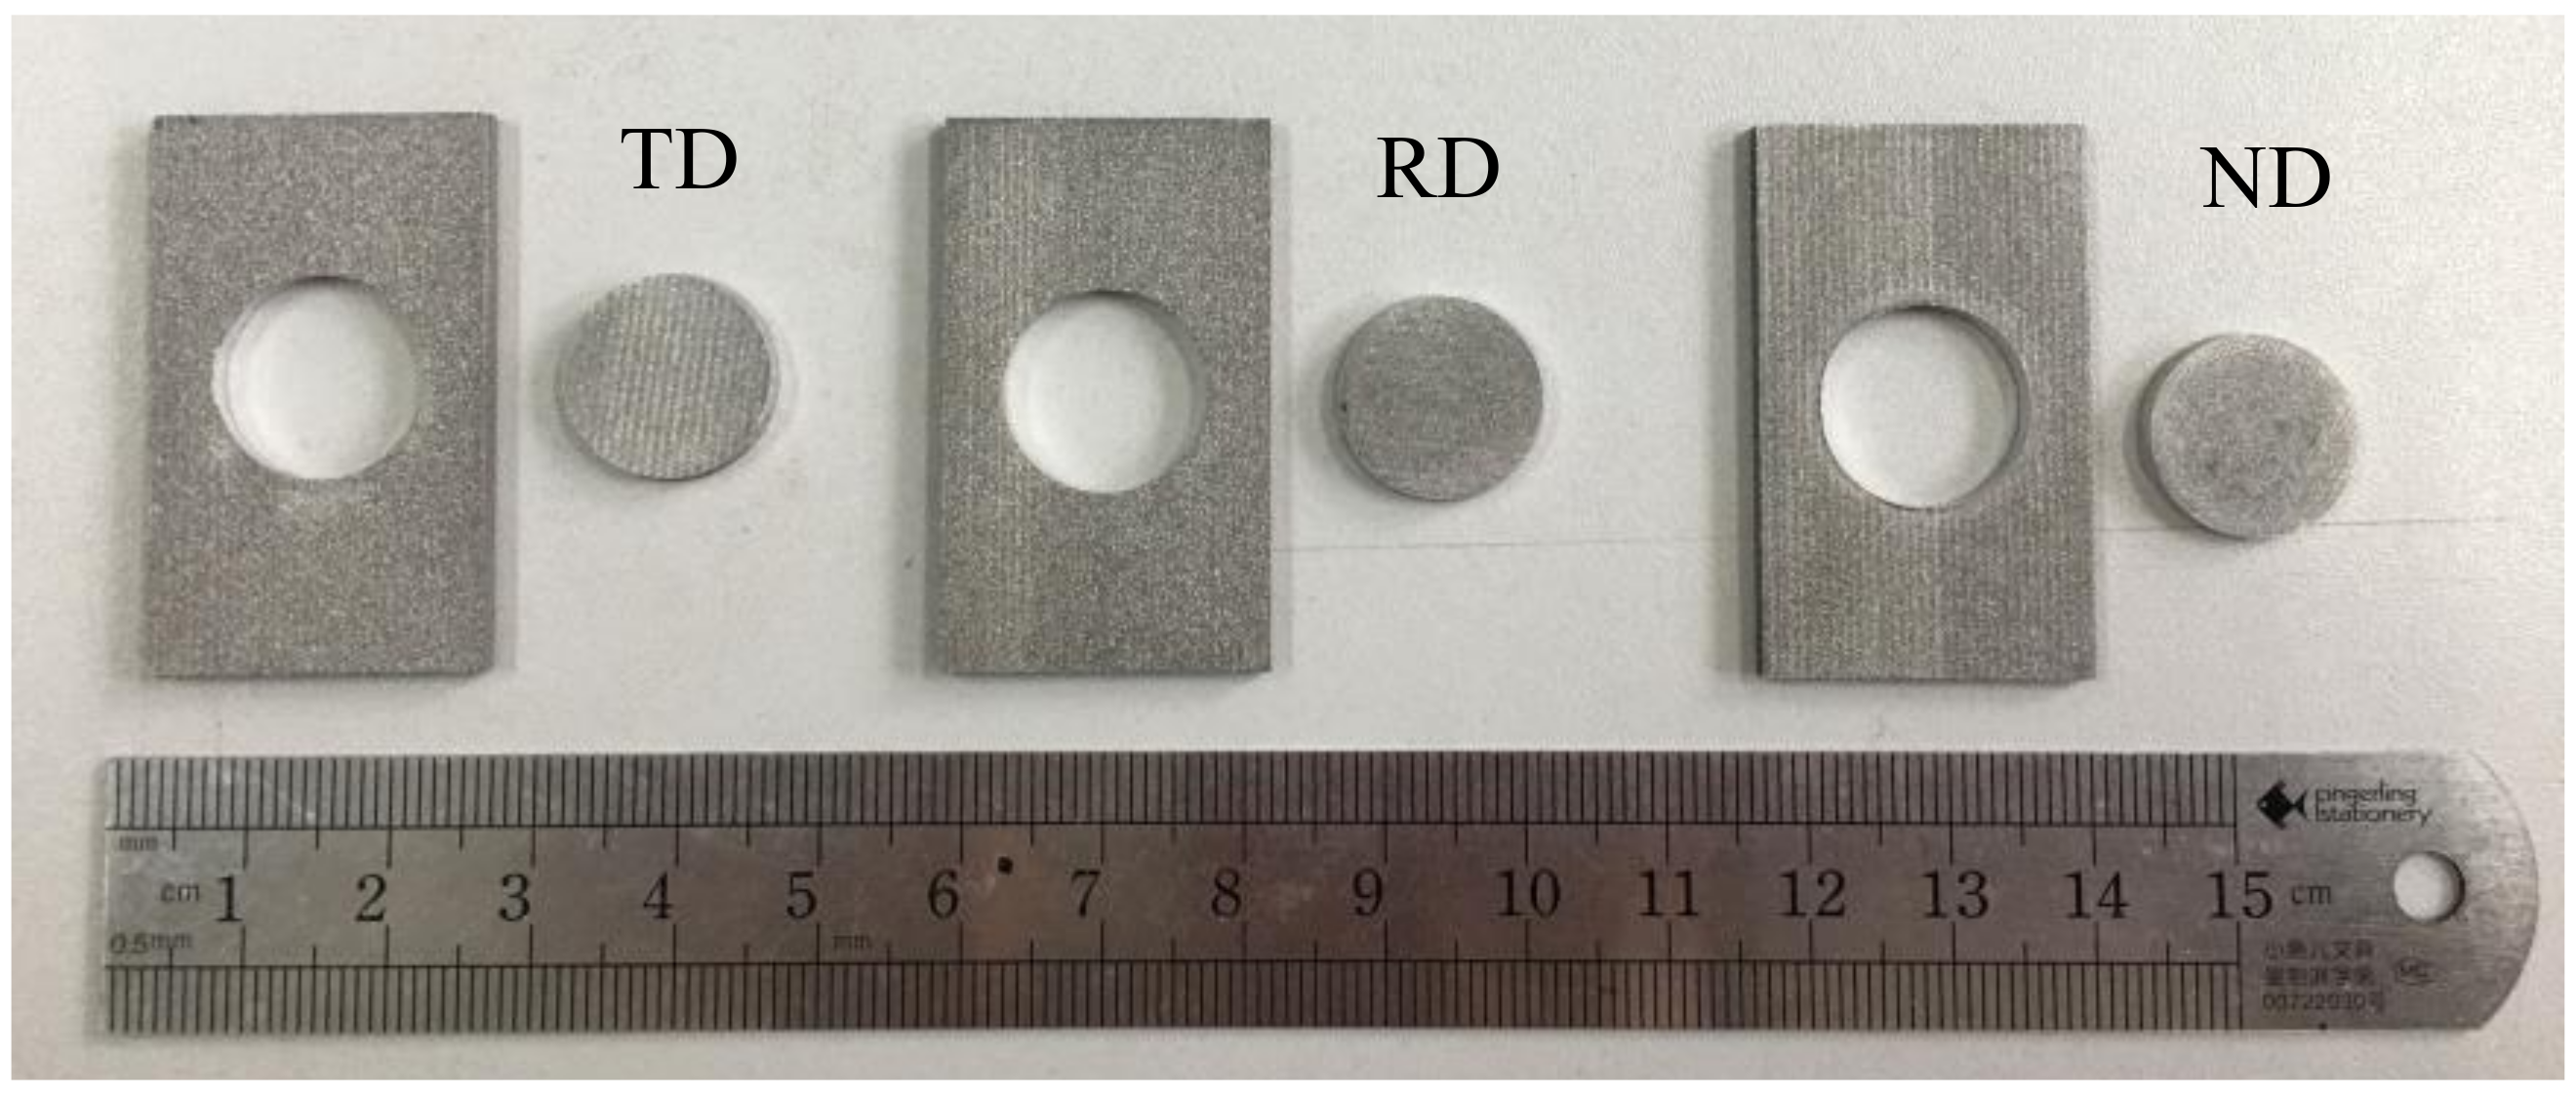
2.1. Experimental Material

The chemical composition of aluminum alloy 7050-T7451 rolling plate is shown in Table 1. The specimens were selected along the rolling direction (RD), transverse direction (TD) and normal direction (ND) of the plate (in the paper, the RD refers to the direction of motion of rolling plate, the TD refers to the direction that parallel to the rolling plate, and the ND refers to the direction that perpendicular to the rolling plate). The selection direction of specimens was as shown in Figure 1. In order to ensure the precision of dynamic shear tests, the requirements for the machining size of dynamic shear specimens were shown in Figure 2. The parallelism between contact surface of impact bar and specimen was 0.01, and the surface roughness was Ra0.8, so as to reduce the effect of friction on contact face during the experimental shear deformation.

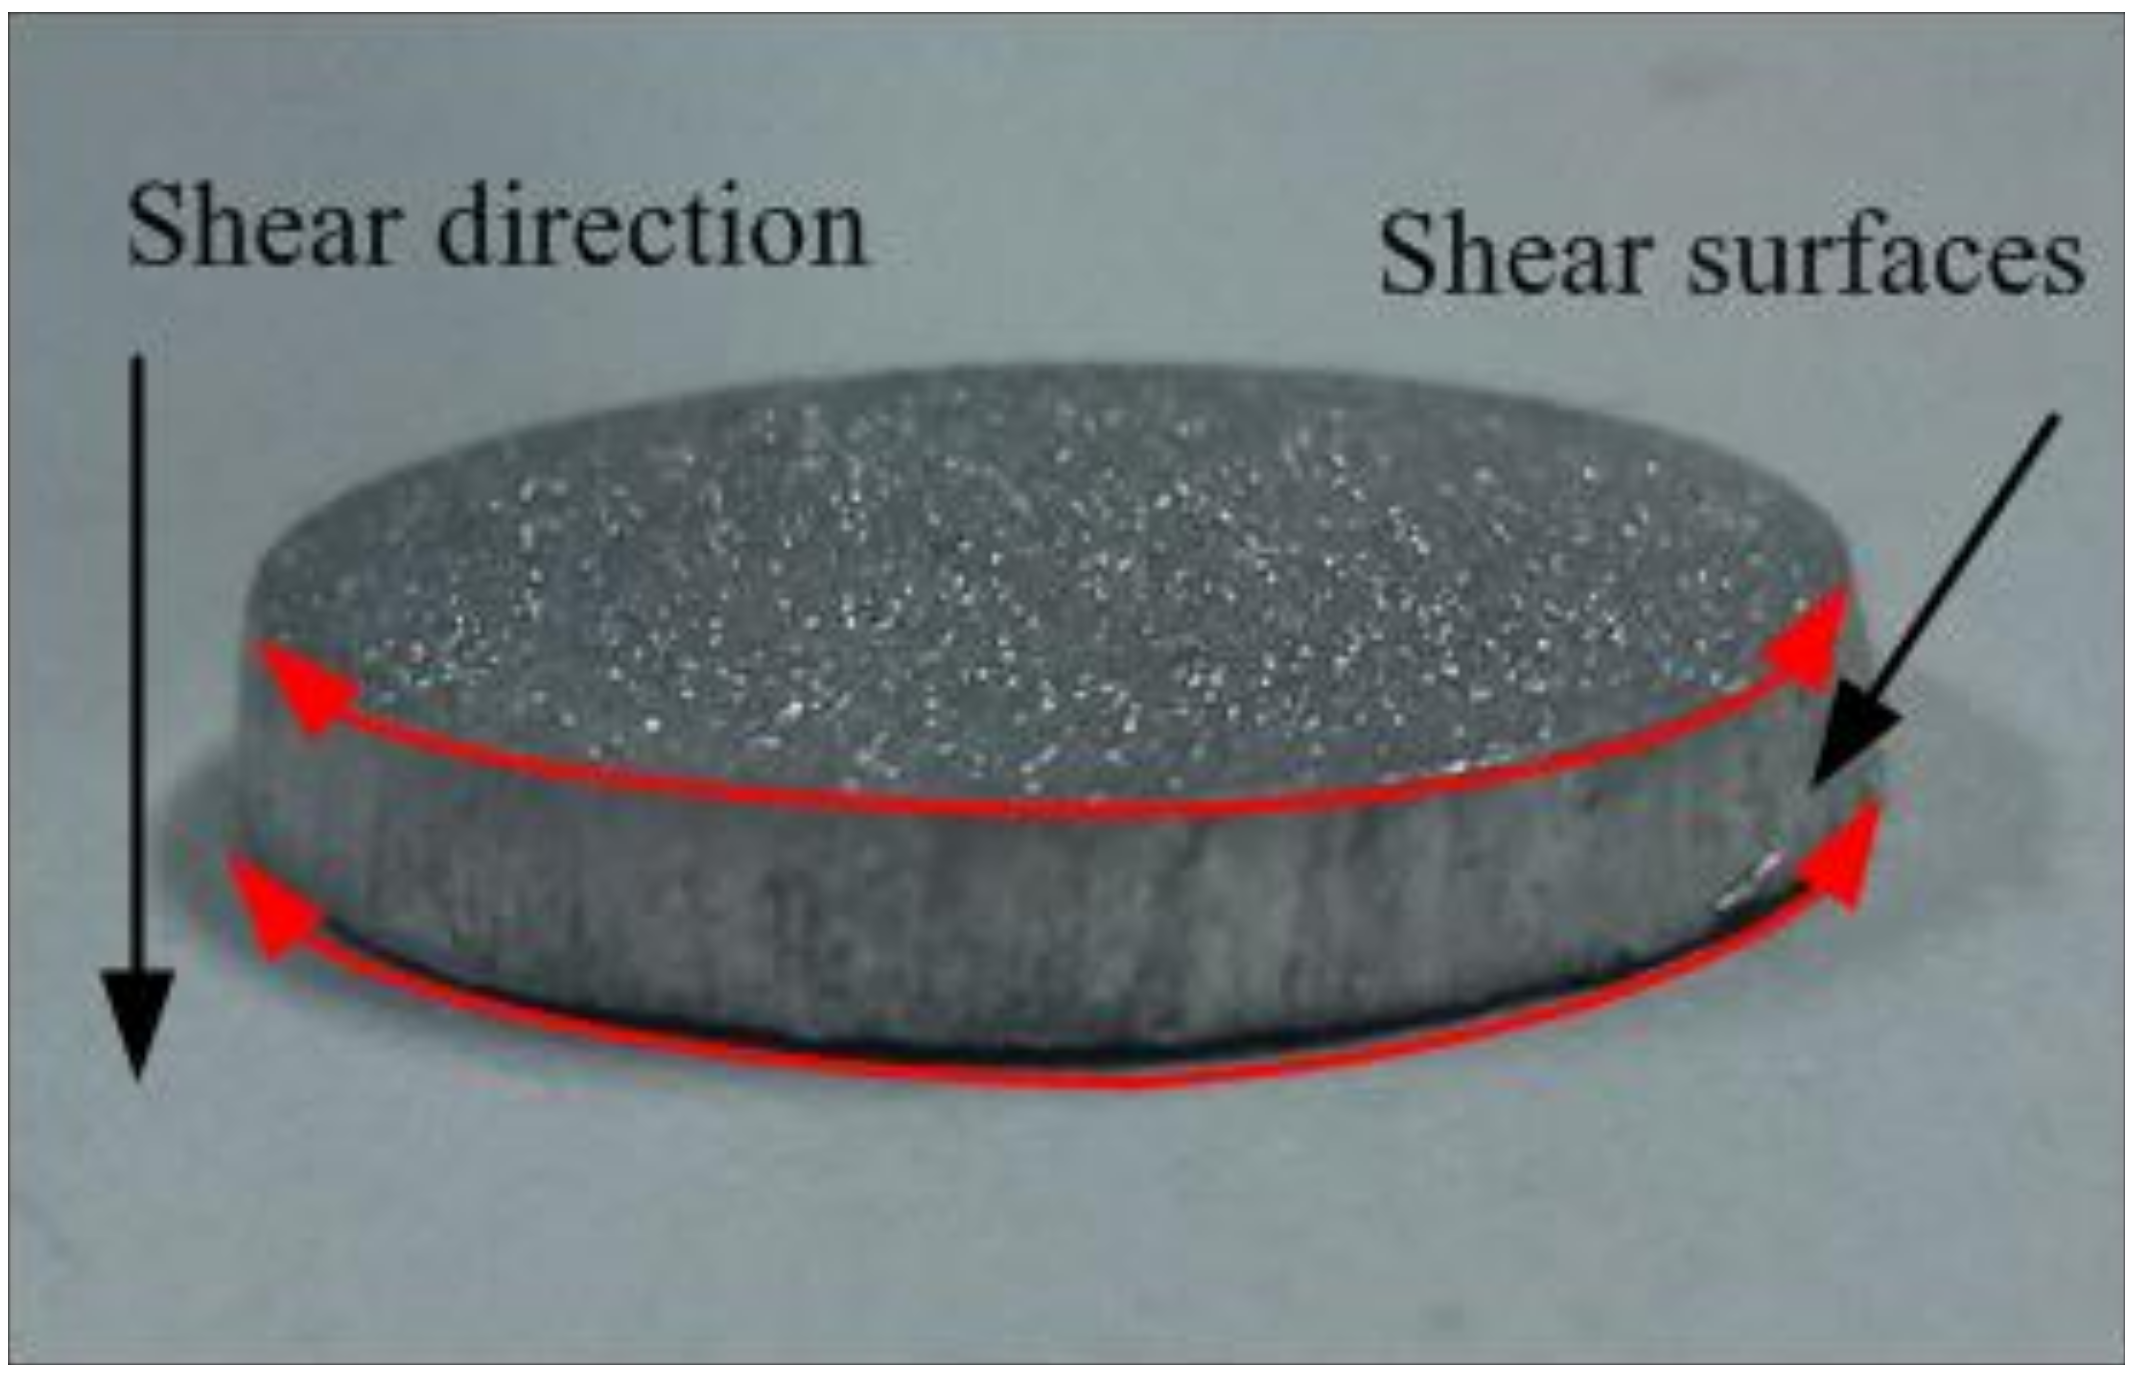
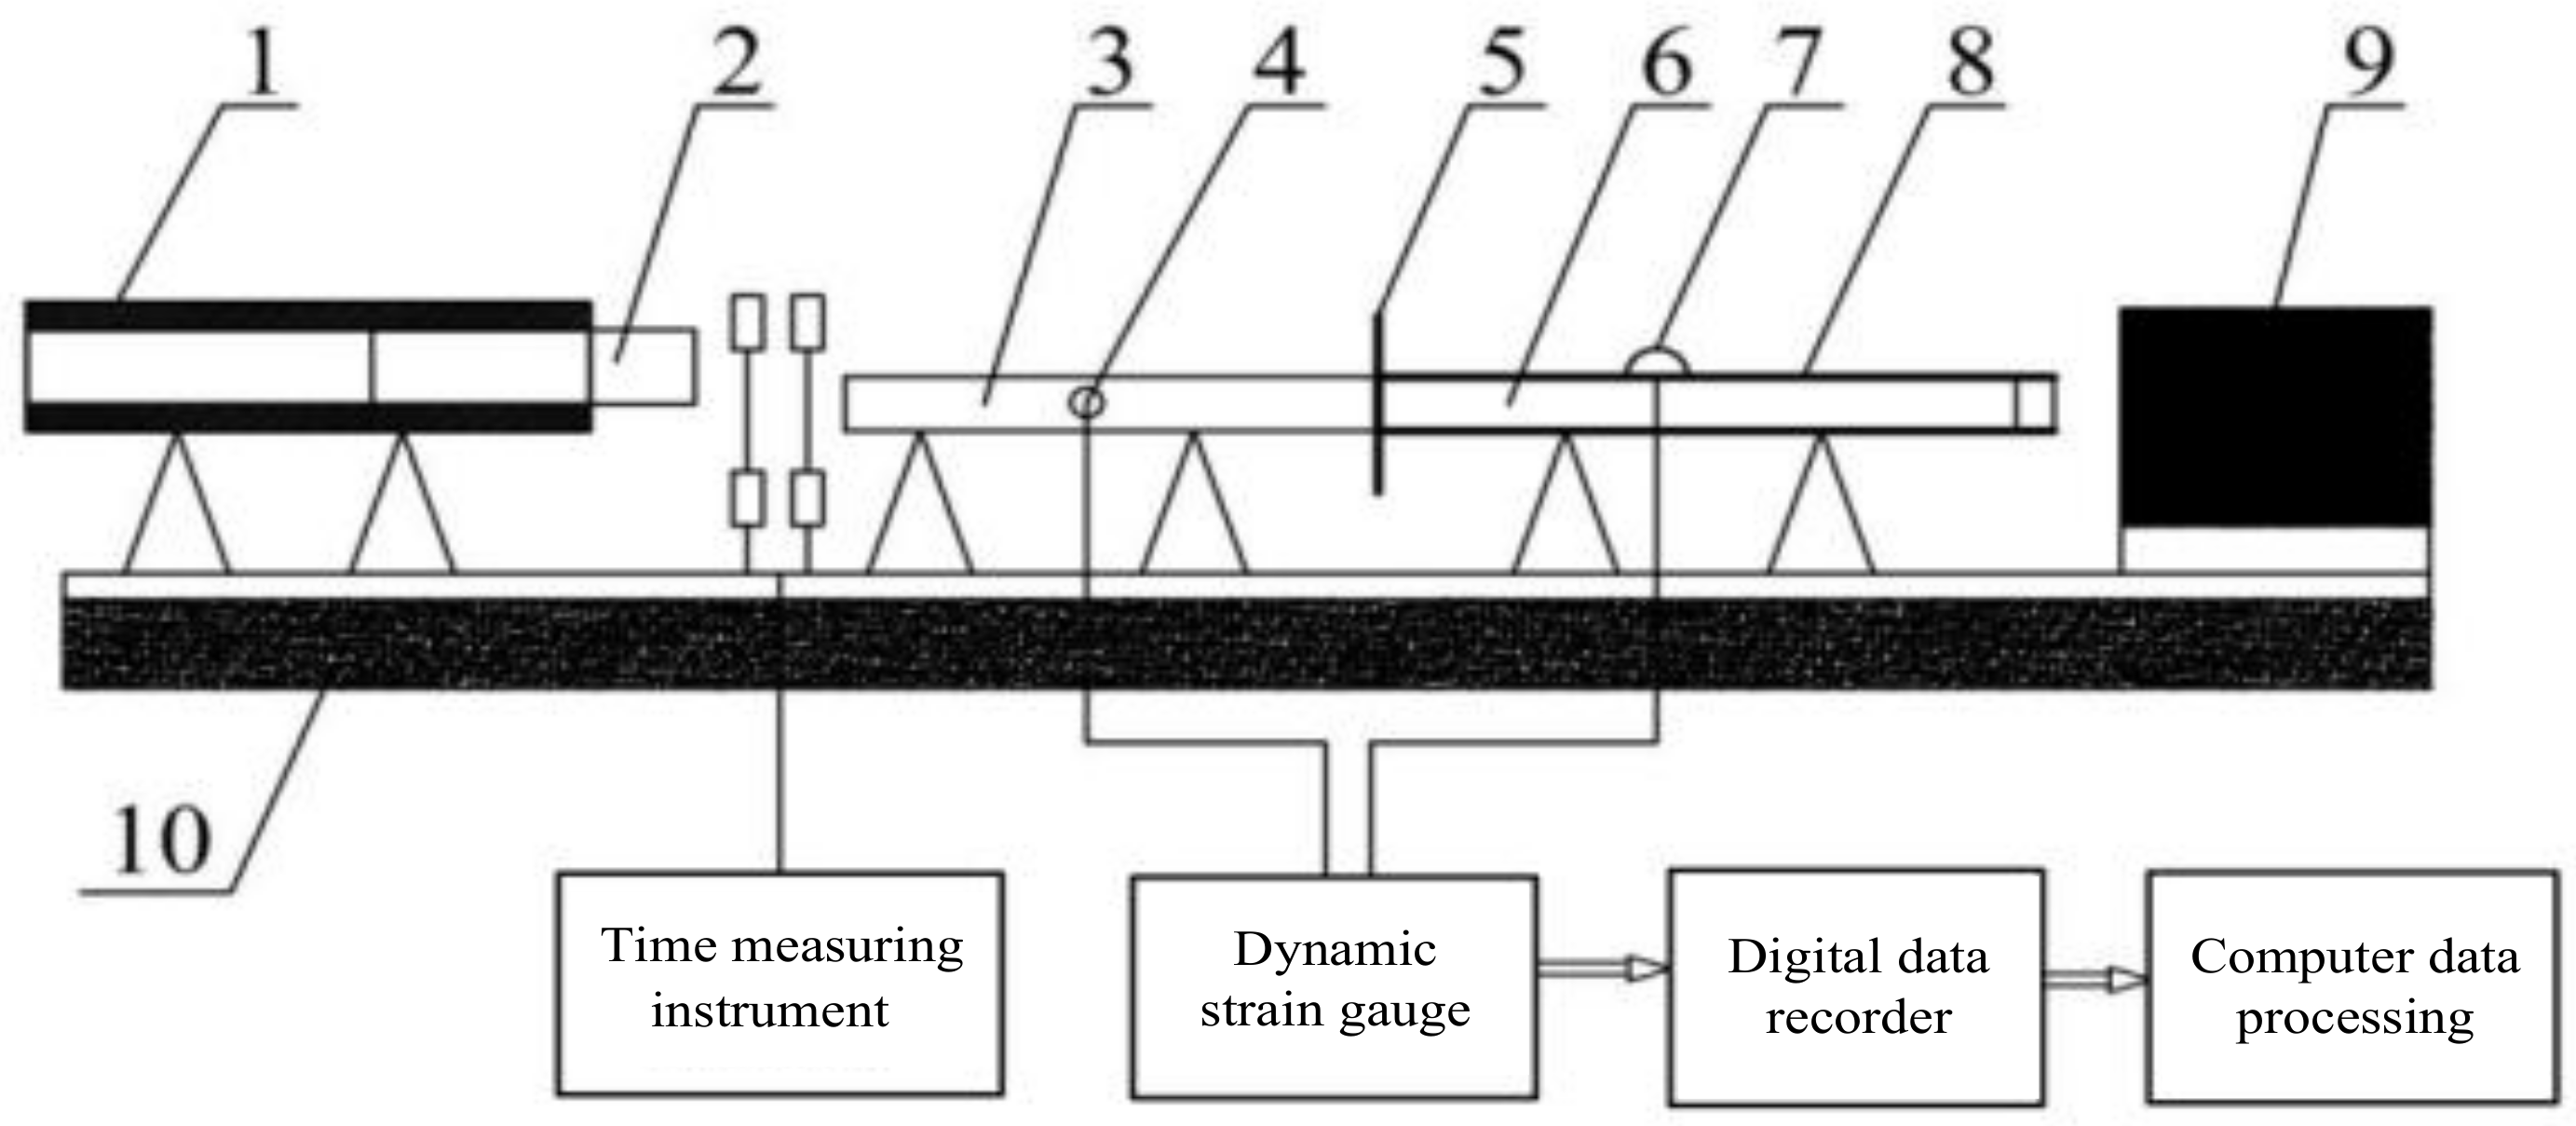
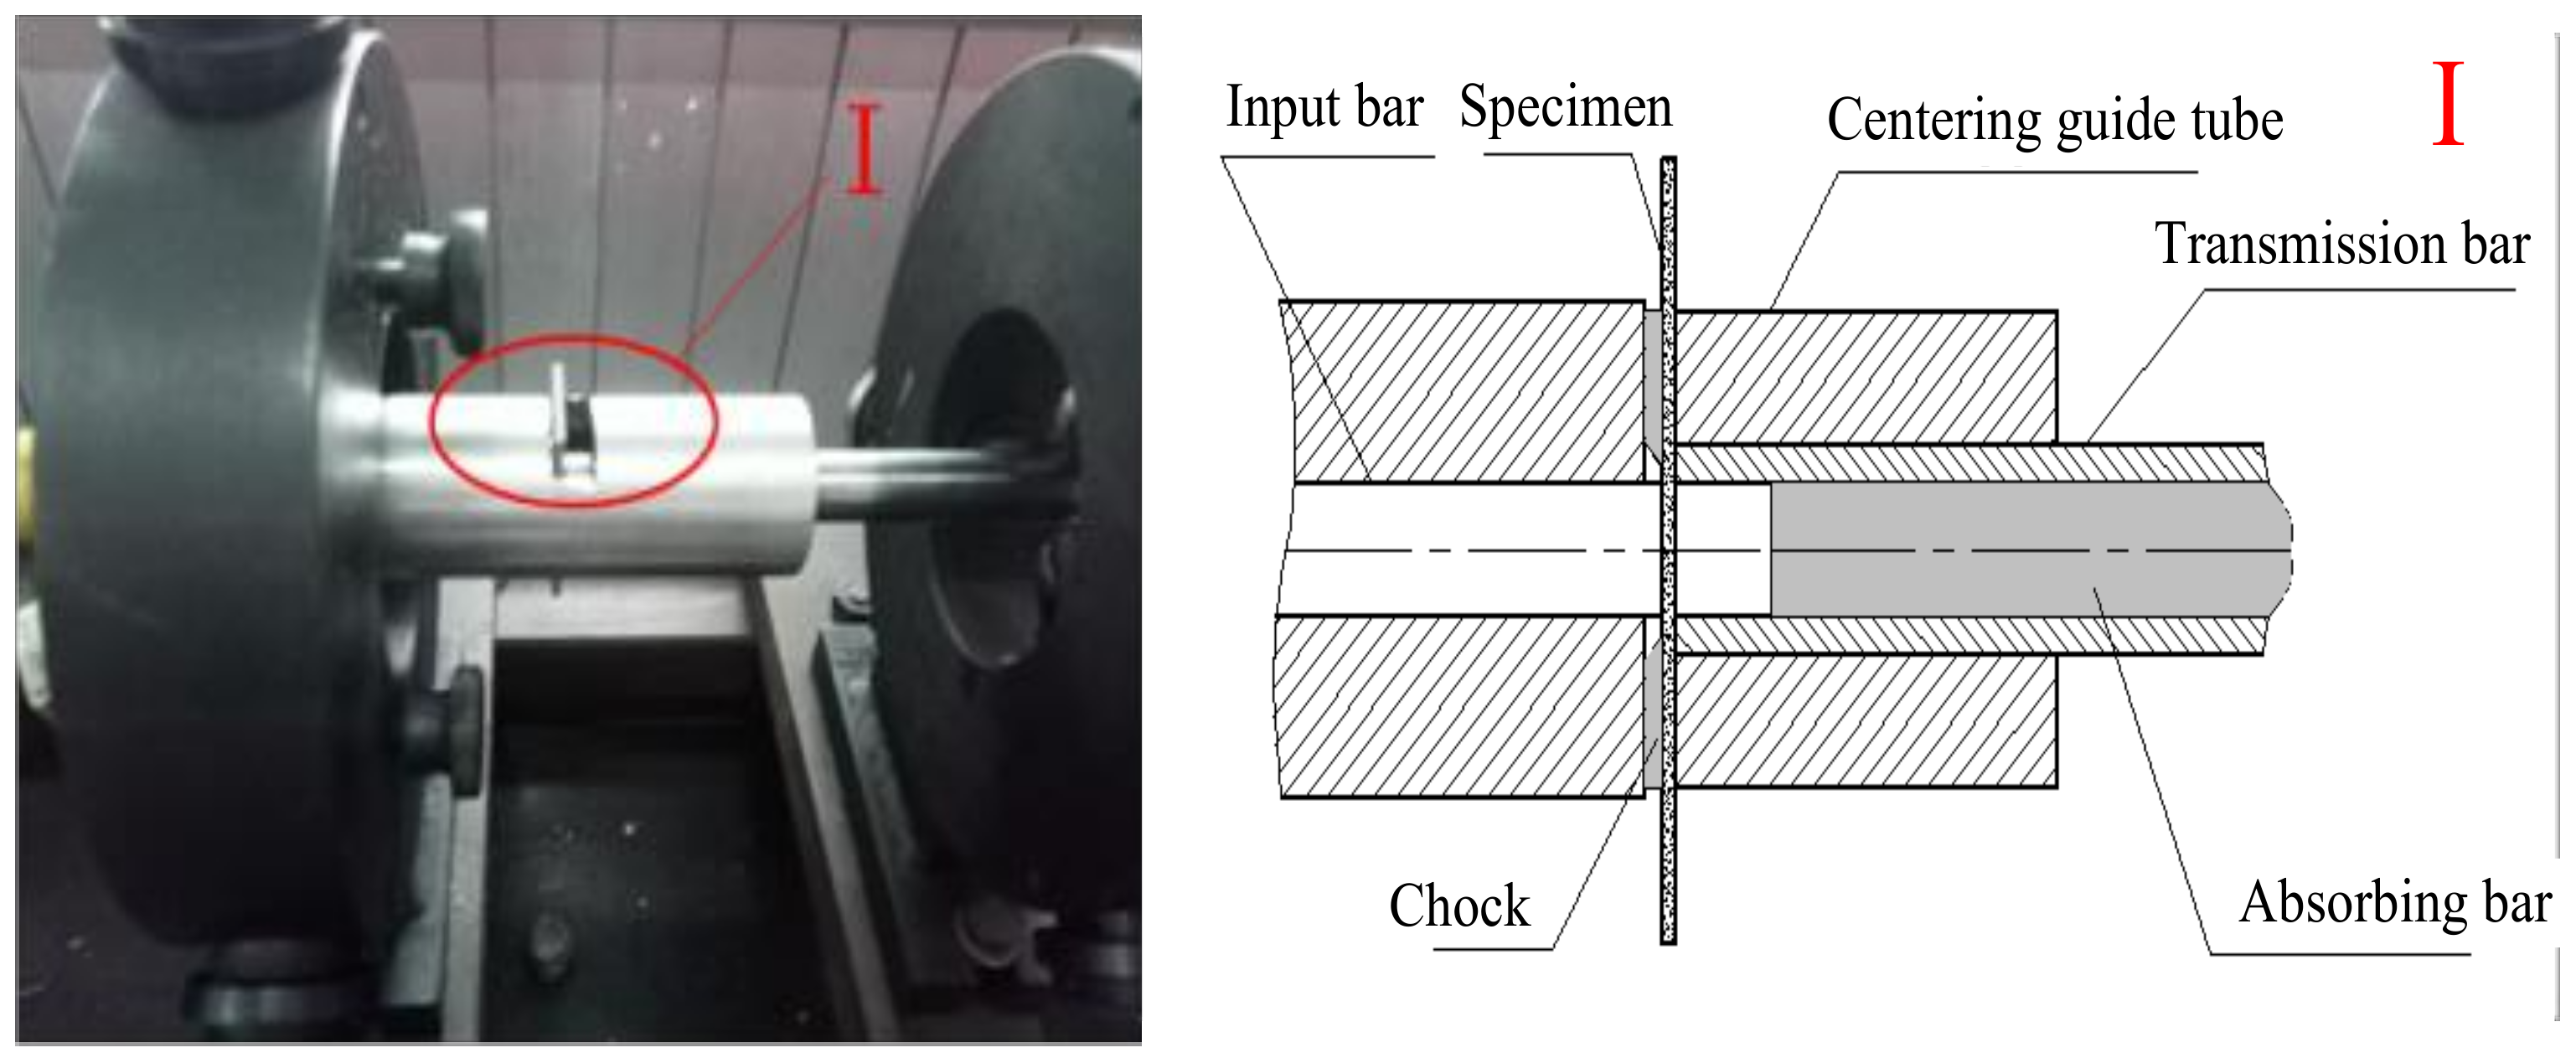
2.2. Experimental Device

The dynamic shear tests were carried out on the SHPB device (Figure 3), and dynamic Bar-Tube shear device was shown in Figure 4. The principle of the tests was as follows: based on the sectional one-dimensional stress wave theory, the impact bar attacks the input bar with a certain speed, and the incident elastic stress waves form and transmit forward in the input bar, the specimen between the input bar and output tube is subjected to dynamic impact loading, then the specimen will be shearing along the thickness direction [13,14].

2.3. Experimental Process and Microstructure Observation

The setting of experimental parameters was shown in Table 2. The dynamic impact shear tests were carried out under different forming directions (RD, TD, ND) and different strain rates (2.5 × 10⁴ s−1, 3.5 × 10⁴ s−1, 4.5 × 10⁴ s−1). In order to ensure the reliability of experimental data and the accuracy of experiment, each experimental parameter was repeated 5 times, and a total of 45 groups were carried out.
Original specimens and impact shear specimens of three directions were cut along the longitudinal surface, the longitudinal section of specimens were ground and mechanically polished, and they were etched by reagents (1 mL HF, 1.5 mL HCL, 2.5 mL HNO3, 95 mL H2O), then the morphology of microstructures was observed by electron backscattered diffraction (EBSD) and SEM after rinsing with water, and wiping with blowing dry by anhydrous ethanol immediately.

3. Results and Discussions

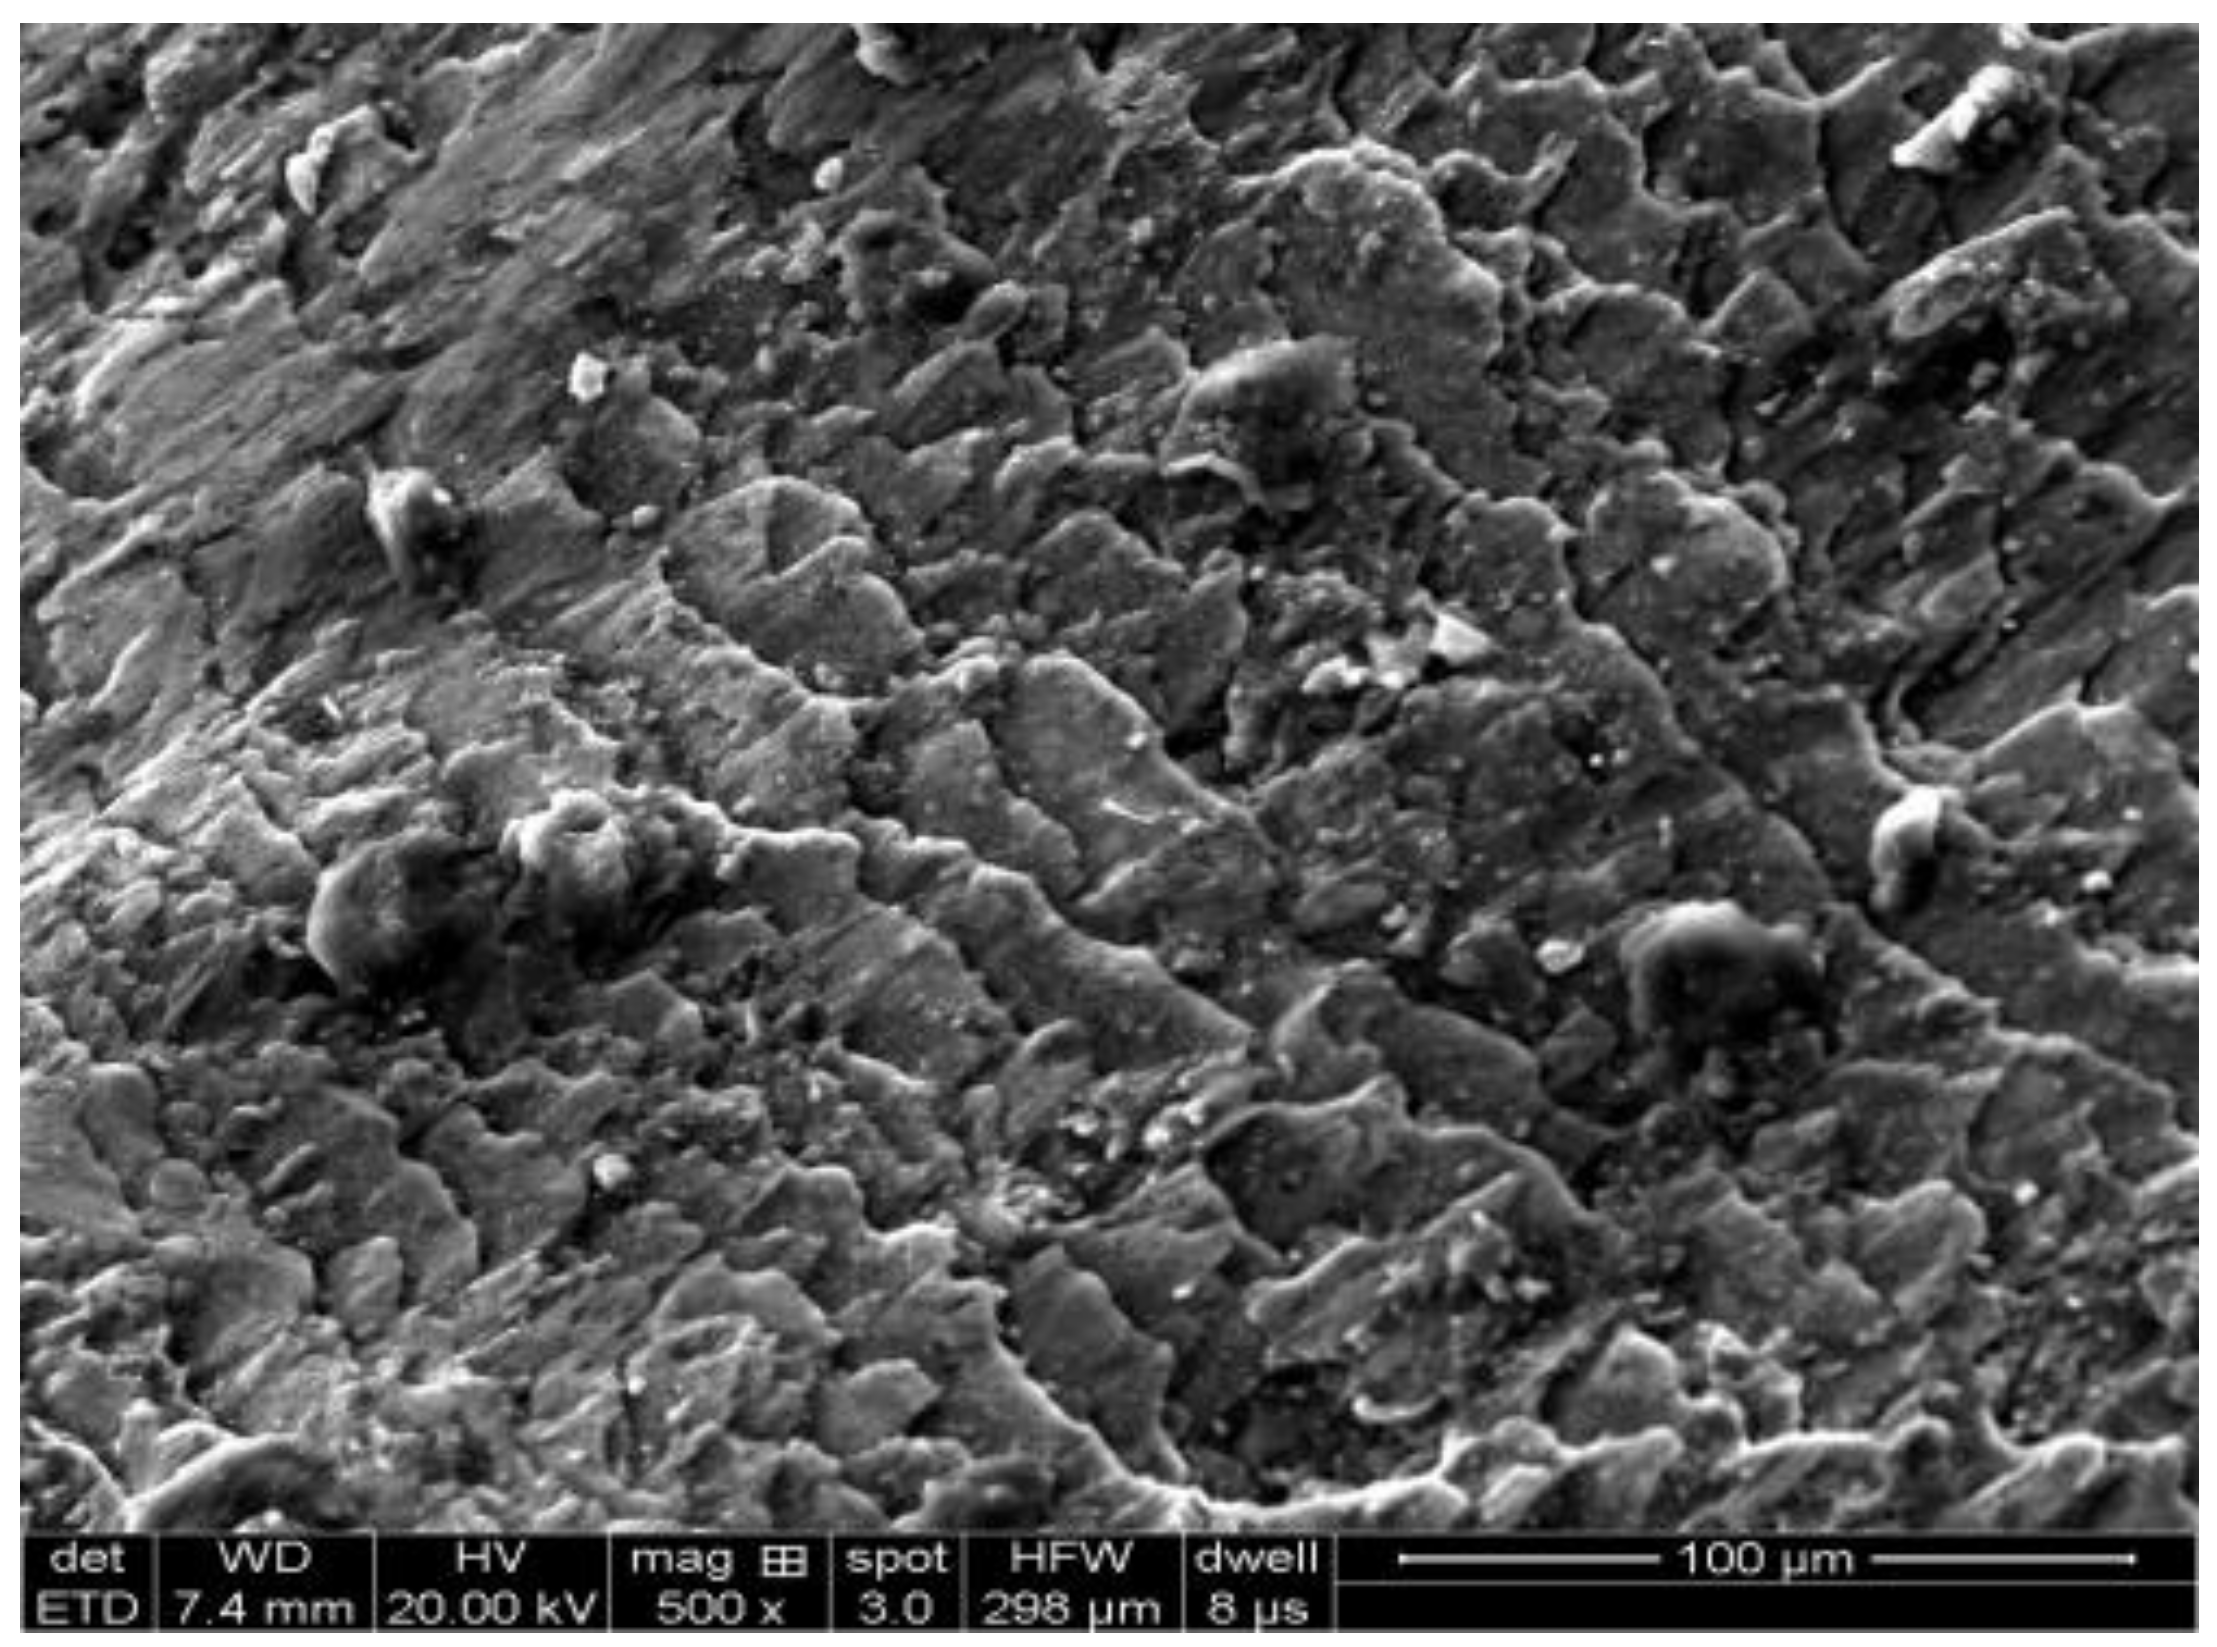
3.1. The Change of Specimens

The photos of specimens after dynamic impact shear under different directions were shown in Figure 5. The specimens of three directions were both cut off in the strain rate range of 2.5 × 10⁴ s−1–4.5 × 10⁴ s−1, which was due to at high strain rate, large amount of heat generated by the plastic deformation from the specimens inside within a short period of time, and it was too late to spread out, then the thermal softening effect was aggravated, which further aggravated the deformation of the material until it was damaged.
As an example in TD, the apparent shear surface can be observed on the cylindrical surface of the flat cylindrical disk which was cut off, as shown in Figure 6. The concentrated plastic deformation occurred in shear surface, and with the deformation increased, the shear stress reached the peak under higher strain and higher strain rate. When the deformation reached a certain level, the shear stress dropped sharply. The shear localization was concentrated to form an extremely narrow adiabatic shear band [15], in which unloading waves will be produced to unload the surrounding materials until fracture failure occurred [16,17]. From Figure 7, it was observed that the shear surface of aluminum alloy 7050-T7451 had an obvious quasicleavage step, which belongs to typical brittle rupture. This phenomenon was very similar to the production process of adiabatic shear zone in the high speed cutting process. Gu et.al [18] had found that the localized fracture of adiabatic shear was the periodic cycle of energy accumulation and release in the primary deformation. With the continuous gathering of energy in the shear band, the shear band released energy in the form of fracture when the energy that the shear band can bear reached the saturation limit, resulting in a complete separation of the sawtooth chips along the shear band.

3.2. The Results of the Stress-Strain Curves

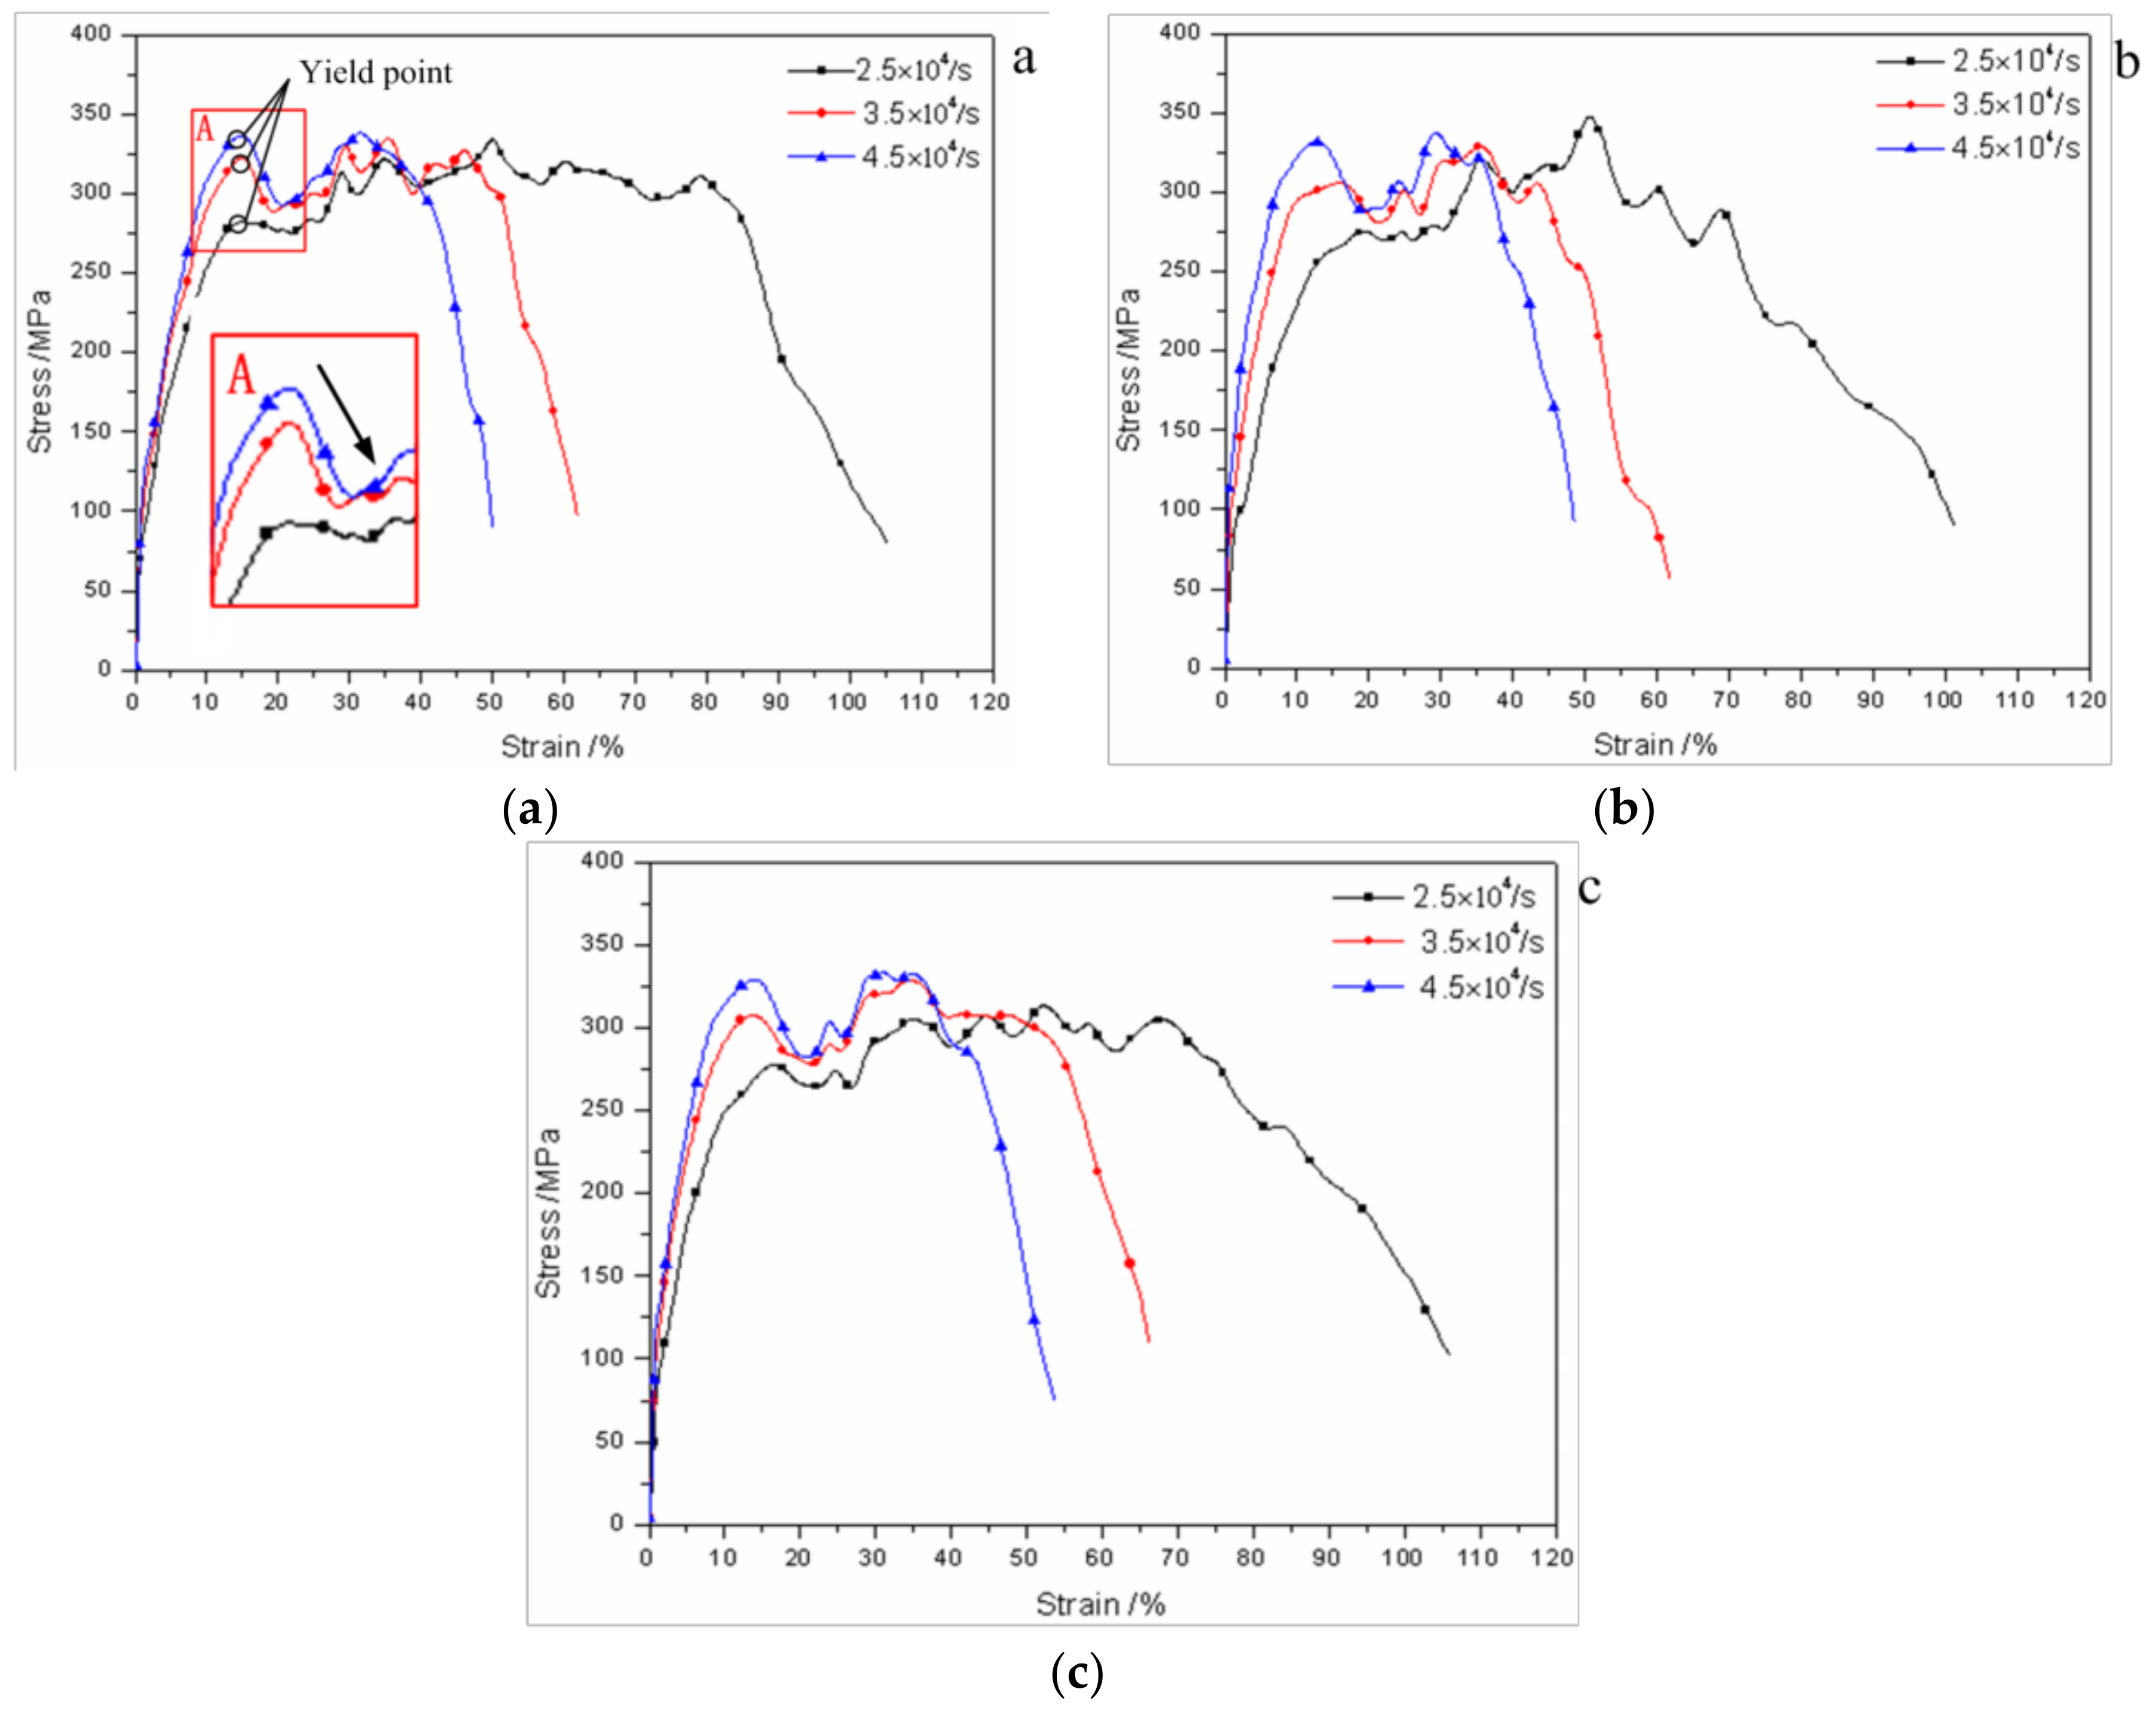
3.2.1. The Influence of Different Strain Rates on Dynamic Impact Shear Properties

The dynamic shear stress-strain curves of aluminum alloy 7050-T7451 in three forming directions at different strain rates were shown in Figure 8. The analysis of Figure 8 showed that the material had experienced roughly three stages of deformation evolution processes:
In the first stage, the shear stress increased with the increase of strain, the first stage belonged to the early stage of elastic deformation, in which the grain structure will produce rotation and deformation in shear zone along the shear direction under the combined action of shear stress and extrusion stress. At this stage of deformation, the shear modulus of material obtained by Figure 8 at different strain rates were shown in Table 3. From Table 3, it can be seen that the shear modulus increased with the increase of strain rate in the same direction, the aluminum alloy 7050-T7451 had obvious strain rate strengthening effect in the stage of elastic deformation.
At A point of Figure 8, compared with quasistatic tests, the shear stress in dynamic shear tests was a bit unstable near the yield point, and the curve tended to be gentle after the end of plastic deformation. The above indicated that the force of material internal structure was balanced after plastic deformation [19]. At point A, when strain rate exceeded 2.5 × 10⁴ s−1, the shear stress decreased in a fixed strain region (10–20%), which indicated that the strain rate within the strain peak range had an enhancement to material [20].
In the second stage, there was no apparent yield platform of material. The shear stress had a wavy change around a fixed value with the increase of strain, which belonged to serrated yielding. The above had shown that the strain strengthening effect of three forming directions in the strain rate range of 2.5 × 10⁴ s−1 − 4.5 × 10⁴ s−1 was not obvious, which was caused by Dynamic Strain Aging (DSA) characteristics of specimens [21], and the result of the interaction between working hardening effect and thermal softening effect caused by adiabatic temperature rise, both as the increase of strain and strain rate.
When strain increased to 40%, the shear stress of different strain rates under the same direction tended to be about 300 MPa, which was because the interaction of thermal softening effect and strain rate strengthening effect canceled each other out at the strain of 40% [2], and the macroscopic performance was that the flow stress was insensitive to strain rate.
In the third stage, the thermal softening effect of material exceeded the sum of strain hardening [22] and strain rate hardening effect, which led to thermal viscoelastic instability and adiabatic shear, then the carrying capacity of specimens was reduced, and the shear failure occurred finally. It was consistent with the previous analysis of the generation of adiabatic shear and the shear failure analysis of material.
In addition, as shown in Figure 8, with the increase of strain rate, the shear stress and yield strength of three forming directions were all rising, which was shown a certain positive strain rate strengthening effect and a certain strain rate sensitivity. The positive strain rate effect can make aluminum alloy 7050-T7451 absorb more energy during dynamic shear deformation process.

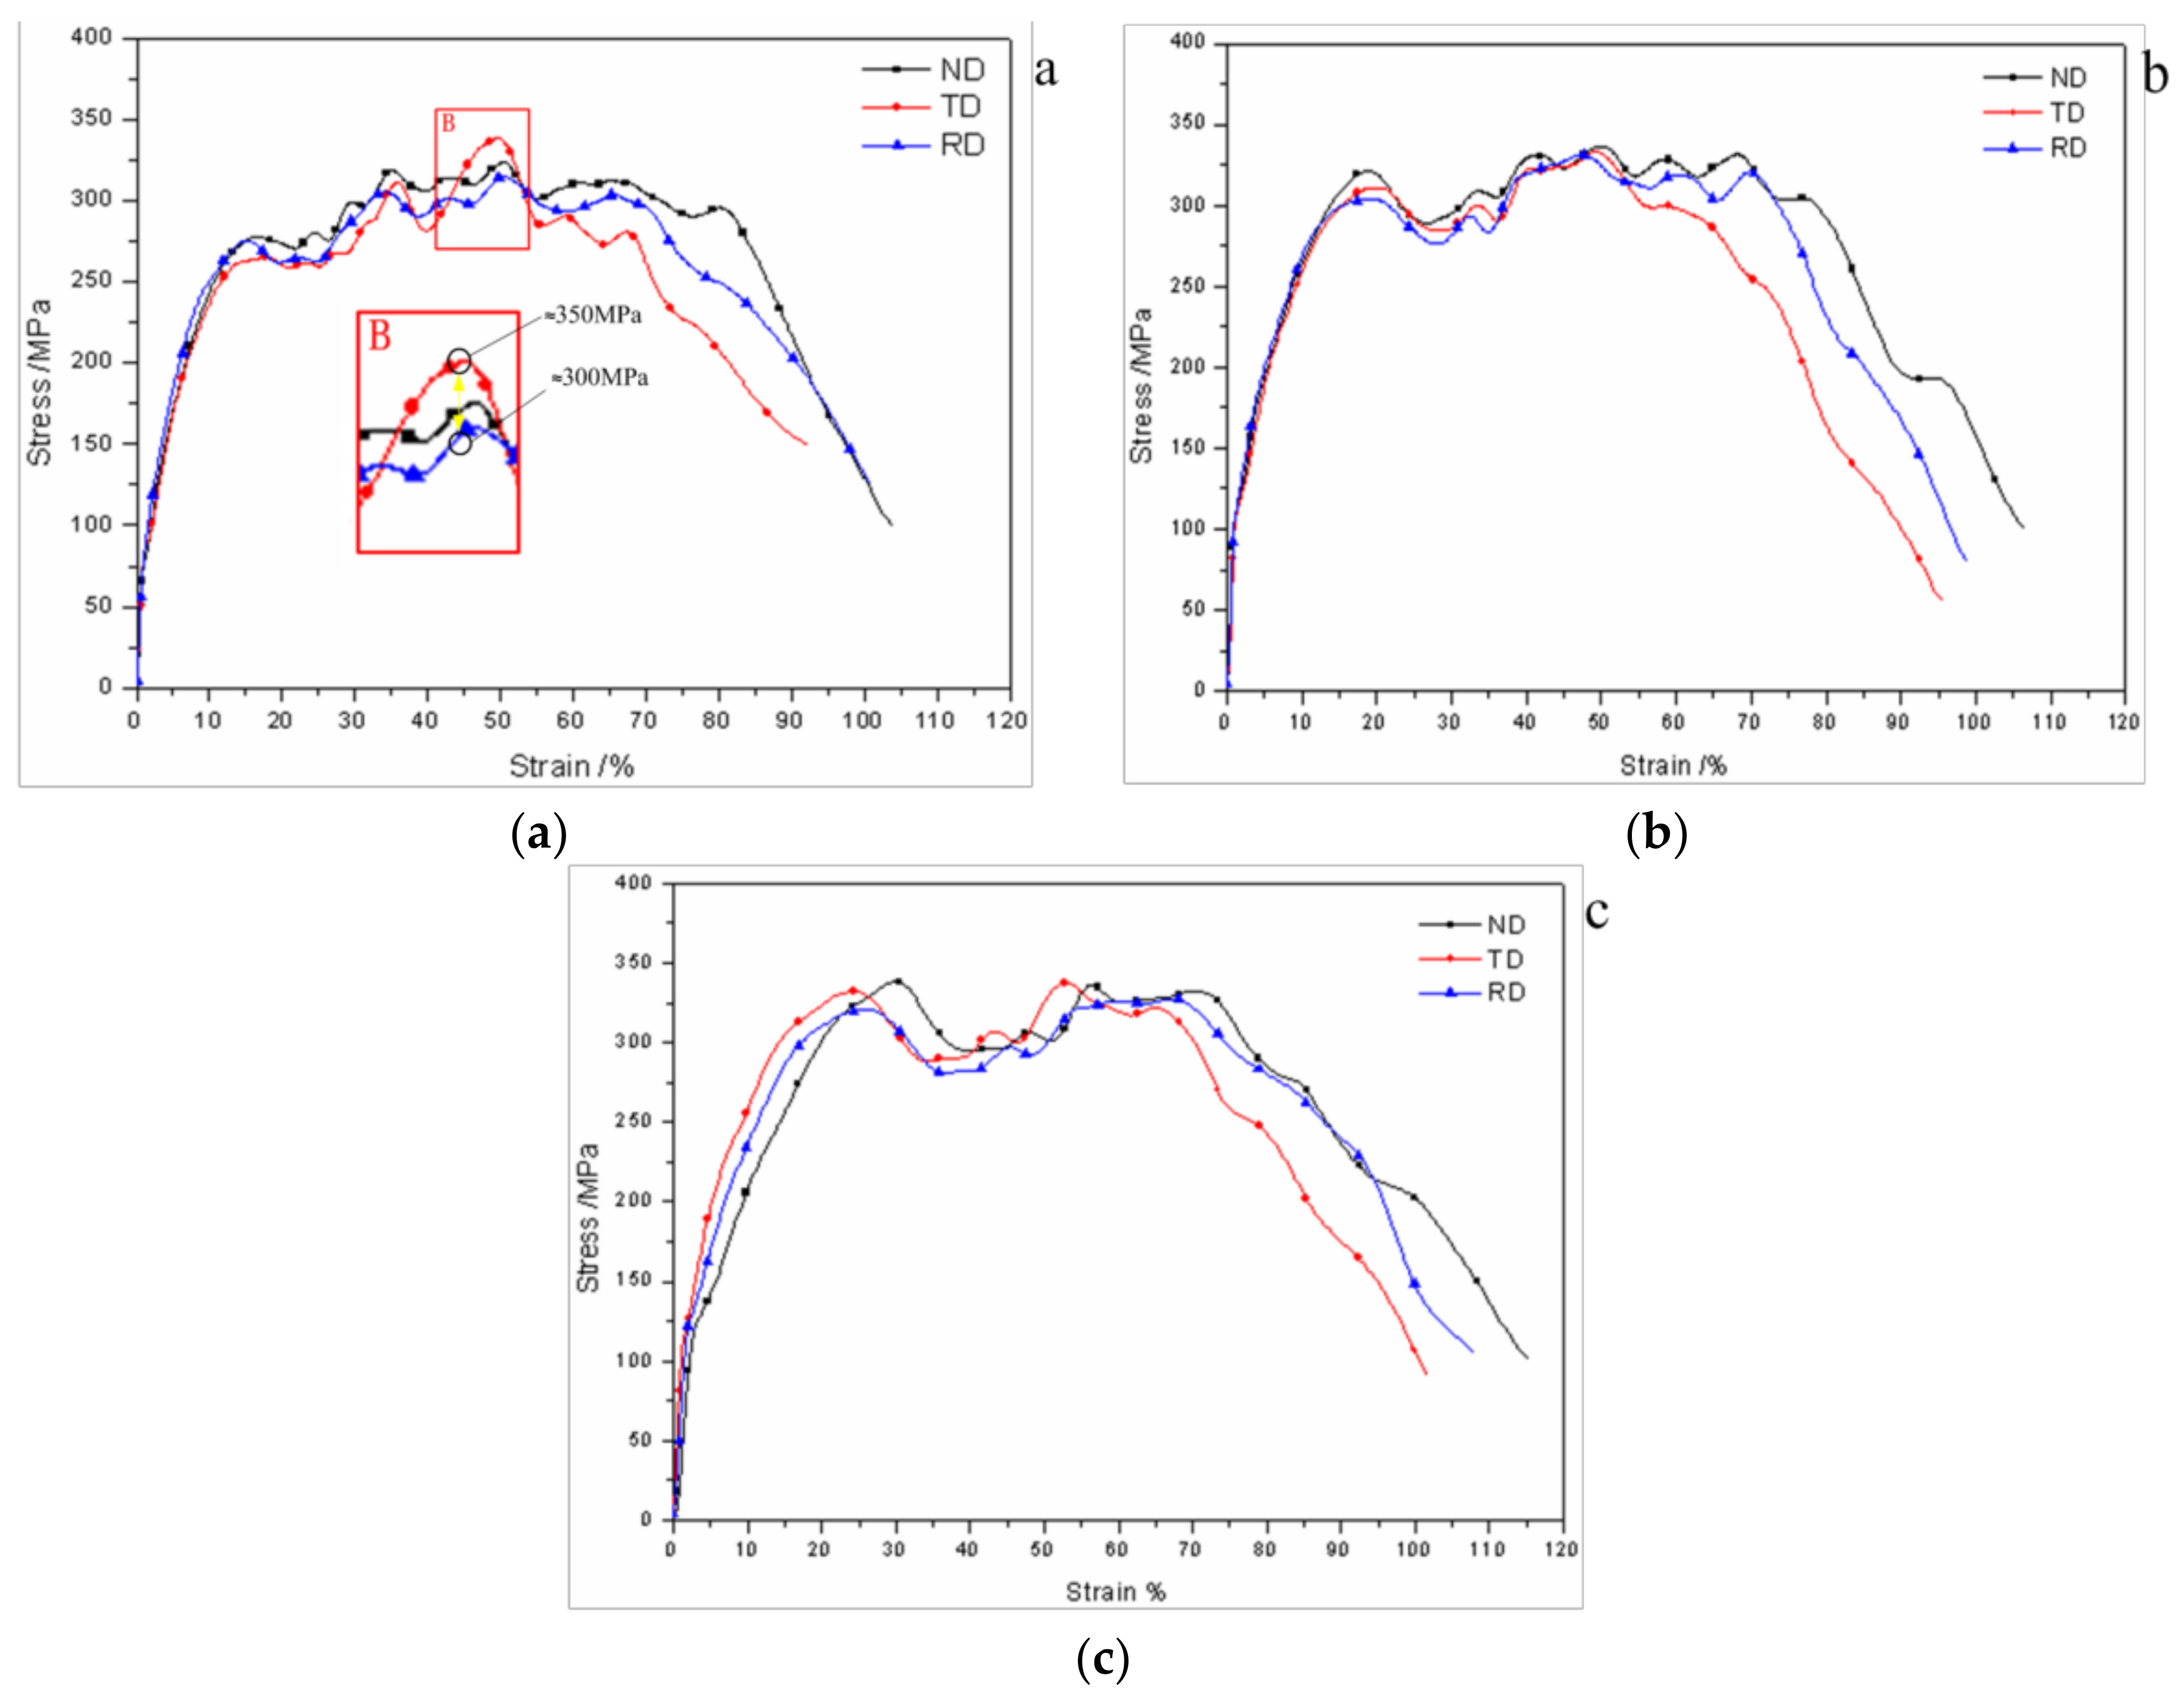
3.2.2. The Influence of Different Forming Directions on Dynamic Impact Shear Properties

The dynamic shear stress-strain curves of aluminum alloy 7050-T7451 in three strain rates at different forming directions were shown in Figure 9. The shear modulus of material obtained by Figure 9 at different directions in the stage of elastic deformation were shown in Table 4. From Table 4, it can be seen that the shear modulus of different directions had little difference when the strain rate was 2.5 × 10⁴ s−1, which showed that the material at this strain rate tended to isotropic in the elastic deformation stage. With the increase of strain rate, that is, the strain rate was greater than 3.5 × 10⁴ s−1, there were significant differences in shear modulus in different directions, which showed that the material at this strain rate range had obvious anisotropy in the elastic deformation stage.
In the stage of plastic deformation, in general, at the strain rate of 2.5 × 10⁴ s−1, the shear stress in ND was the largest, and the shear stress in RD was higher than that in TD. However, when strain was in the interval of 40–60%, the shear stress of TD increased sharply and then decreased, as shown in point B of Figure 9. That was due to the critical deformation of grain in TD was reached in the strain interval of 40–60%, and a large number of dynamic recrystallization and twin phenomenon had occurred [23,24]. This can be confirmed from the results of later microstructural analysis. At point B, the difference value of shear stress between TD and RD was about 50 MPa, which showed a significant difference in dynamic mechanical properties of different directions. At the strain rate of 3.5 × 10⁴ s−1, the difference of shear stress in all directions was not obvious, however, it can still be seen that the shear stress in ND n was the largest, and there was little difference of shear stress between RD and TD. At the strain rate of 4.5 × 10⁴ s−1, the shear stress in ND was the largest, and there was no obvious difference of shear stress between RD and TD. With the increase of strain rate, the difference of shear stress in different directions had decreased, which showed the dynamic mechanical properties tended to isotropic.
One of the noteworthy points in Figure 9 was that, when strain was about 50–55%, the shear stress at the same strain rate tended to be consistent in different directions, which was probably that the same resultant force in the internal structure of three directions under the strain, thus the sensitivity of material to the forming directions was reduced [19]. The strain of TD direction in three directions was the least, which showed a more sensitive characteristic of thermal softening.
The results showed that [25] the main reason for the above results of aluminum alloy 7050-T7451 plate was that the strong plate texture parallel to the rolling plate was formed in the rolling process or other deformations. The preferred orientation, basal slip Schmid value, grain size and misorientation distribution were different in different directions. The microstructure of aluminum alloy 7050-T7451 in different directions, as shown in the following Figures.
The grain size and orientation of ND can be clearly seen from Figure 10. As shown in Figure 10a, there were many deformed grains which were obviously compressed and elongated, and most of them were long axial grain. The direction of grain lengthening was the same as the rolling direction. As shown in Figure 10b,c, with the larger magnification of EBSD and the observation of SEM, the change rule of grain can be seen more clearly, the grain deformation was not uniform, and the distances of each grain decreased in ND and increased in RD. It was also found that some small new grains with large angle grain boundaries were formed along the grain boundary of long axial grain, as shown in the C region of Figure 10b,c. This phenomenon was similar to the results of Zhang et al. [26]. On the one hand, because of the deformation, the small angle dislocation interface was transformed into the large angle dislocation interface to form some new crystals; on the other hand, because of the stress annealing, the larger storage can promote the nucleation in the place where the deformation was especially serious, and the independent and fine recrystallized grain can be formed.
In Figure 11a, the microstructure of RD can be seen. The deformation of grain structure was inhomogeneity, and each grain was coarse which showed flat and non equiaxed shape from Figure 11b. The direction of grain deformation was also the same as the rolling direction, and there was a certain amount of fine recrystallized grains existed in the gap between large grains.
In Figure 12a, the microstructure of TD can be seen; it can be seen that there were obvious coarse grains, and a large number of approximately equiaxed grains were distributed symmetrically on both sides of the coarse grains, and the size of the equiaxed grains was as not equal. From Figure 12b, it can be seen that a certain little grains were embedded in the interior of large grains.
From Figure 10 and Figure 11, it can be seen that the grain structure had a certain preferential orientation along the direction of plate rolling (i.e., RD); this was due to the slip system which was easy to move inside was the first deformation during the rolling process of aluminum alloy 7050-T7451. And at the same time, the surrounding grains acted as coordinative deformation under the action of external force and gradually moved towards the direction of easy sliding of the slipping system, which led to preferential distribution of grain orientation [27].
Then, the direction of the two most significant differences on dynamic shear mechanical properties of the specimens, that is, ND and TD, the microstructures of the specimens in the two directions at different strain rates after impact shear are shown in Figure 13 and Figure 14.
In Figure 13 and Figure 14 it can be seen that with the increase of strain rate, the deformation extent of grains was both aggravated in ND and TD. The proportion of large angle grain boundary was decreased, and the proportion of small angle grain boundary was increased, which was due to the shear deformation leading to the grains division. As shown in Figure 13c and Figure 14c, when the strain rate was 4.5 × 10⁴ s−1, the small angle grain boundary had a large proportion, indicating that the grains division was more serious and the material had been recrystallized. Also, it can be seen that the deformation of each grain structure was not uniform. The deformation mechanism of aluminum alloy 7050-T7451 was twinning and sliding together under high speed dynamic impact. In the first stage, the deformation was dominated by twins, and the second stage of deformation was dominated by slippage after the twins were consumed [28]. The twin will selectively appear in the grain of favorable orientation during plastic deformation, and twin grain boundaries can reduce the average free path of dislocation and play a hardening role after the formation of twin grain. At the same time, the long axial grain shaped the total area of grain boundary area became larger, the dislocation barrier became more and the need to coordinate with different grain orientation became more, made the metal deformation resistance enhancement [29].
Therefore, combined with Figure 10 and Figure 14, the specimens in ND and RD of aluminum alloy 7050-T7451 were more prone to shear fracture failure, and the dynamic shear mechanical properties in ND and RD of aluminum alloy 7050-T7451 were better than that in TD.

4. Conclusions

(1)
At the same forming direction, the dynamic shear stress-strain curves of aluminum alloy 7050-T7451 were mainly divided into three deformation stages at different strain rates, the material showed a certain strain rate sensitivity and a positive strain rate strengthening effect, and the strain strengthening effect was not obvious;
(2)
At the strain rate range of 2.5 × 10⁴ s−1–4.5 × 10⁴ s−1, it had a significant difference in the dynamic shear mechanical properties of the material at different forming directions. The shear stress in ND was the largest, followed by that in RD, and the lowest was that in TD, and the strain of TD showed a more sensitive characteristic of thermal softening.
(3)
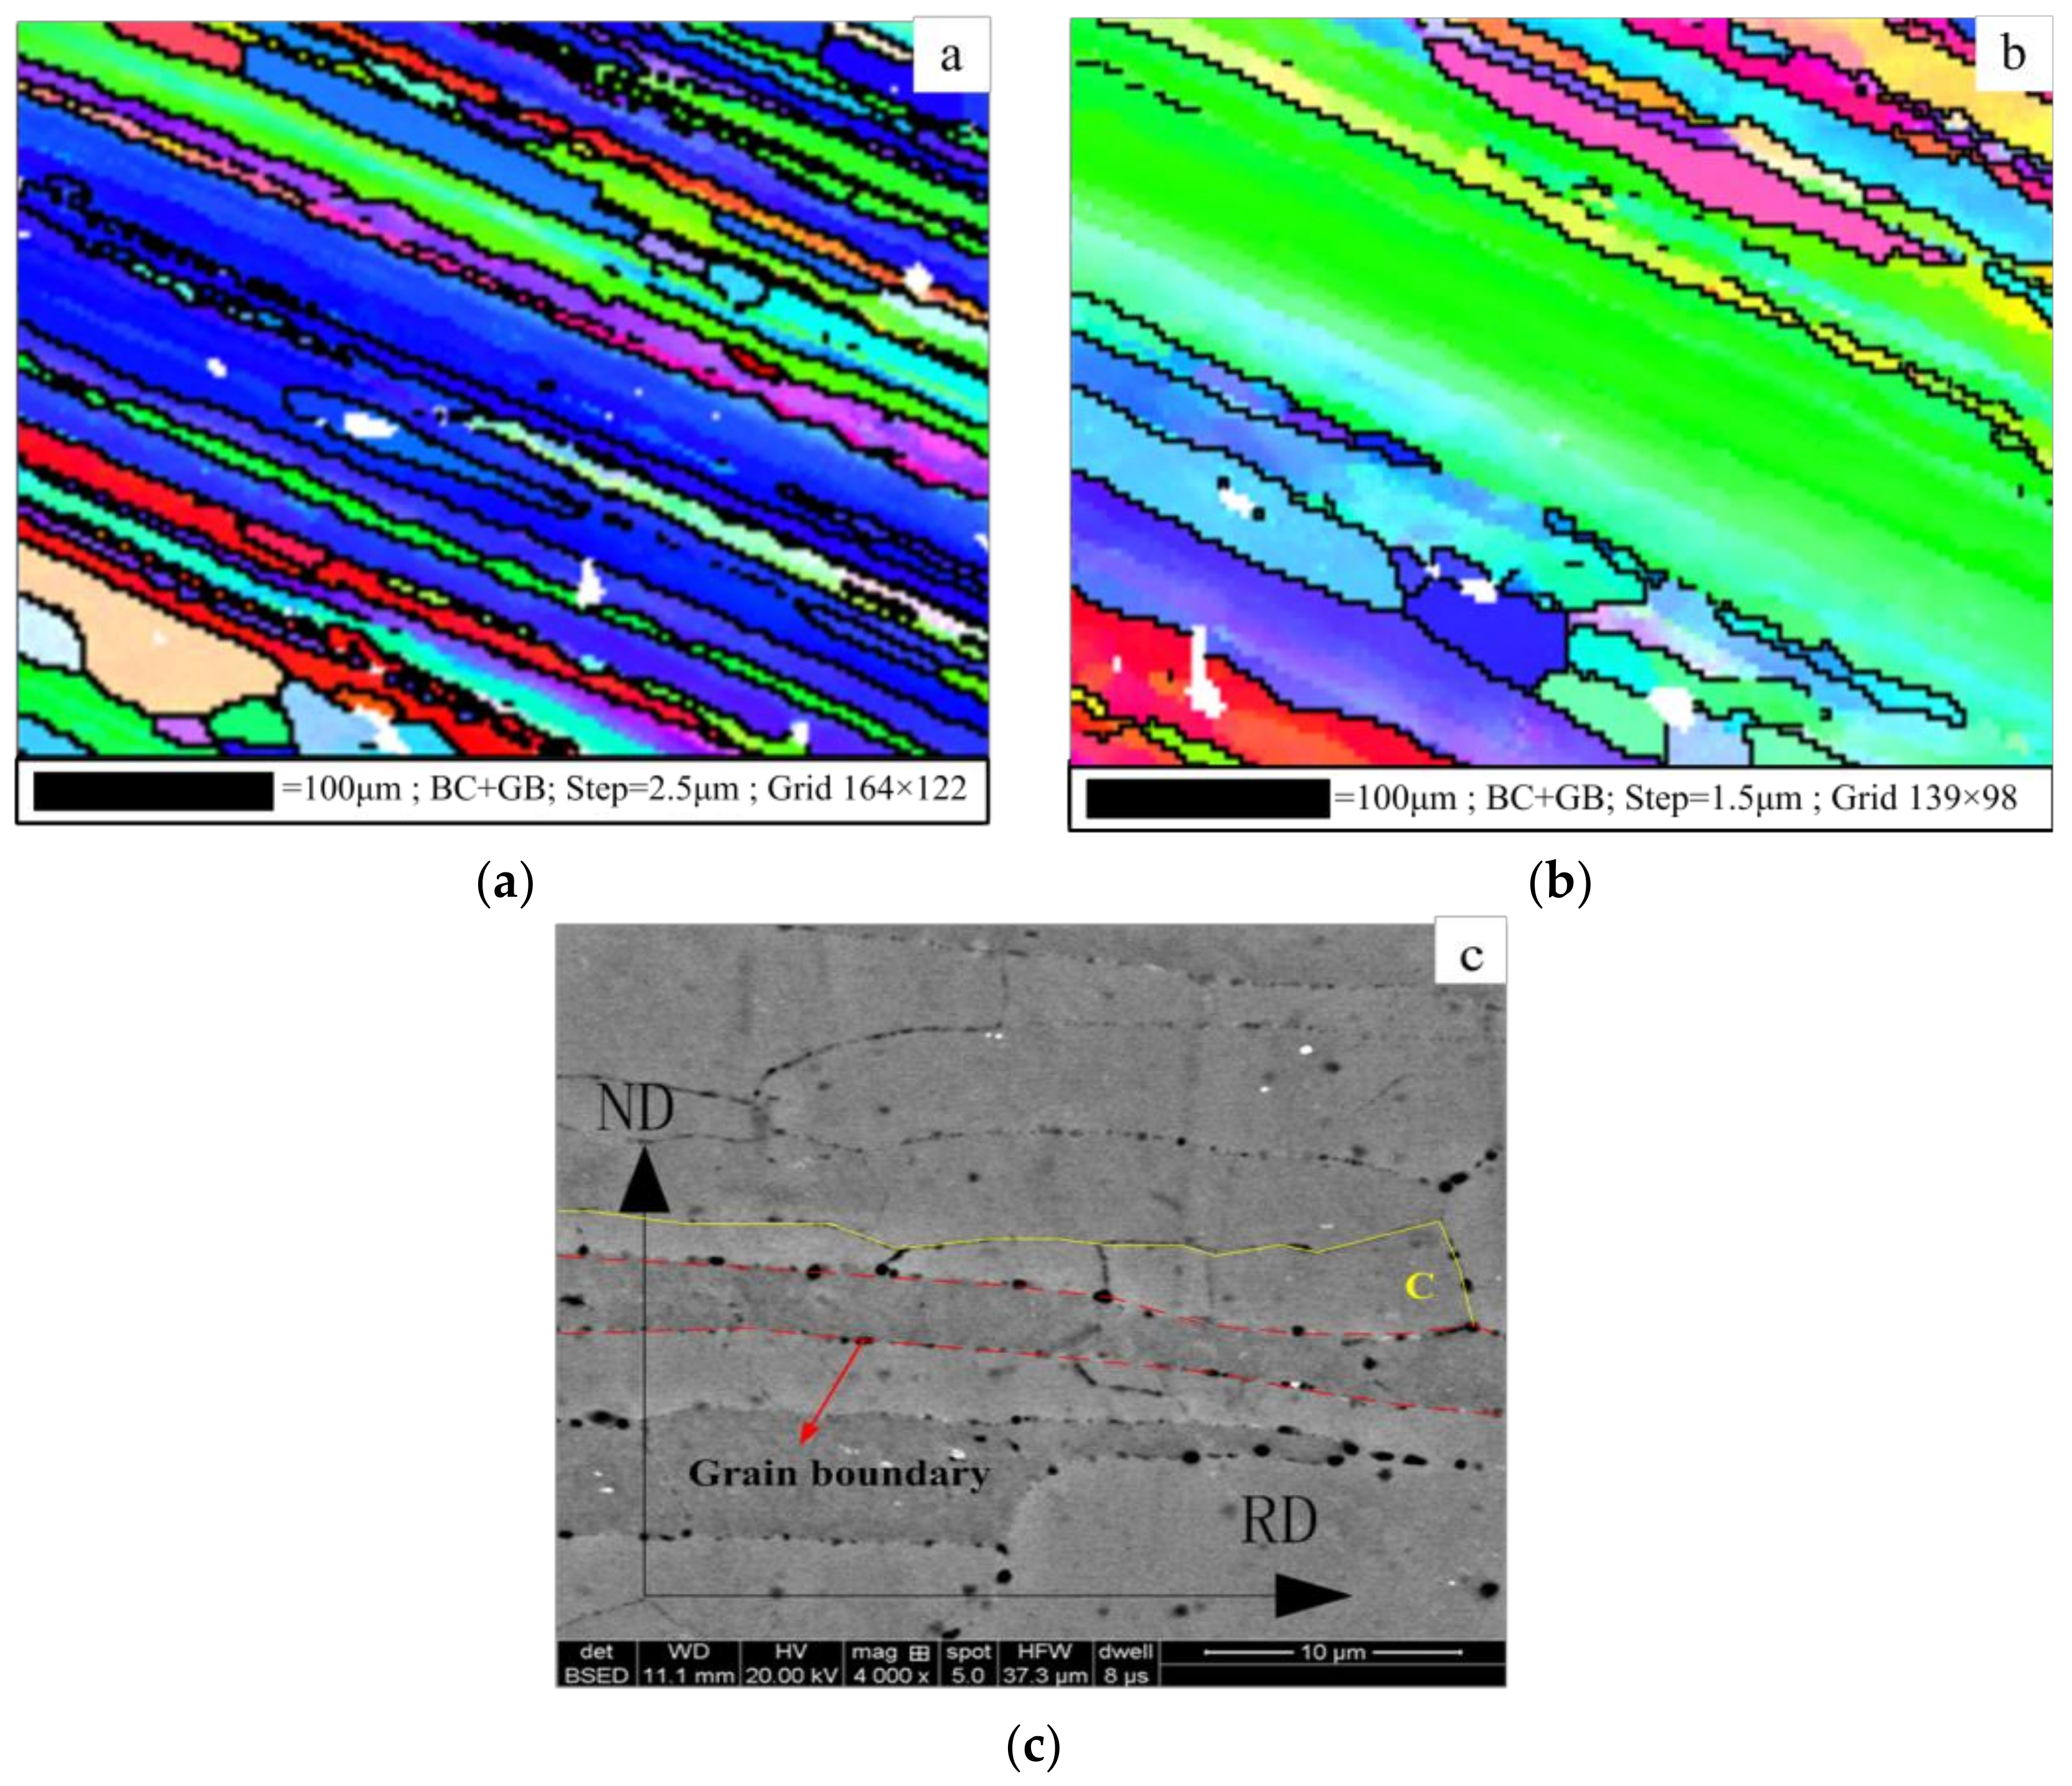
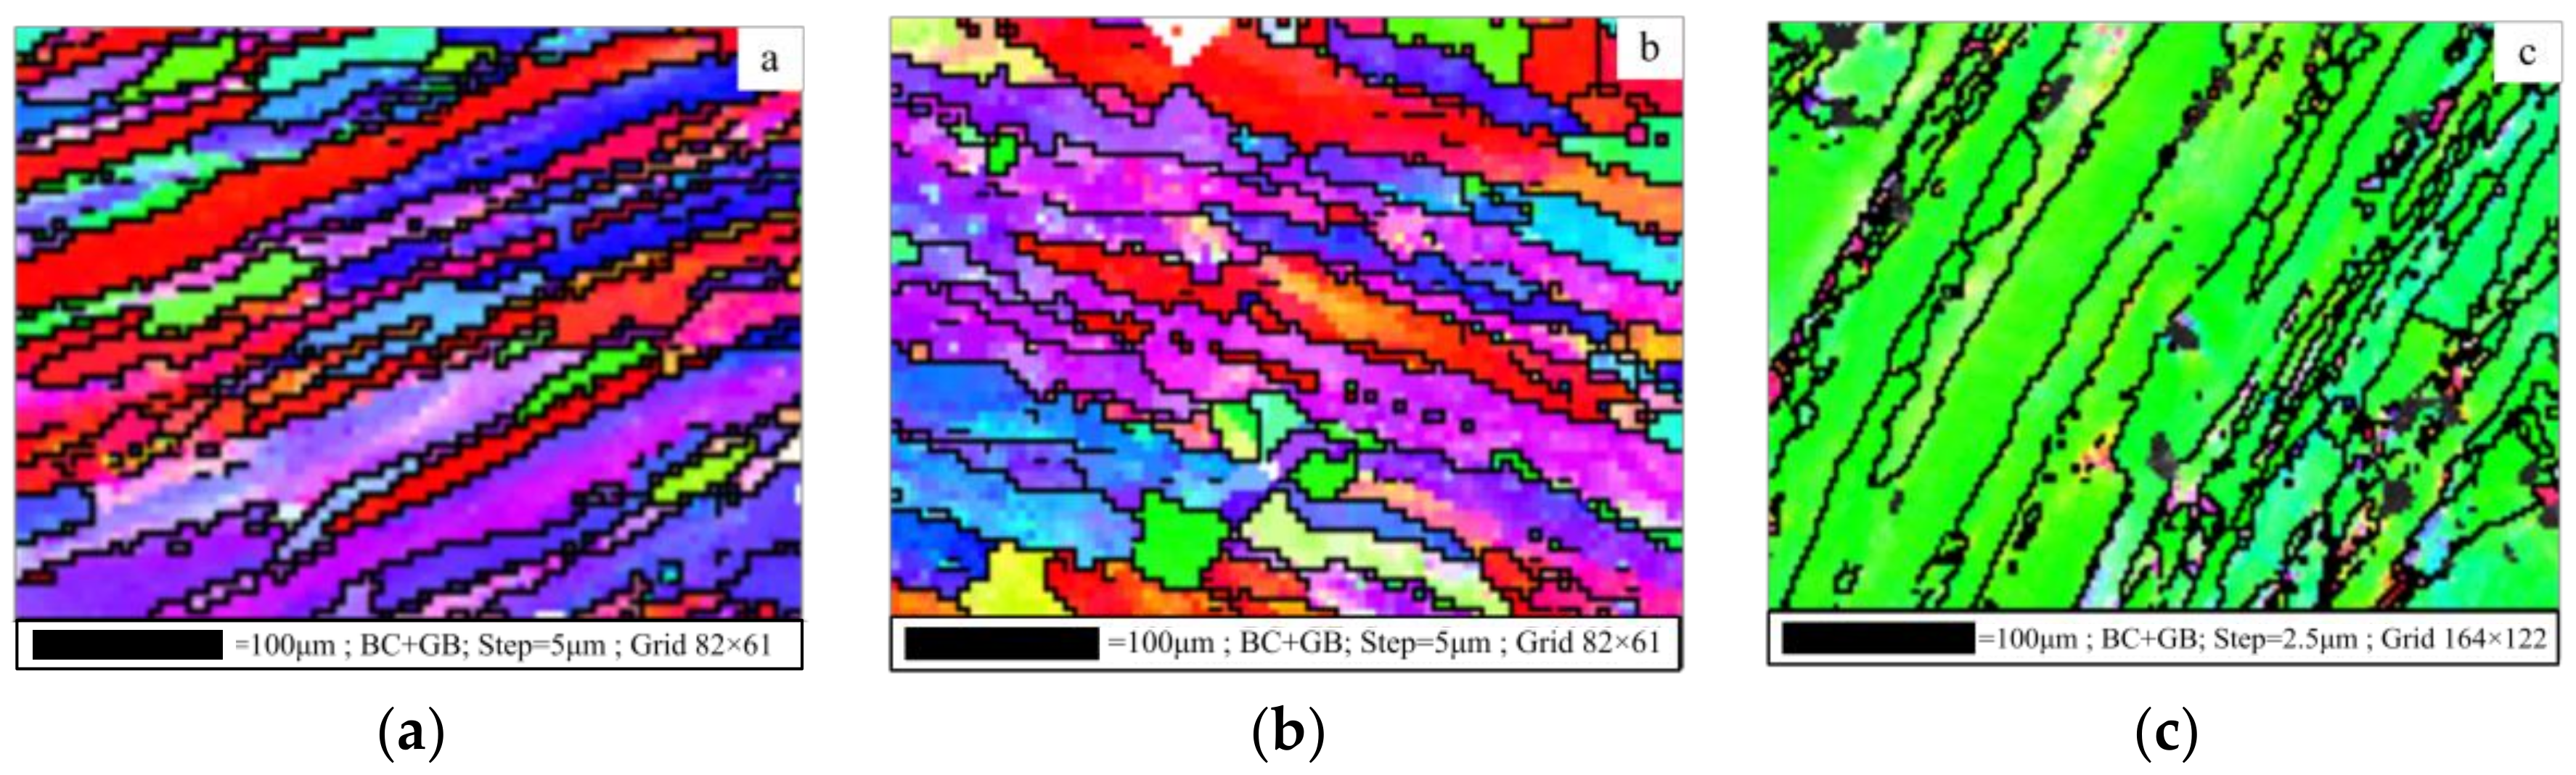
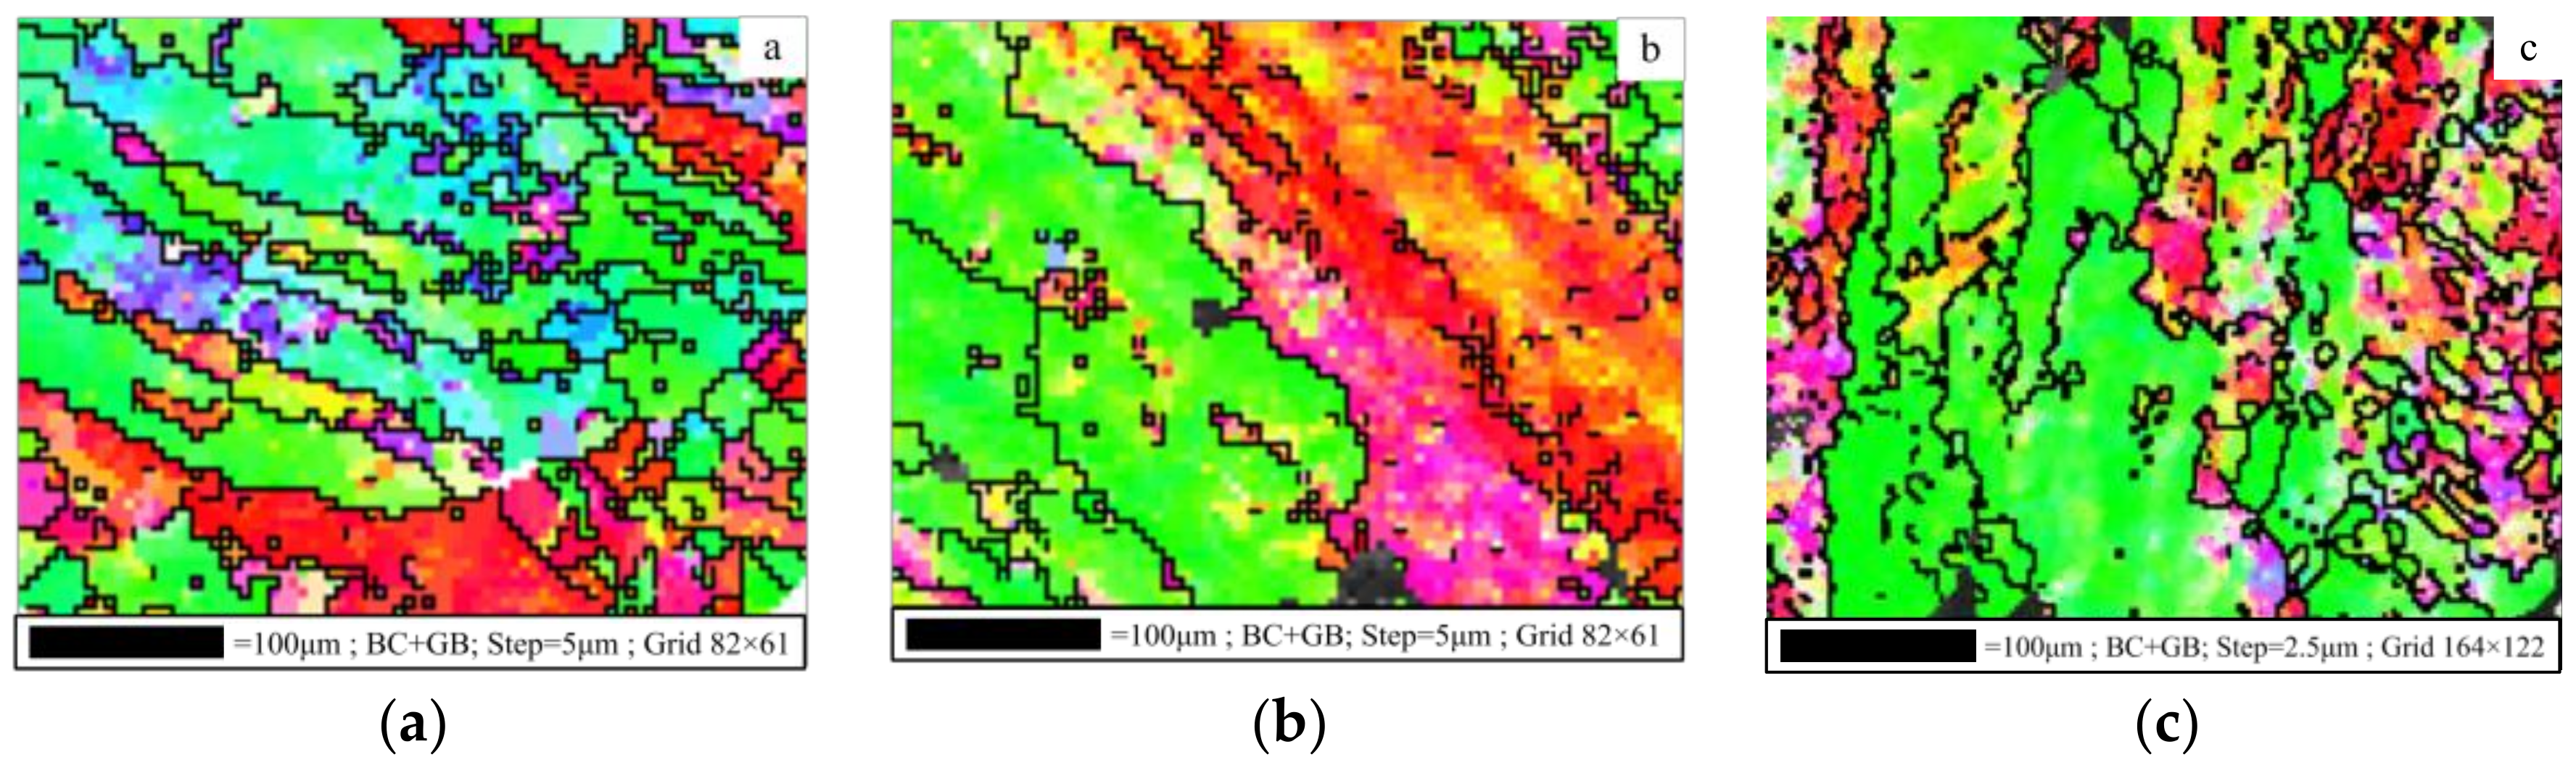
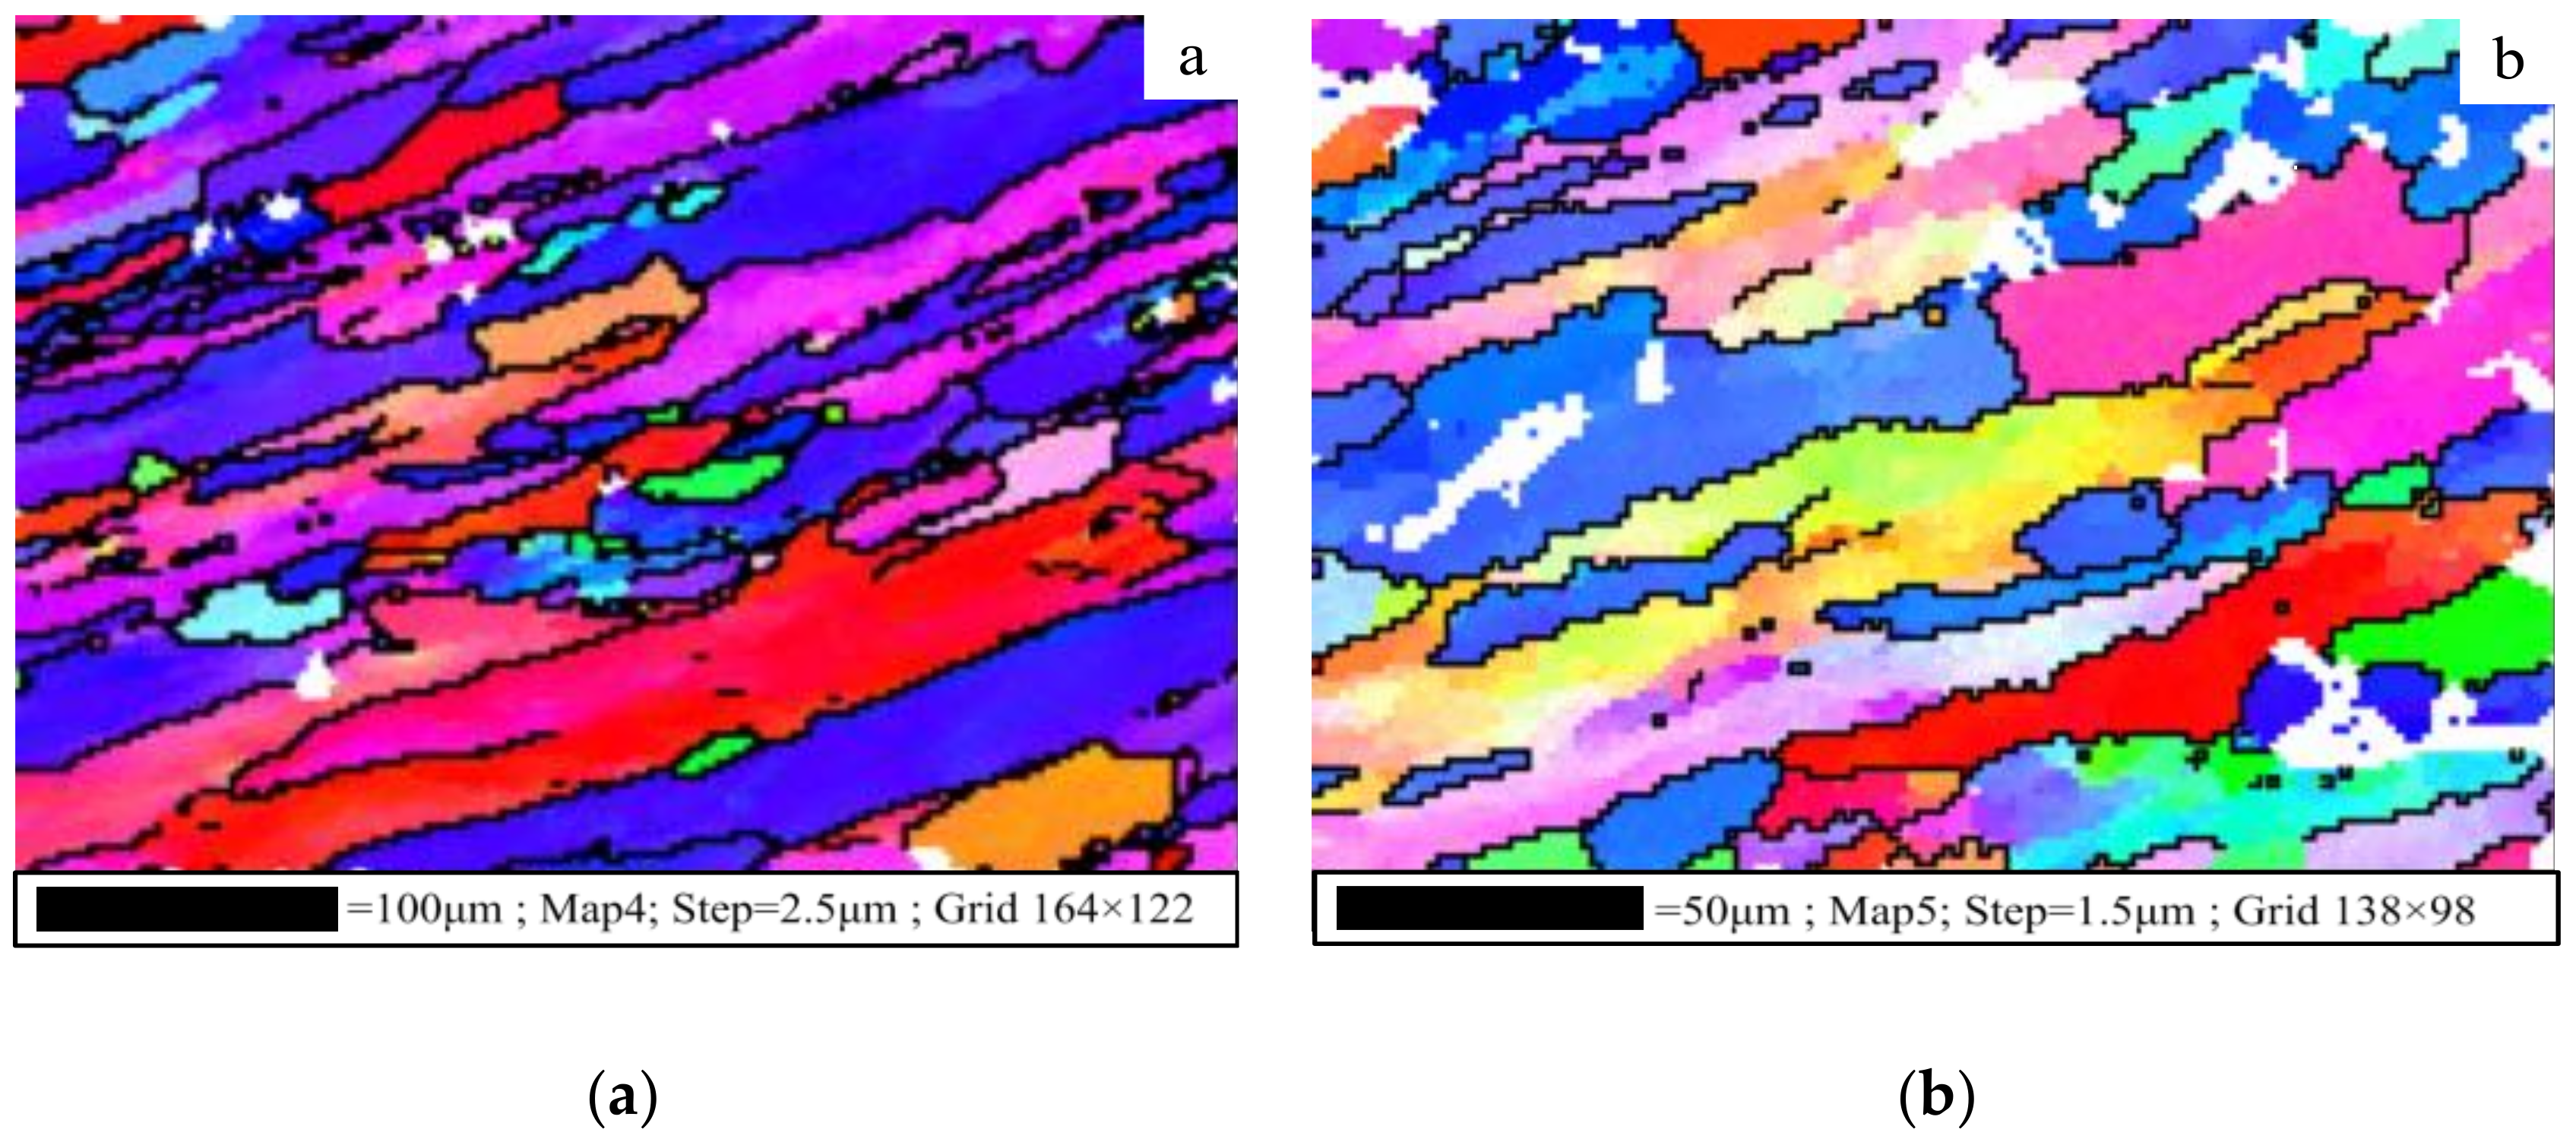
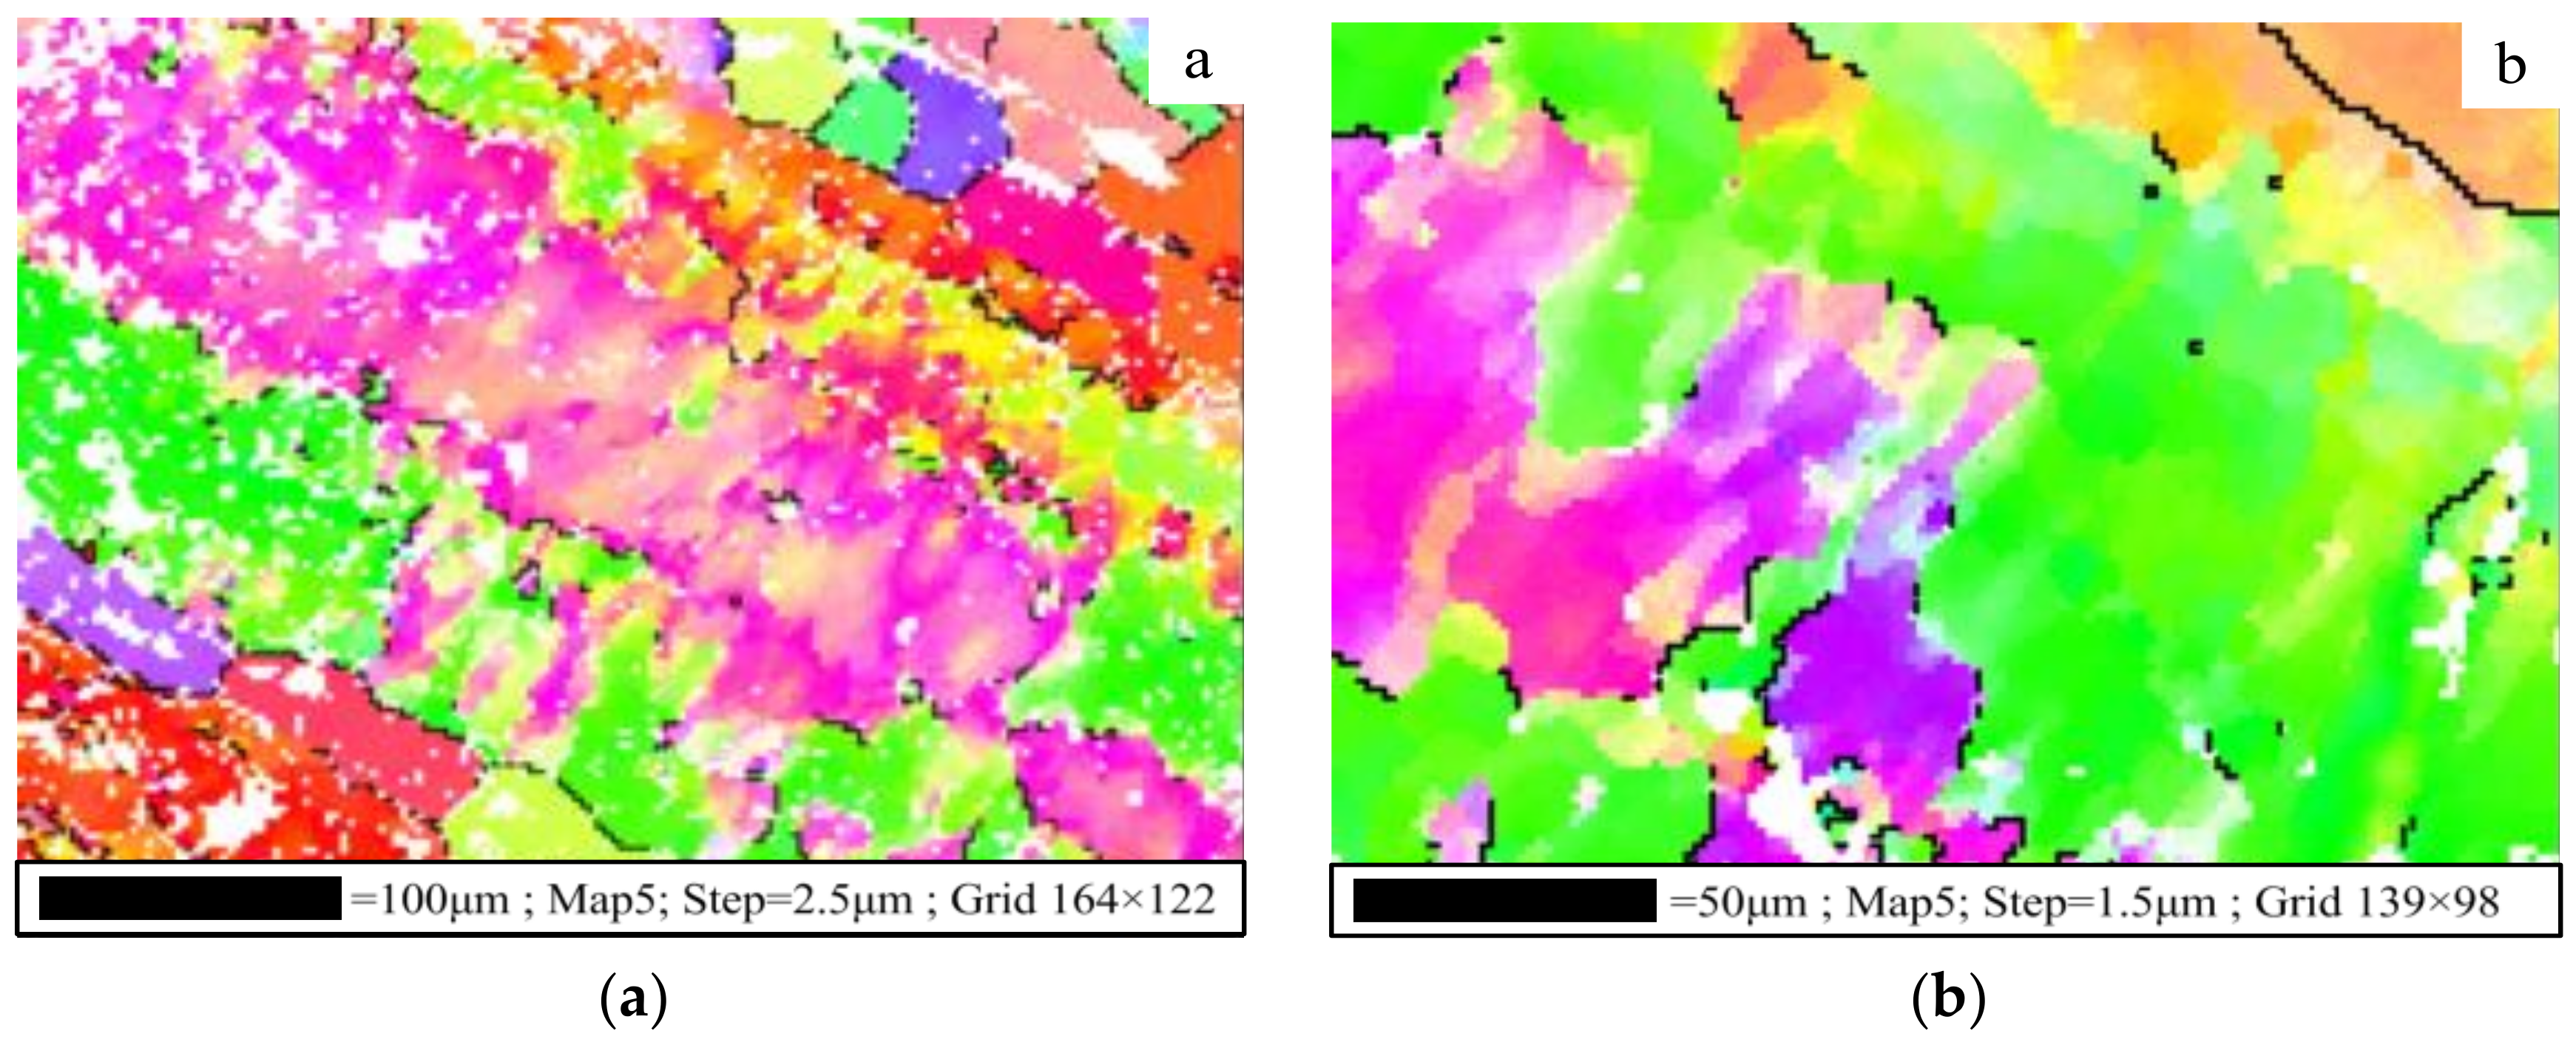
The microstructure observation showed that the grains in ND of the material were mostly long axial grain, the grains in RD were coarse, flat and non equiaxed shape, and the grains in TD were recrystallized and approximately equiaxed shape. The grain structure showed a certain preferential orientation, and the dynamic shear properties of material showed obvious anisotropic characteristics.

Acknowledgments

This work was primarily supported by National Natural Science Foundation of China with grant number 51675230 and the Project of Shan Dong Province Higher Educational Science and Technology Program with grant number J17KZ001.

Author Contributions

Ying Meng, Xiangyu Wang, Zongcheng Hao and Xiuli Fu conceived and designed the experiments; Ying Meng, Zongcheng Hao and Xiuli Fu performed the experiments; Ying Meng and Xiuli Fu analyzed the data; Ying Meng, Xiuli Fu and Xiangyu Wangwrote the paper.

Conflicts of Interest

The authors declare no conflicts of interest.

References

  1. Fu, X.L.; Pan, Y.Z.; Ai, X.; Wan, Y. Research on material constitutive model at large range of strain and strain rate. J. Harbin Inst. Technol. 2010, 17, 37–40. [Google Scholar]
  2. Zhang, Z.; Jiang, Z.; Wei, Q. Dynamic mechanical properties and constitutive equation of 2219 aluminum alloy. J. Mater. Eng. 2017, 10, 47–51. [Google Scholar]
  3. Xie, C.; Tongm, M.; Liu, F.; Zhi-Gang, L.I.; Guo, Y.Z.; Liu, X.C. Dynamic tests and constitutive model for 7075-T6 aluminum alloy. J. Vib. Shock 2014, 33, 110–114. [Google Scholar]
  4. Chen, Y.; Li, Y.; Cheng, X.; Wu, C.; Cheng, B.; Xu, Z. The Microstructure and Mechanical Properties of refractory High-Entropy Alloys with High Plasticity. Materials 2018, 11, 208. [Google Scholar] [CrossRef] [PubMed]
  5. Yu, J.; Jiang, F.; Rong, Y. Experimental research on mechanical property size effects of AISI D2 steel. Mater. Sci. Technol. 2012, 20, 83–88. [Google Scholar]
  6. Liu, W.; Ma, M.; Yang, F. Effect of the Heat Treatment on the Cube Recrystallization Texture of Al-Mn-Mg Aluminum Alloy. Metall. Mater. Trans. A 2013, 44, 2857–2868. [Google Scholar] [CrossRef]
  7. Premkumar, M.; Himabindu, V.S.; Banumathy, S.; Bhattacharjee, A.; Singh, A.K. Effect of mode of deformation by rolling on texture evolution and yield locus anisotropy in a multifunctional β titanium alloy. Mater. Sci. Eng. A 2012, 552, 15–23. [Google Scholar] [CrossRef]
  8. Ling, L.; Tang, J.; Liu, W.; Zhang, X.; Liang, C.; Deng, Y. Numerical simulation evolution of shear strain of crystallographic textures during snake rolling of Al-Mg-Si alloy plate. J. Cent. South Univ. 2017, 48, 2279–2287. [Google Scholar]
  9. Feng, D.; Zhang, X.; Liu, S.; Wu, S.; Guo, Y.; Yu, C. Inhomogeneity of microstructure and properties od 7A55 aluminum alloy thick plate. J. Cent. South Univ. 2015, 8, 2824–2830. [Google Scholar]
  10. Wei, P.; Lu, C.; Liu, H.; Su, L.; Deng, G.; Tieu, K. Study of Anisotropic Plastic Behavior in High Pressure Torsion of Aluminum Single Crystal by Crystal Plasticity Finite Element Method. Crystals 2017, 7, 362. [Google Scholar] [CrossRef]
  11. Xiong, C.; Deng, Y.; Wang, L. Evolutions of microstructure and textures of 7050 Al alloy plate during solution heat treatment. Chin. J. Nonferr. Met. 2010, 20, 427–434. [Google Scholar]
  12. You, Z.; Hui, S.; Ye, W.; Yu, Y.; Liu, R. Effect of texture on dynamic mechanical property of TC4 rolled plate. Chin. J. Rare Met. 2012, 1, 31–35. [Google Scholar]
  13. Wang, X.; Huang, C.; Zou, B.; Liu, H.; Zhu, H.; Wang, J. Dynamic behavior and a modified Johnson-Cook constitutive model of Inconel 718 at high strain rate and elevated temperature. Mater. Sci. Eng. A 2013, 580, 385–390. [Google Scholar] [CrossRef]
  14. Jouneghani, F.Z.; Dimitri, R.; Bacciocchi, M.; Tornabene, F. Free Vibration Analysis of Functionally Graded Porous Doubly-Curved Shells Based on the First-Order Shear Deformation Theory. Appl. Sci. 2017, 7, 1–20. [Google Scholar] [CrossRef]
  15. Zhou, G.; Dong, X.; Fu, Y. An experimental study of adiabatic shear behavior of TA2 titanium alloy subject to different loading condition. Chin. J. Theor. Appl. Mech. 2016, 48, 1353–1361. [Google Scholar]
  16. Shi, C.; Xu, S.; Shan, J.; Wang, P.; Hu, S. Plastic instability of LY12 aluminum alloy ring under longitudinal impact compression. Explos. Shock Waves 2017, 37, 471–478. [Google Scholar]
  17. Zhang, C.; Xie, L.; Chen, M.; Shang, G.Q. Dynamic mechanical property and plastic constitutive relation of TC4-DT Ti alloy under high strain rate. Chin. J. Nonferr. Met. 2015, 25, 323–329. [Google Scholar]
  18. Gu, L.; Wang, M.; Sun, C. Experimental study on characteristics of adiabatic shear localization fracture in high speed machining. J. Mech. Eng. 2014, 50, 166–171. [Google Scholar] [CrossRef]
  19. Ma, X.Q.; Han, F. High Speed Collision Dynamics; National Defense Industry Press: Beijing, China, 1998. [Google Scholar]
  20. Liu, W.; He, Z.; Chen, Y.; Tang, S.W. Dynamic mechanical properties and constitutive equations of 2519A aluminum alloy. Trans. Nonferr. Met. Soc. China 2014, 24, 2179–2186. [Google Scholar] [CrossRef]
  21. Gao, Z.; Zhang, X.; Chen, M.; Zhao, Y.; Li, H.; Liu, B. Effect of temperature on dynamic yield stress and microstructure of 2519A aluminum aloy at high strain rate. Chin. J. Rare Met. 2009, 38, 881–886. [Google Scholar]
  22. Ferreira, N.; Antunes, P.; Ferreira, J.A.M.; Costa, J.D.M.; Capela, C. Effects of Shot-Peening and Stress Ratio on the Fatigue Crack Propagation of AL 7475-T7351 Specimens. Appl. Sci. 2018, 8, 375. [Google Scholar] [CrossRef]
  23. Li, D.; Xu, L.; Huang, X.; Dai, G. Investigation on critical strain of dynamic recrystallization for 7A04 aluminum alloy. J. Mater. Eng. 2013, 4, 23–27. [Google Scholar]
  24. Zhang, Y.; Wang, X.; Kong, F.; Chen, Y. Dynamic Recrystallization of the Constituent γ Phase and Mechanical Properties of Ti-43Al-9V-0.2Y Alloy Sheet. Materials 2017, 10. [Google Scholar] [CrossRef] [PubMed]
  25. Tang, W.; Zhang, S.; Fan, X.; Li, F.Y.; Peng, Y.H. Texture and its effect on mechanical properties of AZ31 magnesium alloy. Chin. J. Nonferr. Met. 2010, 3, 371–377. [Google Scholar]
  26. Zhang, K.; Zhang, J.; Liu, Y.; Zhong, L.; University, C.J. Microstructure and texture variation of 6016 aluminum alloy during cold rolling. Rare Met. Mater. Eng. 2017, 6, 1559–1565. [Google Scholar]
  27. Yang, L.; Hui, S.; Ye, W.; Huang, L. Texture and EBSD of TA18 titanium alloys tubes. Chin. J. Rare Met. 2011, 35, 928–933. [Google Scholar]
  28. Mao, L.; Yu, J.; Liu, Z.; Dong, Y.; Xi, T. Dynamic mechanical property and failure behavior of extruded Mg-Gd-Y alloy under high strain rate compression. Chin. J. Nonferr. Met. 2013, 4, 889–897. [Google Scholar]
  29. Chen, J.; Duan, Y.; Peng, X.; Cao, X.; Xu, G.; Yin, Z. Fracture toughness of 7475-T7351 aluminum alloy thick plate. J. Cent. South Univ. 2015, 2, 437–443. [Google Scholar]
Figure 1. The selection direction of specimens. ND: Normal direction; TD: Transverse direction; RD: Rolling direction.
Applsci 08 00520 g001
Figure 2. Dynamic shearing specimens.
Applsci 08 00520 g002
Figure 3. Schematic diagram of the High Split Hopkinson Pressure Bar (SHPB) device. It contains ten major components: (1) Gas gun; (2) Impact bar; (3) Input bar; (4, 7) Strain gauge; (5) Specimen; (6) Absorbing bar; (8) Output bar; (9) Waveform storage device; (10) Support platform.
Applsci 08 00520 g003
Figure 4. Dynamic Bar-Tube shearing device and enlarge image of I area.
Applsci 08 00520 g004
Figure 5. Crack photos of specimens of three forming directions.
Applsci 08 00520 g005
Figure 6. Diagram of the shear surfaces in TD.
Applsci 08 00520 g006
Figure 7. Scanning electron microscope (SEM) diagram of the shear surface in TD.
Applsci 08 00520 g007
Figure 8. Dynamic stress-strain curves of different forming directions: (a) ND; (b) TD; (c) RD.
Applsci 08 00520 g008
Figure 9. Dynamic stress-strain curves of different strain rates: (a) 2.5 × 10⁴ s−1; (b) 3.5 × 10⁴ s−1; (c) 4.5 × 10⁴ s−1.
Applsci 08 00520 g009
Figure 10. Microstructure of aluminum alloy 7050-T7451 in ND: (a) electron backscattered diffraction (EBSD) 500×; (b) EBSD 1000×; (c) SEM 4000×. BC: band contrast; GB: grain boundary.
Applsci 08 00520 g010
Figure 11. Microstructure of aluminum alloy 7050-T7451 in RD: (a) EBSD 500×; (b) EBSD 1000×.
Applsci 08 00520 g011
Figure 12. Microstructure of aluminum alloy 7050-T7451 in TD: (a) EBSD 500×; (b) EBSD 1000×.
Applsci 08 00520 g012
Figure 13. Microstructure of aluminum alloy 7050-T7451 in ND at different strain rates after impact shear: (a) 2.5 × 10⁴s−1; (b) 3.5 × 10⁴ s−1; (c) 4.5 × 10⁴ s−1.
Applsci 08 00520 g013
Figure 14. Microstructure of aluminum alloy 7050-T7451 in TD at different strain rates after impact shear: (a) 2.5 × 10⁴ s−1; (b) 3.5 × 10⁴ s−1; (c) 4.5 × 10⁴ s−1.
Applsci 08 00520 g014
Table 1. Chemical composition of aluminum alloy 7050-T7451 (wt/%).
ZnCuMgZrMnSiFeTiAl
6.702.502.300.120.100.120.130.06Bal.
Table 2. SHPB tests conditions.
Forming DirectionDesired Strain Rate(s−1)
RD, TD, ND2.5 × 104 ; 3.5 × 10⁴ ; 4.5 × 10⁴
RD: rolling direction; TD: transverse direction; ND: normal direction
Table 3. The shear modulus of aluminum alloy 7050-T7451 at different strain rates.
Shear Modulus/(GPa)NDTDRD
2.5 × 10⁴ s−1201515
3.5 × 10⁴ s−1211920
4.5 × 10⁴ s−1222422
Table 4. The shear modulus of aluminum alloy 7050-T7451 at different directions.
Shear Modulus/(GPa)2.5 × 104 s−13.5 × 10⁴ s−14.5 × 10⁴ s−1
ND182011
TD171614
RD181913

