Article

Prostate Clinical Outlook Visualization System for Patients and Clinicians Considering Cyberknife Treatment—A Personalized Approach

1
Open Source Electronic Health Record Alliance, 1934 Old Gallows Road Suite 420, Vienna, VA 22182, USA
2
Department of Medical Informatics, College of Medicine, The Catholic University of Korea, 222, Banpo-dong, Seocho-gu, Seoul 06591, Korea
3
Arlington Innovation Center, Virginia Tech, 900 N Glebe Road, Arlington, VA 22203, USA
4
Department of Radiation Medicine, Georgetown University Hospital, 3800 Reservoir Rd. NW, Washington, DC 20007, USA
*
Author to whom correspondence should be addressed.
Appl. Sci. 2018, 8(3), 471; https://doi.org/10.3390/app8030471
Submission received: 22 February 2018 / Revised: 15 March 2018 / Accepted: 16 March 2018 / Published: 19 March 2018

Abstract

:
Background: When a patient presents with localized prostate cancer, referral for radiation oncology consultation includes a discussion of likely outcomes of therapy. Among current radiation treatments for prostate cancers, hypo-fractionated stereotactic body radiation therapy (SBRT) has gained clinical acceptance based on efficacy, short duration of treatment, and the potential radiobiological advantages. The Prostate Clinical Outlook Visualization System (PCOVS) was developed to provide the patient and the clinician with a tool to visualize probable treatment outcomes using institutional, patient specific data for comparing results of treatment. Methods: We calculated the prostate cancer outcomes—for each prospective patient using the EPIC-26 quality of life parameters based on clinical outcomes data of 580 prostate cancer patients who were treated with SBRT. We applied Kaplan-Meier analysis using the ASTRO definition for biochemical recurrence (BCR) free survival and likely outcome and the PCOVS nomogram to calculate parameters for quality of life. Open-source R, RShiny, and MySQL were used to develop a modularized architecture system. Results: The PCOVS presents patient specific risk scores in a gauge chart style and risk free probability bar plots to compare the treatment data of patients treated with SBRT. The PCOVS generates reports, in PDF, which consists of a comparison charts of risk free probabilities late effects and gauge charts of risk scores. This system is now being expanded as a web-based service to patients. Conclusions: The PCOVS visualized patient specific likely outcomes were compared to treatment data from a single department, helping the patient and the clinician to visualize likely outcomes. The PCOVS approach can be expanded to other specialties of oncology with the flexible, modularized architecture, which can be customized by changing independent modules.

1. Introduction

When men presenting with localized prostate cancer are referred for radiation therapy, a number of questions in terms of therapy outcomes needs to be discussed with a radiation oncologist [1]. It is not uncommon for the answers to a patient’s concerns to become difficult to understand, due to stress and anxiety. Many patients have a limitation in their ability to understand health statistical mean and predicted outcomes [2]. Thus, patients get the treatment with very little understanding about their future status and likely outcomes. If the physician can tell the patients about their future status with specific graphically-based data-driven outcomes, then patients can understand more and be adherent to the treatment and their future status. It is useful to help patients understand their therapy and likely outcomes. It gives prostate patients confidence in their treatment. Therefore, explanations need to focus on practical localized data that explains likely outcomes. In addition, the physician can proffer confidence when communicating likely outcomes to their patients with the assistance of practical data.
At present, the time required for a Radiation Oncologist to analyze an individual patient’s pathology and to then convey meaningful information can be burdensome. It would be beneficial if a physician could have ready access to explanatory information that included graphical displays that deal with a single patient’s disease. A point of care clinical decision support system (CDSS) is needed to support patients, save effort and time, and allow the physician to focus on their patients. CDSS is a knowledge-based system for decision-making in routine clinical use. CDSS offers potential benefits, such as improved patient safety, improved quality of care, and improved efficiency in health care delivery [3]. If the CDSS can display easy to read clinical results, then it helps people to understand and use statistic results. The CDSS should make a better environment for both prostate cancer patients and physicians with a single mouse click, resulting in an outcome result visualization report.
To create the CDSS, we focused on localized hypo-fractionated stereotactic body radiation therapy (SBRT) data, as SBRT has shown significant improvements for prostate cancer treatment. Among current treatments for prostate cancers, SBRT has gained clinical acceptance based on efficacy, short duration of treatment, and radiobiological advantages [4].
There are many useful Open-source technologies to develop the CDSS. These include R and RShiny. Open-source technologies eliminate the software costs for development and maintenance of healthcare-based IT systems. Specifically, R is a well-known and documented Open-source language that is used to develop analysis and visualization tools for medical data. Many researches have used Open-source technologies to develop similar systems, clinical data visualization, and biomedical applications [5,6,7,8].
Accordingly, this study attempted to develop the Prostate Clinical Outlook Visualization System (PCOVS) for SBRT based on open-source language. The PCOVS aims to support the patient and the clinician with a tool to visualize the likely outcomes using institutional, patient specific data for comparing the results of treatment.

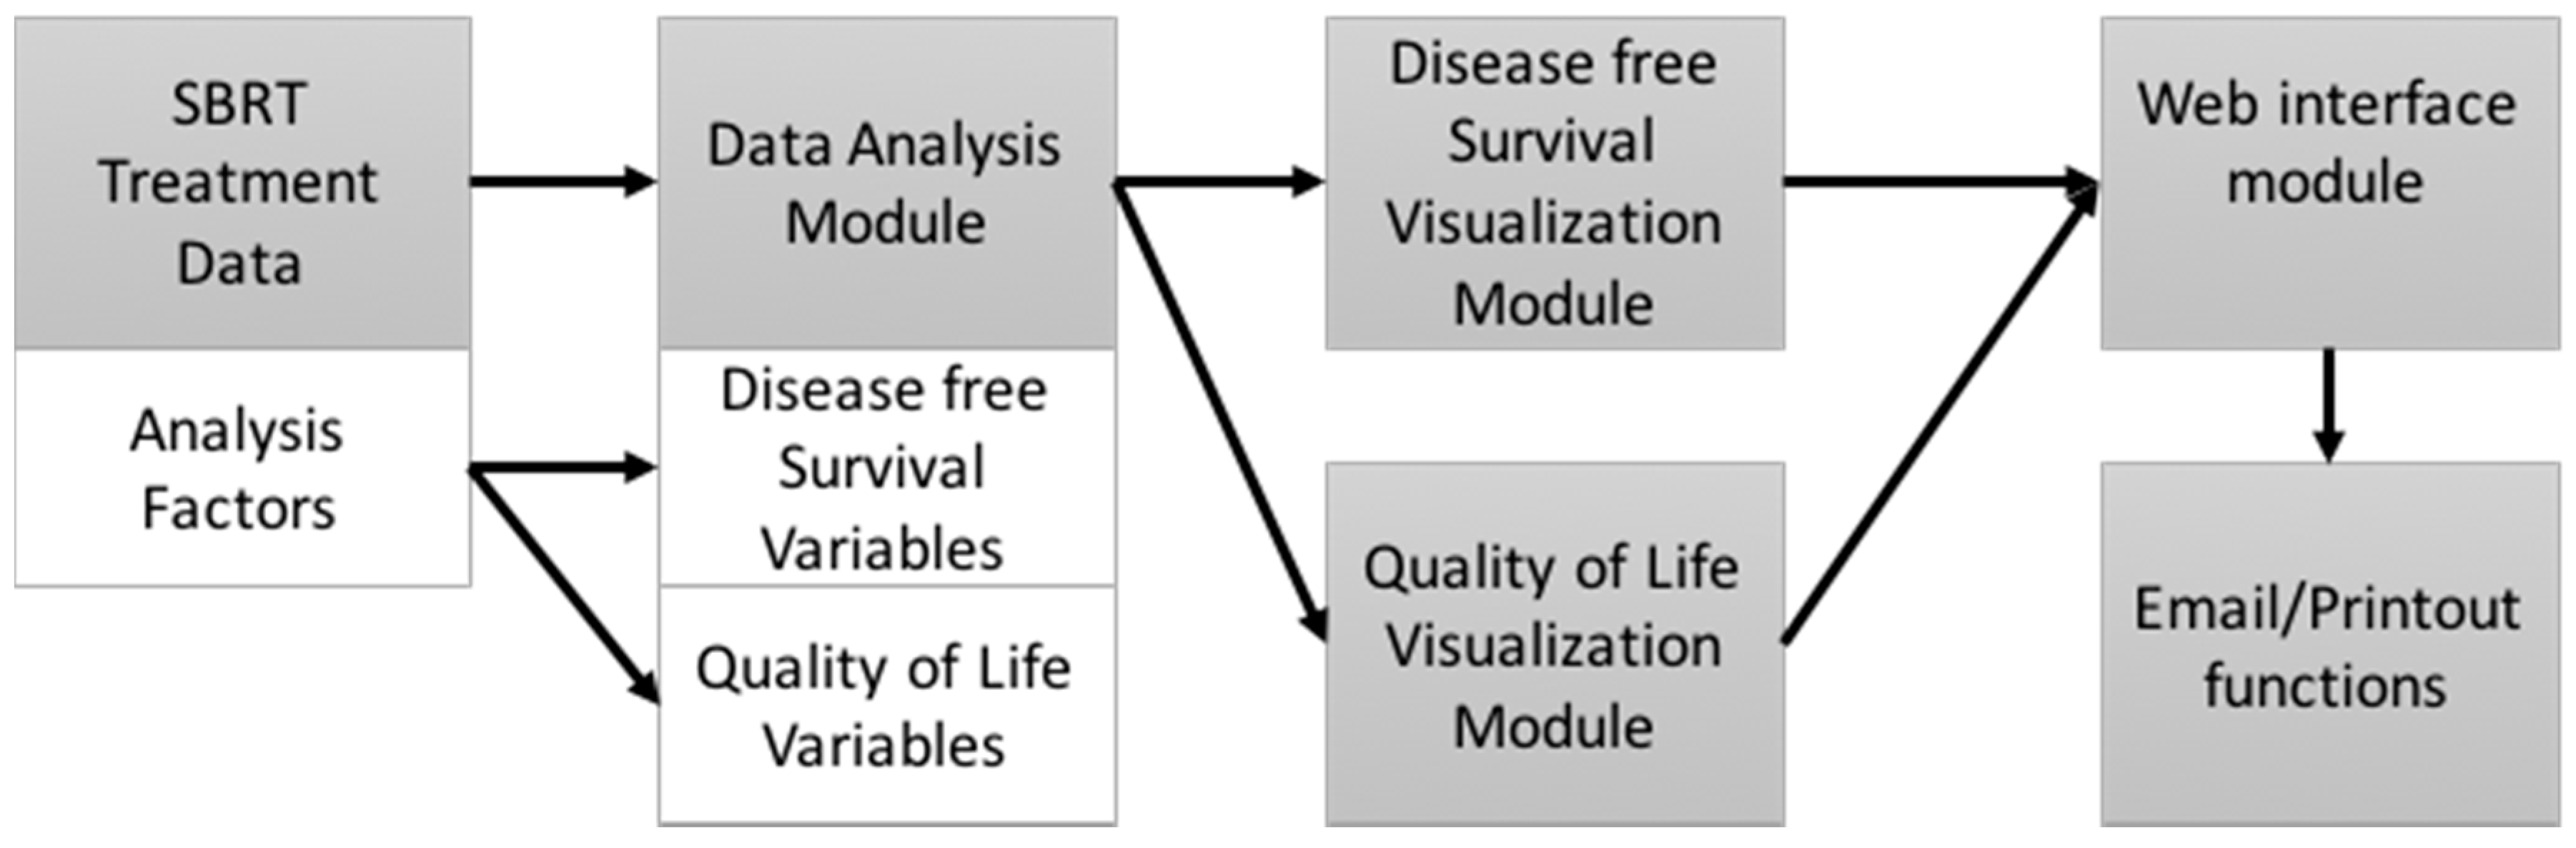
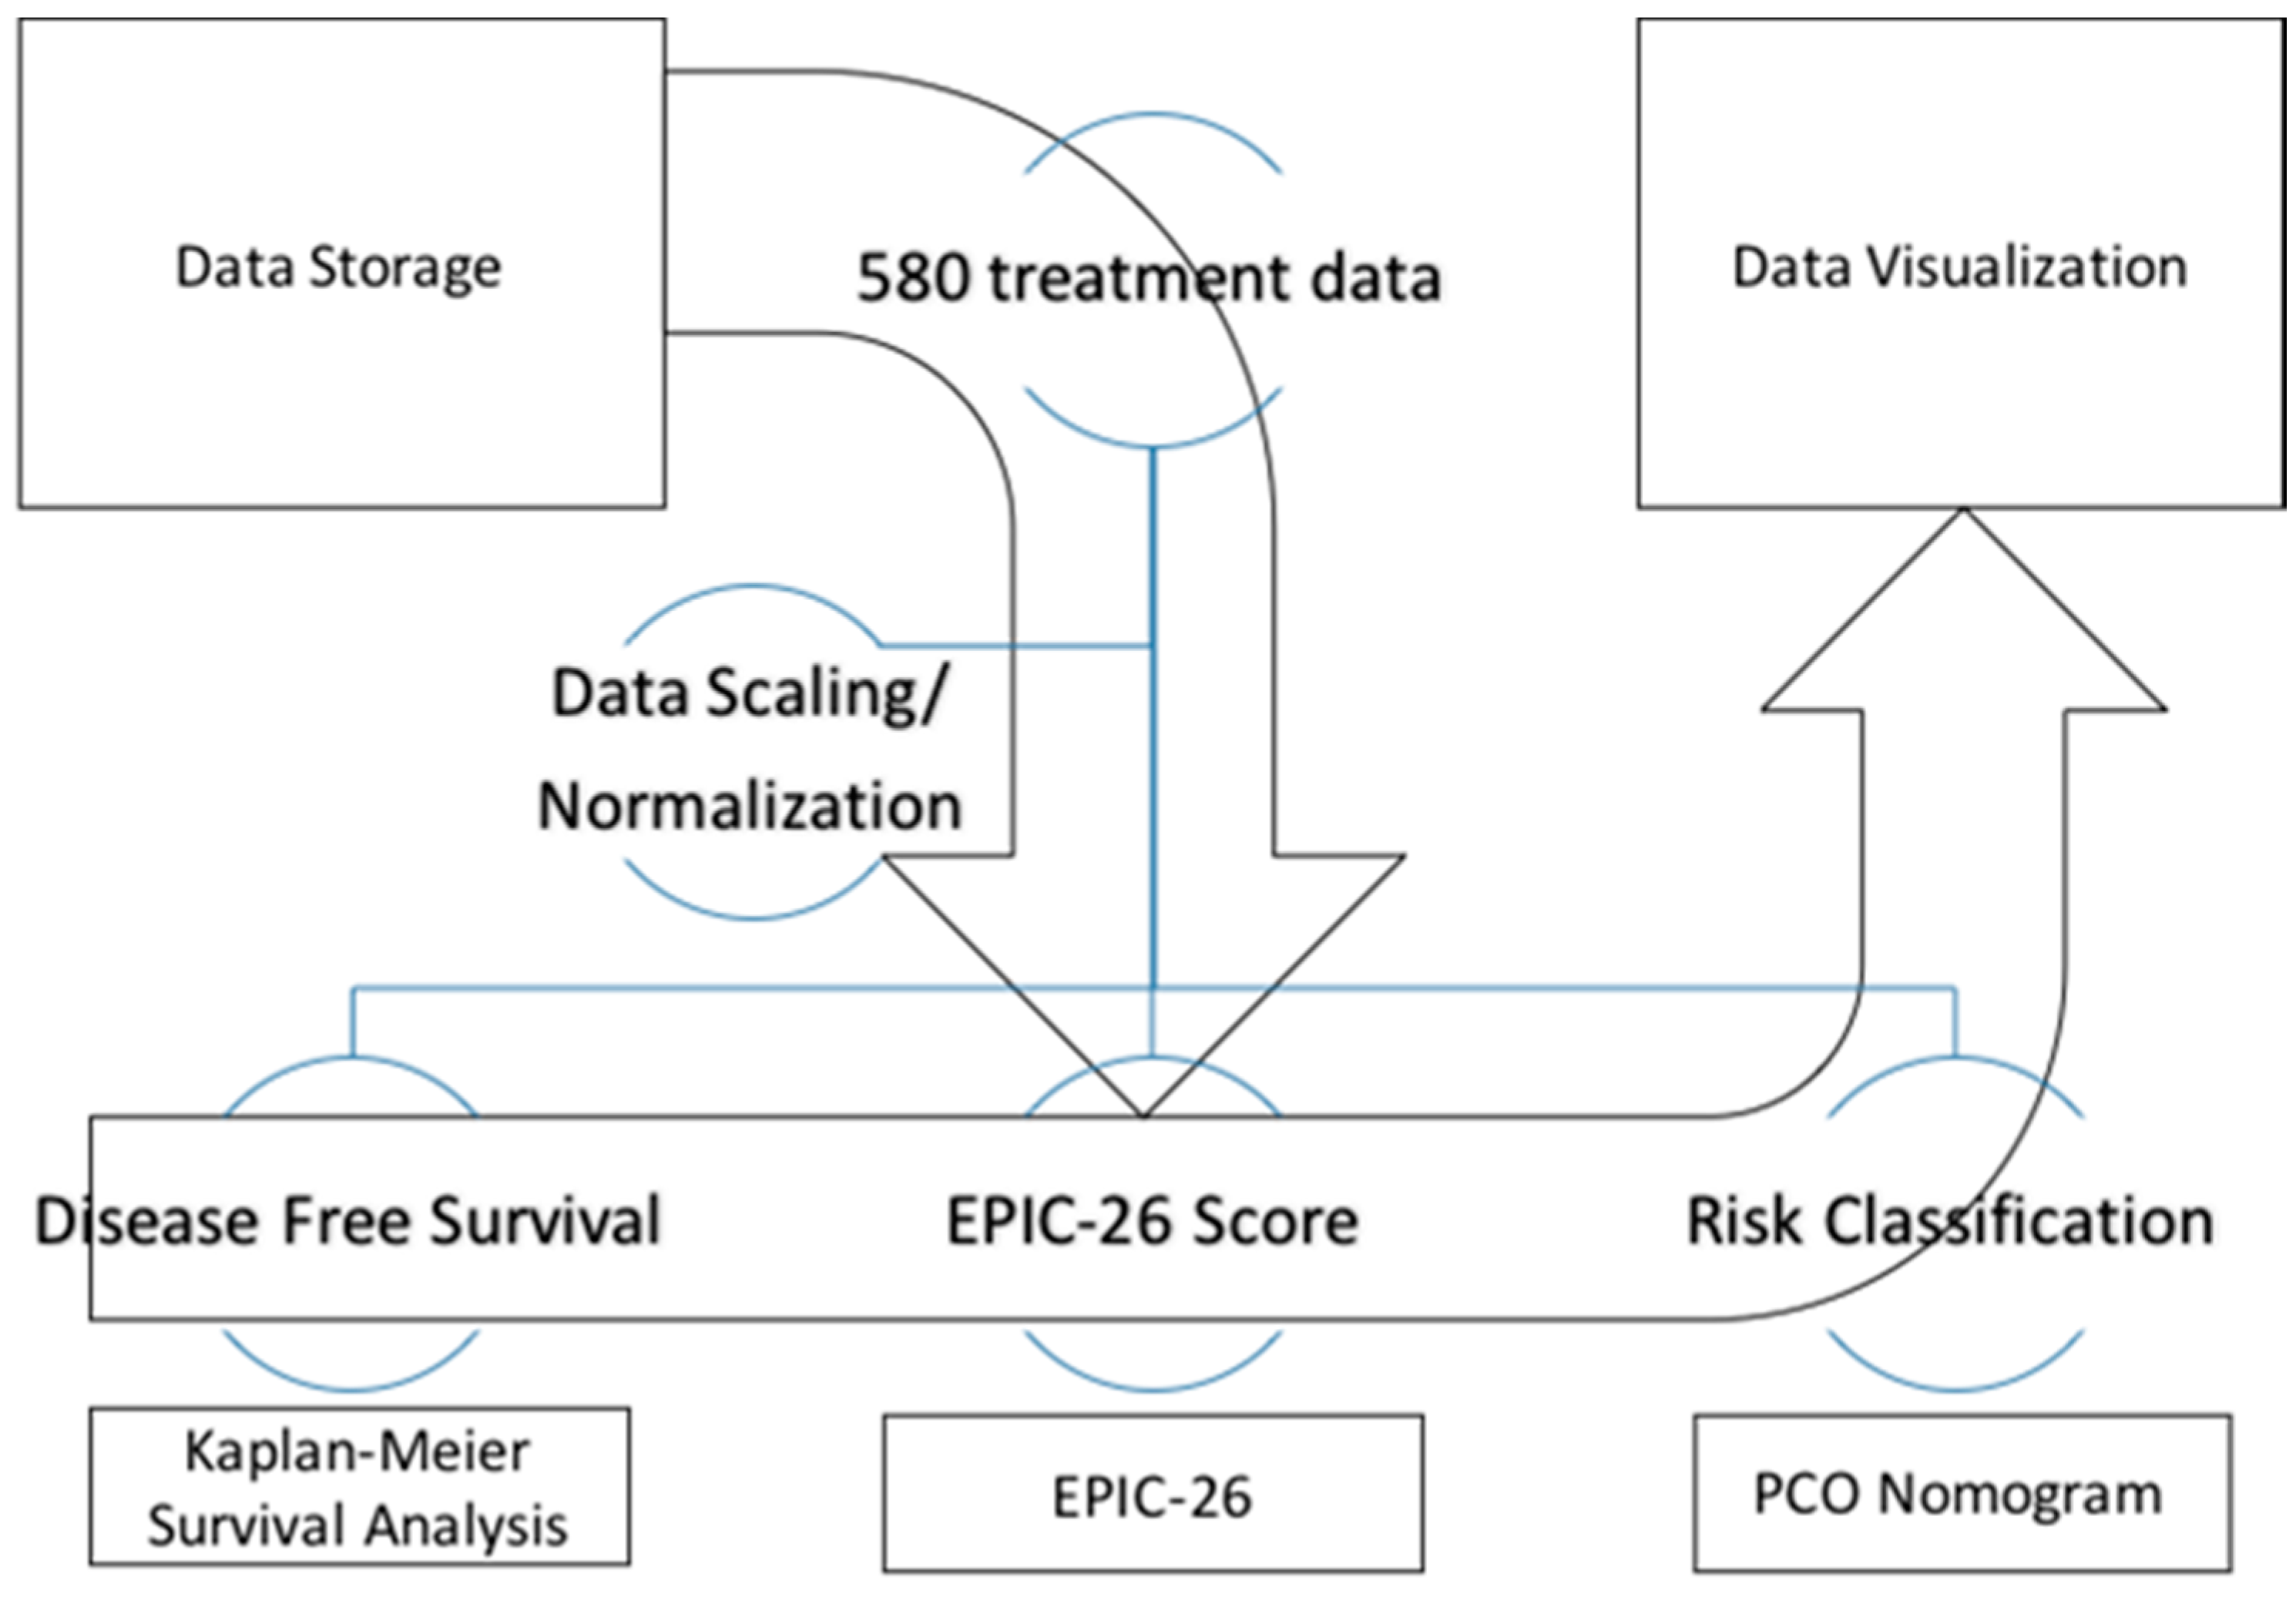
2. Materials and Methods

The PCOVS visualized biochemical relapse (BCR) free survival curve and likely outcome plots compared to 580 prostate cancer patient’s data treated with SBRT between August 2007 and January 2015 at MedStar-Georgetown University Hospital.
The PCOVS architecture consists of modularized functionalities of (1) data analysis; (2) visualization; and (3) a Web interface module (Figure 1). Using data derived from SBRT treatments of the prostate, the data analysis module calculated disease free survival rates and quality of life scores. Visualization modules generated charts and tables for analysis results. The web interface module showed likely outcome charts and results on the web browser screen. The web interface possesses email and print out functions for the visualized likely outcome report.
The PCOVS was designed to achieve automatic analysis (Figure 2). The data analysis module was developed as an independent module for visualization, and the web interface module makes the system flexible through the ability to modify itself.
The PCOVS was designed to deal with data normalization, analysis, and visualization processes. These features were developed in order to generate intuitive visualization from the statistical results. First, the PCOVS managed the scaling and normalization of the data. Second, the PCOVS made three different analysis data sets including (1) survival analysis; (2) the Expanded Prostate Cancer Index Composite (EPIC-26) scores; and (3) the PCOVS risk calculator (Figure 2). Finally, the PCOVS visualized those three analysis data reports to present patient specific likely outcomes at five years when comparing to SBRT treated patients results.
For the user interface and reporting functions, the open-source language R was used for both data analysis and web architecture. RShiny was used to develop the web based user interface (UI) for the PCOVS (https://cran.r-project.org/web/packages/shiny). Essentially, the web-based system consists of a frontend as the UI and backend as a server application. RShiny has the characteristics of robust functionality, which allows for one to set up both the frontend and backend in tandem. For the data analysis, the PCOVS read the raw data from an excel file, and then a cleaning and normalizing module save the data into the MySQL database, which resides on the backend. The data analysis module used R package openxlsx (https://cran.r-project.org/web/packages/openxlsx) and RMySQL (https://cran.r-project.org/web/packages/RMySQL) to develop the data analysis functionalities. For the longitudinal data R package plotly was used to develop visualization (https://cran.r-project.org/package=plotly). R is the language for any future maintenance for the PCOVS that allows for simple and easy future upgrades. Because R is a fully compatible language with RShiny, the PCOVS included statistical functions and visualization functions in one system. To generate electronic file report, such as PDF or HTML, the PCOVS used R packages knitr (https://cran.r-project.org/web/packages/knitr) for dynamic report generation and rmarkdown (https://cran.r-project.org/web/packages/rmarkdown) for converting R documents into PDF or HTML. Eventually, the PCOVS was designed to achieve full stack architecture from data preparation to visualization.
The PCOVS used BCR based on the American Society of Therapeutic Radiology and Oncology (ASTRO) definition [9]. In ASTRO, BCR means the mid-point between prostate specific antigen (PSA) nadir and the first of three consecutive rises in PSA level [10]. In the PCOVS, BCR was finally defined as the mid-point between PSA nadir and the first of three consecutive increases in PSA level at least 0.5 ng/mL based on the ASTRO BCR definition and physician comments. The Kaplan-Meier Survival analysis was done to show the survival curves for patient specific data when comparing to treated patient data in order to distinguish the difference of disease free survival probabilities [11]. R package survival was used to develop survival analysis (https://cran.r-project.org/package=survival). Using disease free rate based on the ASTRO BCR definition, the PCOVS nomogram was developed by Open-source R with the cox model [12]. The PCOVS nomogram was used to store risk classification data and visualize estimated risk scores of BCR free survival and likely outcome. The PCOVS nomogram has three levels of risk score measurement, which are low, intermediate, and high risk group. The risk classification module was developed using R packages rms (https://cran.r-project.org/package=rms), survival (https://cran.r-project.org/package=survival), survey (https://cran.r-project.org/package=survey), and SvyNom (https://cran.r-project.org/package=SvyNom).
The quality of life (QOL) factors were used to develop QOL likely outcomes based on the Expanded EPIC-26, which includes three domains, such as rectal QOL, urinary QOL, and sexual QOL domains [13]. The EPIC-26 was developed by researchers at the University of Michigan and UCLA, and was intended to measure health related QOL among men with prostate cancer. The EPIC-26 was developed as a short-form version of the full EPIC. The EPIC-26 instrument contains four multi-item domains: (1) urinary domains such as urinary incontinence (four items), urinary irritation/obstruction (four items), and one question related to overall bother, (2) bowel domain (six items), (3) sexual domain (six items), and (4) vitality/hormonal function domain (five items) [14,15]. In addition, the EPIC-26 retains the single item measure of overall urinary bother from the University of California, Los Angeles, Prostate Cancer Index (UCLA-PCI) [14] (Appendix A). Each factor has their own scales to calculate 0–100 points. 0 means very bad and 100 means very good, in that the PCOVS can get a risk value with subtraction of each factor values from 100. This can result in negative values for QOL domains. The EPIC-26 scale score was transformed linearly to a 0–100 scale, as recommended in the scoring instructions for the EPIC-26. Higher score represents better health-related quality of life (HRQOL). In addition, the responses were grouped into three clinically relevant categories such as no problem, very small to small problem, and moderate to big problem [16,17]. The PCOVS utilized the bowel domain of the EPIC-26 to assess rectal QOL (Appendix B). The EPIC-26 bowel domain includes six items, which is five questions that are related to individual symptoms and one question related to overall bother [18]. The bowel domain scores express linearly to a 0–100 scale. Once the PCOVS had EPIC-26 scores for each QOL domains, the PCOVS generated likely outcome of QOL with patient specific data compare to the reference Cyber-knife SBRT treated patient data [19].

3. Results

We used 580 patients’ data to develop the PCOVS (Table 1). The patients’ ages at diagnosis ranged from under 59 to over 80. Approximately 92.3% of patients were classified from ages 60 to 79. The mean age is 69.63. Patients with T1 stage were 68.3%. 40.7% of patients have a low risk of the Gleason score. Pre-treatment PSA values were 76.9% of ≤10.0 ng/mL, 18.1% of >10.0 and ≤20.0 ng/mL, and 5.0% of >20.0 ng/mL. Follow-up median was 940 days, mean was 930.9 days and max were 2354 days. 53.1% of patients are White. Of the 580 patients available for the PCOVS, 17 (2.9%) had evidence of BCR prostate cancer after SBRT.

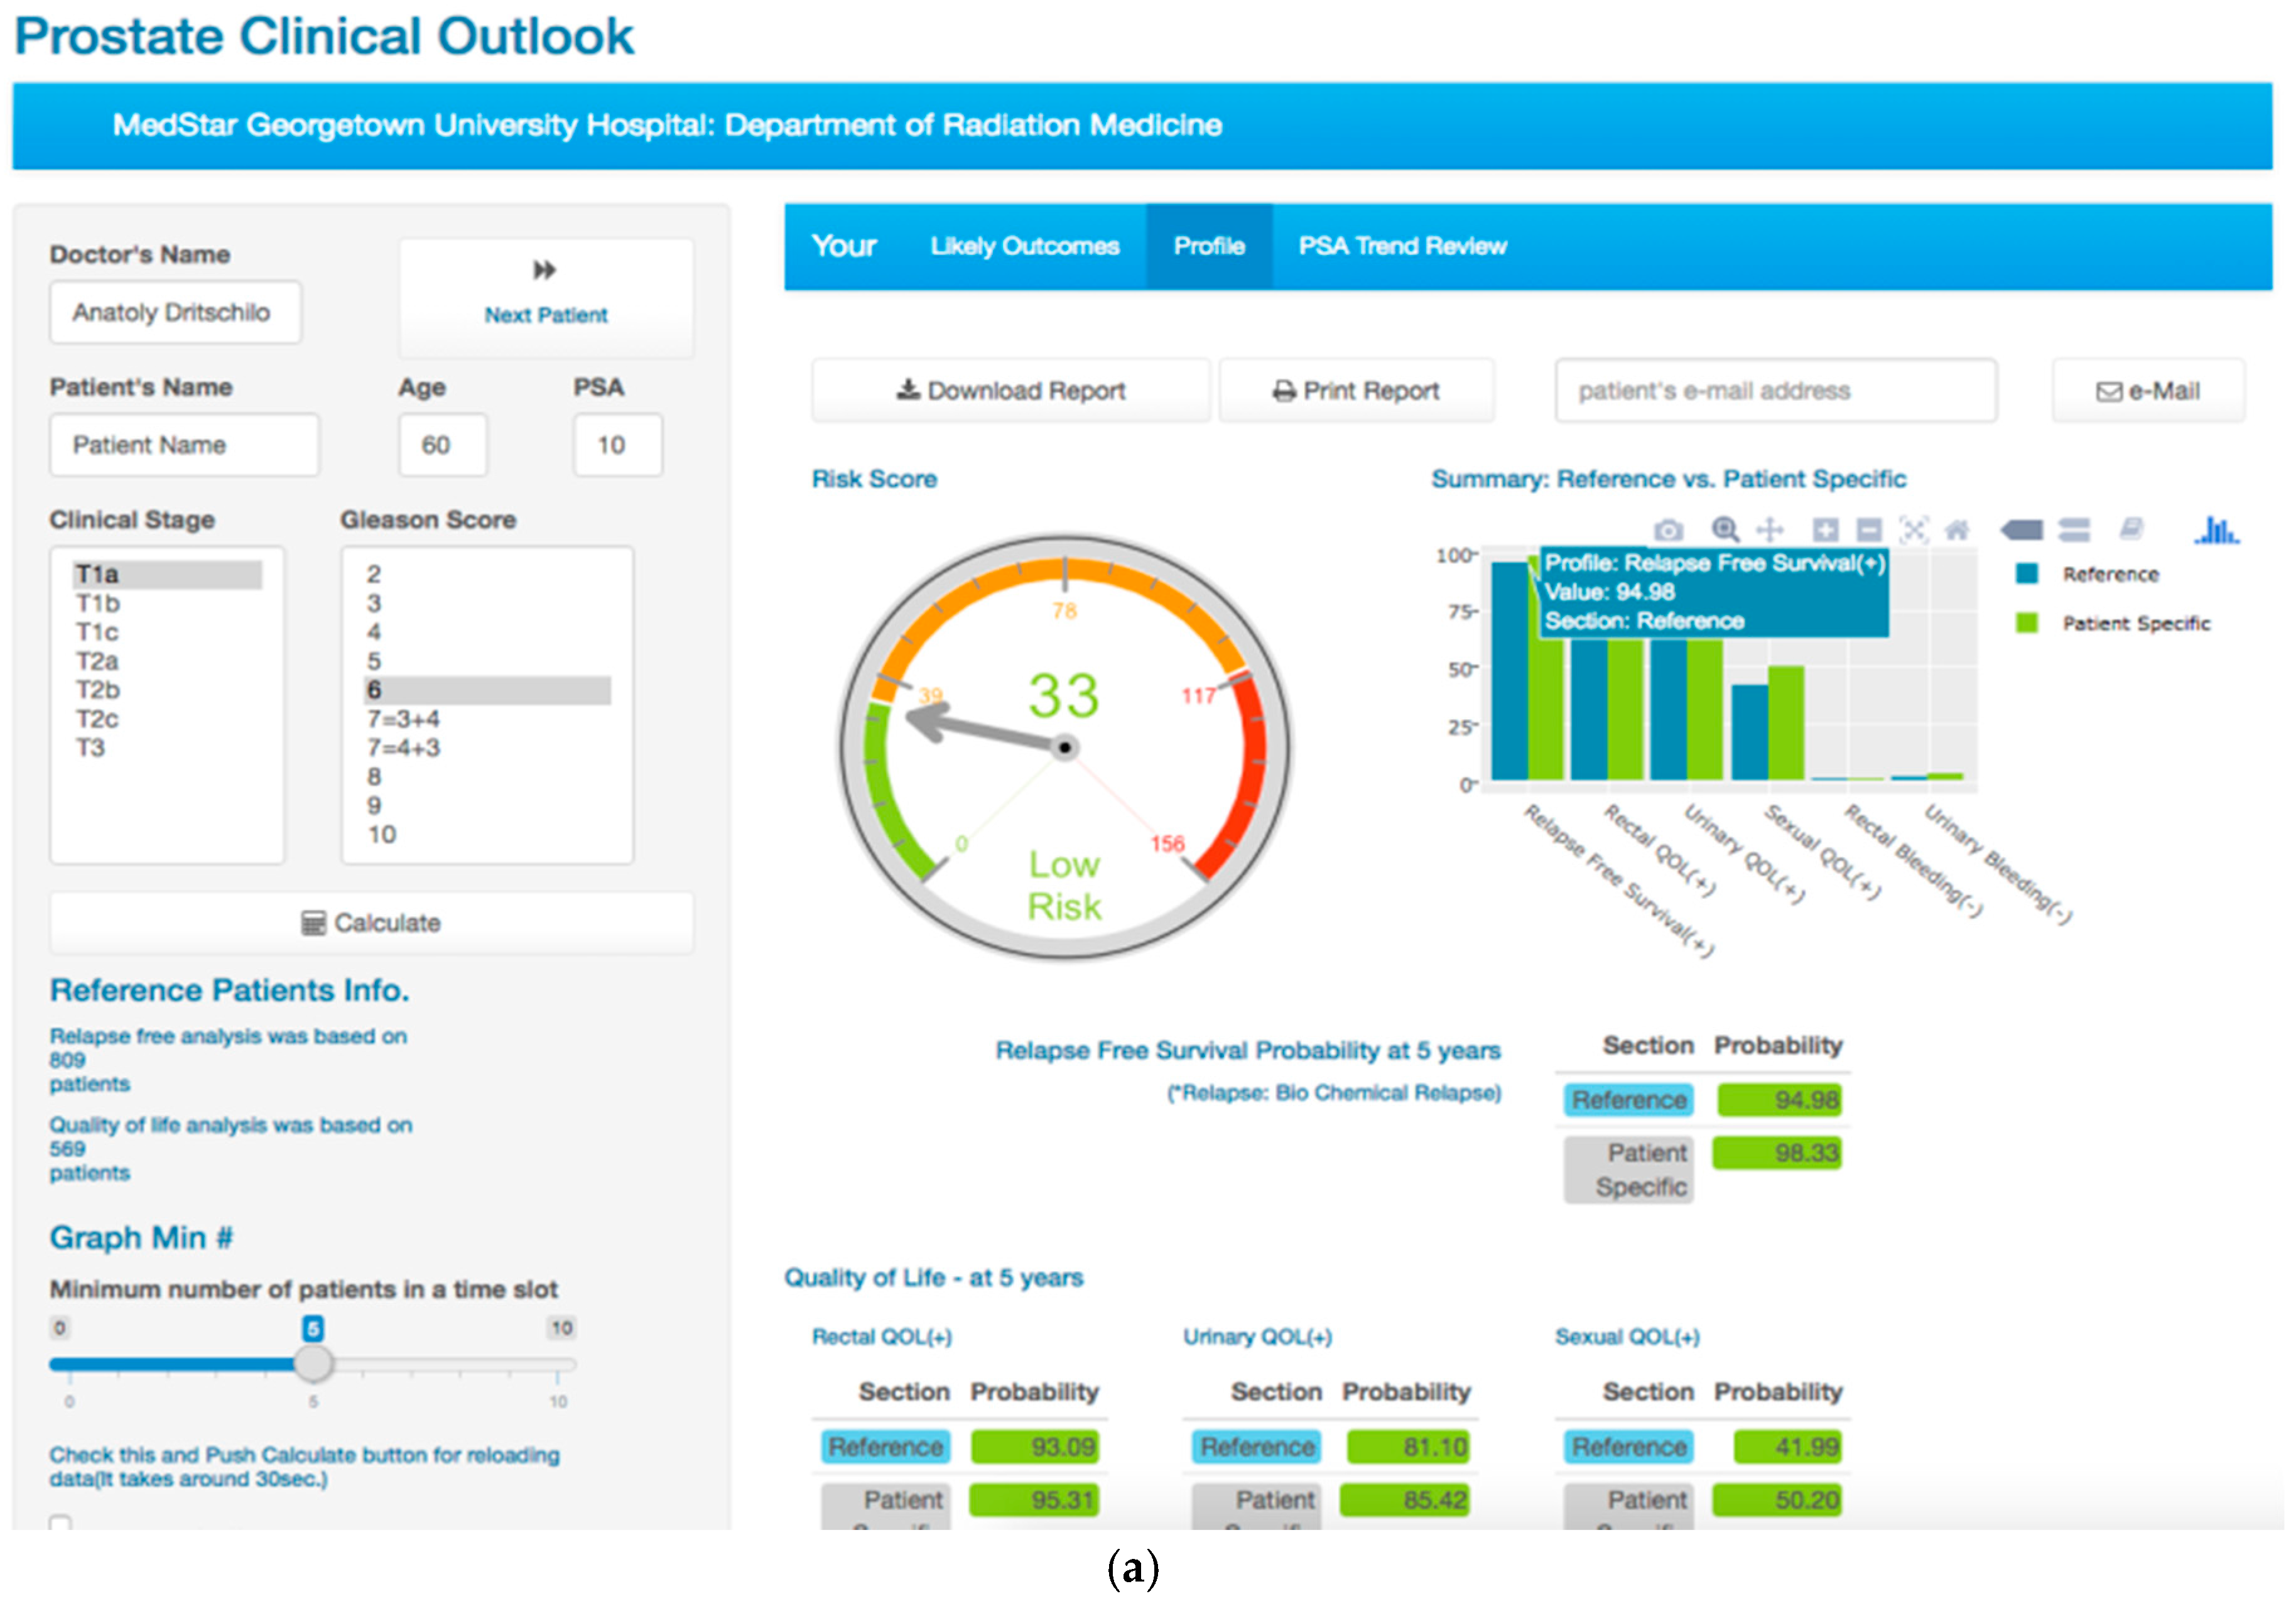
3.1. The Prostate Clinical Outlook Visualization System

For viewers’ understanding, the PCOVS dashboard had a pair of likely outcomes of the patient specific result and reference Cyber-knife SBRT treated patient. The PCOVS showed the evidence based confident comparison results for patient specific likely outcome vs. reference patient data. The reference outcome data is gathered and managed by the owner of the original outcome data. Physicians determined the difference between the two data groups with comparison plots and discussed these results with their patients. The discussion based upon the system generated report allowed for a greater understanding of the options by the patient.
The PCOVS encapsulated statistics module and visualization module integrated architecture allowed for the patient and physician to focus on the genuine purpose of oncology medicine, namely the quality of life.

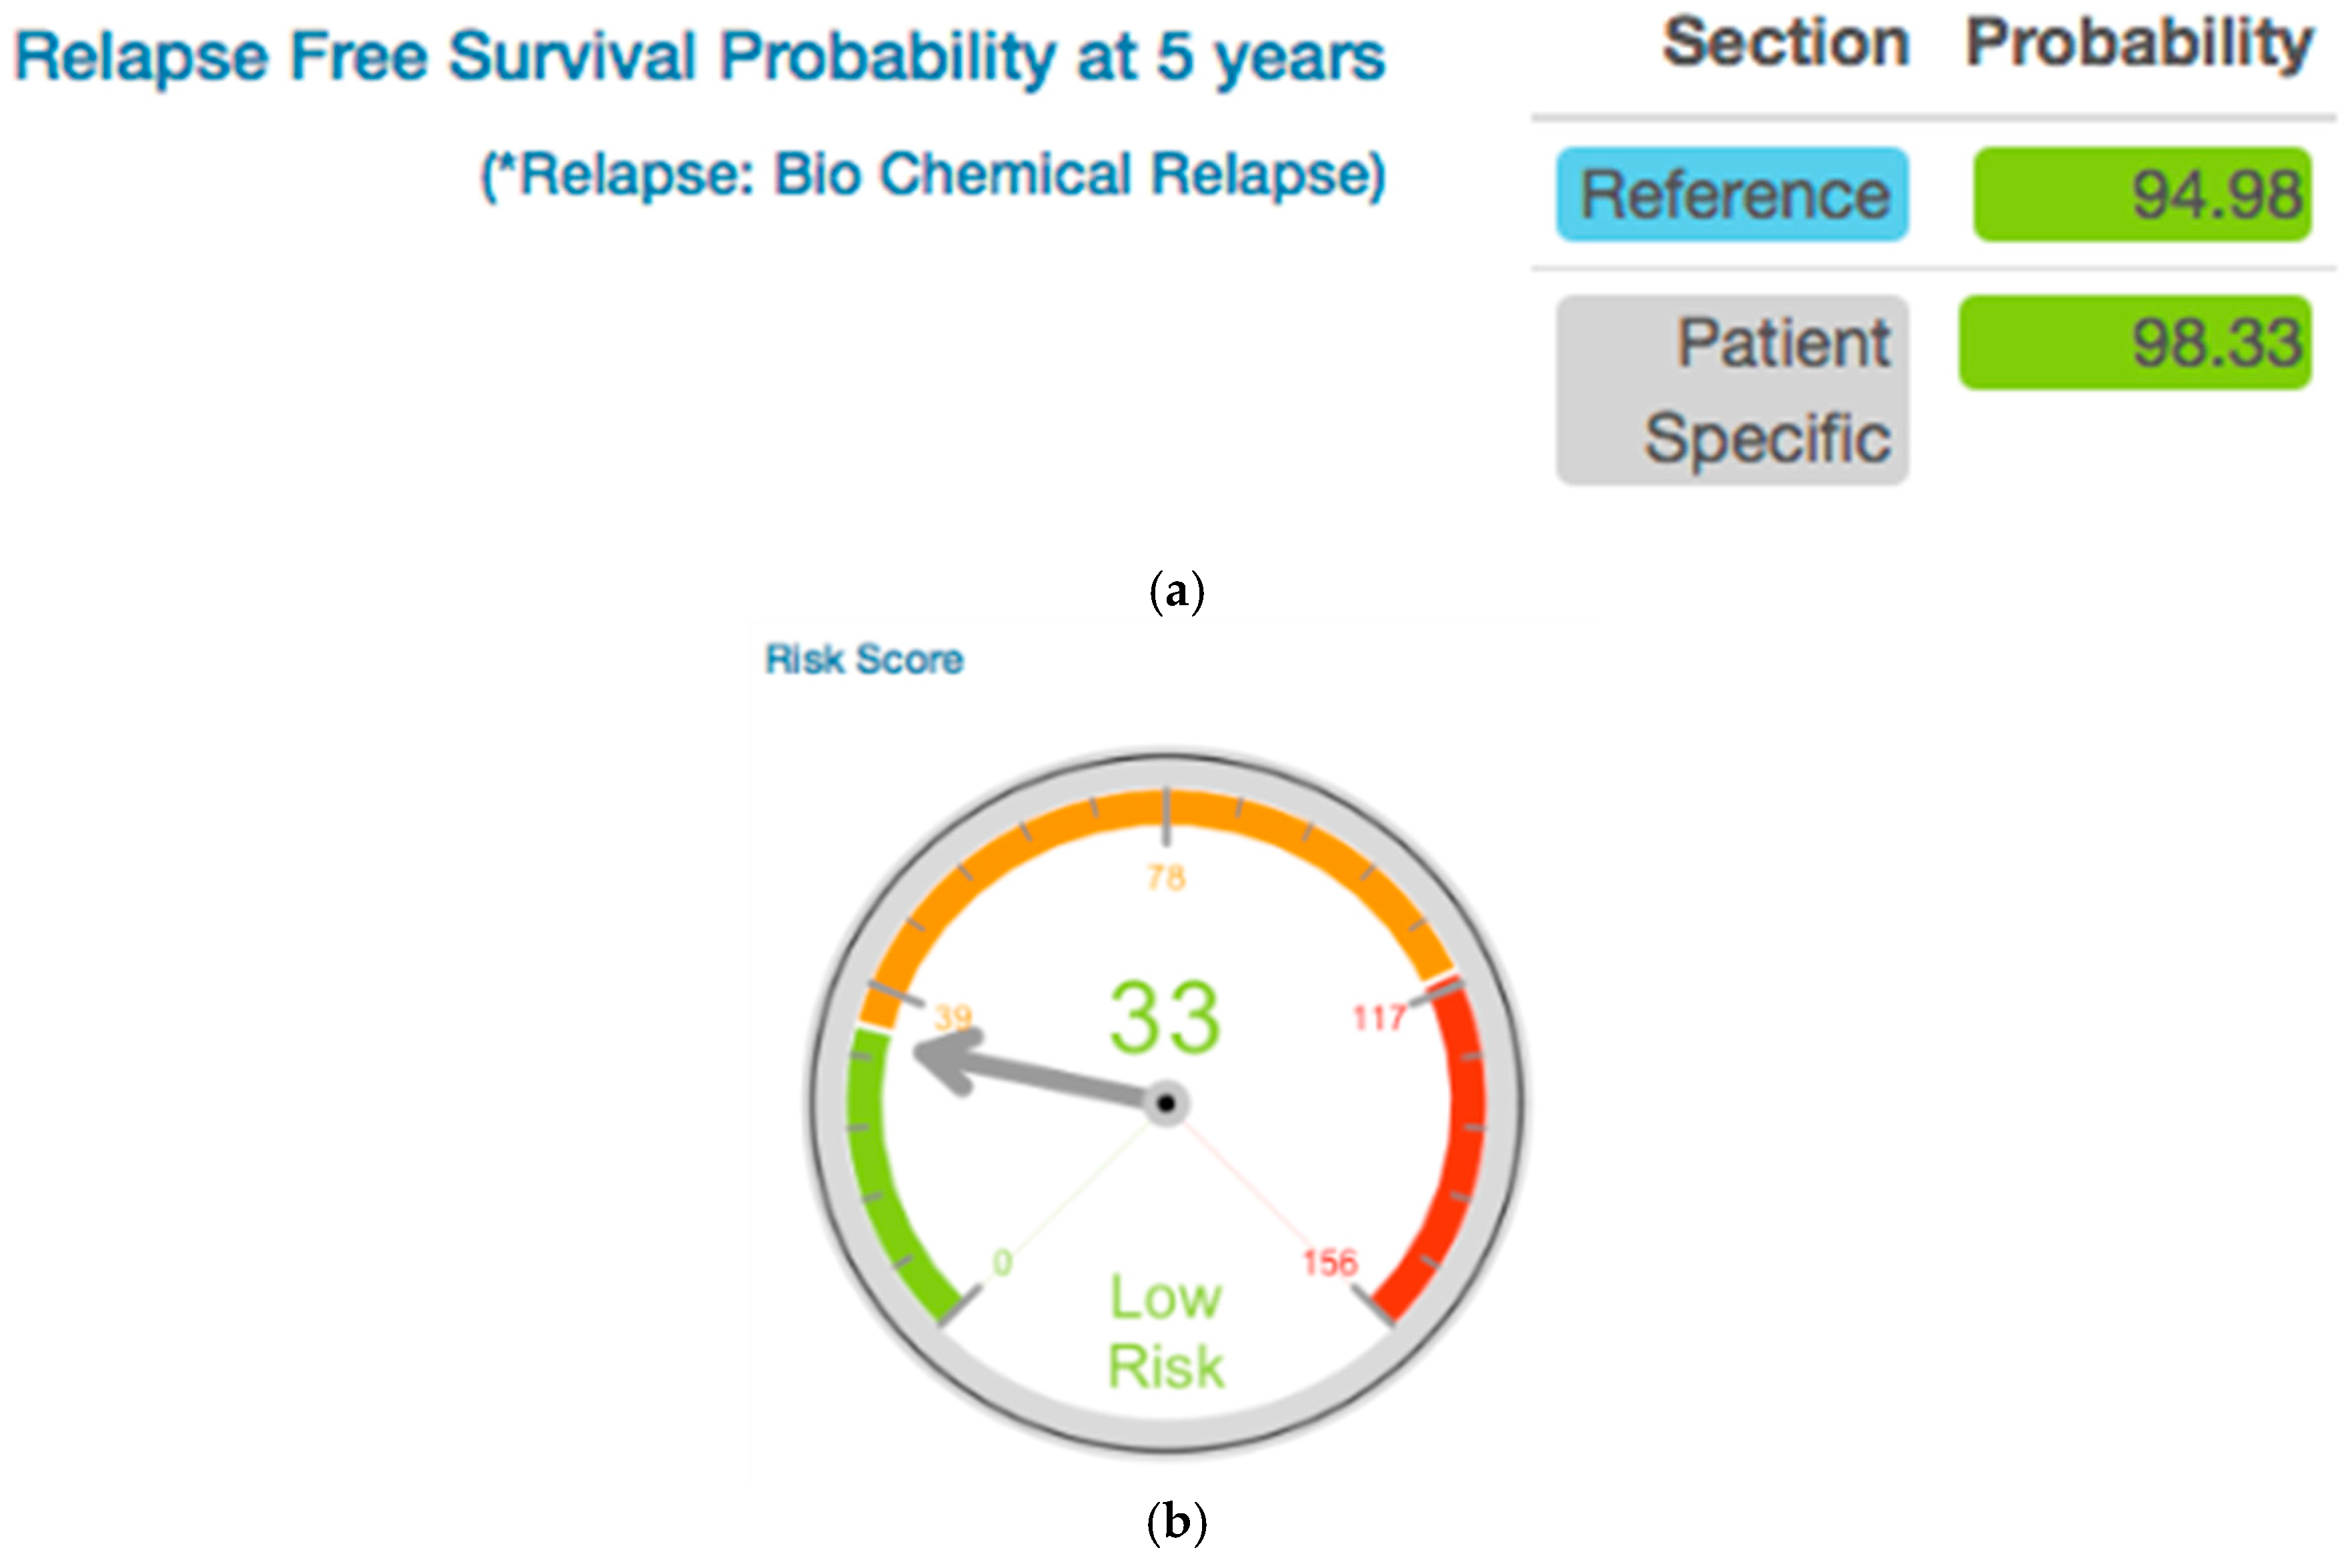
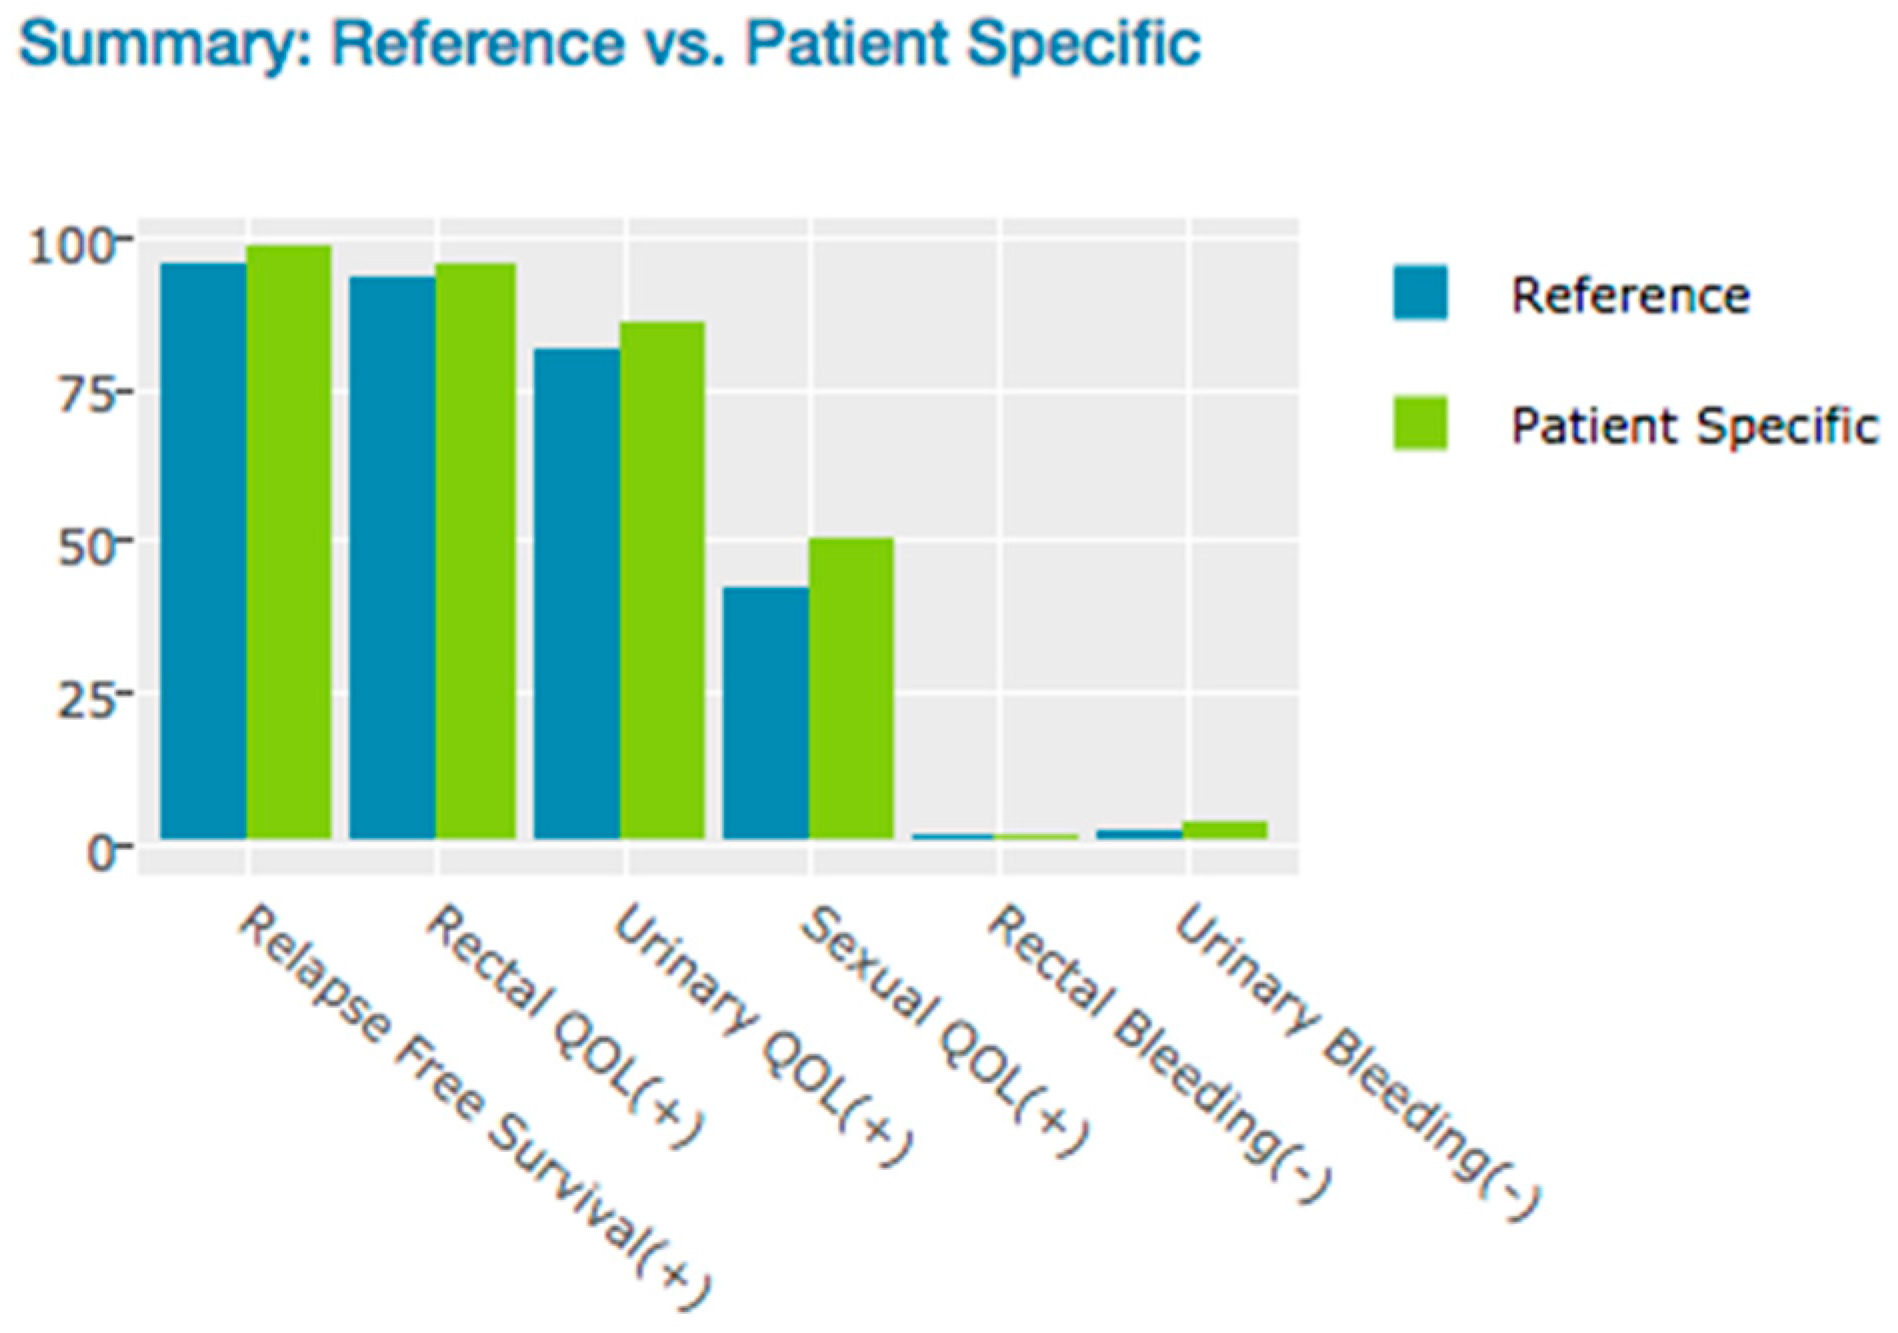
3.1.1. Likely Outcome Visualization (Patient Specific Data vs. Reference Cyberknife Treated Patient Data)

The PCOVS likely outcome visualization presented comparison creates a result report from the web layout and electronic file to a print out. The PCOVS web layout was created so that the patient can understand what their future likely outcome might look like in reference to Cyber-knife SBRT treated patient data. Patients see the differences from their specific likely outcome and reference outcome through intuitive charts, such as the risk score gauge meter style chart, the risk free comparison bar plot style chart, and risk probability chart for each quality of life factors (Figure 3).
The PCOVS generated likely outcome results can be downloaded for digital file creation, printed, or e-mailed. The Physician can select the print-out method, and can hit the reset button to clear all the present data.
Because the PCOVS likely outcome screen was designed to fit a tablet screen, the user can also use mobile devices in the same network environment of the PCOVS server. The back-end functions, such as managing data, displaying the likely outcomes, and emailing the resulting pdf file does not need to be developed for mobile devices. One simply opens the PCOVS web server address on the web browser, and that allows for the PCOVS mobile users’ functions to be accessed.

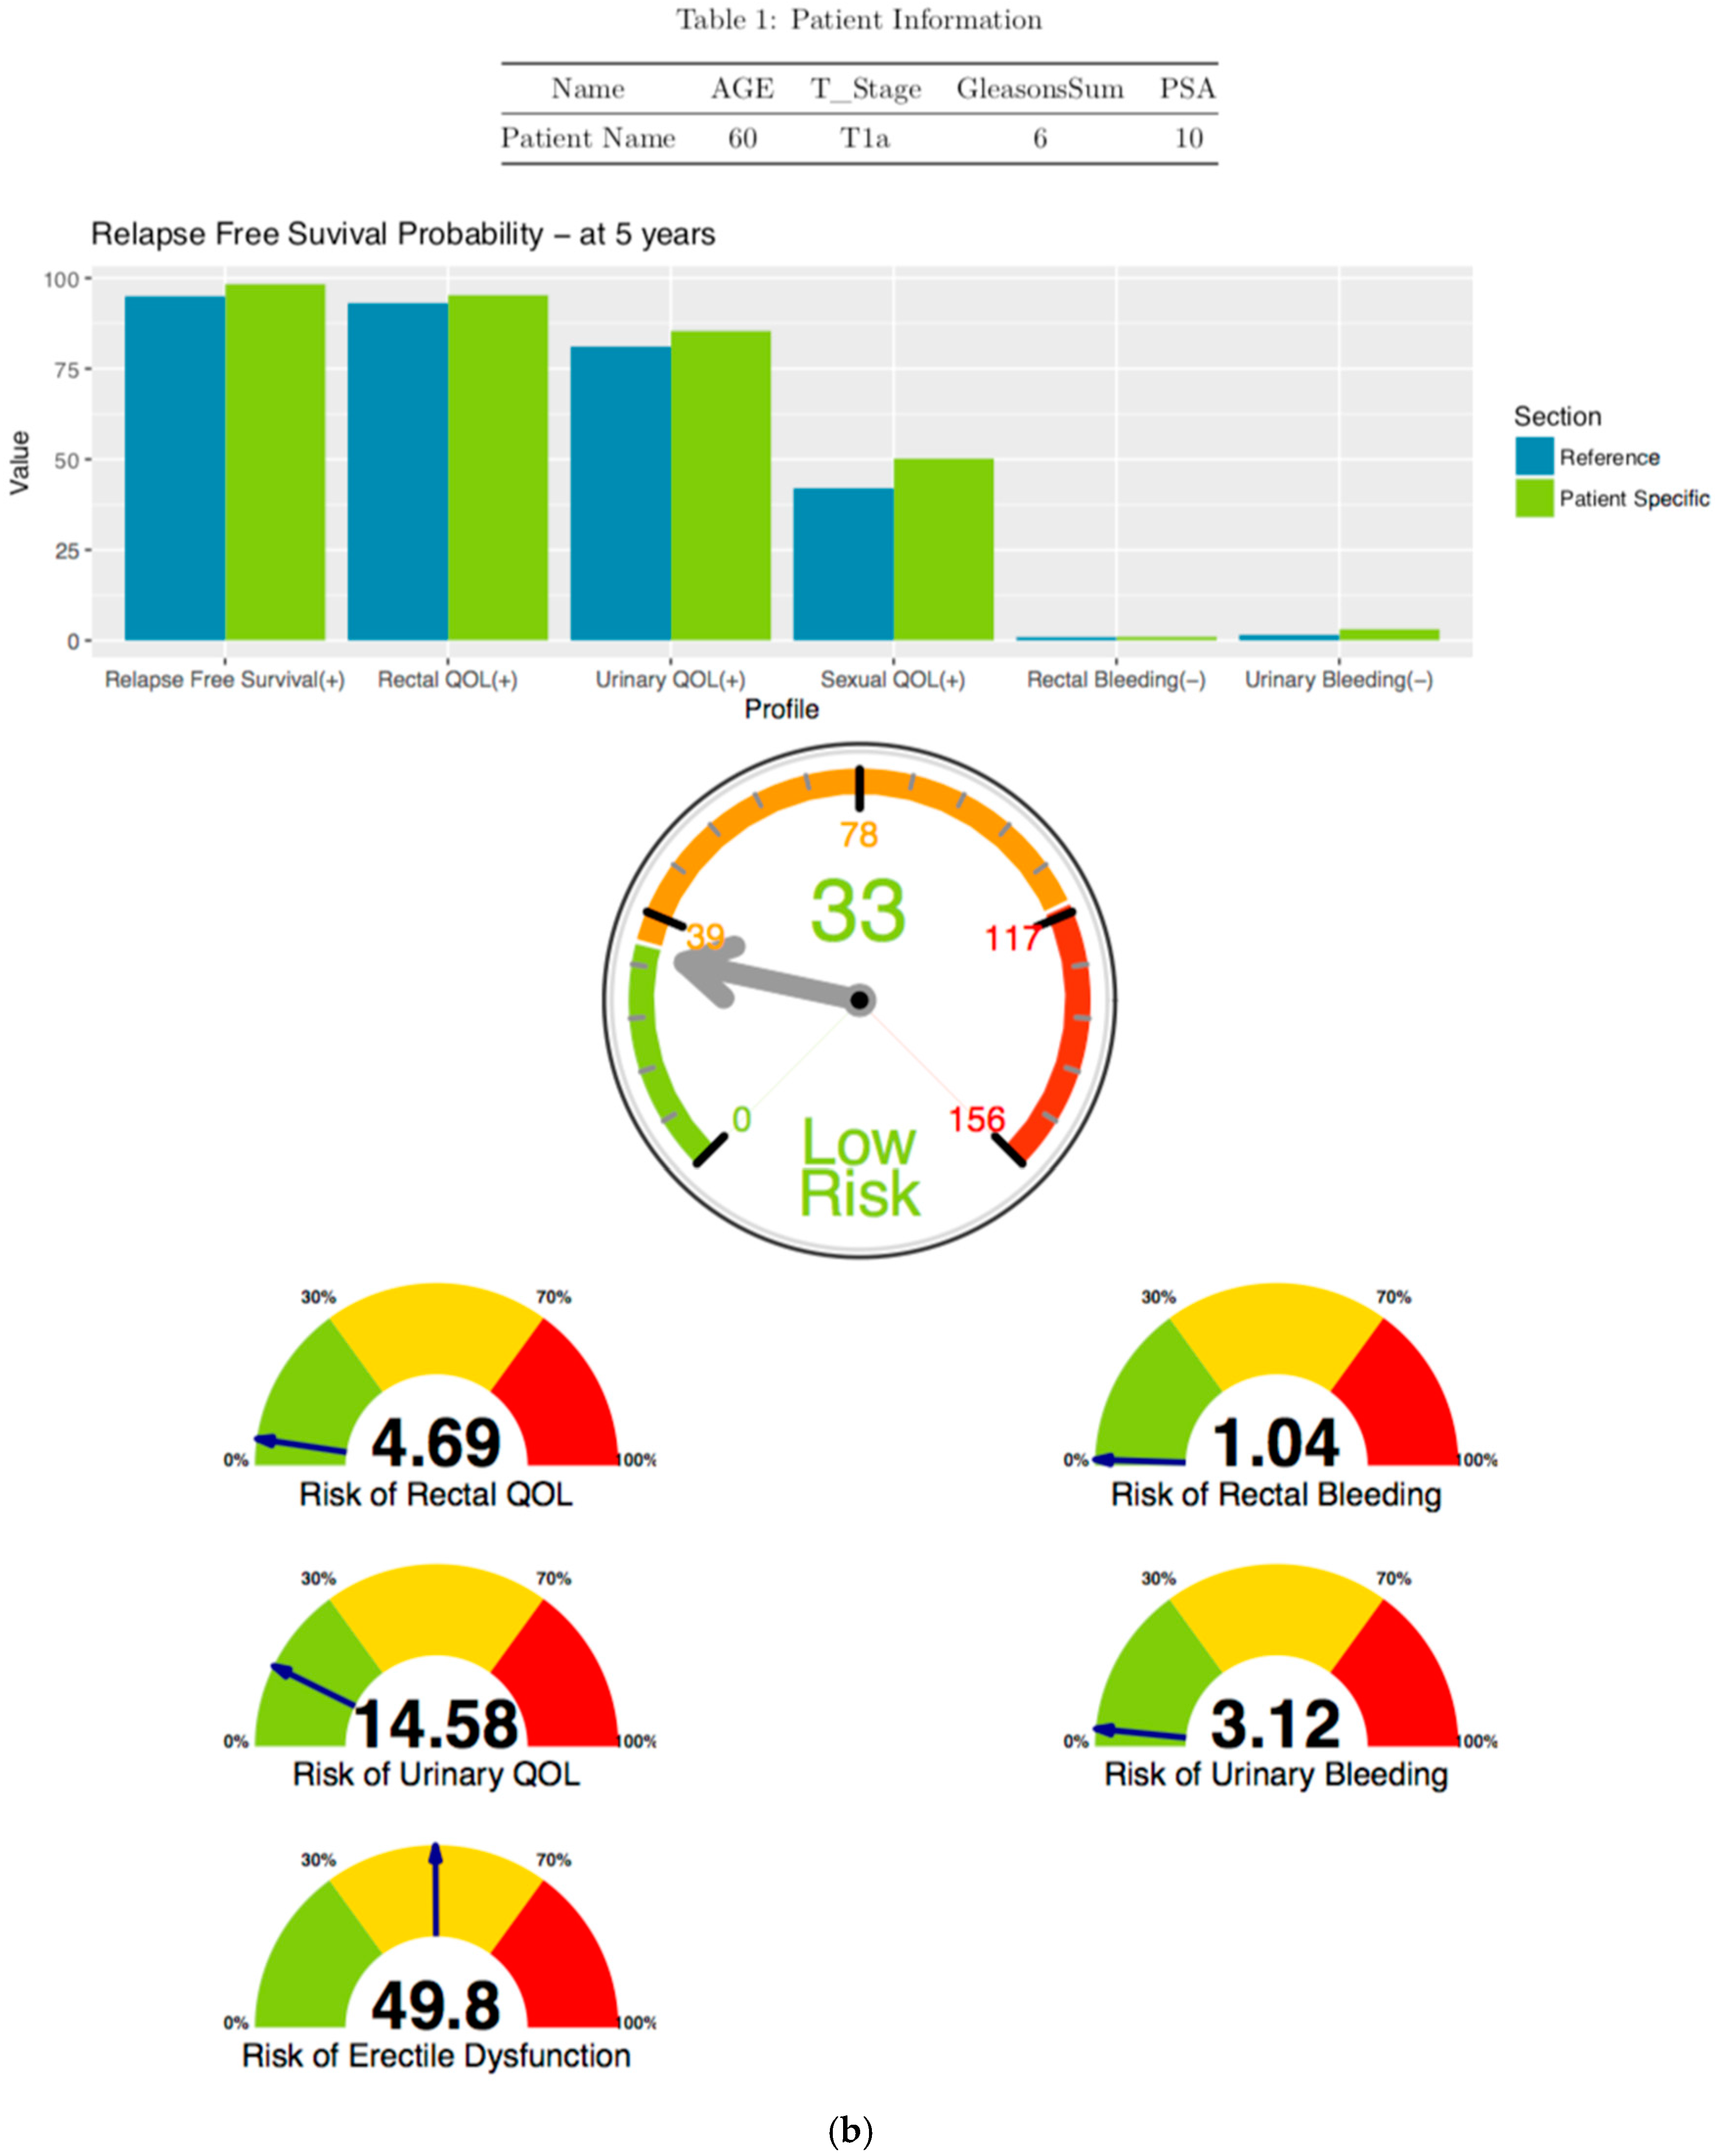
3.1.2. Disease Free Survival Likely Outcome Visualization

In the PCOVS, disease-free survival means the freedom of biochemical recurrence (BCR). The BCR definition in the PCOVS is the ASTRO definition [9]. The PCOVS created Kaplan-Meier survival curves from the BCR time point data [11]. The PCOVS visualized disease free survival rate at five years for patient specific data when comparing to the stored treated patient data. Using new patient’s information, such as age, clinical stage, Gleason score, and pre-treatment PSA value, the PCOVS calculated risk scores of BCR for the patient. The PCOVS visualized the risk score and displays the data using a gauge style chart. In the risk score gauge chart, risk groups were distinguished by three colors; green for low risk, orange for intermediate risk, and red for high risk (Figure 4). The PCOVS visualized BCR free probability and risk scores together increase the patient’s understanding of their status and risk level.

3.1.3. Risk Free Profile Visualization

Summary plot (Figure 5) included positive QOL and Negative QOL. Positive QOL consists of Relapse Free Survival, Rectal QOL, and Urinary QOL. Negative QOL consists of Rectal Bleeding and Urinary Bleeding. The physician uses this plot for comparison from patient specific scores and reference scores. In the Figure 5, patient’s positive QOL scores are higher than reference and a slightly higher risk of Urinary Bleeding score than reference.

3.2. Longitudinal Trend for Visualization (Patient Specific Data vs. Reference SBRT Treated Patient Data)

With longitudinal trend visualization, physicians saw the outcome changes by time periods, which expressed after treatment likely outcome. The physician could determine the most significant time point to intervention for the patient. Through the fluctuation of the longitudinal outcome simulation in the PCOVS, the physician referenced the differences of patient specific simulation data to the treated data outcome at a glance.

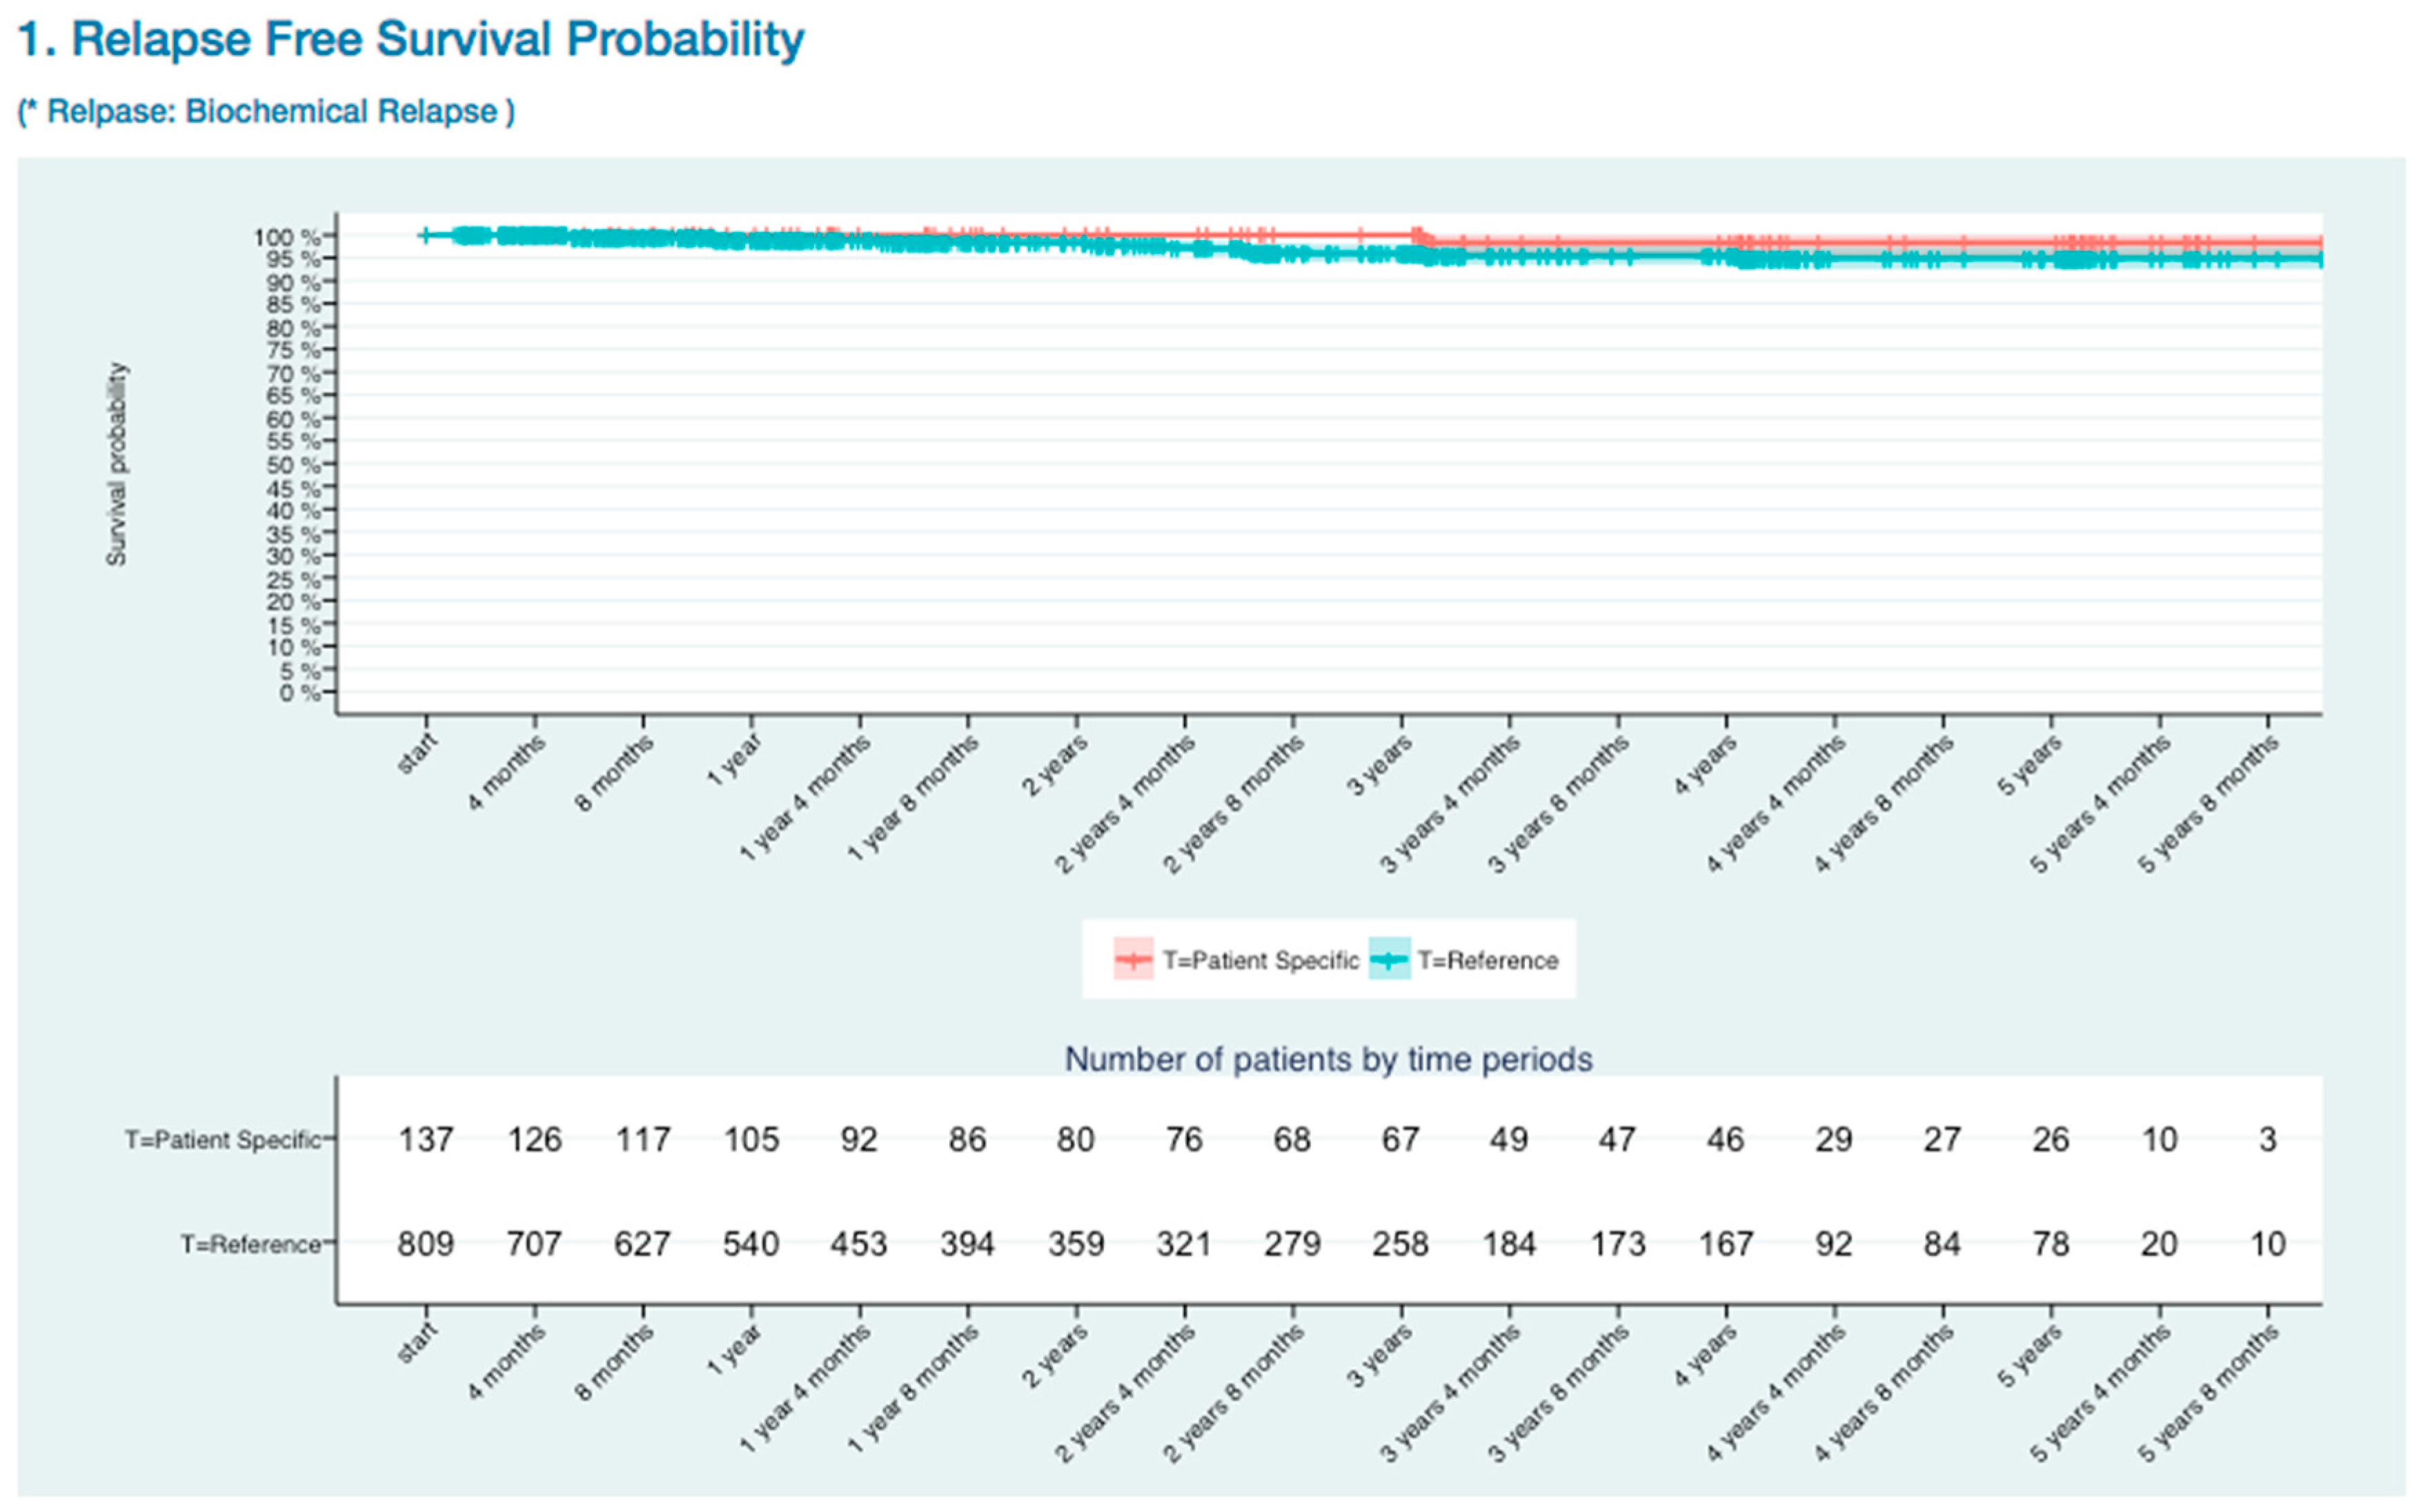
3.2.1. BCR Free Survival Curve Visualization

The blue line presented all existing patients’ survival curve and the red line presents patient specific survival curve. Those small vertical lines along with horizontal line meant censored number of patients. Because of the reference graph had whole BCR-free survival patient data, it was not affected by the number of patients filter in the patient’s information input form. The strata table had number of patients, for each days of time point, calculated by eliminating the number of censored patients. Because the SBRT treated patients had high relapse free survival probability, it was important to focus on the quality of life of patients (Figure 6).

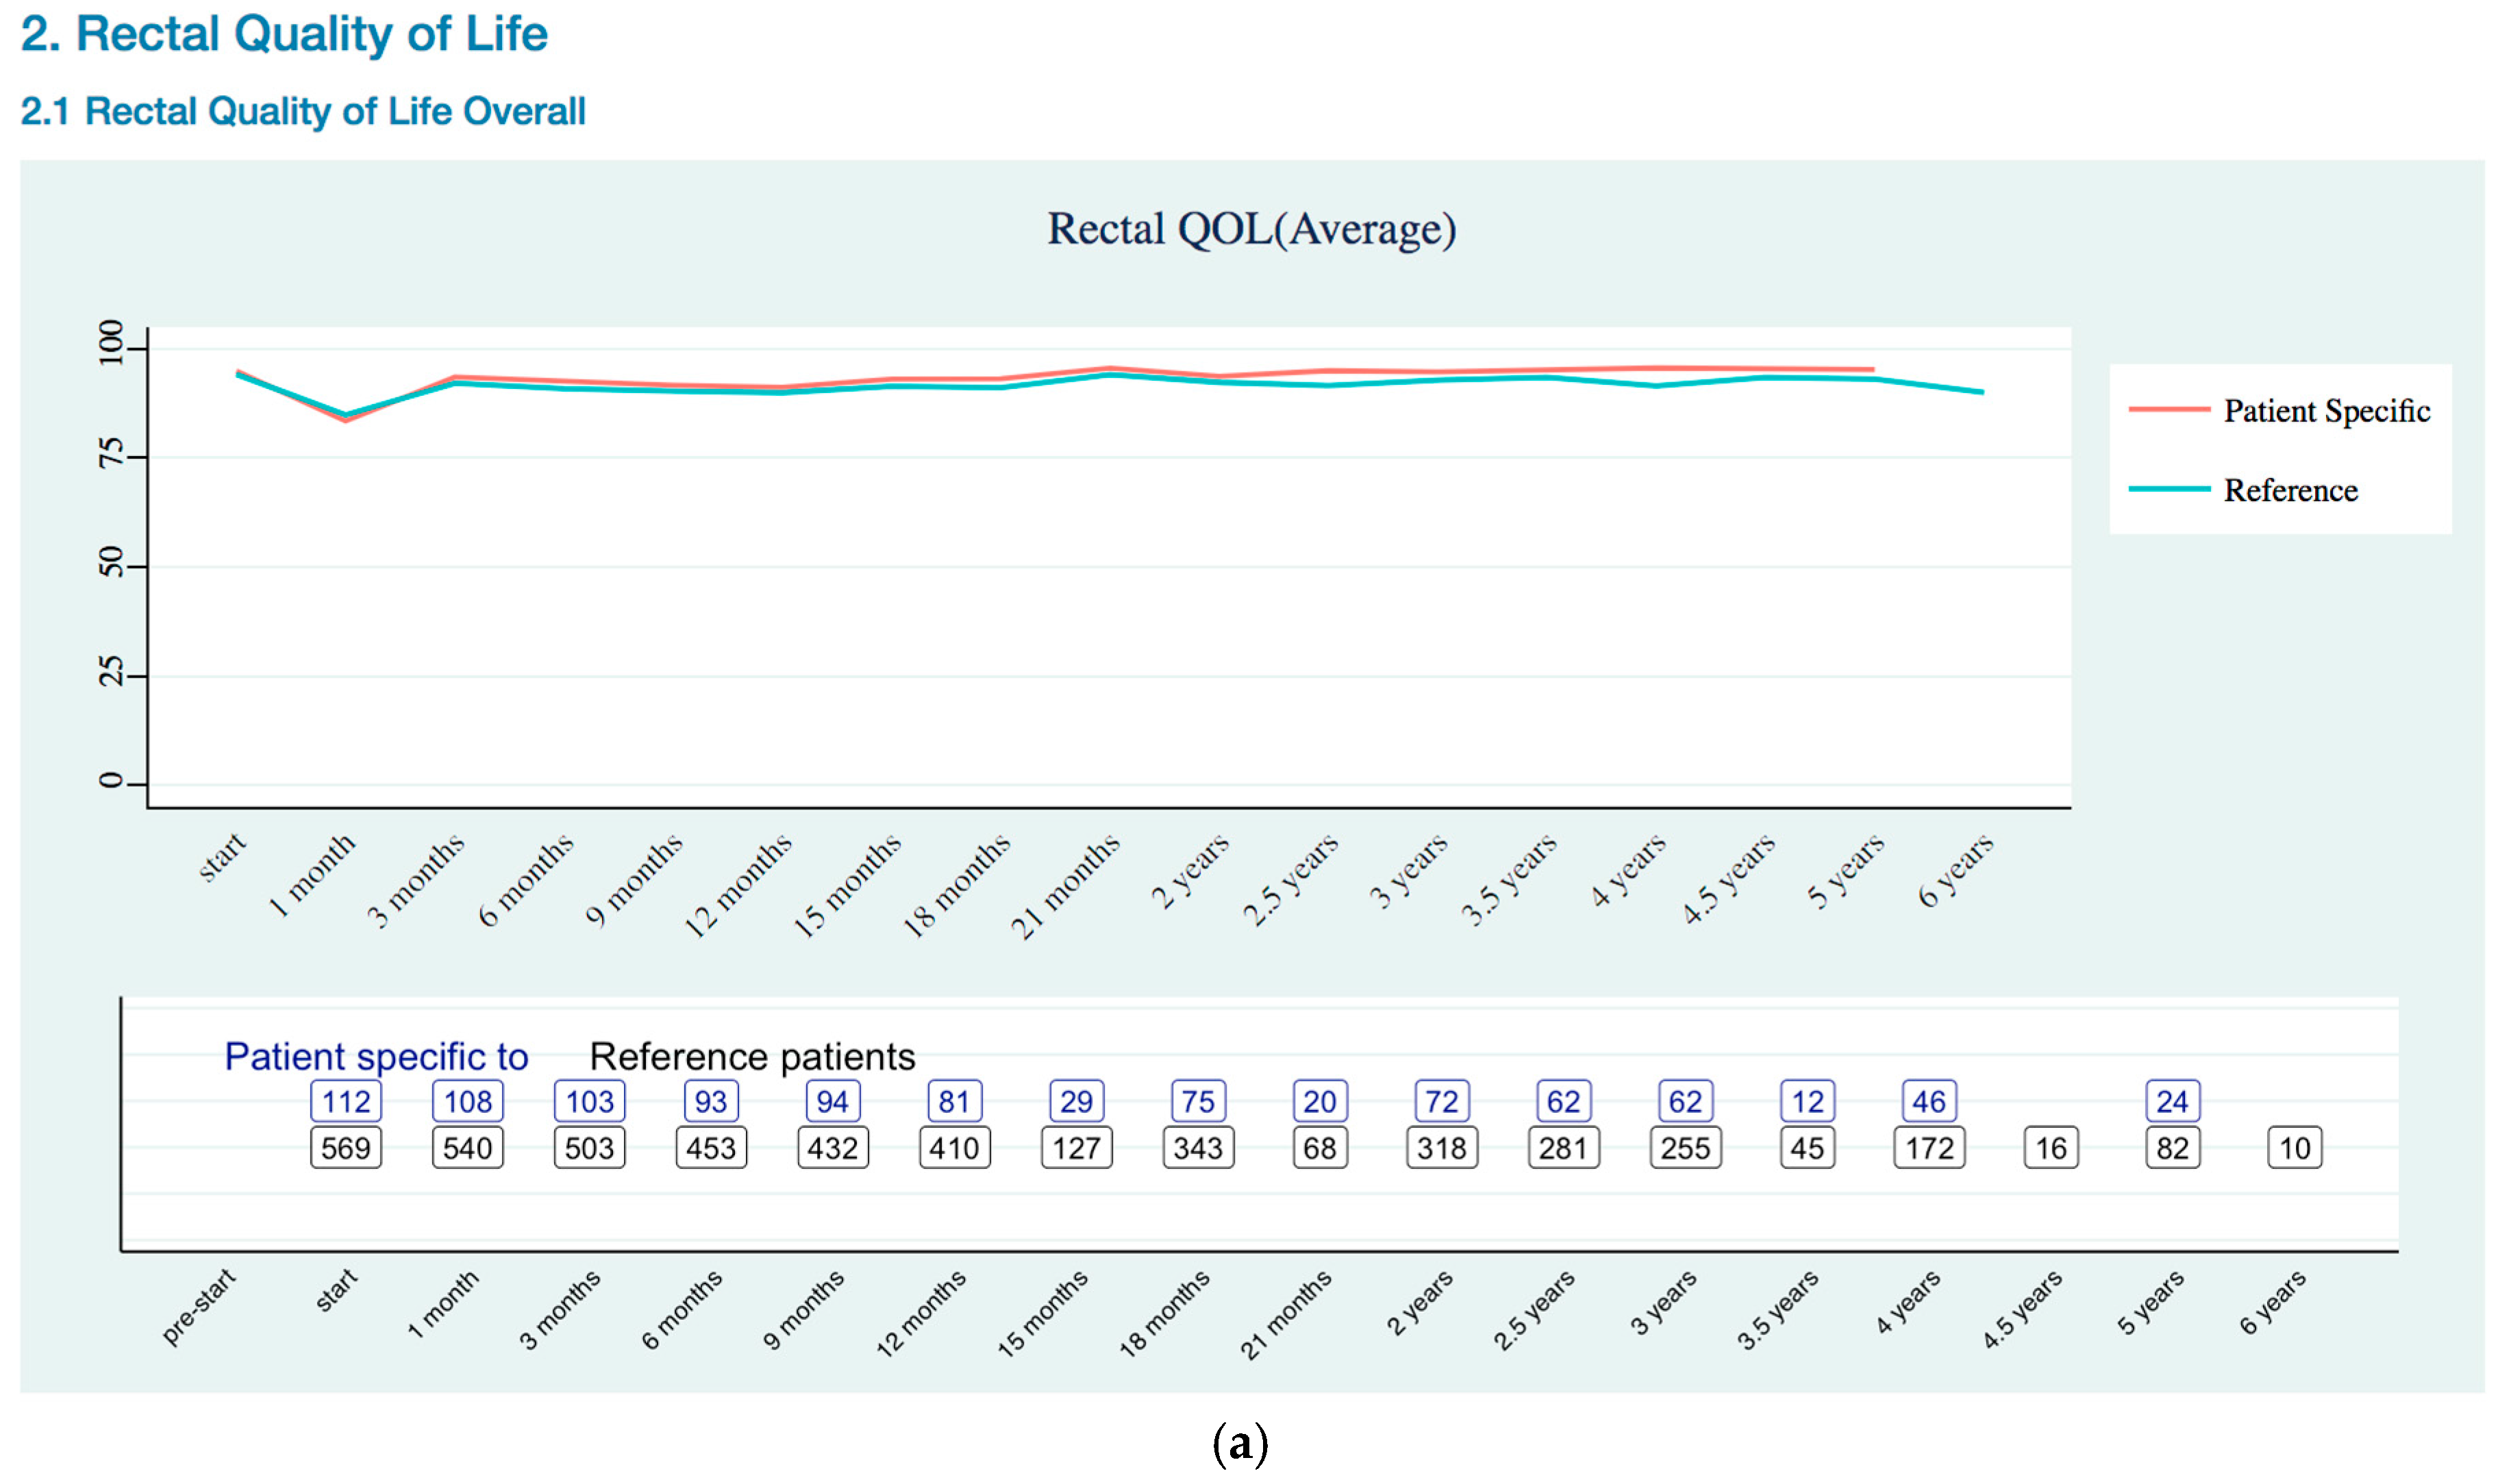
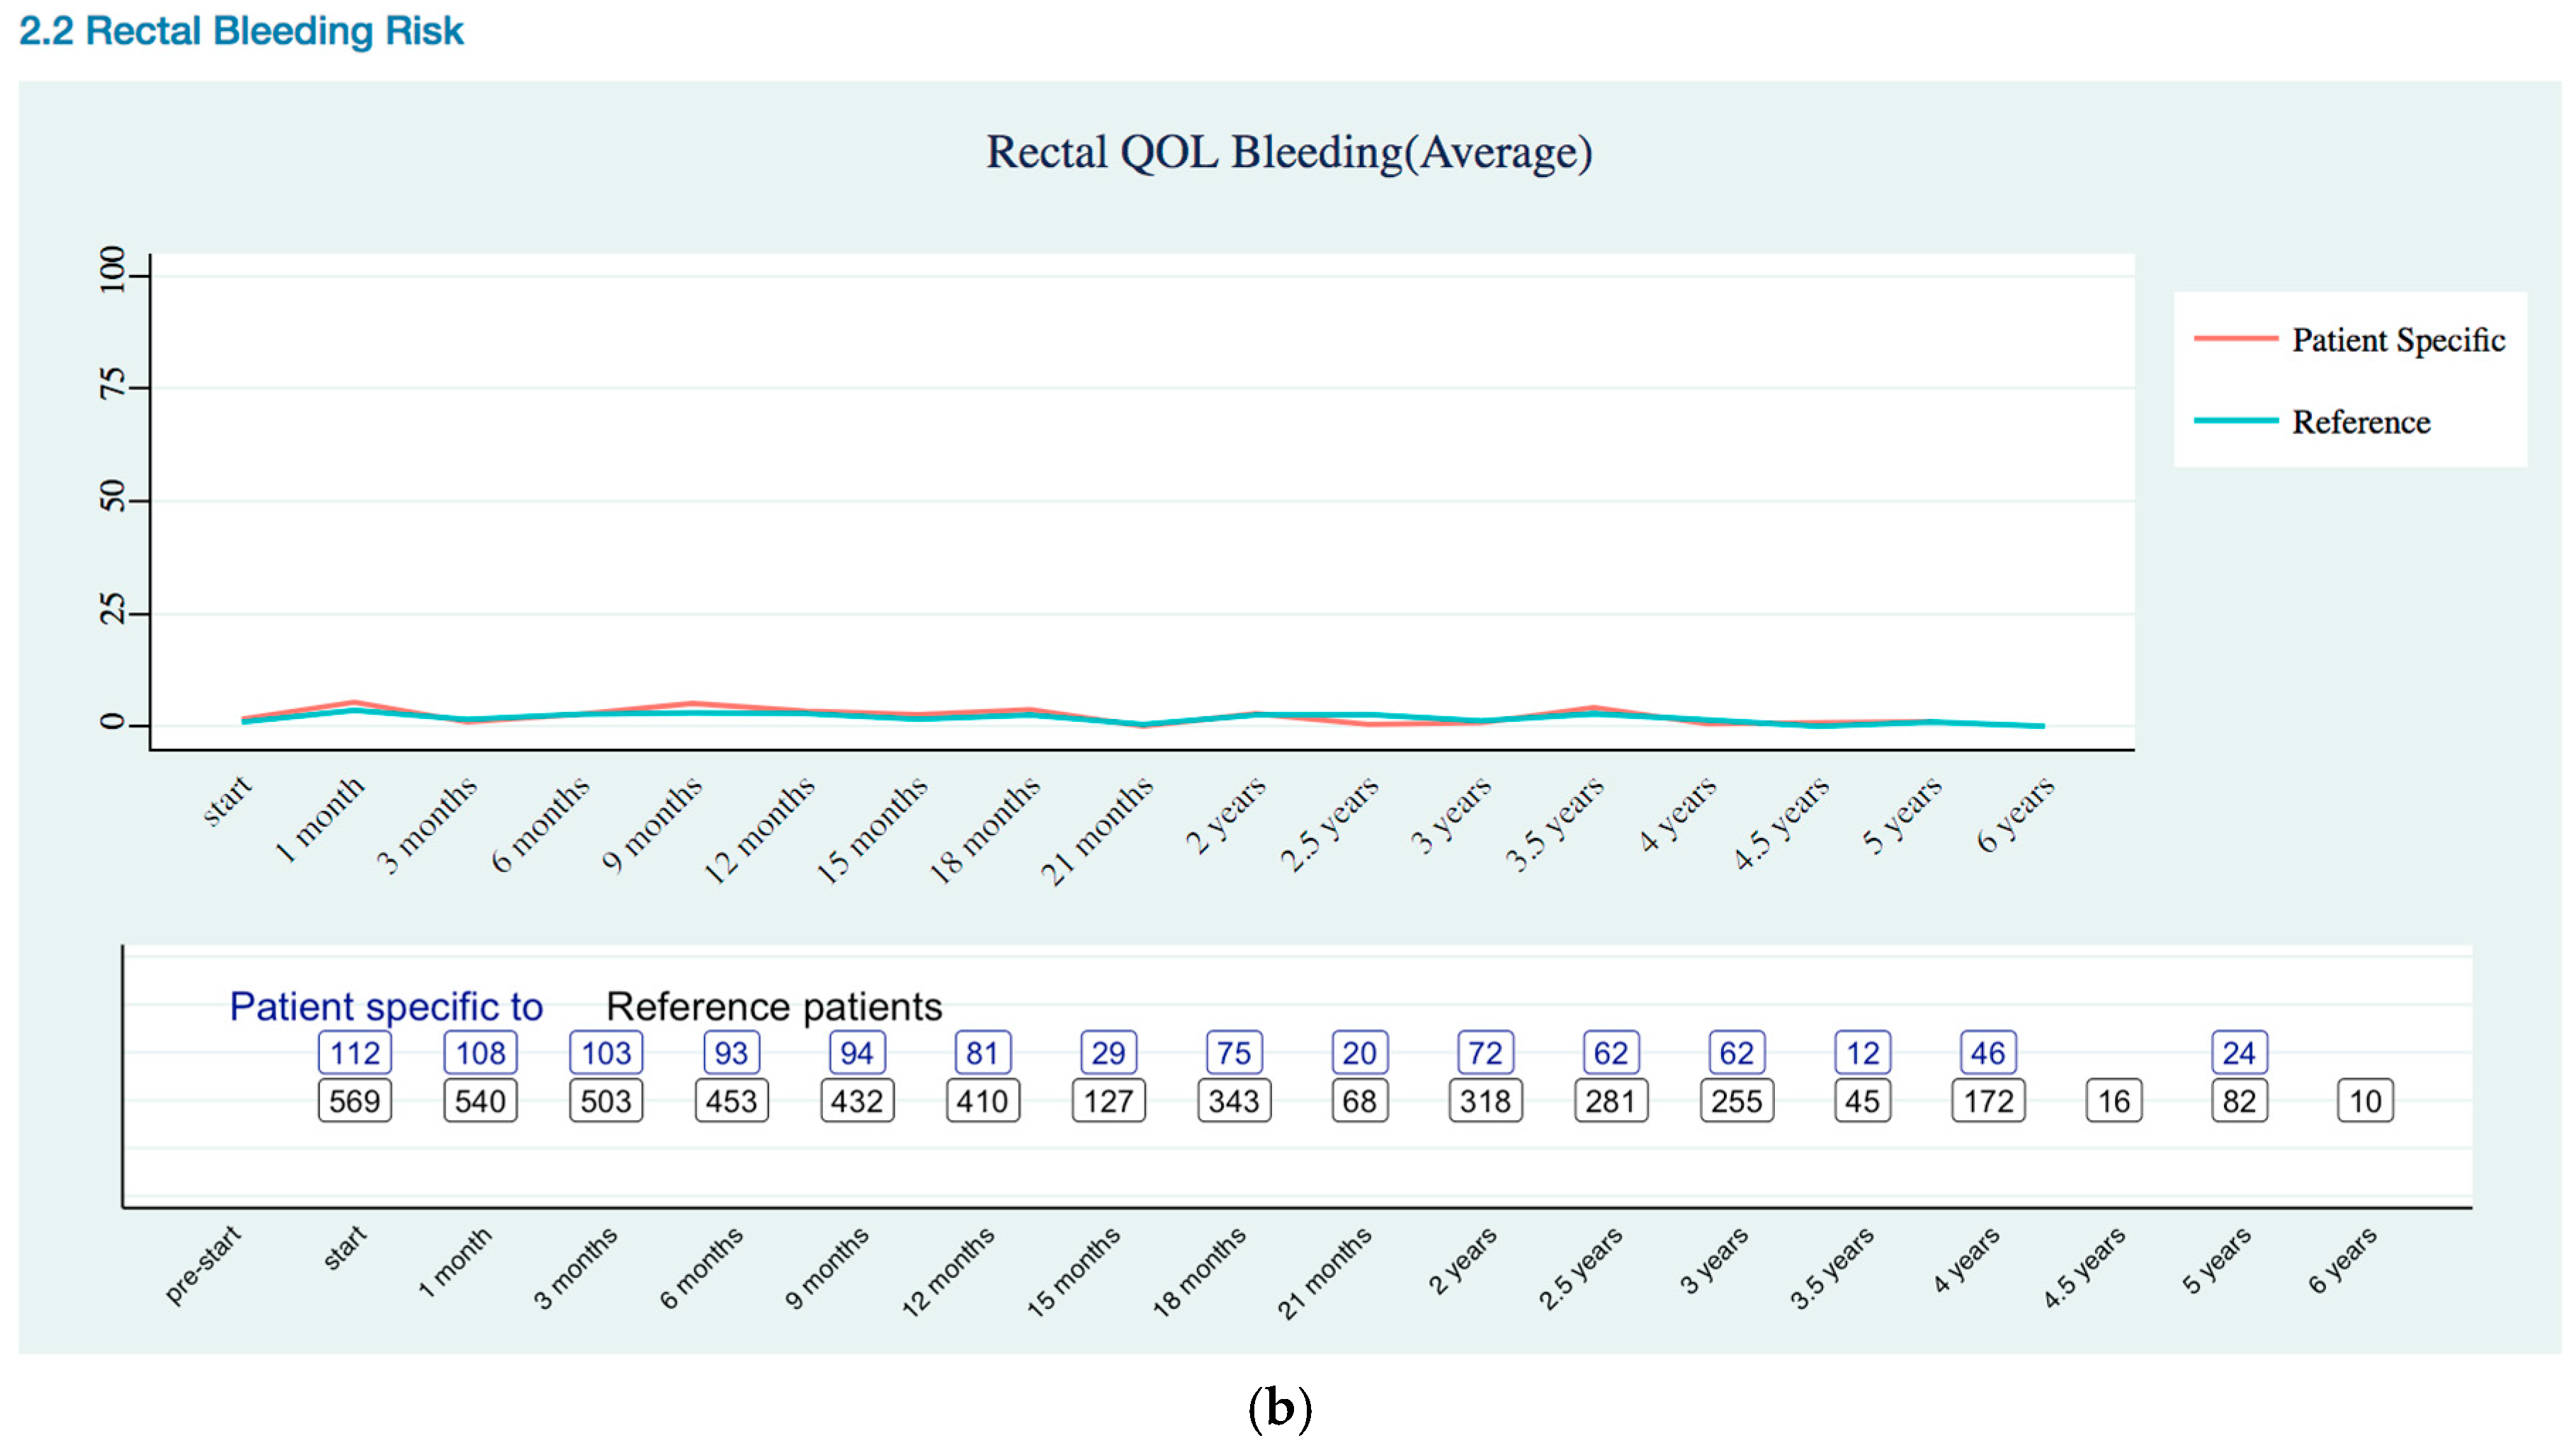
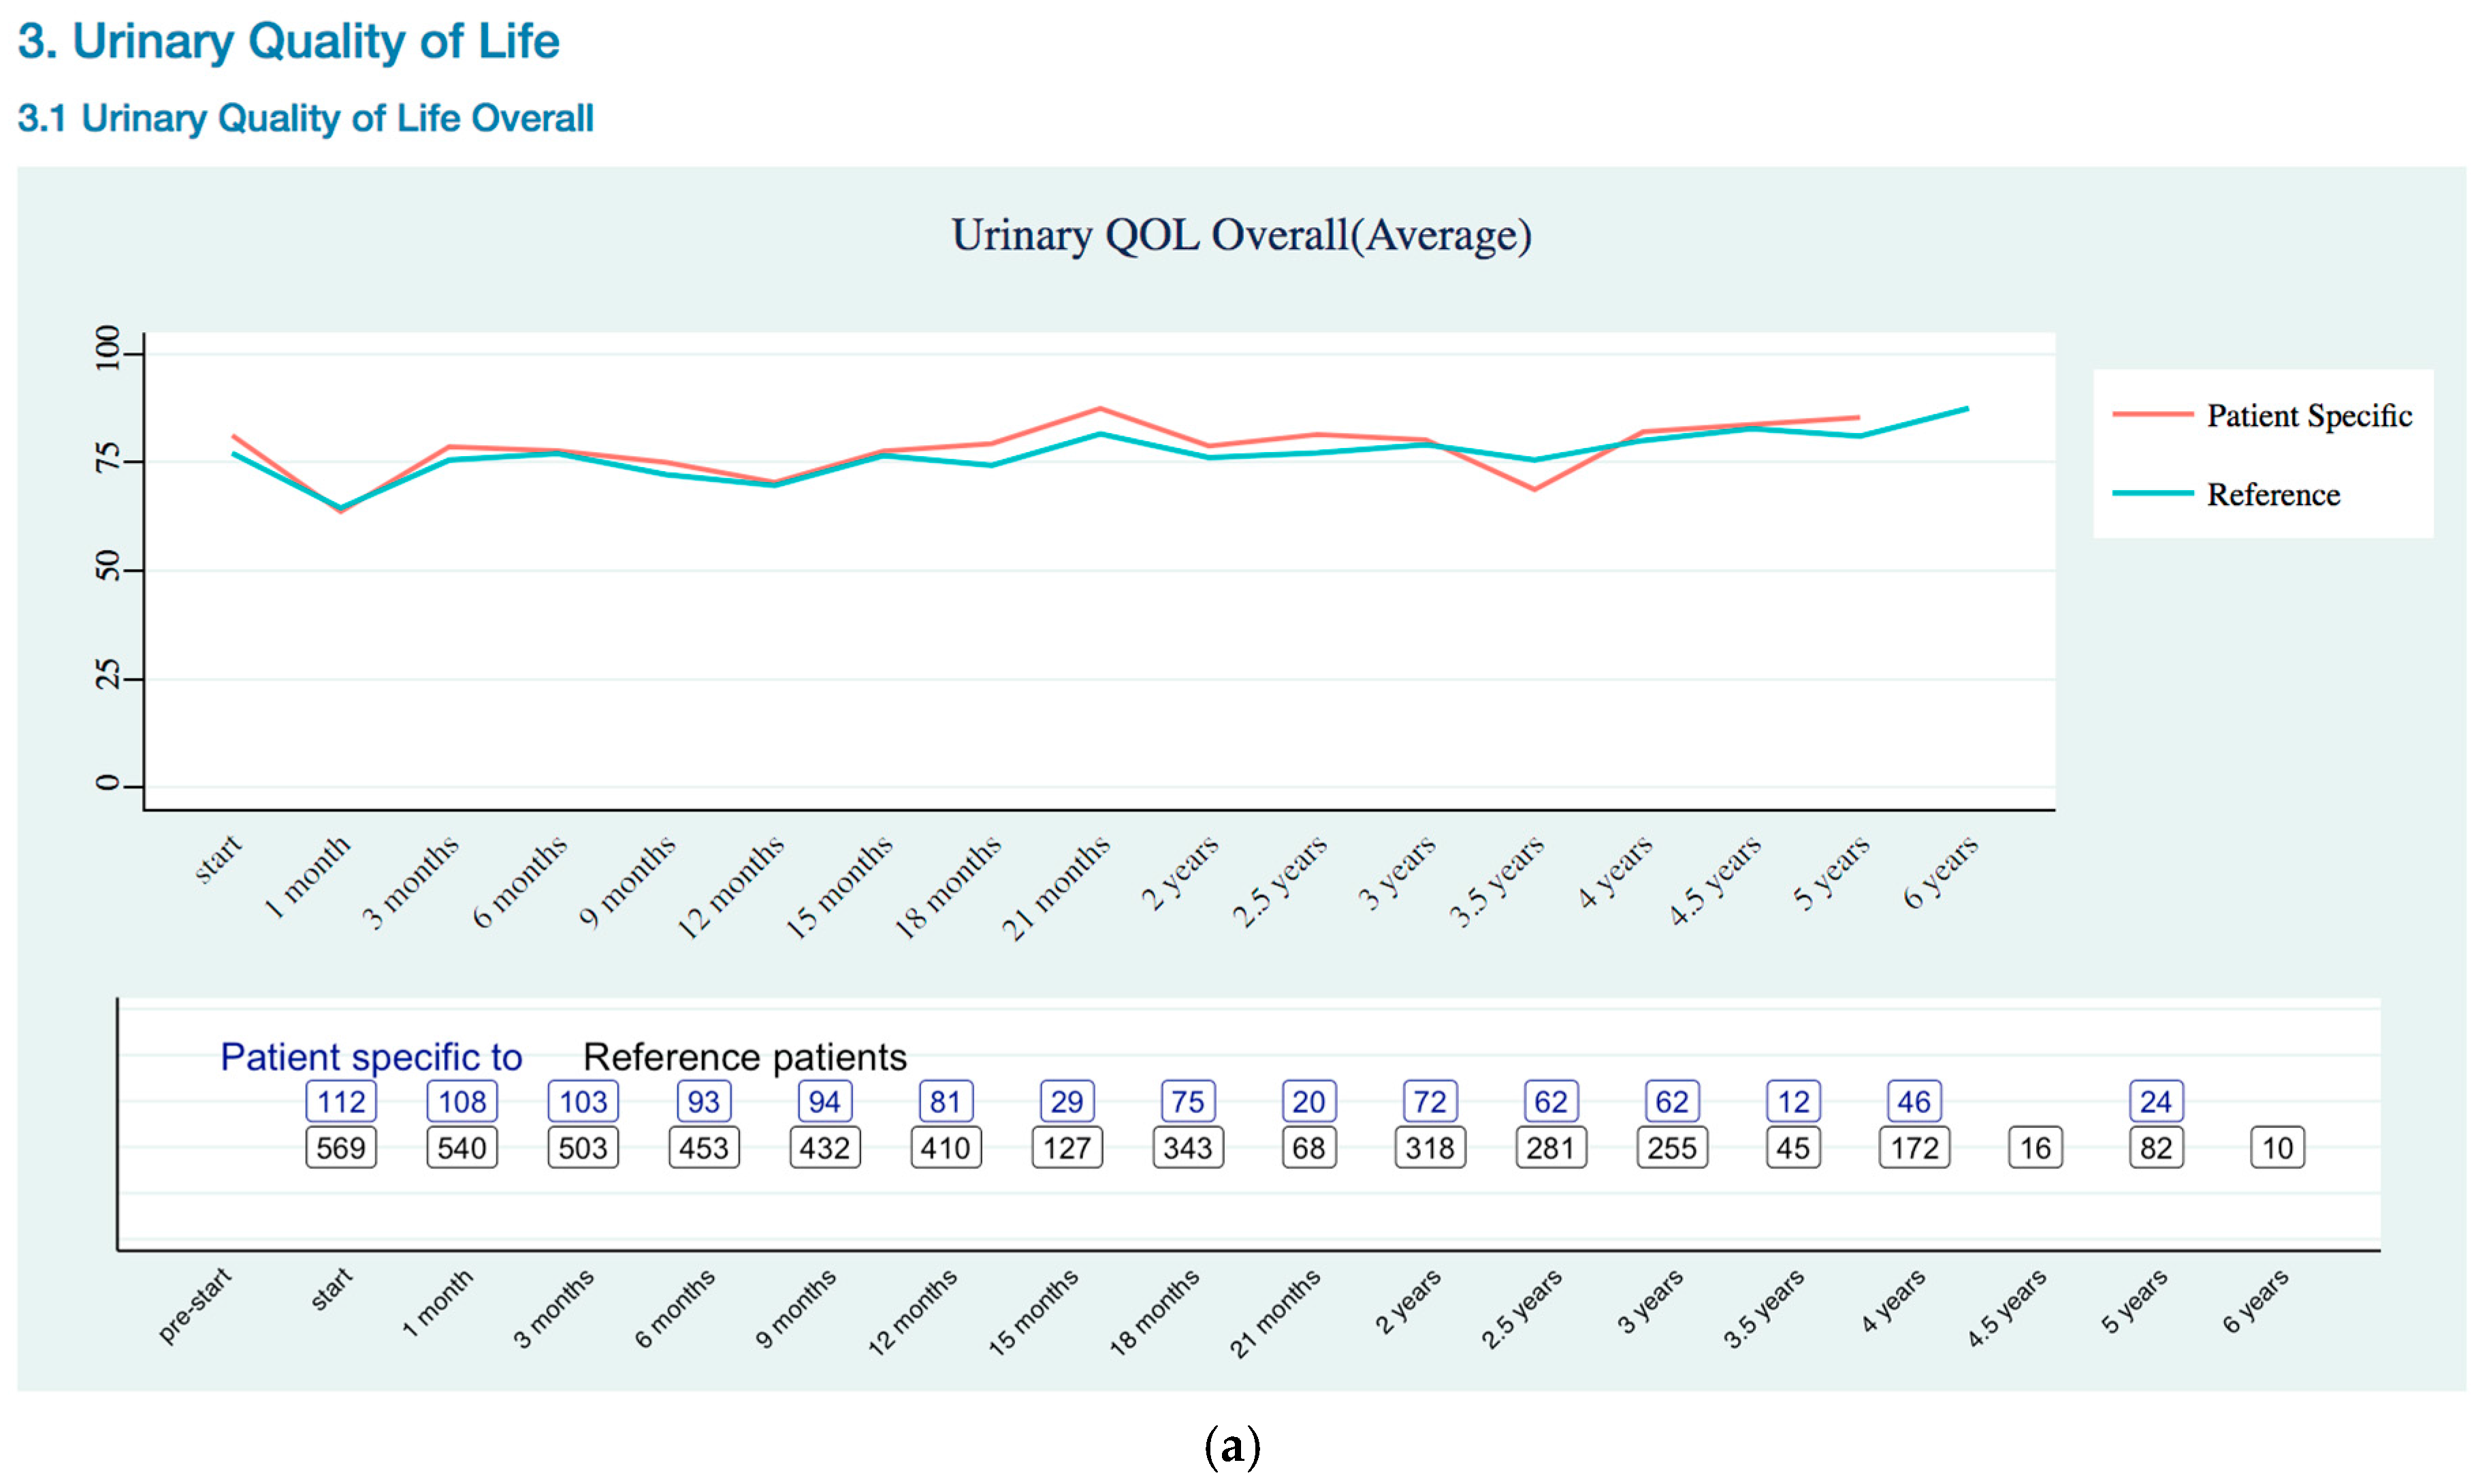
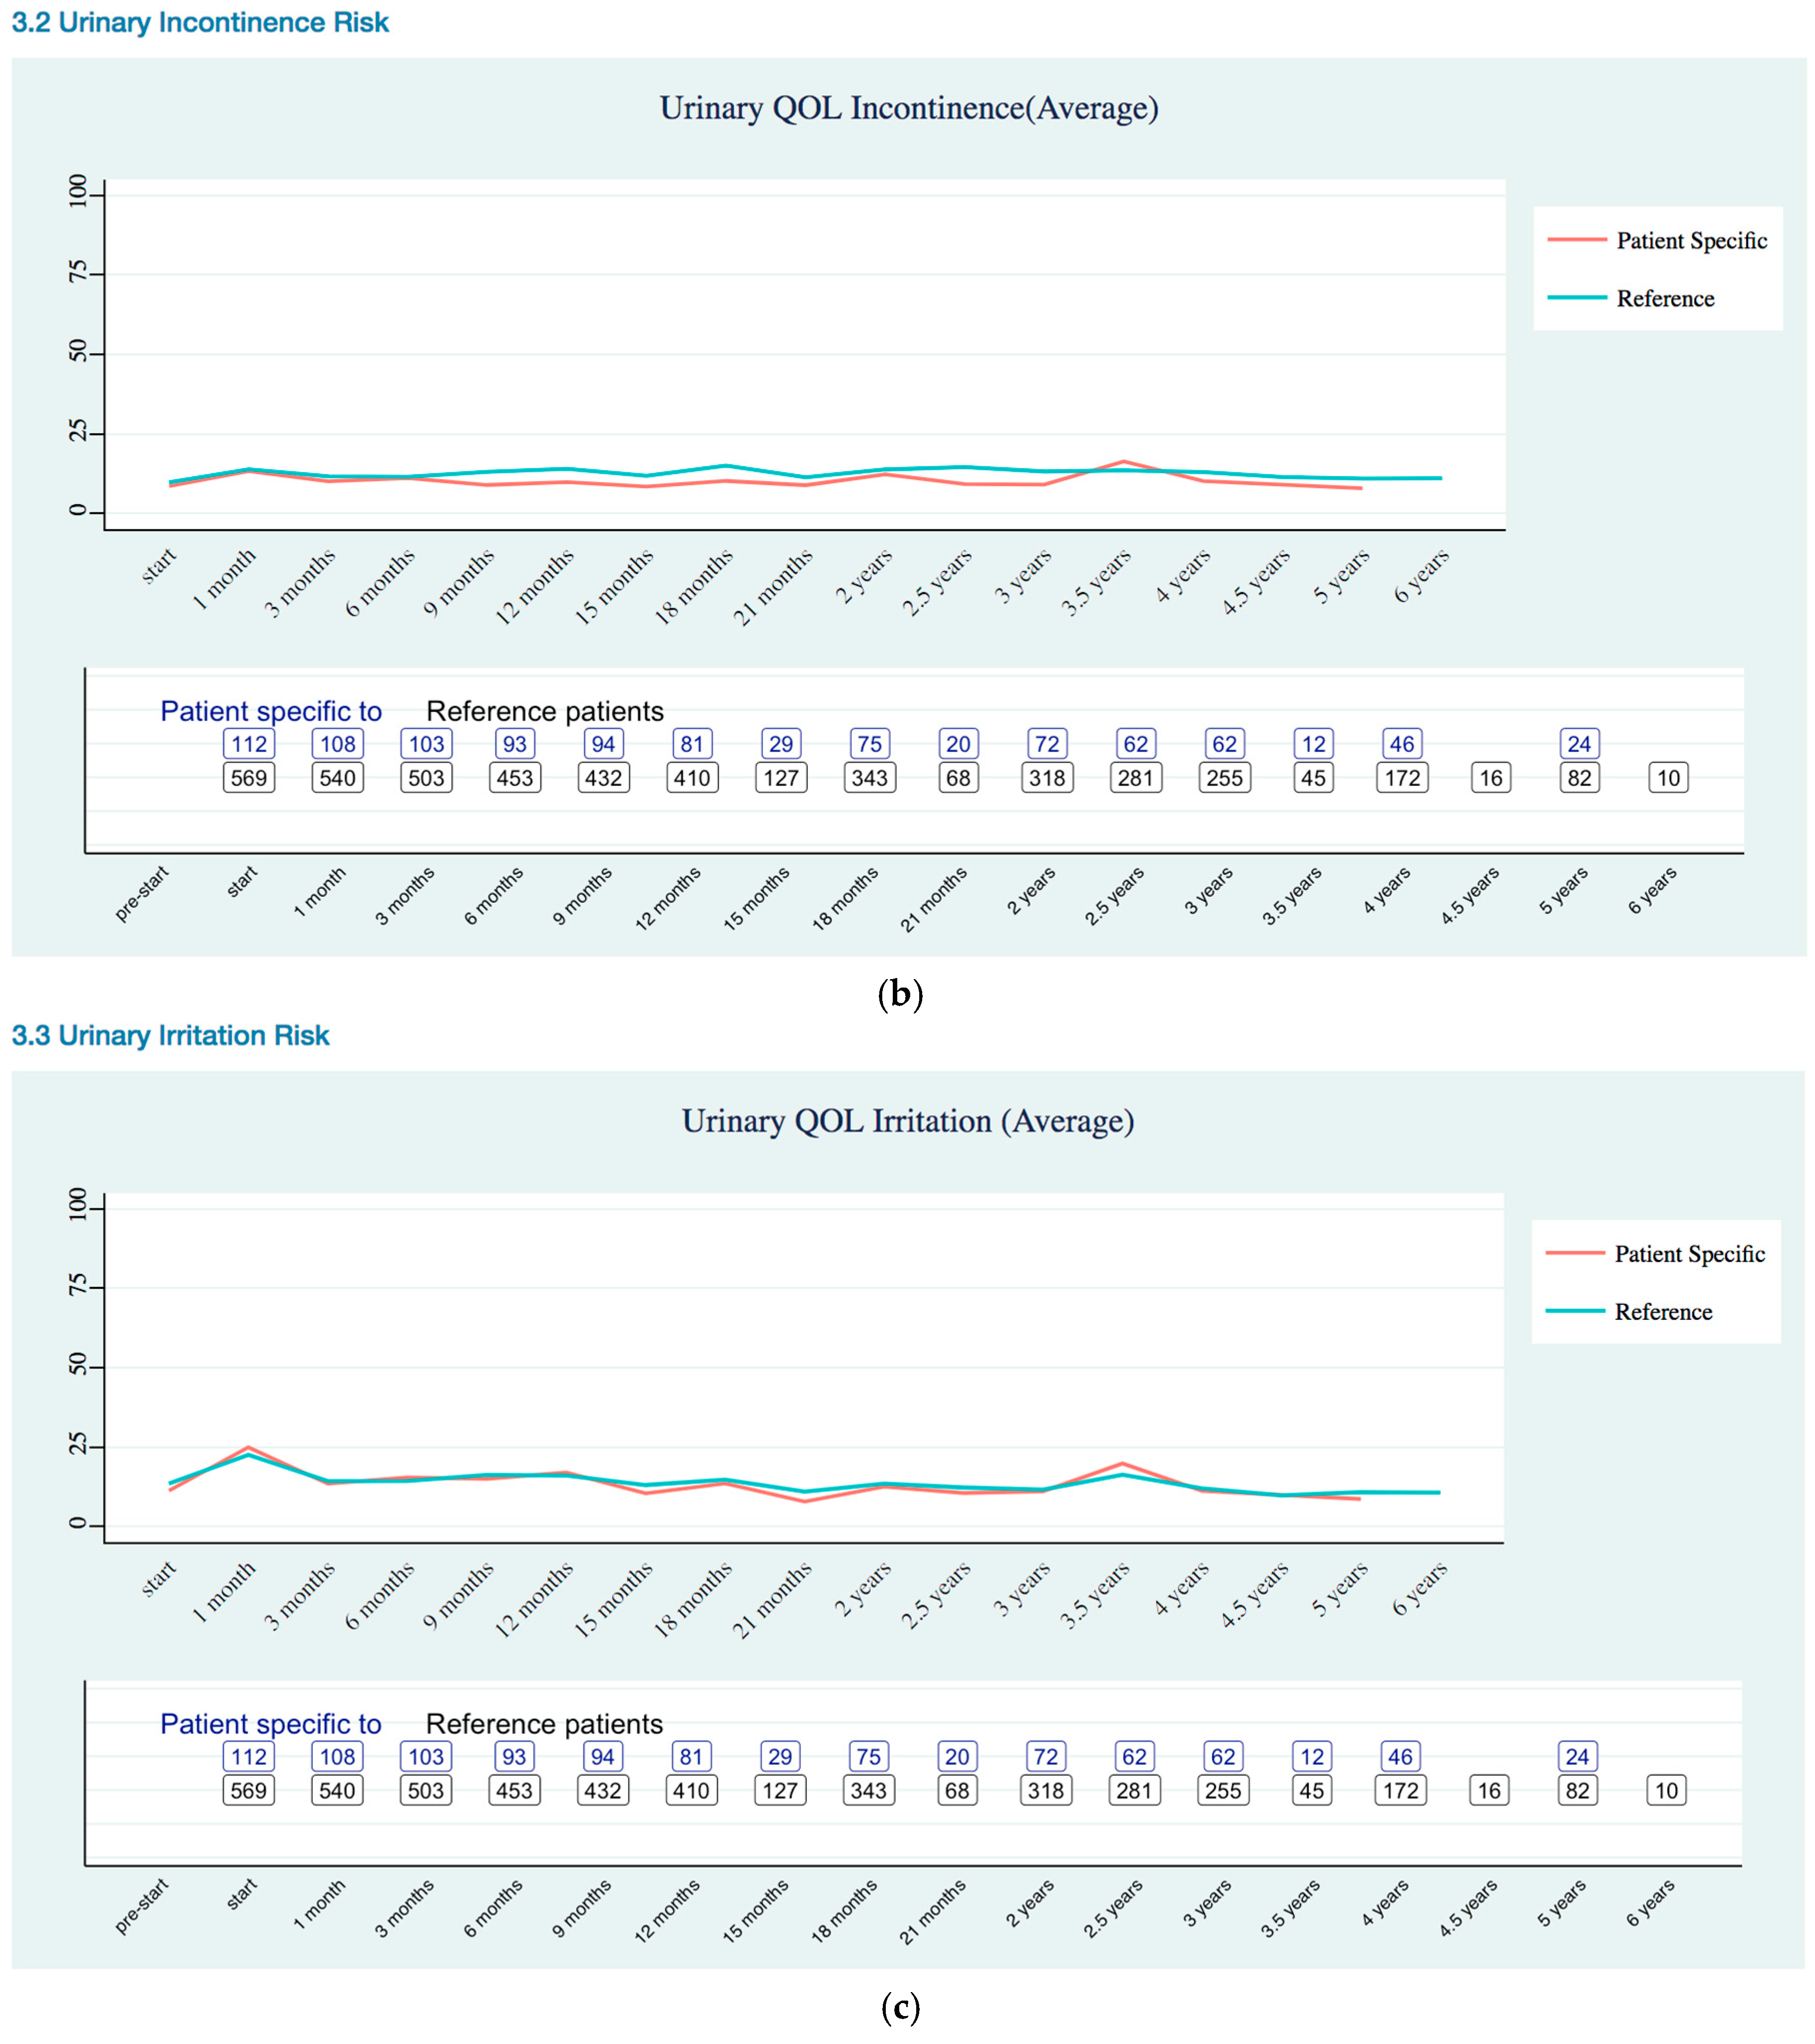
3.2.2. Quality of Life Trends (Rectal, Urinary, and Sexual)

Rectal Quality of Life Trends

In the rectal quality of life visualization (Appendix B Rectal Quality of Life EPIC-26 Trend), the blue line represented all of the existing patients’ rectal QOL trend, and the higher value indicated better status than lower value, while the red line represented patient specific trend that gathers data from existing patients’ who had the same age, clinical stage, and risk category based on The PCO nomogram. The risk plots showed the same colors of section, the blue line for all of the referenced patients and the red line is patient specific data. However, the meaning of values in the risk plots had opposite meaning to the QOL value, lower value indicated a better status than higher value. Because of the QOL plots showed satisfaction or positive outcome values, while the risk plots showed negative risk outcome. That was why QOL plots and risk plots had different meaning of values.

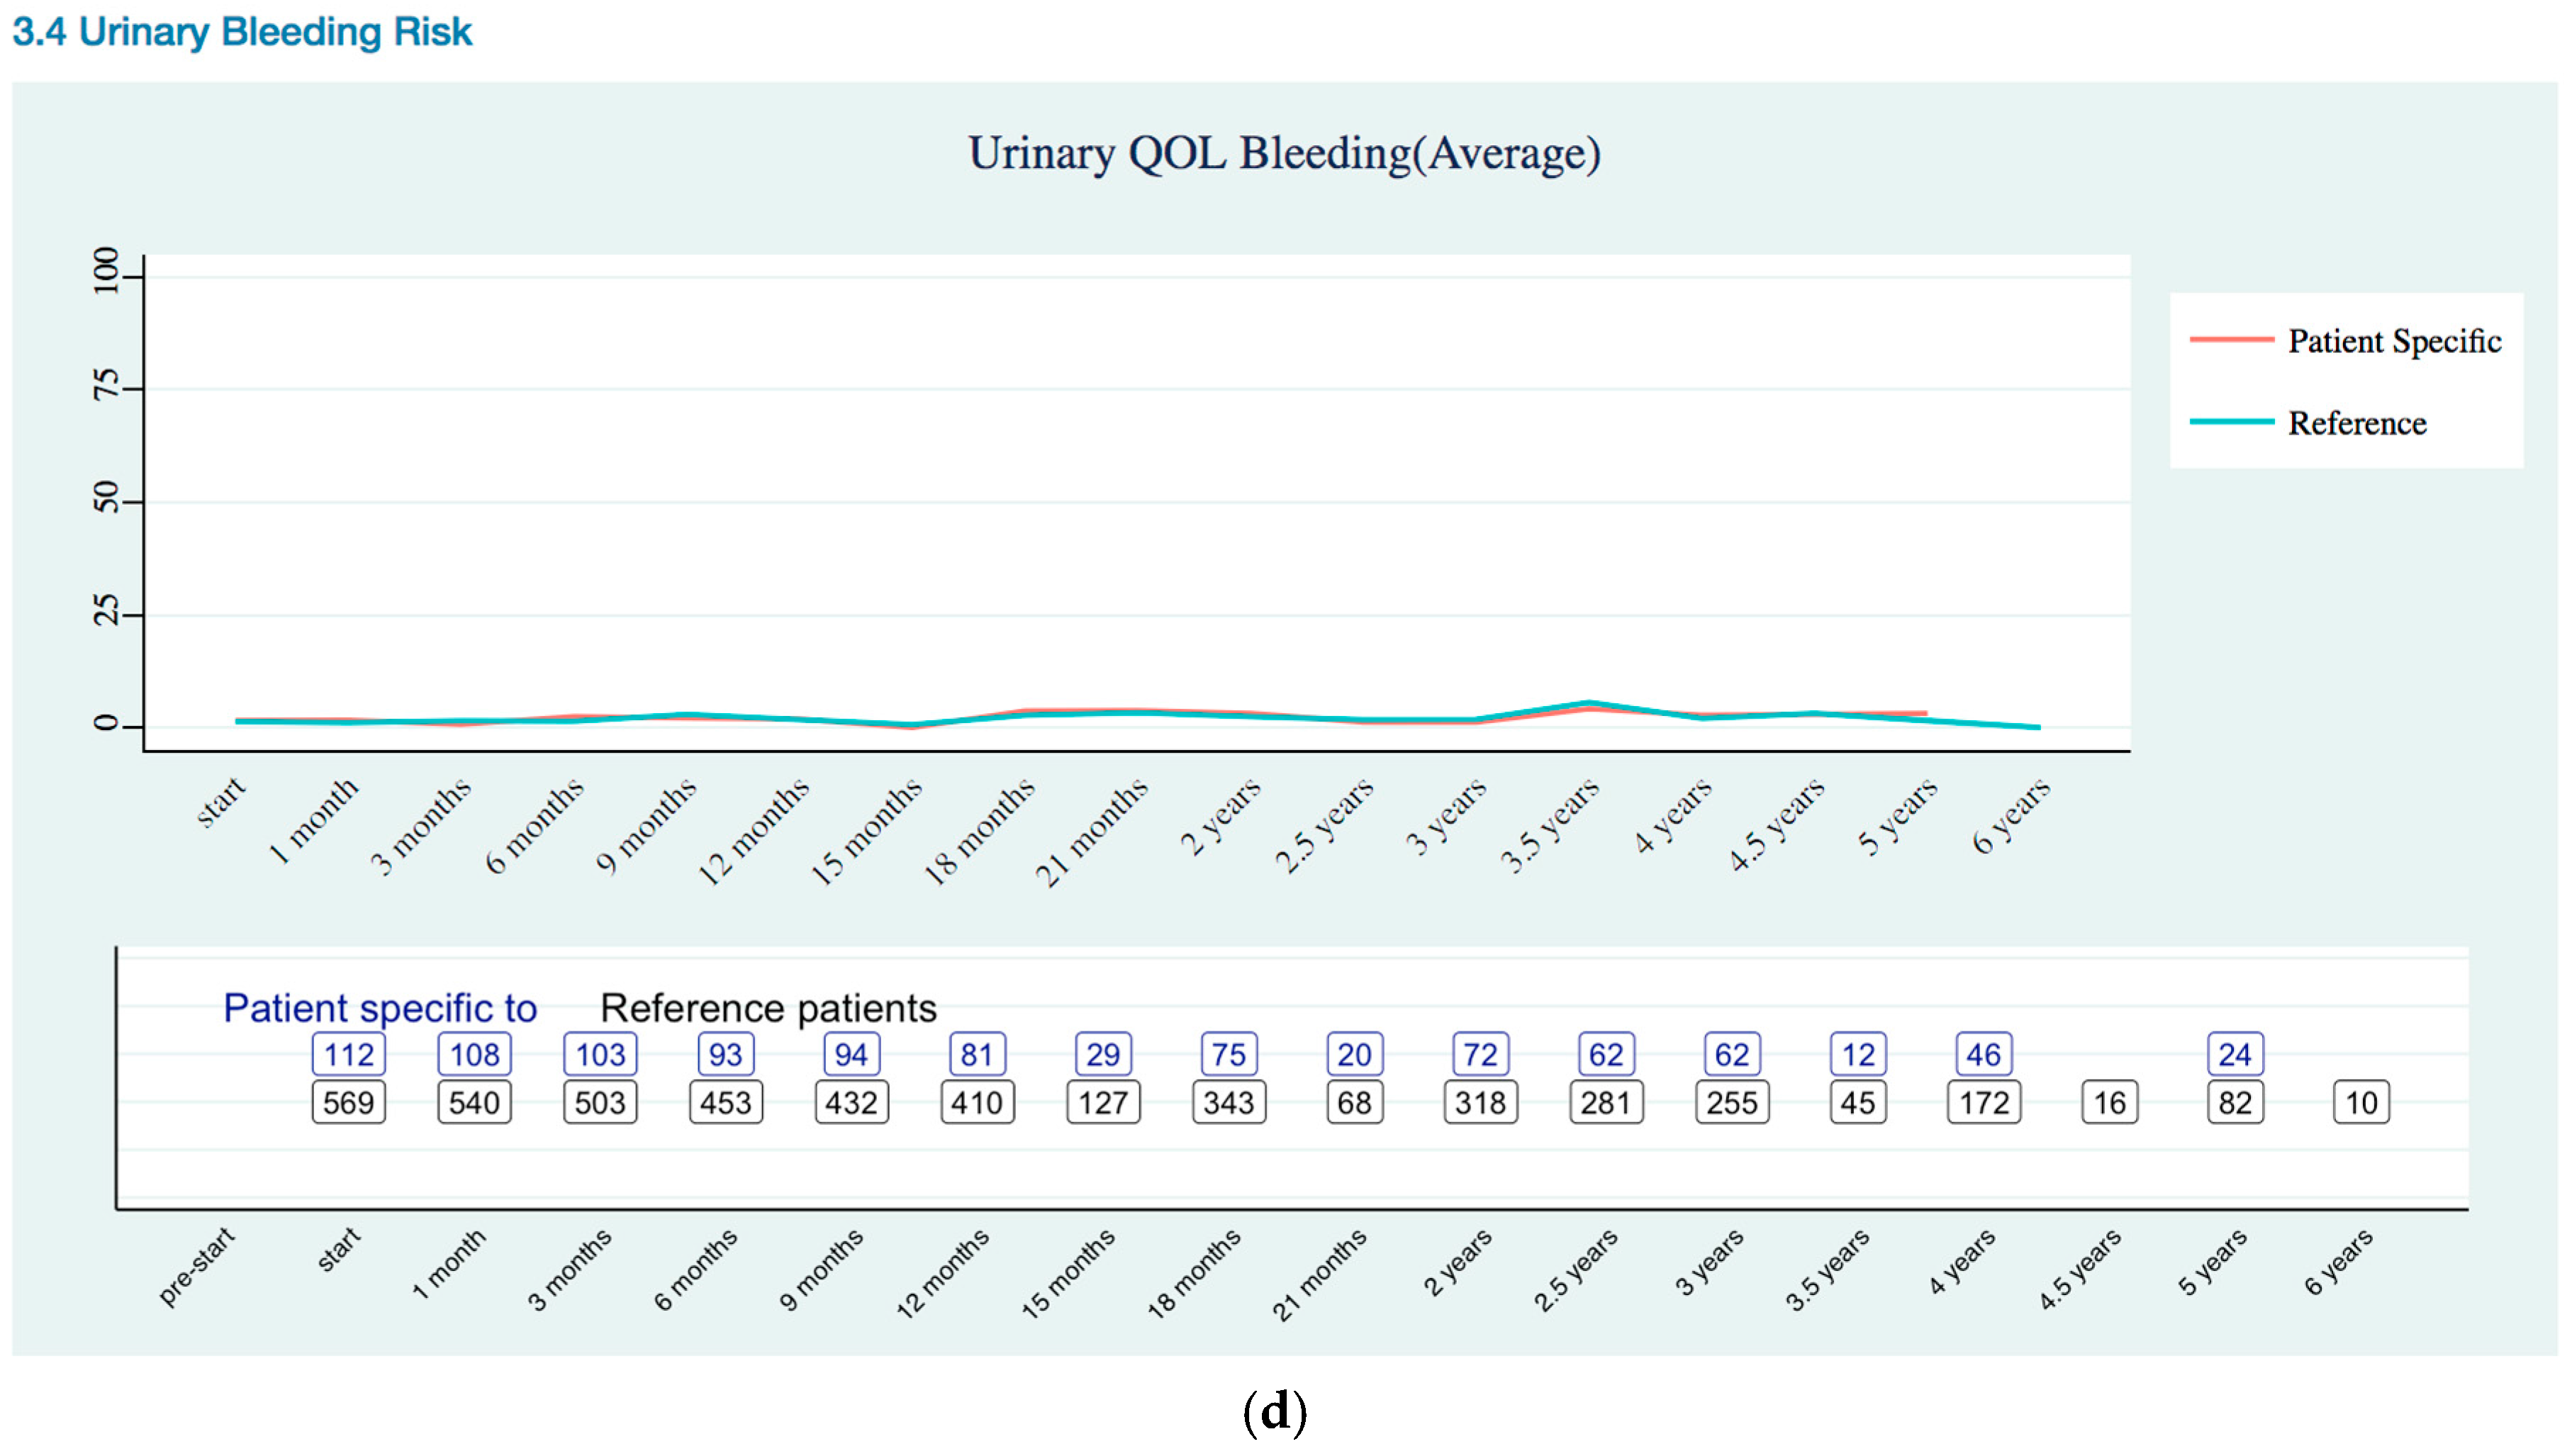
Urinary Quality of Life Trends

Urinary QOL (Appendix B Urinary Quality of Life EPIC-26 Trend) was assessed using the urinary domains of the EPIC-26: incontinence subscale and Irritation/obstruction subscale, and one question related to the overall bother. As previously stated, the EPIC-26 scale score expressed linearly to a 0–100 scale. The urinary incontinence domain of the EPIC-26 had three levels of severity: severe (0–49), moderate (50–69), and mild (70–100) [19]. Urinary QOL showed mild severity for patient specific data.

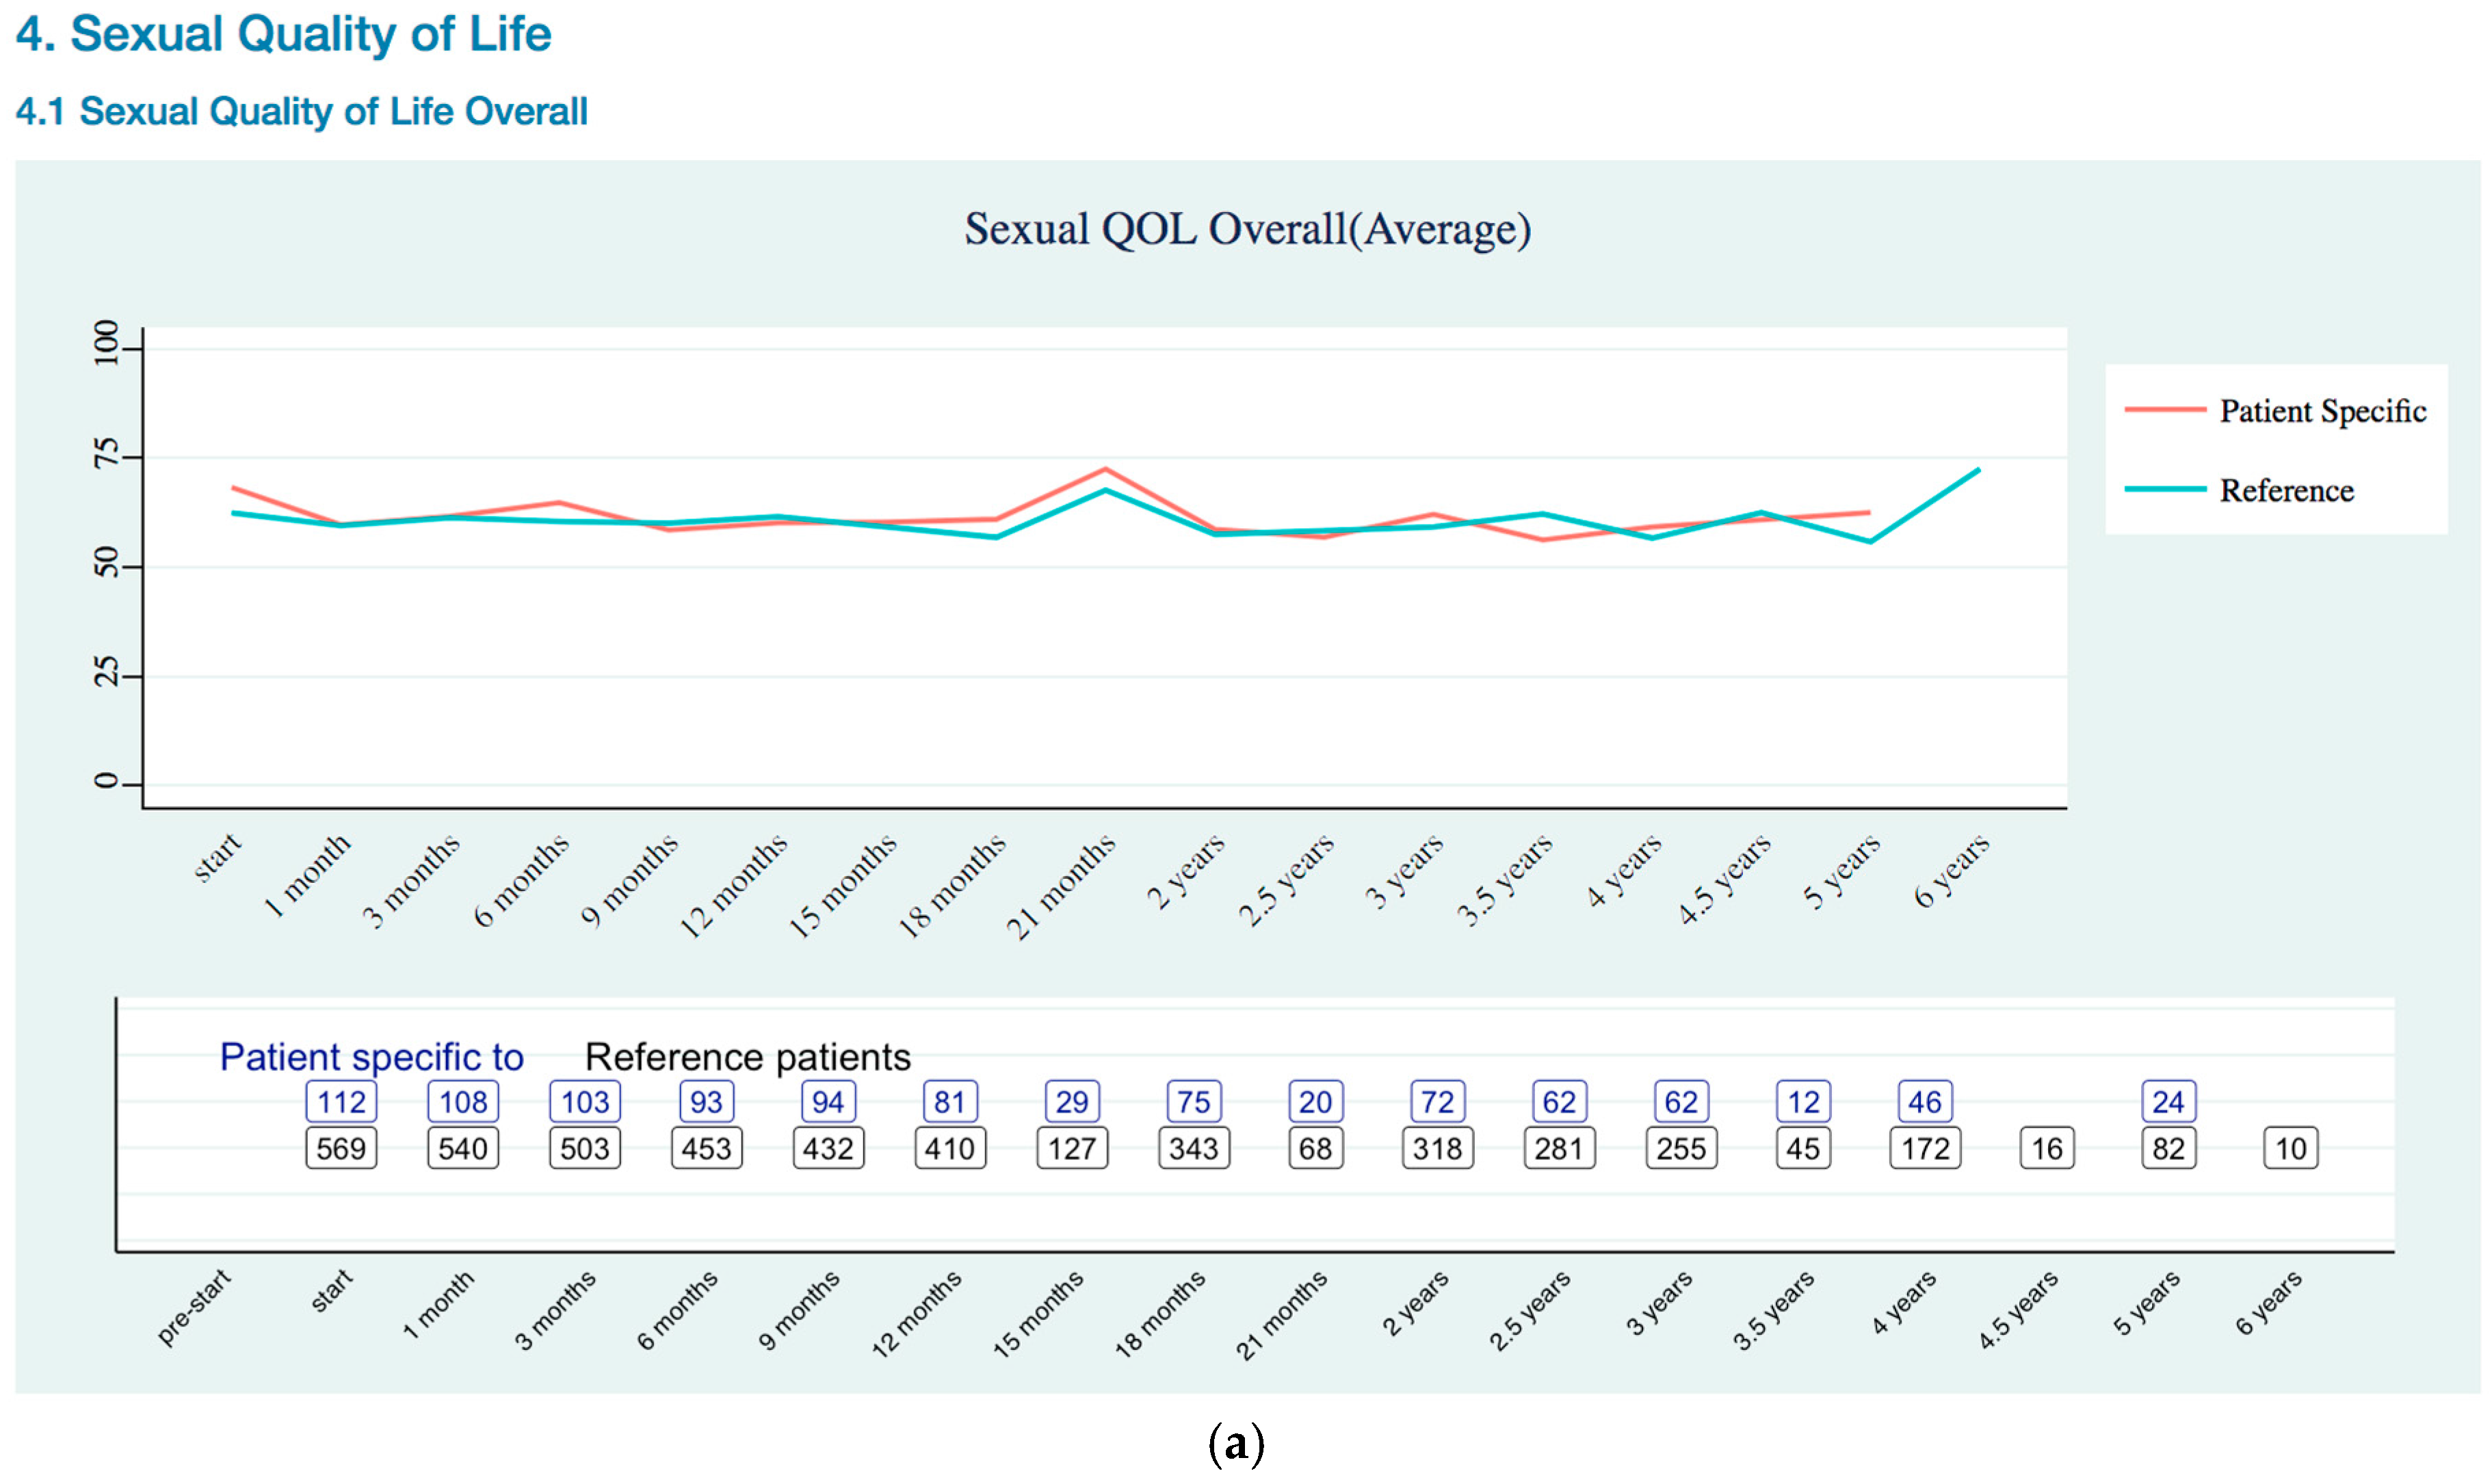
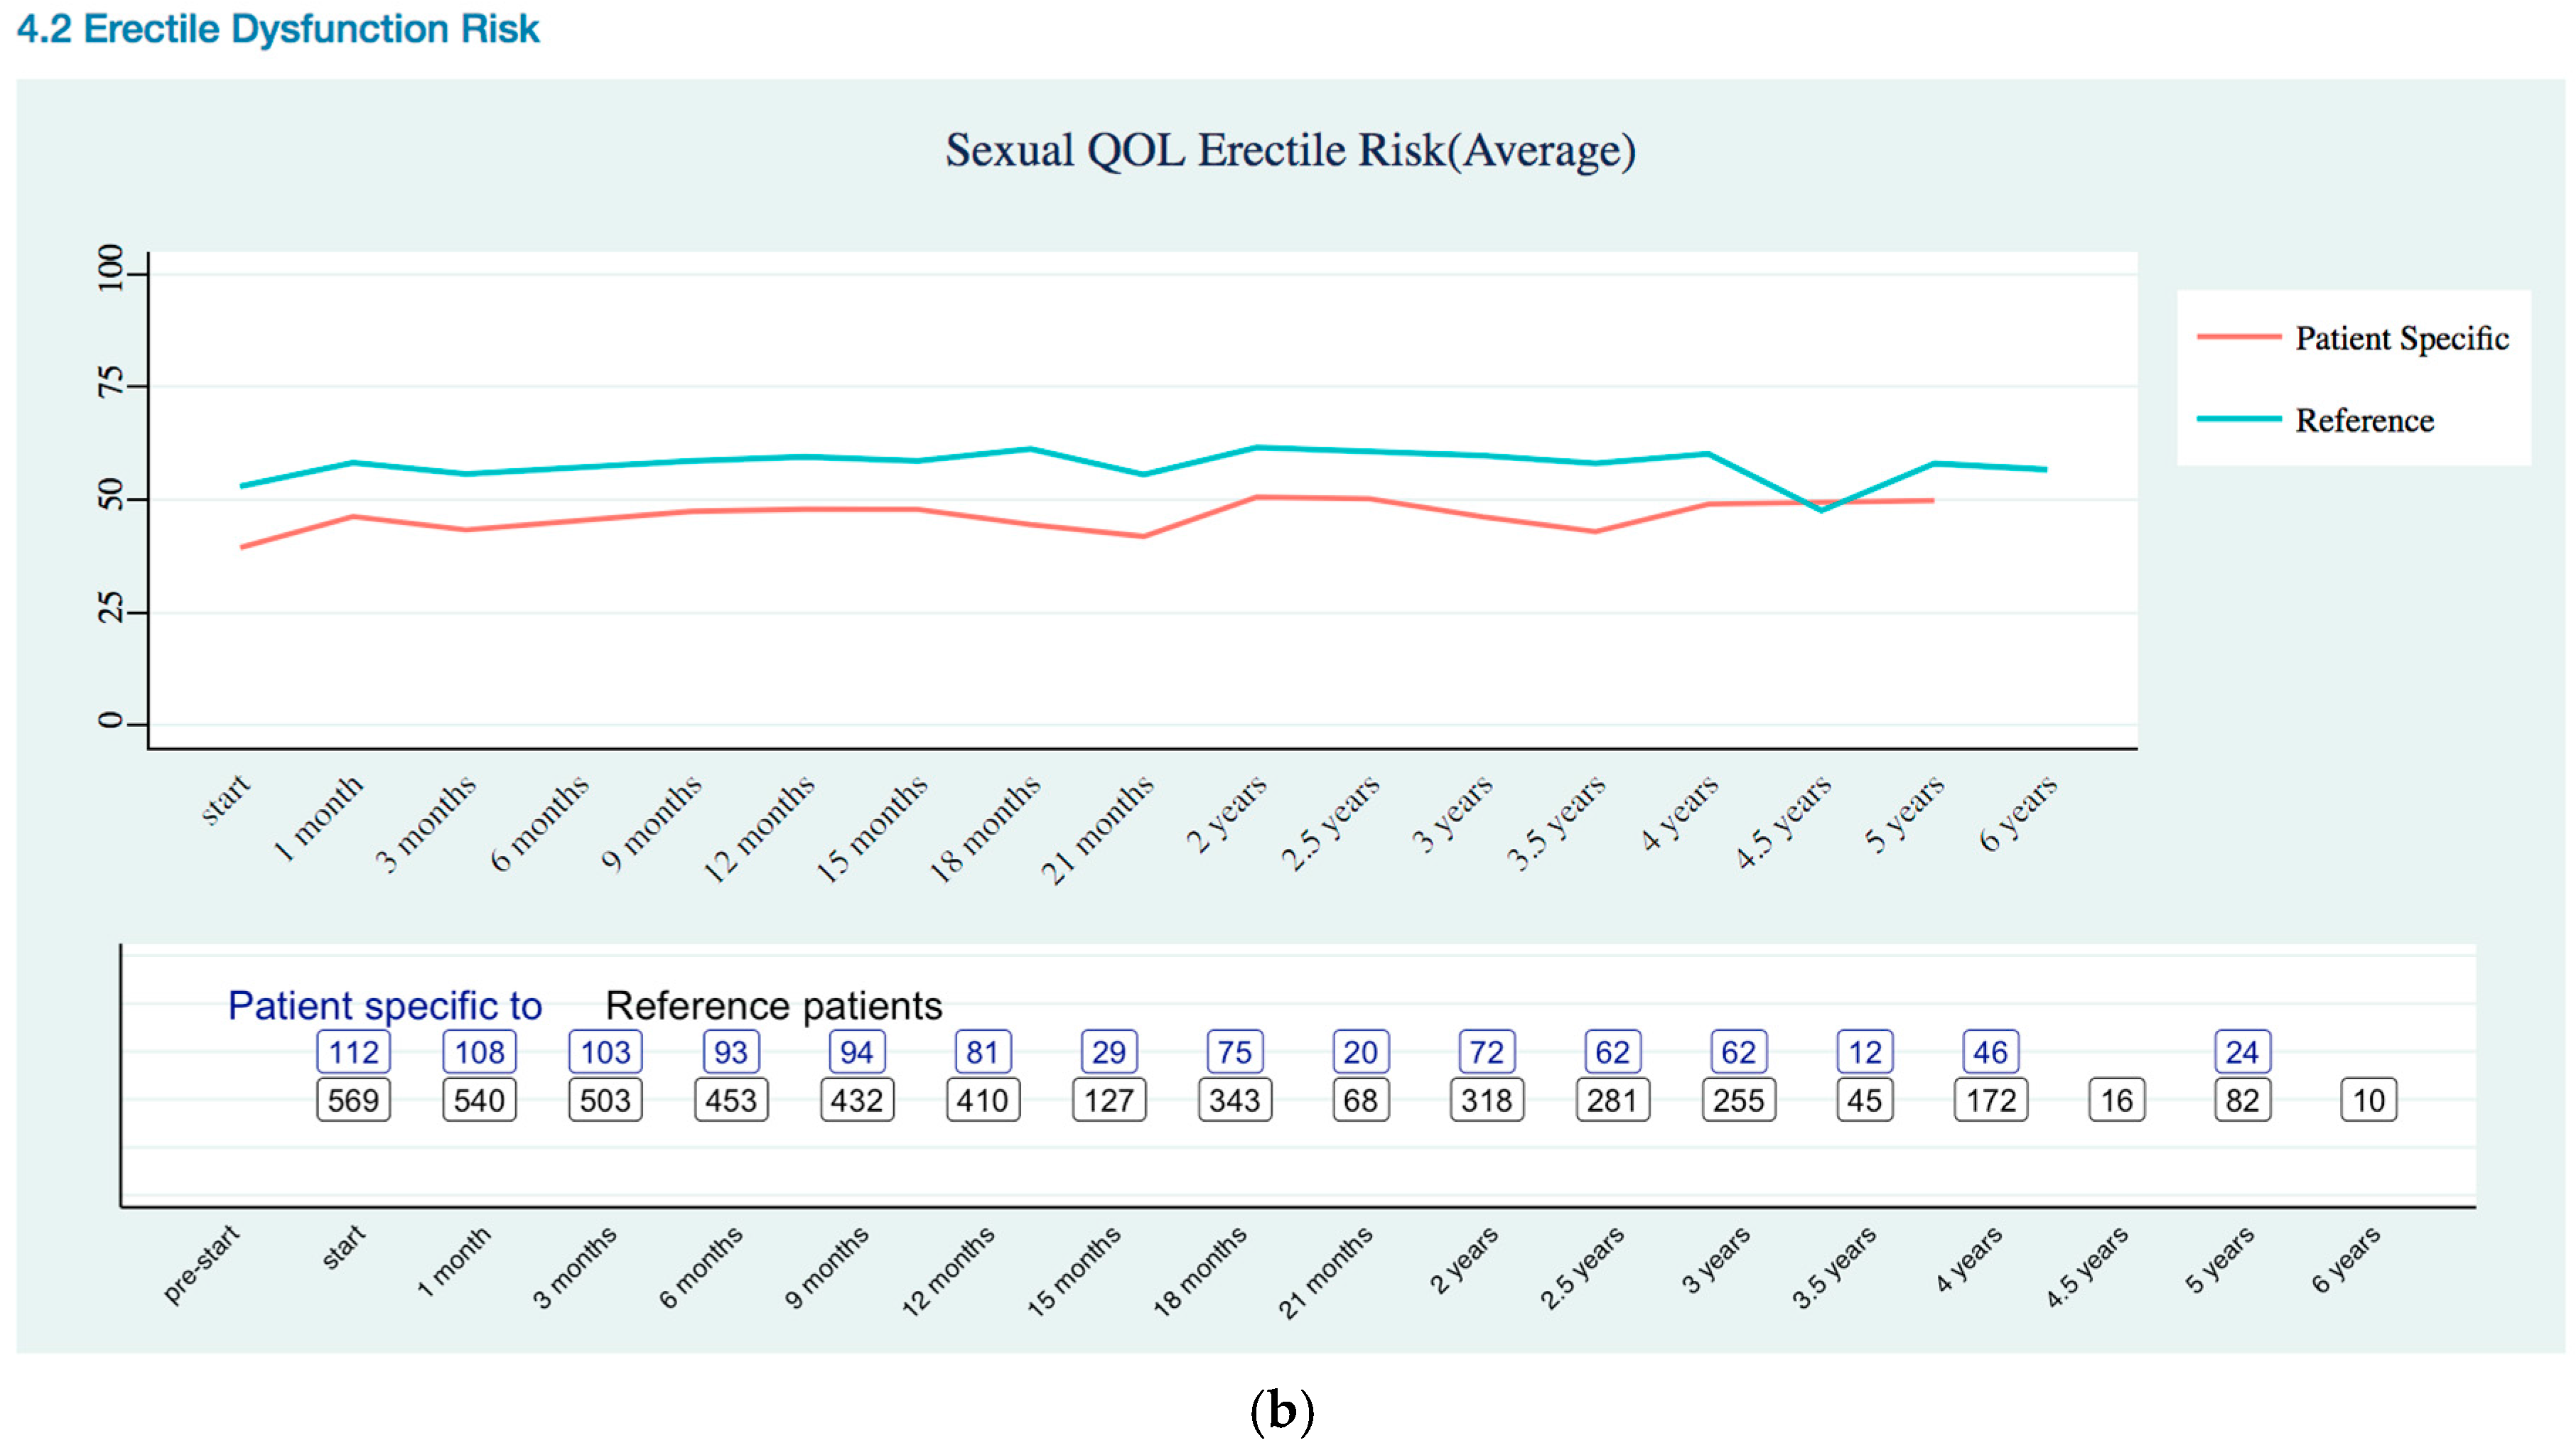
Sexual Quality of Life Trends

Sexual QOL (Appendix B Sexual Quality of Life EPIC-26 Trend) was assessed using sexual domain of the EPIC-26. The EPIC-26 sexual domain included six items, which is five questions that are related to sexual function and one question related to overall bother [20]. Sexual QOL showed lower sexual erectile dysfunction risk for patient specific data than reference data.

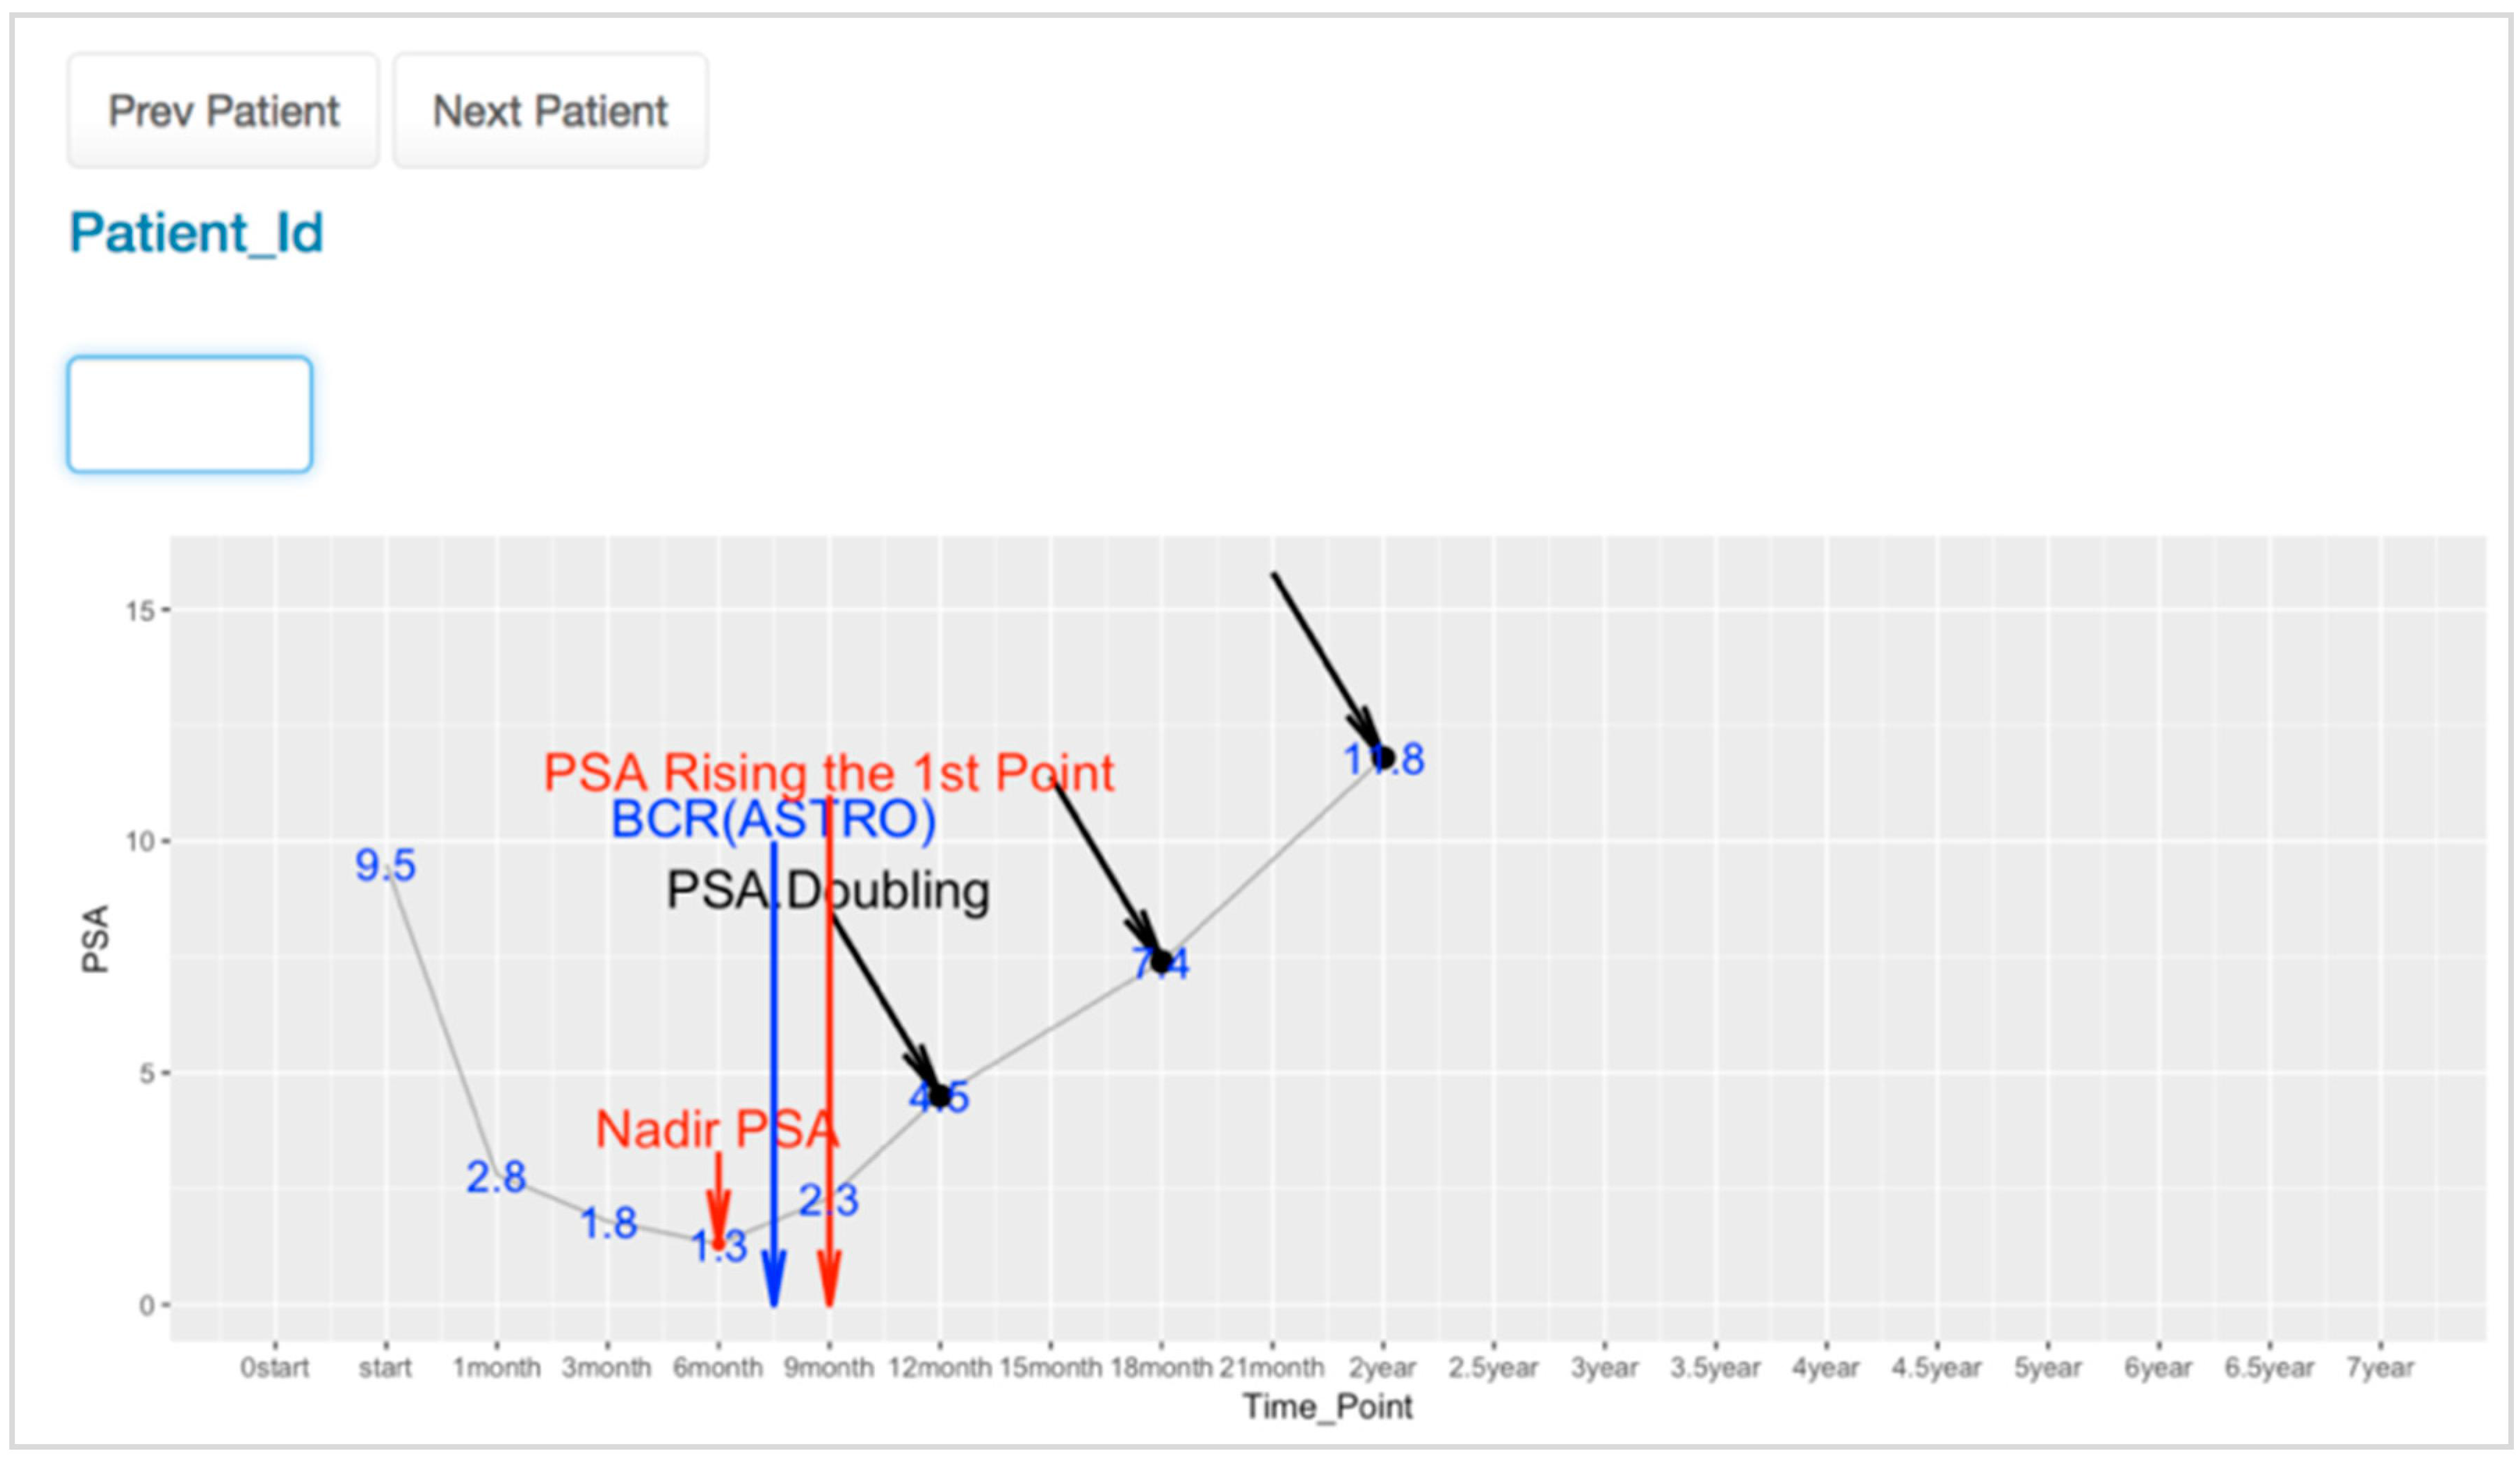
3.3. PSA Trends Visualization for Physician

For the explanation of PSA fluctuation during the follow up, the PCOVS visualized the ASTRO BCR definition (Figure 7). The survival analysis module, in the PCOVS, found nadir PSA time point and consecutive rising points above 0.5 ng/mL, followed by the middle time point between the nadir PSA time point and the first PSA level consecutive rising time point. The middle time point was the BCR point based on the ASTRO definition [9].
The PSA level could fall and rise at any time, which resulted in a bounced pattern. For the bounced pattern of the PSA level, it had to be distinguished from a non-bounced pattern to find the BCR time point correctly. The survival analysis module possesses a function to find a bounced pattern that assists to find the accurate BCR time point. Using the PSA trend viewer, the physician found the pattern of PSA fluctuation differences from relapsed and relapsed free patients. Because the PCOVS generated those PSA view for each individual patient by searching for the patient id on the web-based form, the physician did not need to create a graph from excel documents manually. This reduced the time required to study patient data, and thereby helps the physician to focus on more important patient care issues.

4. Discussion

This study attempted to develop the PCOVS for SBRT treated data using open-source language. Based on the results of this study, we present the following discussions as the PCOVS advantages:
The PCOVS used localized data source rather than global data. To have clinical prediction formula for certain disease and treatment, there were several data sources for analysis. The global data and localized data were the subjects. It was effective to use localized data to make point of care CDSS software than global data. The global data explained the clinical analysis result for a general explanation about the disease. However, the localized data explained the specific therapy likely outcome following certain treatment [21]. The result from analysis of localized data explained real patient probable outcomes that physician had confident to explain about the therapy to their patient based on the reliable result of practical treatment data. The PCOVS focused on SBRT treatment data to make reliable and practical point of care decision support system.
Using reliable data, the PCOVS transformed the analysis result into the visualized screen report. With intuitive graphical result on CDSS screen was very important [22]. Instead of numbers being hard to read, graphs told us acceptable information. The PCOVS attempted to provide an intuitive report of probable treatment outcomes using institutional, patient specific data for comparing the results of treatment. The PCOVS helped specific patients with a local customized system that shows easy to understand visualization for patient specific data likely outcomes compare to the treatment data. Patient saw the future severity of their status by comparing their likely outcomes to the others.
The PCOVS reduced time for analysis and visualization. The PCOVS was designed to achieve automatic scaling and normalizing. Automated data loading module helped the physician to manage the patient data efficiently. Using the embedded analyzing modules, physicians saved effort and time of analysis. The PCOVS reduced the cost and time for the evidence based medical decision making through the simplifying generation of visualized likely outcomes. Physicians used the PCOVS web-aids, which generate likely outcome visualization for the patient specific data, to explain patient likely outcomes simply insert patient’s age at diagnosis, clinical stage, Gleason score, and pre-treatment PSA value.
In addition to automated analysis and visualization, the PCOVS generated electronic file report for e-mail and print-out. It was important to deliver not only the verbal explanation with web-aids, but also the print-out of the likely outcomes [22]. Both of the print-based reports and the web-based decision aids were valuable tools to help patient’s decision [22,23]. Men with prostate cancer could use the print-out to remind and understand their future treatment. The PCOVS generated electronic file for print-out and e-mail that has same pictures from web interface results.
Above report functions such as e-mail and print-out reflected the user input instantly. For user experienced (UX) design, we had feedback from physicians who used the PCOVS for his patient. As the result of UX design, the PCOVS had input forms that display all of the relevant data on a single screen. Patients saw the intuitive graphical information of the patient specific likely outcomes and risk scores. When the physician changed the variable to predict patient likely outcomes, he put the value into the web user interface. It produced an immediate effect upon the visualization module displaying the result, as well as presenting the e-mail and print-out functions [7].
As each individual site has unique policies for security and data management, it was not possible to make universal security and data management function. For this reason, the PCOVS uses analysis and visualization functionalities only. It has limited security options, and the user in charge of production system installation should follow the security policy of the implementation site, such as firewall and user authentication of the system.
Using open-source language and packages is one of the way of software development. The open-source product means contribution to the community and reliability of the products. Not only letting the users to use the software in the public repository, but also the responsible contribution of the software is required. Individuals freely developed the software that they are hard to accomplish solid process of open-source publication. For reliable open-source software publication, certification from the trusted organization is required, especially in medical software products. The certification forces the product to have documents and test codes. The documents include installation manual, user manual, and technical manual. Well documented open-source products help users to implement and maintain the product installed system easily and confidently.
Finally, the PCOVS had a contribution to the medical open-source community. To promote further enhancement by others, the software was certified by Open Source Electronic Health Record Alliance (OSEHRA) open-source certification for eventual public release through the OSEHRA code repository [24]. Through the OSEHRA open-source certification process, peer reviewers verify installation, functionalities, and the source code of the PCOVS. The validation process of the OSEHRA open-source certification was done by two external experts. This open-source code is applicable to other specialties of oncology. New data can be added to the reference data, and this will not affect future analysis or visualization functions.

5. Conclusions

The CDSS has had a long history, being used since the 1960′s [25]. Yet, it still took a long time and much effort to gain a practical point of care software. Discussing data analysis and visualization with physicians and statistical expertise has improved the possibilities of creating a useful result that reduces errors. Developing clinical decision support software was dependent upon collaborations that included physicians, statisticians, and developers.
As software development is costly, the use of open source software adds efficiencies. Open-source eliminated development software license issues, not to mention the additional resources that are available from the open-source community. There were several products and packages using R and RShiny [5,6,7,8]. The PCOVS’s web-based architecture was displayed on any mobile devices. It meant the PCOVS could be used without extra development for the mobile applications.
The PCOVS visualized statistical analysis code means that the user does not need to be an expert in statistical analysis [2]. The user interface was reviewed by physicians to result in a better user experience (UX) design of the PCOVS. The PCOVS gave an answer to patient who want to know therapy likely outcomes rather than general answers. With reliable results and a convenient UX design, the PCOVS is useful tool for point of care CDSS.
As the result of collaboration of physicians, statisticians, and developers, the PCOVS visualized patient specific likely outcomes were compared to treatment data from a single department, helping the patient and the clinician to visualize likely outcomes that were based on open-source development. The PCOVS approach can be expanded to other specialties of oncology with the flexible, modularized architecture, which can be customized by changing independent modules.

Acknowledgments

Thank you Simeng Suy PhD. at Medstar Georgetown University Hospital (MGUH) for the providing data management for patients undergoing SBRT at MGUH and whose outcomes were used to test the software developed in this study. Thank you Coleman W. Rosen for the review of this article.

Author Contributions

Jihwan Park wrote the article and contributed in developing the proposed system. Mi Jung Rho also supported in writing the article and developed PCOVS risk classifier. Seong K. Mun, Anatoly Dritschilo, and In Young Choi supervised research. Anatoly Dritschilo also gave medical advices for likely outcomes and user interface of the system. All four authors substantially contributed in each of their expertise.

Conflicts of Interest

This study has no conflicts of interest.

Ethical Approval

The research procedures were performed in accordance with the Declaration of Helsinki. This study followed IRB regulation of the Georgetown University Medical Center (protocol 12-1175).

Appendix A. EPIC 26 Instrument

1. Over the past 4 weeks, how often have you leaked urine?
More than once a day...................... 1
About once a day............................ 2
More than once a week.................... 3
About once a week........................... 4
Rarely or never................................ 5
2. Which of the following best describes your urinary control during the last 4 weeks?
No urinary control whatsoever......................................1
Frequent dribbling........................................................ 2
Occasional dribbling..................................................... 3
Total control.................................................................. 4
3. How many pads or adult diapers per day did you usually use to control leakage during the last 4 weeks?
None ......................................................................... 0
1 pad per day..........................................................… 1
2 pads per day............................................................ 2
3 or more pads per day............................................... 3
4. How big a problem, if any, has each of the following been for you during the last 4 weeks?
No ProblemVery Small ProblemSmall ProblemModerate ProblemBig Problem
a. Dripping or leaking urine01234
b. Pain or burning on urination01234
c. Bleeding with urination01234
d. Weak urine stream or incomplete emptying01234
e. Need to urinate frequently during the day01234
5. Overall, how big a problem has your urinary function been for you during the last 4 weeks?
No problem...................................... 1
Very small problem.......................... 2
Small problem.................................. 3
Moderate problem........................... 4
Big problem..................................... 5
6. How big a problem, if any, has each of the following been for you?
No ProblemVery Small ProblemSmall ProblemModerate ProblemBig Problem
a. Urgency to have a bowel movement01234
b. Increased frequency of bowel movements01234
c. Losing control of your stools01234
d. Bloody stools01234
e. Abdominal/ Pelvic/Rectal pain01234
7. Overall, how big a problem has your bowel habits been for you during the last 4 weeks?
No problem...................................... 1
Very small problem.......................... 2
Small problem.................................. 3
Moderate problem........................... 4
Big problem..................................... 5
8. How would you rate each of the following during the last 4 weeks?
Very Poor to NonePoorFairGoodVery Good
Your ability to have an erection?12345
Your ability to reach orgasm (climax)?12345
9. How would you describe the usual QUALITY of your erections during the last 4 weeks?
None at all......................................................................................... 1
Not firm enough for any sexual activity.............................................. 2
Firm enough for masturbation and foreplay only............................... 3
Firm enough for intercourse.............................................................. 4
10. How would you describe the FREQUENCY of your erections during the last 4 weeks?
I NEVER had an erection when I wanted one................................... 1
I had an erection LESS THAN HALF the time I wanted one............. 2
I had an erection ABOUT HALF the time I wanted one..................... 3
I had an erection MORE THAN HALF the time I wanted one............ 4
I had an erection WHENEVER I wanted one..................................... 5
11. Overall, how would you rate your ability to function sexually during the last 4 weeks?
Very poor ............................................................. 1
Poor...................................................................... 2
Fair....................................................................... 3
Good.................................................................... 4
Very good............................................................. 5
12. Overall, how big a problem has your sexual function or lack of sexual function been for you during the last 4 weeks?
No problem........................................................... 1
Very small problem............................................... 2
Small problem....................................................... 3
Moderate problem................................................ 4
Big problem.......................................................... 5
13. How big a problem during the last 4 weeks, if any, has each of the following been for you?
No ProblemVery Small ProblemSmall ProblemModerate ProblemBig Problem
a. Hot flashes01234
b. Breast tenderness/enlargement01234
c. Feeling depressed01234
d. Lack of energy01234
e. Change in body weight01234

Appendix B. Quality of Life Trends (Rectal, Urinary, and Sexual)

Figure A1. Rectal Quality of Life EPIC-26 Trend as (a) Overall Trend; (b) Bleeding Risk Trend.
Applsci 08 00471 g0a1aApplsci 08 00471 g0a1b
Figure A2. Urinary Quality of Life EPIC-26 Score Trend as (a) Overall; (b) Incontinence Risk; (c) Irritation Risk; (d) Bleeding Risk.
Applsci 08 00471 g0a2aApplsci 08 00471 g0a2bApplsci 08 00471 g0a2c
Figure A3. Sexual Quality of Life EPIC-26 Score Trend as (a) Overall; (b) Erectile Dysfunction Risk.
Applsci 08 00471 g0a3aApplsci 08 00471 g0a3b

References

  1. Walsh, P.C.; DeWeese, T.L.; Eisenberger, M.A. Localized prostate cancer. N. Engl. J. Med. 2007, 357, 2696–2705. [Google Scholar] [CrossRef] [PubMed]
  2. Gigerenzer, G.; Gaissmaier, W.; Kurz-Milcke, E.; Schwartz, L.M.; Woloshin, S. Helping doctors and patients make sense of health statistics. Psychol. Sci. Public Interest 2007, 8, 53–96. [Google Scholar] [CrossRef] [PubMed]
  3. Coiera, E. Clinical decision support systems. In Guide to Health Informatics; CRC Press: Boca Rato, FL, USA, 2003; Volume 2. [Google Scholar]
  4. Chen, L.N.; Suy, S.; Uhm, S.; Oermann, E.K.; Ju, A.W.; Chen, V.; Hanscom, H.N.; Laing, S.; Kim, J.S.; Lei, S. Stereotactic body radiation therapy (sbrt) for clinically localized prostate cancer: The georgetown university experience. Radiat. Oncol. 2013, 8, 58. [Google Scholar] [CrossRef] [PubMed]
  5. Lakshmanan, K.; Peter, A.P.; Mohandass, S.; Varadharaj, S.; Lakshmanan, U.; Dharmar, P. Synrio: R and shiny based application platform for cyanobacterial genome analysis. Bioinformation 2015, 11, 422. [Google Scholar] [CrossRef] [PubMed]
  6. Walter, W.; Sánchez-Cabo, F.; Ricote, M. Goplot: An R package for visually combining expression data with functional analysis. Bioinformatics 2015, 31, 2912–2914. [Google Scholar] [CrossRef] [PubMed]
  7. Badgeley, M.A.; Shameer, K.; Glicksberg, B.S.; Tomlinson, M.S.; Levin, M.A.; McCormick, P.J.; Kasarskis, A.; Reich, D.L.; Dudley, J.T. Ehdviz: Clinical dashboard development using open-source technologies. BMJ Open 2016, 6, e010579. [Google Scholar] [CrossRef] [PubMed]
  8. Hinterberg, M.A.; Kao, D.P.; Bristow, M.R.; Hunter, L.E.; Port, J.D.; Görg, C. Peax: Interactive visual analysis and exploration of complex clinical phenotype and gene expression association Pacific Symposium on Biocomputing. In Proceedings of the Pacific Symposium on Biocomputing, Puako, HI, USA, 4–8 January 2015; pp. 419–430. [Google Scholar]
  9. Cookson, M.S.; Aus, G.; Burnett, A.L.; Canby-Hagino, E.D.; D’Amico, A.V.; Dmochowski, R.R.; Eton, D.T.; Forman, J.D.; Goldenberg, S.L.; Hernandez, J. Variation in the definition of biochemical recurrence in patients treated for localized prostate cancer: The american urological association prostate guidelines for localized prostate cancer update panel report and recommendations for a standard in the reporting of surgical outcomes. J. Urol. 2007, 177, 540–545. [Google Scholar] [PubMed]
  10. Katz, A.J. Cyberknife radiosurgery for prostate cancer. Technol. Cancer Res. Treat. 2010, 9, 463–472. [Google Scholar] [CrossRef] [PubMed]
  11. Kaplan, E.L.; Meier, P. Nonparametric estimation from incomplete observations. J. Am. Stat. Assoc. 1958, 53, 457–481. [Google Scholar] [CrossRef]
  12. Capanu, M.; Gonen, M. Building a Nomogram for Survey-Weighted Cox Models Using R; Department of Epidemiology and Biostatistics: New York, NY, USA, 2011. [Google Scholar]
  13. Wei, J.T.; Dunn, R.L.; Litwin, M.S.; Sandler, H.M.; Sanda, M.G. Development and validation of the expanded prostate cancer index composite (epic) for comprehensive assessment of health-related quality of life in men with prostate cancer. Urology 2000, 56, 899–905. [Google Scholar] [CrossRef]
  14. Szymanski, K.M.; Wei, J.T.; Dunn, R.L.; Sanda, M.G. Development and validation of an abbreviated version of the expanded prostate cancer index composite instrument for measuring health-related quality of life among prostate cancer survivors. Urology 2010, 76, 1245–1250. [Google Scholar] [CrossRef] [PubMed]
  15. Lee, J.Y.; Daignault-Newton, S.; Heath, G.; Scarlett, S.; Sanda, M.G.; Chang, P.; Regan, M.M.; Michalski, J.M.; Sandler, H.M.; Feng, F.Y. Multinational prospective study of patient-reported outcomes after prostate radiation therapy: Detailed assessment of rectal bleeding. Int. J. Radiat. Oncol. Biol. Phys. 2016, 96, 770–777. [Google Scholar] [CrossRef] [PubMed]
  16. Bhattasali, O.; Chen, L.N.; Woo, J.; Park, J.-W.; Kim, J.S.; Moures, R.; Yung, T.; Lei, S.; Collins, B.T.; Kowalczyk, K. Patient-reported outcomes following stereotactic body radiation therapy for clinically localized prostate cancer. Radiat. Oncol. 2014, 9, 1. [Google Scholar] [CrossRef] [PubMed]
  17. Arscott, W.T.; Chen, L.N.; Wilson, N.; Bhagat, A.; Kim, J.S.; Moures, R.A.; Yung, T.M.; Lei, S.; Collins, B.T.; Kowalczyk, K.; et al. Obstructive voiding symptoms following stereotactic body radiation therapy for prostate cancer. Radiat. Oncol. 2014, 9, 163. [Google Scholar] [CrossRef] [PubMed]
  18. Joh, D.Y.; Chen, L.N.; Porter, G.; Bhagat, A.; Sood, S.; Kim, J.S.; Moures, R.; Yung, T.; Lei, S.; Collins, B.T. Proctitis following stereotactic body radiation therapy for prostate cancer. Radiat. Oncol. 2014, 9, 1. [Google Scholar] [CrossRef] [PubMed]
  19. Chen, L.N.; Suy, S.; Wang, H.; Bhagat, A.; Woo, J.A.; Moures, R.A.; Kim, J.S.; Yung, T.M.; Lei, S.; Collins, B.T. Patient-reported urinary incontinence following stereotactic body radiation therapy (sbrt) for clinically localized prostate cancer. Radiat. Oncol. 2014, 9, 1. [Google Scholar] [CrossRef] [PubMed]
  20. Obayomi-Davies, O.; Chen, L.N.; Bhagat, A.; Wright, H.C.; Uhm, S.; Kim, J.S.; Yung, T.M.; Lei, S.; Batipps, G.P.; Pahira, J. Potency preservation following stereotactic body radiation therapy for prostate cancer. Radiat. Oncol. 2013, 8, 1. [Google Scholar] [CrossRef]
  21. Kattan, M.W.; Zelefsky, M.J.; Kupelian, P.A.; Scardino, P.T.; Fuks, Z.; Leibel, S.A. Pretreatment nomogram for predicting the outcome of three-dimensional conformal radiotherapy in prostate cancer. J. Clin. Oncol. 2000, 18, 3352–3359. [Google Scholar] [CrossRef] [PubMed]
  22. Taylor, K.L.; Williams, R.M.; Davis, K.; Luta, G.; Penek, S.; Barry, S.; Kelly, S.; Tomko, C.; Schwartz, M.; Krist, A.H.; et al. Decision making in prostate cancer screening using decision aids vs usual care: A randomized clinical trial. JAMA Int. Med. 2013, 173, 1704–1712. [Google Scholar] [CrossRef] [PubMed]
  23. Tomko, C.; Davis, K.M.; Luta, G.; Krist, A.H.; Woolf, S.H.; Taylor, K.L. A comparison of web-based versus print-based decision aids for prostate cancer screening: Participants’ evaluation and utilization. J. Gen. Int. Med. 2015, 30, 33–42. [Google Scholar] [CrossRef] [PubMed]
  24. Prostate Clinical Outlook Visualization System. Available online: http://code.osehra.org/journal/journal/view/1003 (accessed on 28 February 2018).
  25. Goertzel, G. Clinical decision support system. Ann. N. Y. Acad. Sci. 1969, 161, 689–693. [Google Scholar] [CrossRef] [PubMed]
Figure 1. Prostate Clinical Outlook Visualization System (PCOVS) Conceptual Architecture.
Applsci 08 00471 g001
Figure 2. The PCOVS Data Analysis and Visualization Flow.
Applsci 08 00471 g002
Figure 3. The PCOVS Likely Outcome Visualization as (a) Web dashboard for likely outcomes with input form for patient specific data; and, (b) Printout version of electronic file for likely outcomes with additional risk of quality of life (QOL) gauge charts.
Applsci 08 00471 g003aApplsci 08 00471 g003b
Figure 4. Disease Free Survival Likely Outcome (a) and Risk Score (b) for five years after treatment.
Applsci 08 00471 g004
Figure 5. Risk Free Profile—at five years probable outcomes.
Applsci 08 00471 g005
Figure 6. Biochemical relapse (BCR) Free Survival Kaplan-Meier Curve.
Applsci 08 00471 g006
Figure 7. PSA Trend Viewer.
Applsci 08 00471 g007
Table 1. Descriptive statistic results after data scaling and normalizing 580 patient data with stereotactic body radiation therapy (SBRT).
CategoryFrequencyPercent
Age at diagnosis (Mean, Range)Under 59488.3
60–6923039.7
70–7924742.6
Over 80559.5
69.63 (44–94)
T-stageT1(T1b, T1c)39668.3
T2a9215.9
T2b6411
T2c+T3284.8
Gleason scoreLow23640.7
Intermediate-a (3 + 4)21036.2
Intermediate-b (4 + 3)9015.5
High447.6
Pre-treatment prostate specific antigen (PSA)≤10.0 ng/mL44676.9
>10.0 and ≤20.0 ng/mL10518.1
>20.0 ng/mL295.0
RaceAsian213.6
Black22639
Hispanic132.2
White30853.1
Other122.1
BCRPatients with BCR172.9
Patients with non-BCR56397.1
Total580100

