1. Introduction
Turnouts are essential components of railway facilities. A turnout consists of a switch panel, a closure panel and a crossing panel [
1]. In order to achieve vehicle transfer, the switch rail and point rail are designed as variable cross-section rails, transferring the wheels between the stock rail and switch rail and between the wing rail and nose rail. During this process, skipping wheel-rail contact points can cause strong dynamic wheel-rail interaction, which is also a main reason for wear, rolling contact fatigue (RCF) and accumulated plastic deformation [
2,
3,
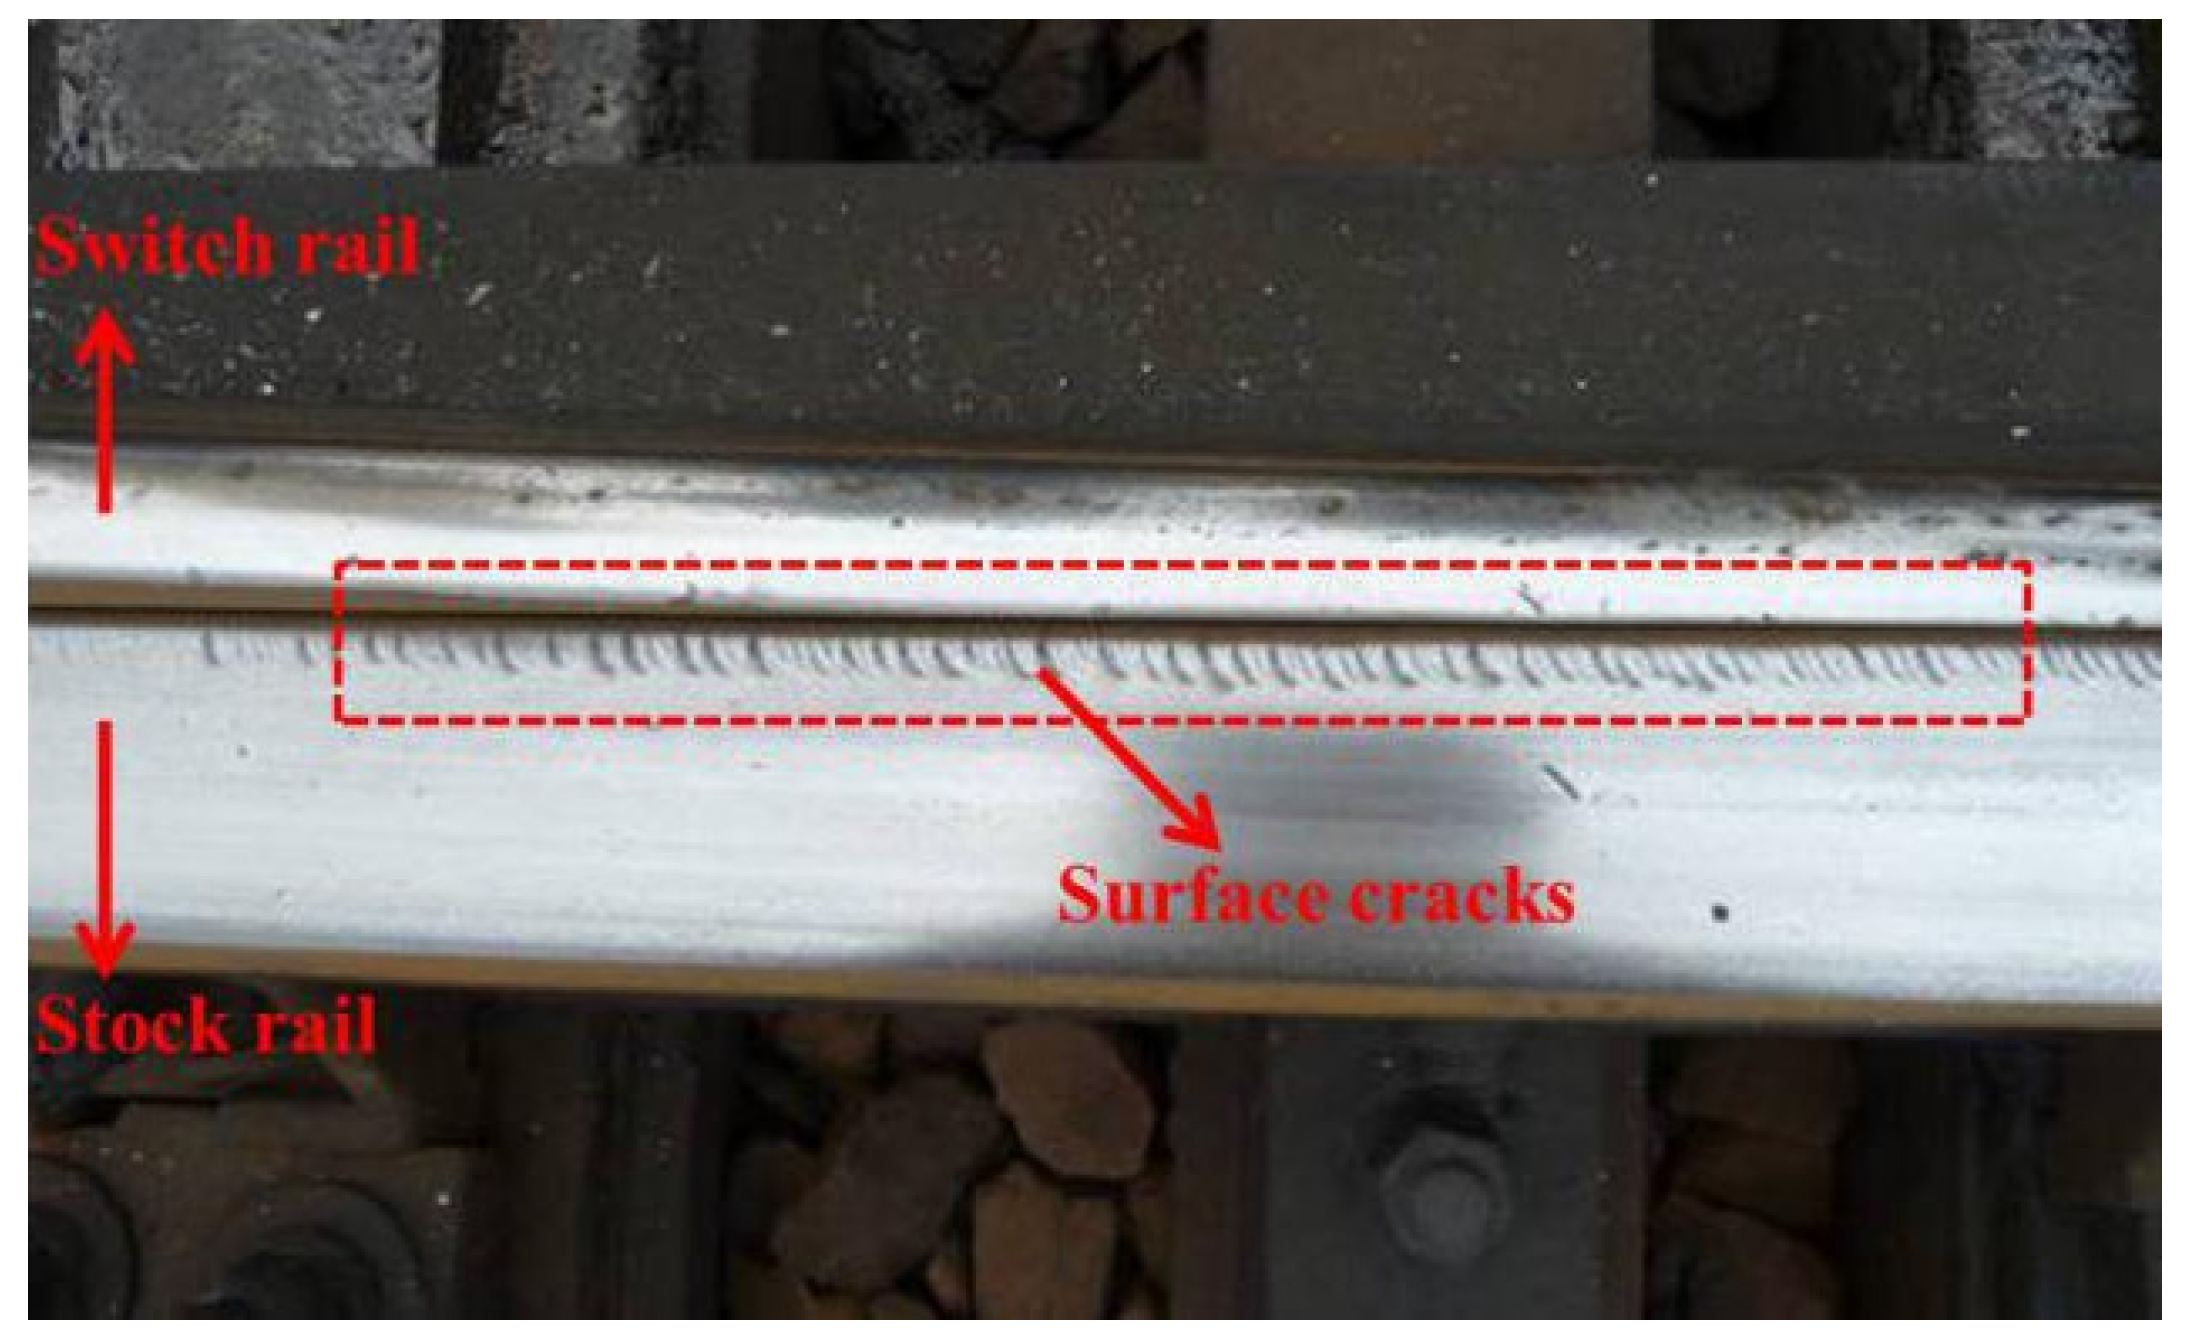
4] of turnout rail. The surface initiated RCF is mainly characterized by surface cracks (see
Figure 1). These are caused by long-term accumulation and development of RCF under wheel loads, and the position and size of rail damage caused by each pass of vehicle wheels are related to the dynamic parameters of the vehicle-track system [
1,
3]. Therefore, it is necessary to analyze the RCF behaviors of turnout rails and the main parameters influencing the rail RCF in order to guide the simulation and prediction of rail damage in turnouts.
Wheel-rail RCF is a longstanding worldwide problem, and has been one of the research topics of international academic conferences such as the Conference on Contact Mechanics (CM) and the International Association for Vehicle System Dynamics (IAVSD). Researchers have presented many numerical and experimental studies on wheel-rail RCF in sectional lines, which form the basis for studying rail RCF in turnouts. However, considering the complicated structure of turnouts, the research is more difficult. Nicklisch et al. [
5] presented a method for simulating the wear, RCF and plastic deformation of turnout switch/crossing panel rails, and used the method to evaluate the effects before and after the turnout geometric size and rails are optimized. Nielsen et al. [
3] presented a numerical method for calculating the accumulated wear and RCF of turnout switch panel rails, for which, the random process of vehicle motion was simulated through discretizing the dynamic parameters of the vehicle-turnout system, the Archard model was used to predict the rail wear, and the rail RCF was predicted according to the Palmgren–Miner rule and a model deduced based on the Shakedown theory. In addition, they also evaluated the structural design of turnout switches based on this method. Markine, Wan and Wang et al. [
6,
7,
8] optimized the track stiffness and rail profiles in order to reduce the dynamic wheel-rail interaction at turnout zones and solve problems such as rail wear and fatigue of turnout rails. Pletz et al. [
9] presented a finite element model for crossing with a single running wheel according to the wheel-rail vibration, elastic wheel deformation and plastoelastic rail deformation, in order to calculate the dynamic wheel-rail interaction, then they also presented a simplified finite element model for calculating the dynamic wheel-crossing interaction [
10], according to the influence of grid precision and calculation time, through setting appropriate grid sizes. Based on this model, they performed a contrast analysis on the properties of three materials used for crossings, Manganese steel, Hardox and Marage300 according to the generation and development of RCF cracks. Xin et al. [
4] presented a finite element model with regard to crossing with a single running wheel-set in order to calculate the dynamic wheel-rail interaction, and studied the generation and fatigue process of RCF cracks of crossing rails based on their model. Researchers from Yanshan University of China [
11,
12,
13] analyzed the wear and fatigue properties of high manganese steel/austenitic steel and bainitic steel materials used for crossings through material tests in order to realize good wear and fatigue resistance. At present, for the calculation of wheel-rail contact information of turnout switches, researchers usually consider a switch rail and a stock rail as a combined part. This paper presents a further study on the wheel-rail RCF behavior of turnout switches according to the relative motion of stock/switch rails.
In the early stages, the factorial design method was mainly adopted for determining active factors influencing the designs of products, and has been proven to be a feasible and effective method for selecting significant influence factors. The saturated factorial design method has been adopted widely in fields such as physics, biology and finance. However, the mutual influence among all factors must always be considered in this method and the calculation load is heavy if there are many active factors. In addition, many replicated tests will be required [
14]. In response to this, unreplicated saturated factorial design methods can greatly shorten the test process and calculation time [
15]. Hence, in the past 40 years, researchers have presented many unreplicated saturated factorial design methods, including normal or semi-normal probability graphs [
16], Dong93 [
17] and PSZ method [
18]. Based on a given nominal layout of turnout, Kassa and Nielsen [
1] used design of experiments methodology and a two-level fractional factorial screening design to select the most significant parameters related to the performance of railway turnout, including the axle load, wheel–rail friction coefficient, and wheel/rail profiles. Xu et al. [
19] adopted a two-level unreplicated saturated factorial design method to select active factors that influence the wear performance of turnout rails. However, there have been few studies that use the three-level unreplicated saturated factorial design method for selecting active factors influencing the damage to turnout rails. Compared to the two-level factorial design method, the three-level unreplicated saturated factorial design method can be adopted to solve more complicated system factorial design problems such as multi-scale material and non-linear structure problems.
The wheel-rail contact mechanics in railway turnout is important for the investigation of rail damage. In this paper, firstly, a wheel-rail rolling contact calculation model considering the relative motion of stock/switch rails is established, and the surface initiated RCF behavior of turnout switch rail is studied under different wheel-rail creep conditions. Secondly, the dynamic parameters which can significantly influence the rail surface initiated RCF of turnouts are selected by the three-level unreplicated saturated factorial design method. The conclusions of this work can provide a theoretical guidance for the simulation and prediction of rail RCF in turnouts.
4. Conclusions
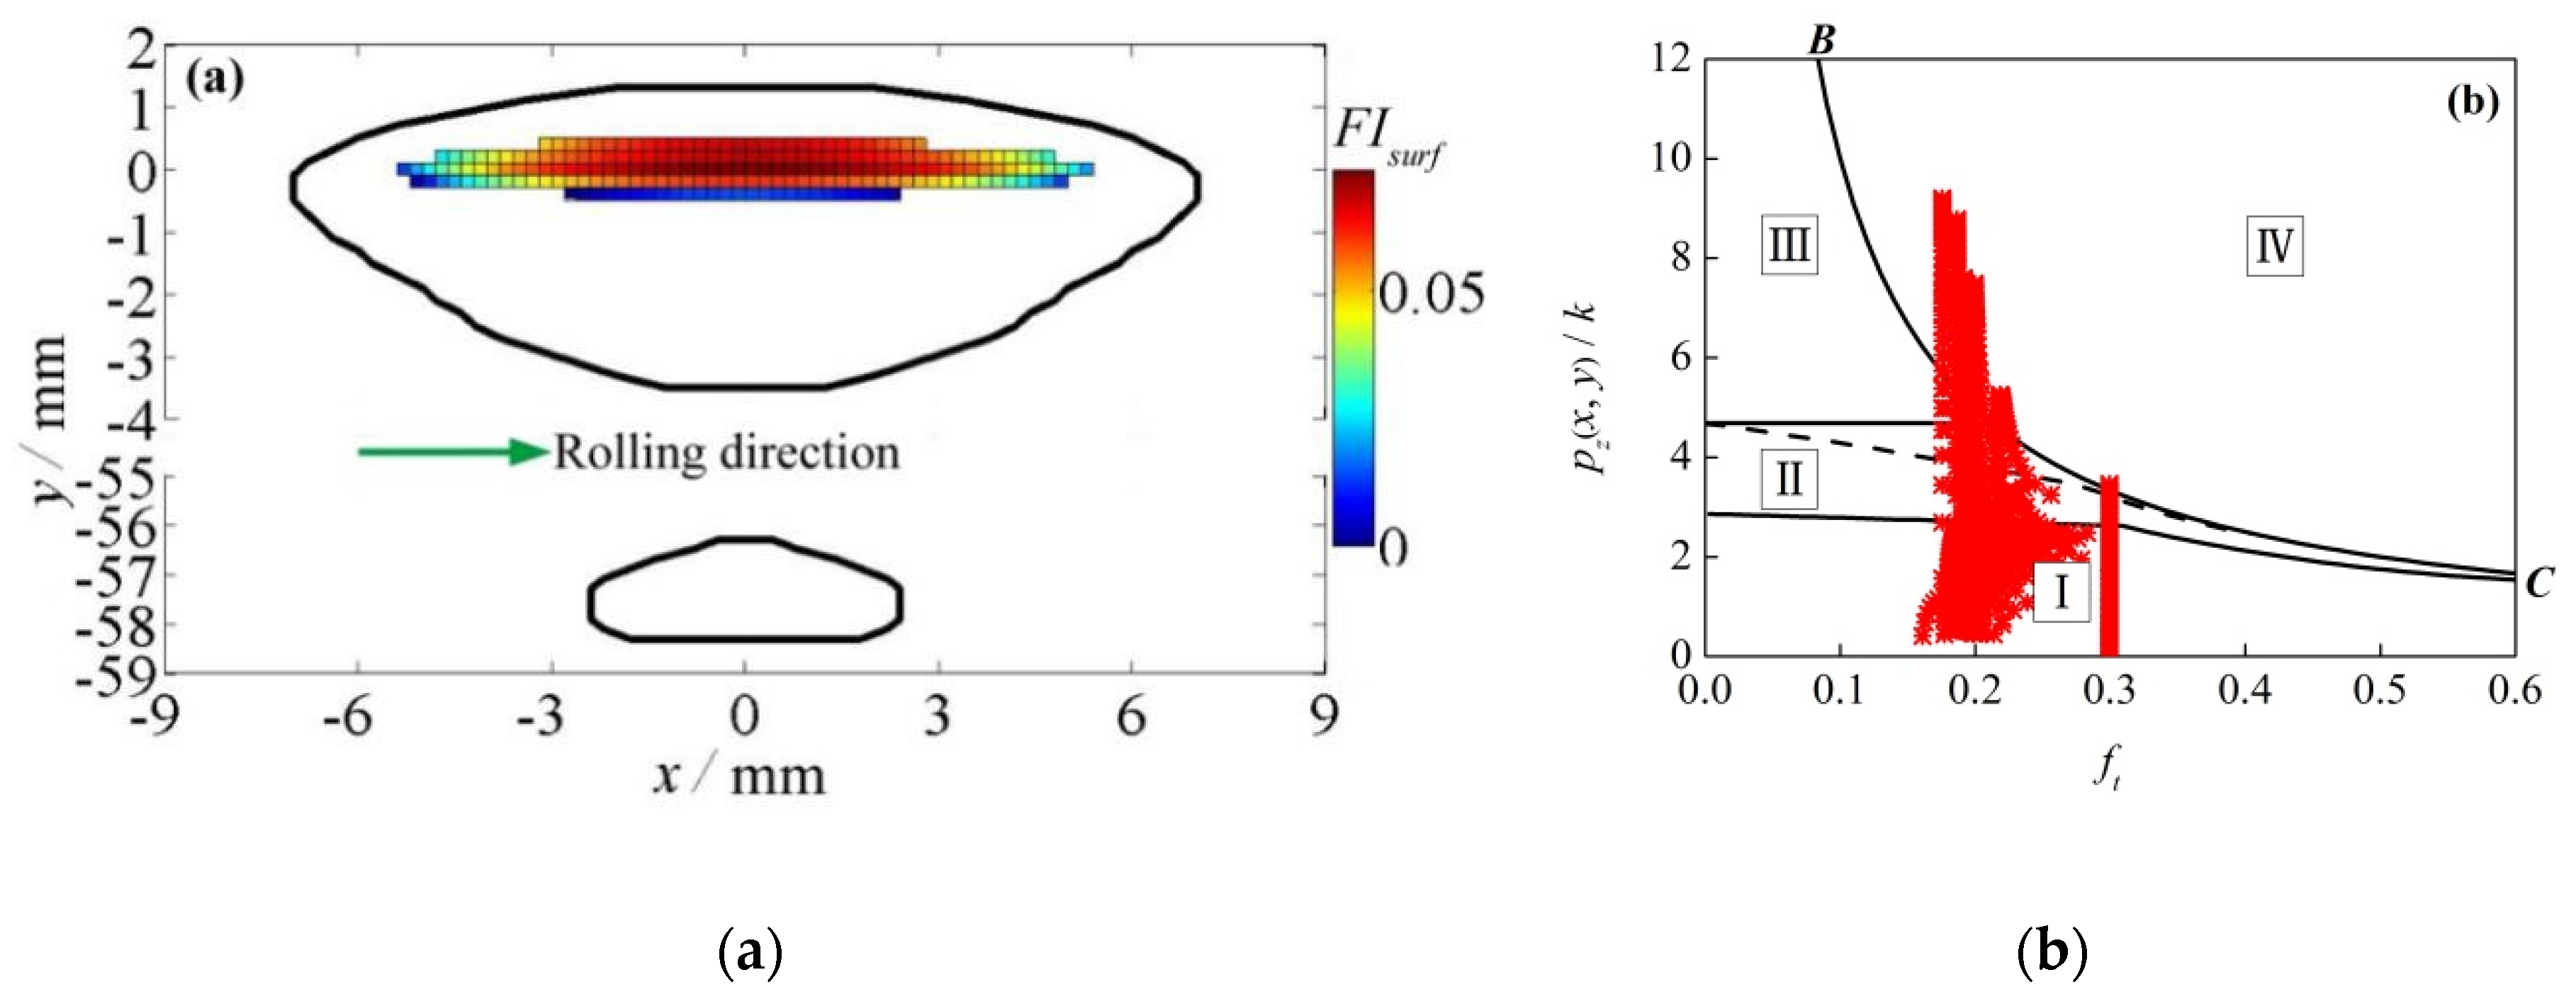
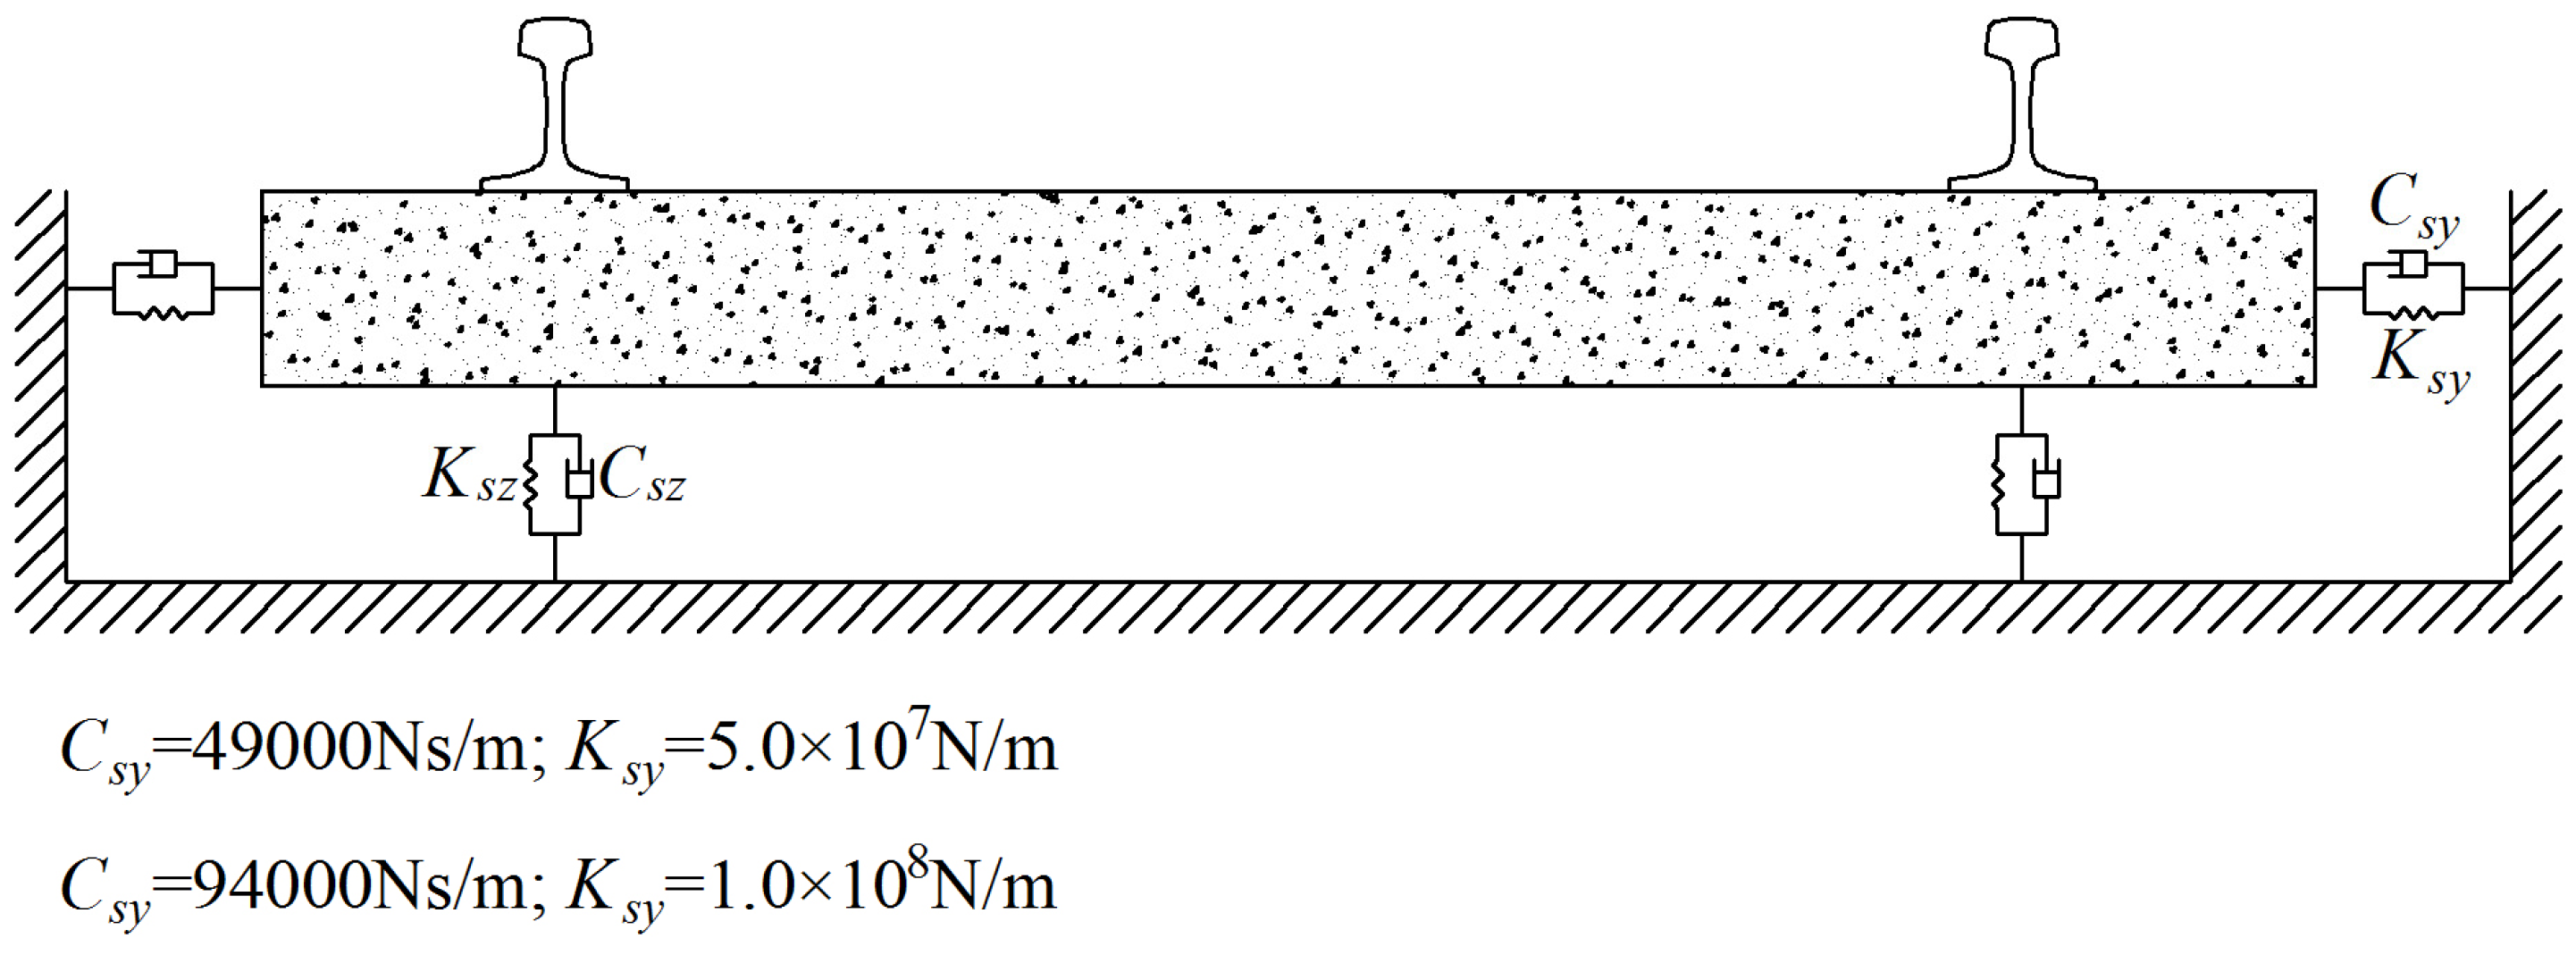
This paper, considering the relative motion of stock/switch rails, establishes a wheel-rail rolling contact model, simulates the rail surface initiated RCF behavior by taking a section of switch rail with the head width 35 mm in a high-speed railway turnout called CN60-1100-1:18 and a nominal LMA wheel profile as the objects of analysis, performs a contrast analysis on the rail surface initiated RCF of turnout under different wheel-rail creep conditions and finds that the material ratcheting effect is mainly caused by the overly high tangential stress on the rail surface material under low wheel-rail creep, overly high tangential stress and normal stress on the rail material under high wheel-rail creep and overly high normal stress on the rail under pure wheel-rail spin creep.
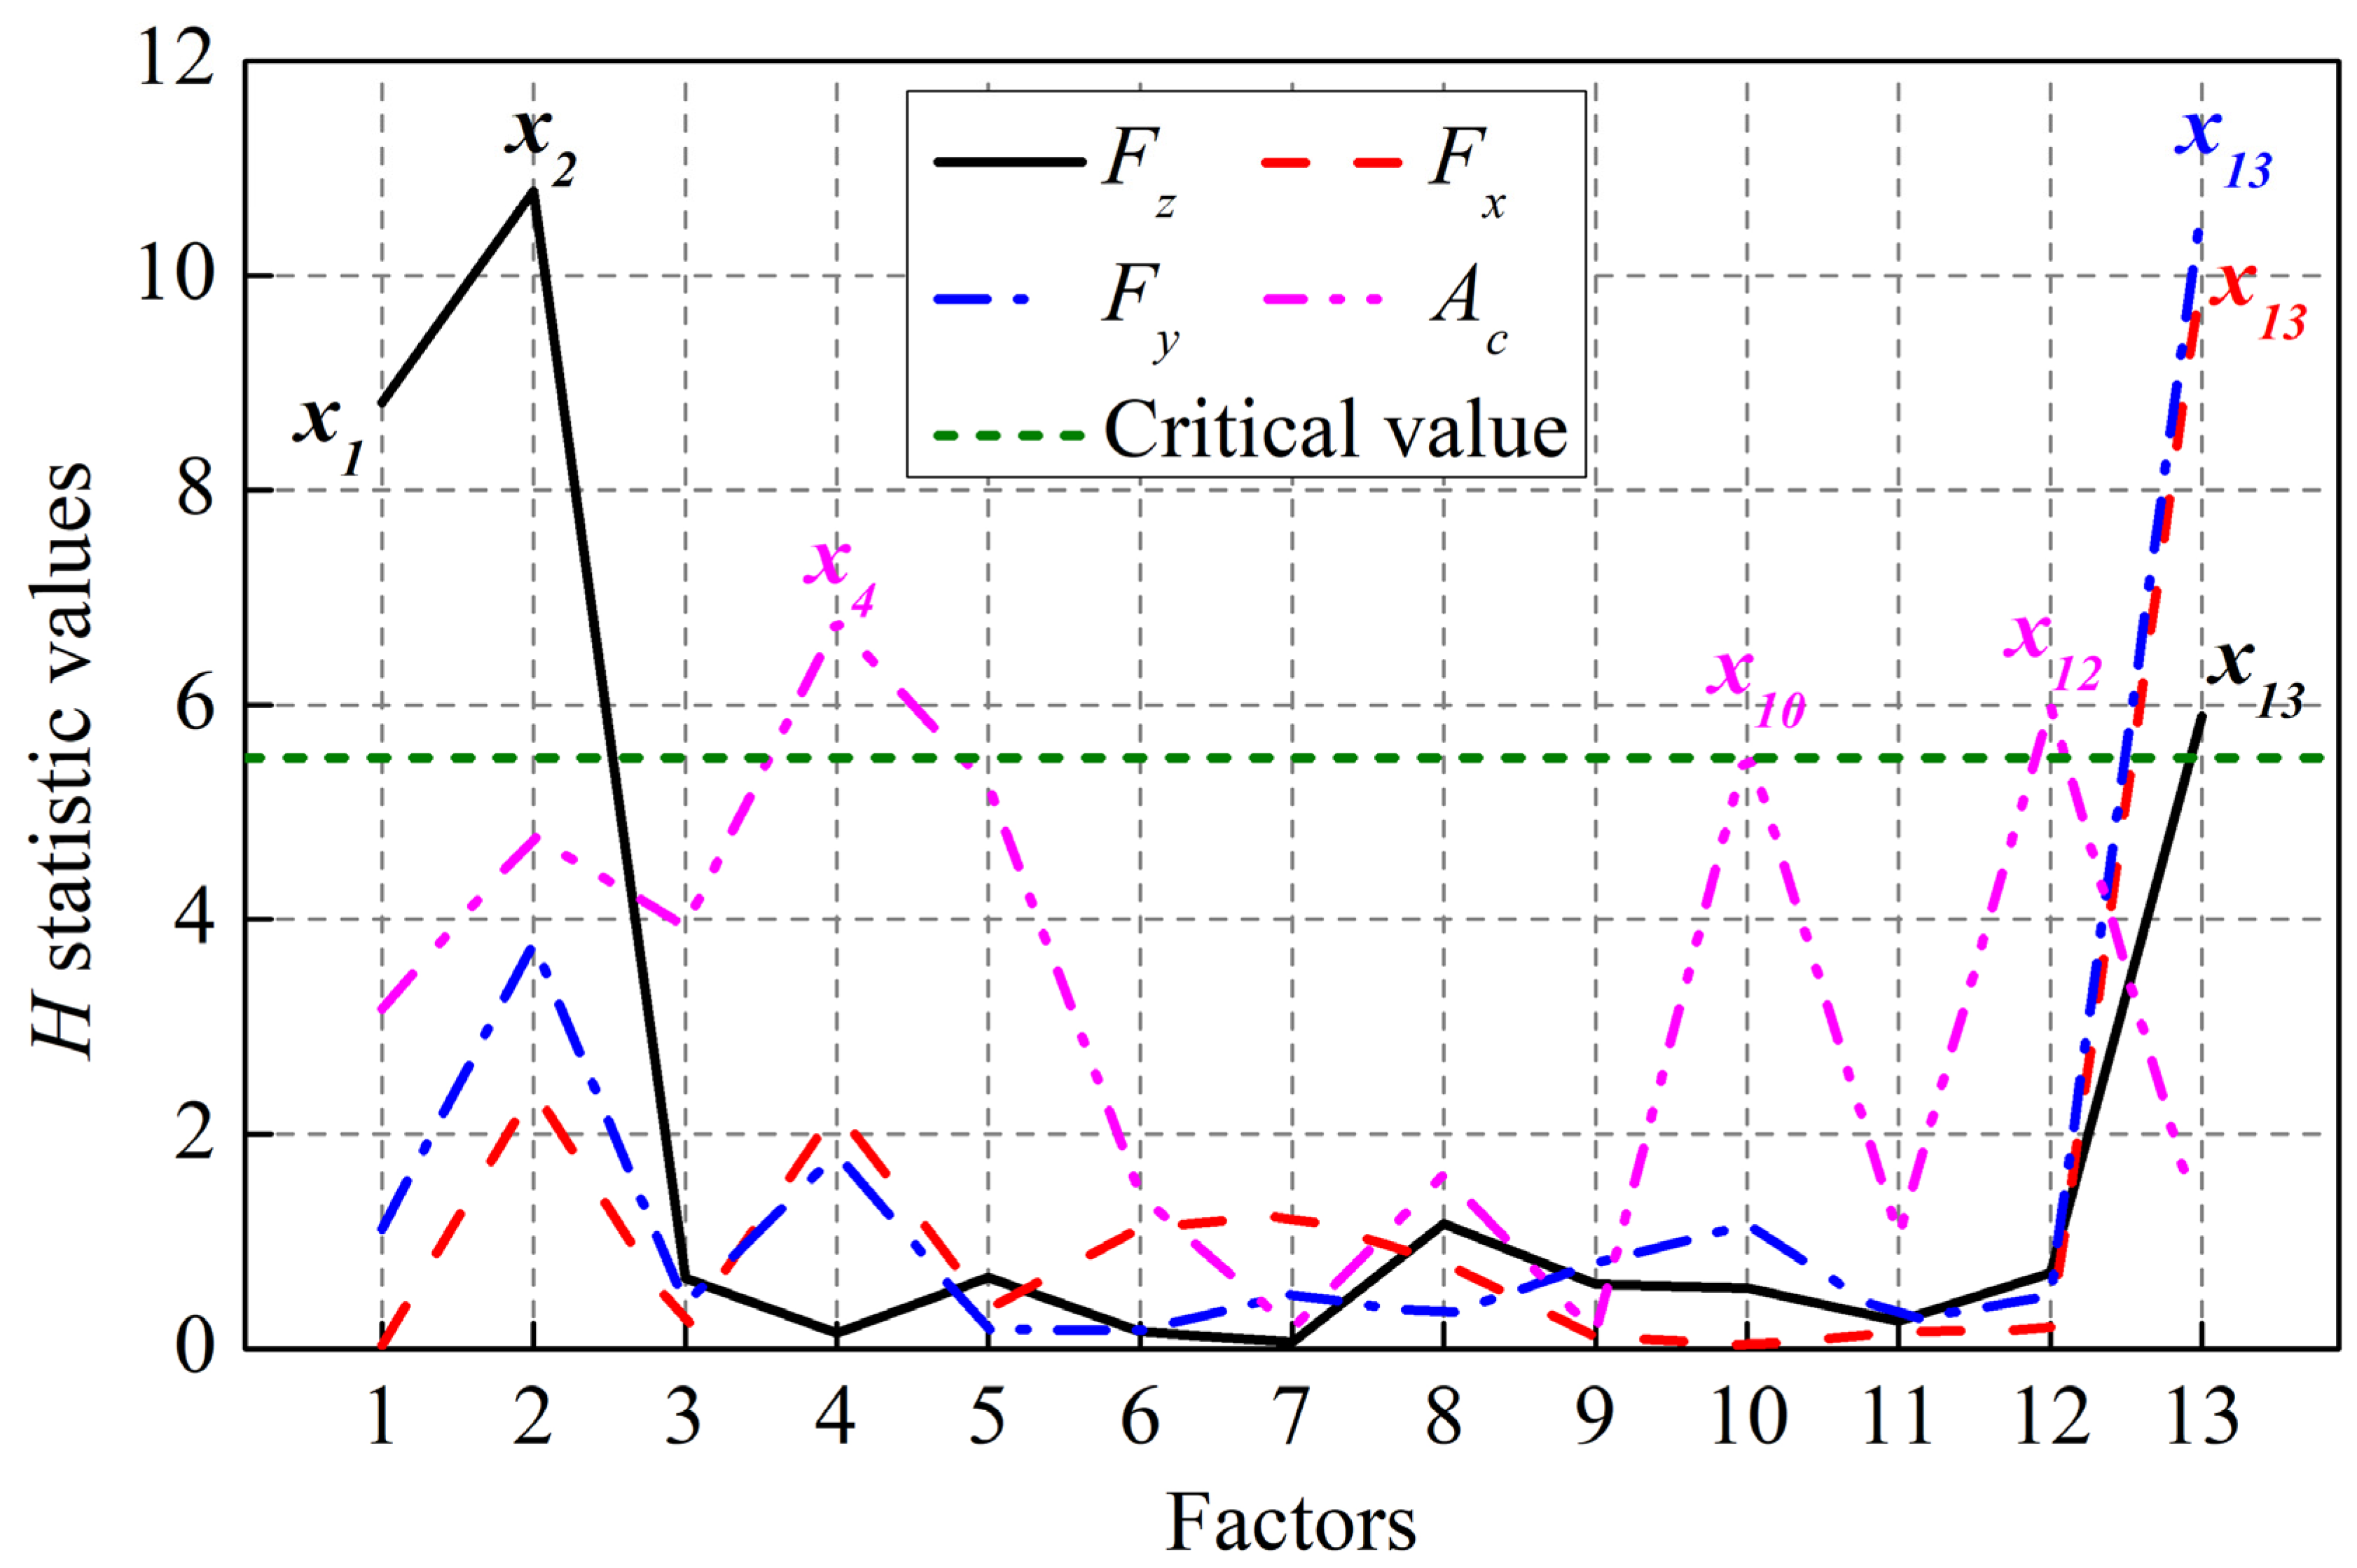
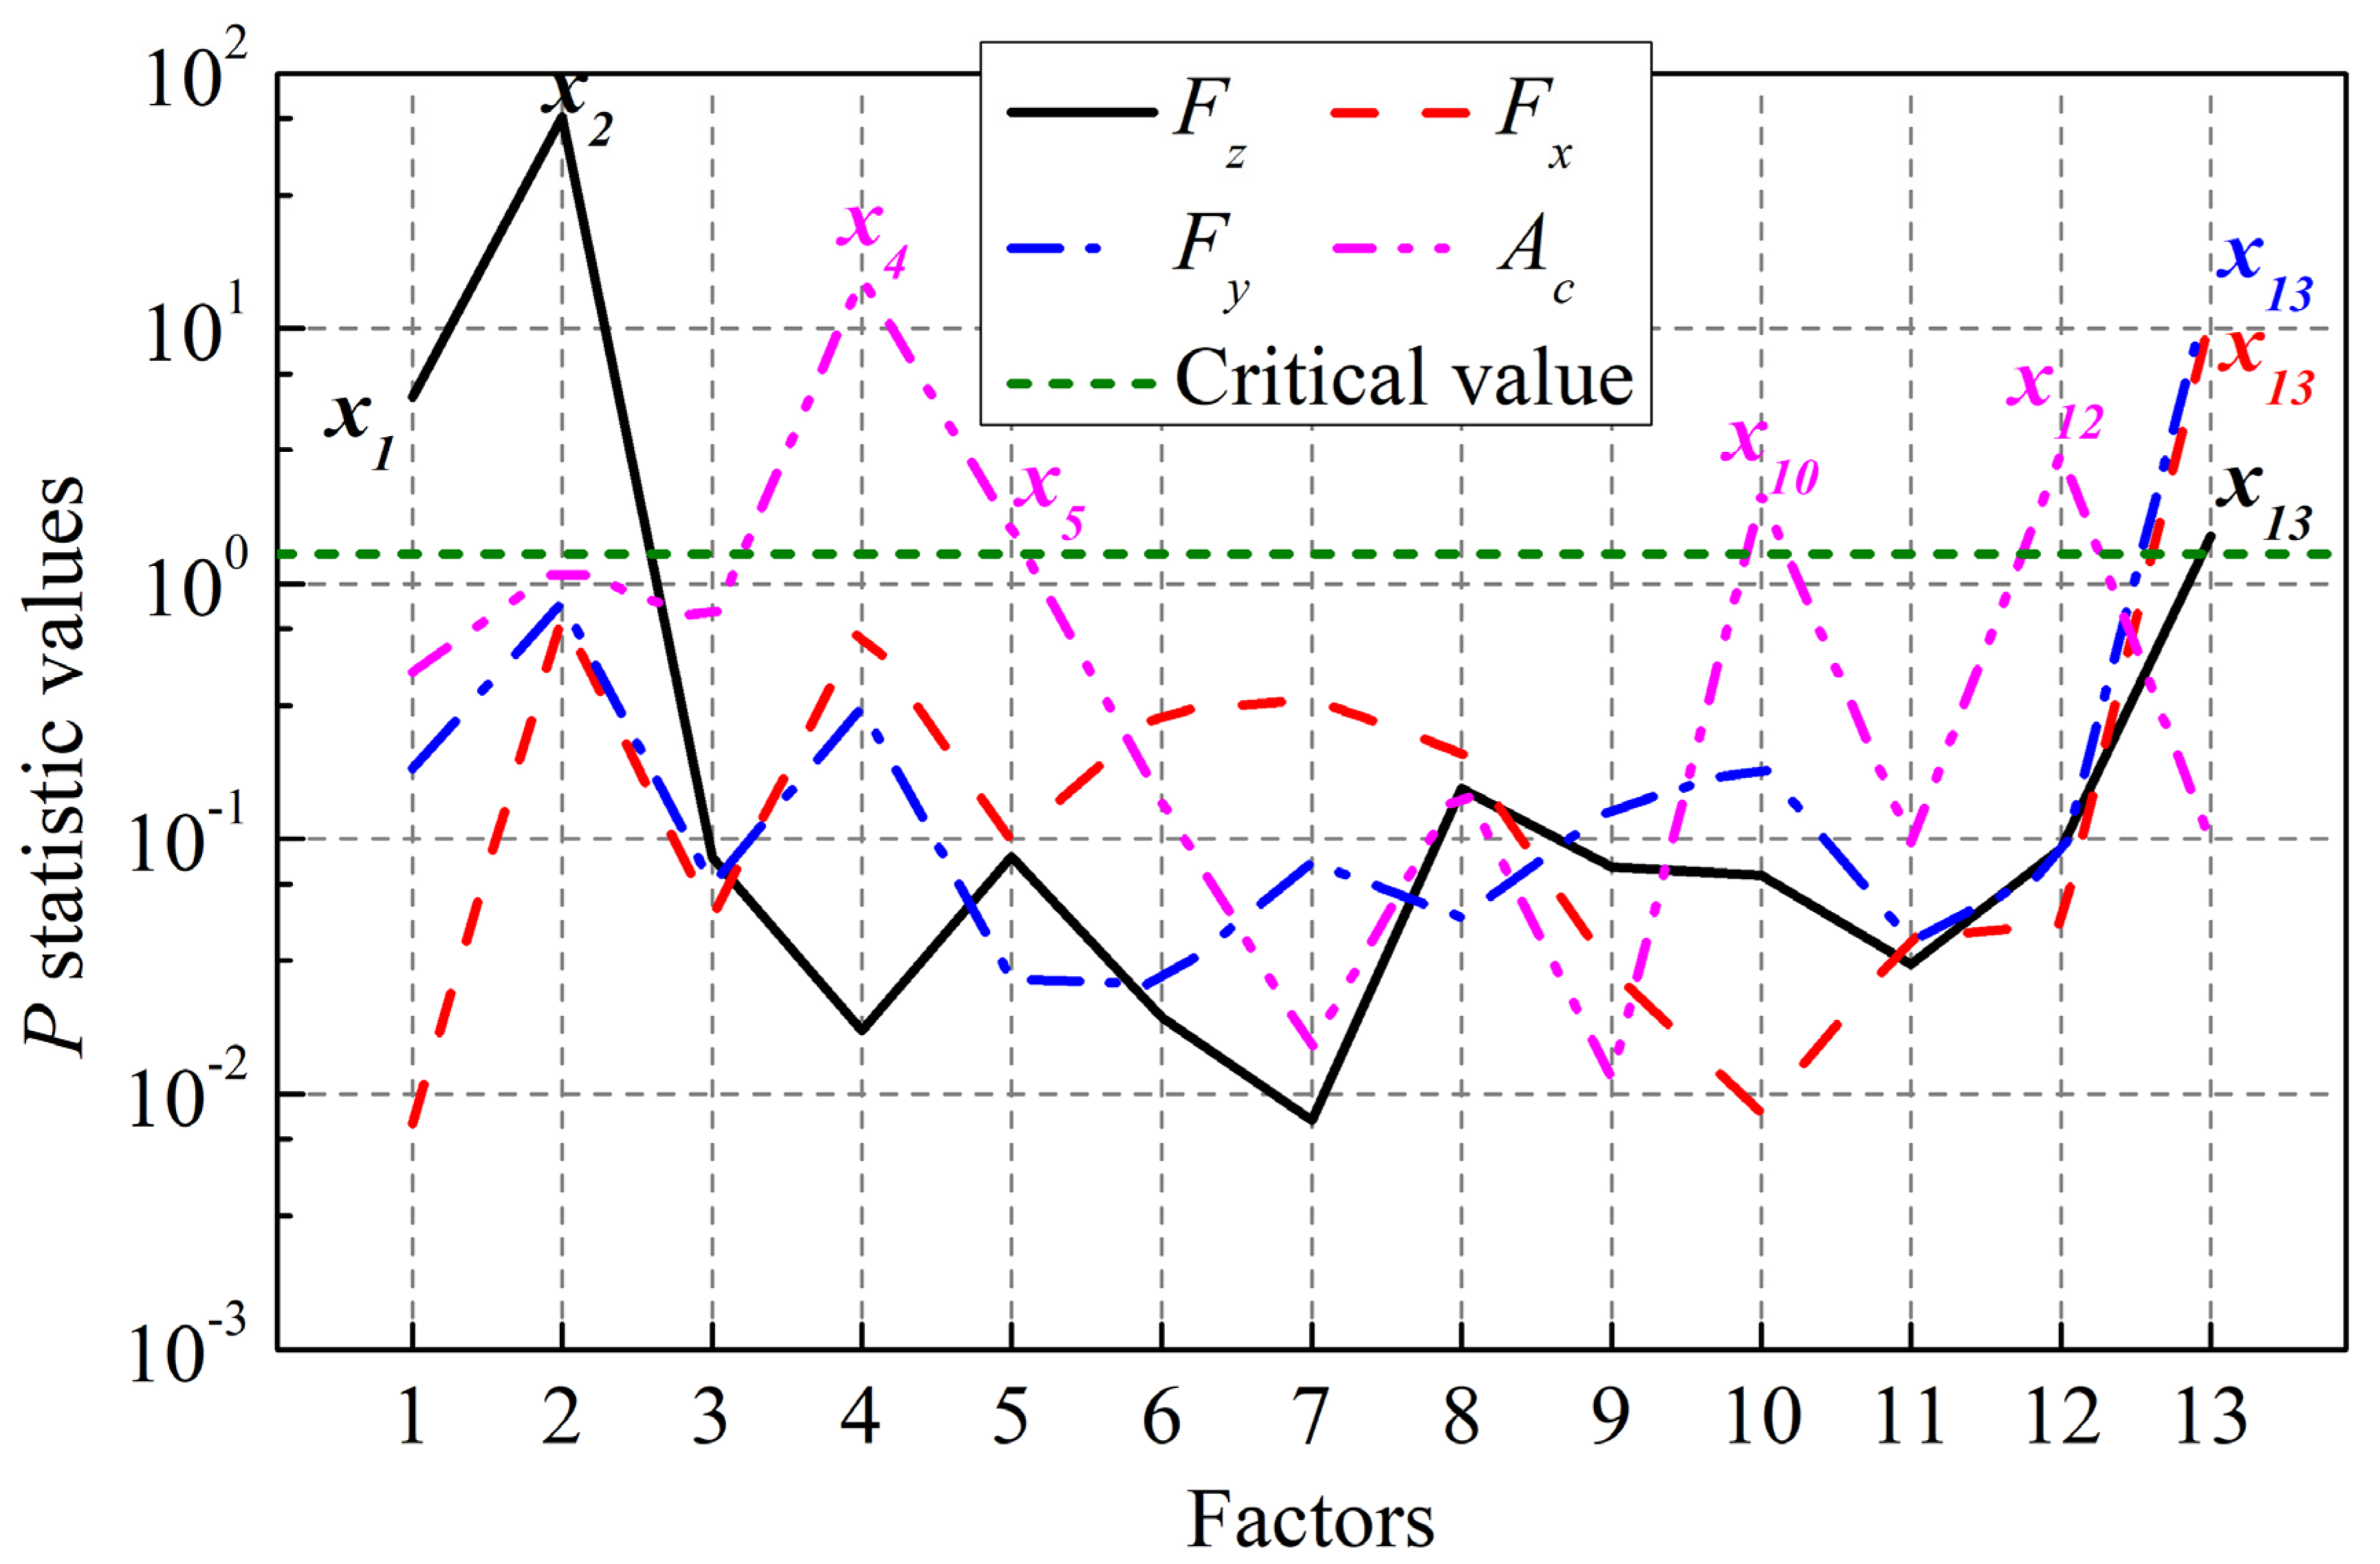
The dynamic parameters which can significantly influence turnout rail surface initiated RCF are selected according to the three-level unreplicated saturated factorial design method. The 13 dynamic parameters influencing the dynamic vehicle-turnout response are selected as the analysis factors first, then the normal wheel-rail force, longitudinal creep force, lateral creep force and contact patch area are selected as the observation parameters. The dynamic parameters influencing the rail surface initiated RCF of turnout are the train speed, train axle load, wheel-rail profile, integral vertical track stiffness and wheel-rail friction coefficient, respectively, which can be obtained according to the H/P/B statistic values. Based on a given nominal layout of ordinary turnout, axle load, wheel–rail friction coefficient, and wheel/rail profiles are selected as the parameters which could affect the performance of railway turnout significantly in the previous work. These conclusions could be corroborated by this paper. In addition, a high-speed railway turnout is used in the present work, and there are some different results, such as the integral vertical track stiffness.
This paper aims to provide guidance for the simulation and prediction of rail surface initiated RCF of turnout. This RCF is caused by a long-term accumulation and the influence of changing parameters of the vehicle-turnout system. Therefore, establishing a model for simulating and predicting this fatigue through generating random samples for dynamic parameters of the vehicle-turnout system and presenting a superimposition and accumulation method for rail surface initiated RCF damage is expected for further work. In addition, with the development of computer technology and finite element theory, some complicated wheel-rail rolling contact problems have been solved by the explicit finite element method [
38,
39]. Therefore, investigation of turnout rail surface initiated RCF behavior using this method is also the next step in the future works.


