1. Introduction
Significant progress has been made over the past decade in elucidating the physics of ultra-intense laser pulse interactions with solid targets. This has been motivated by fundamental investigations of plasma generation in extreme conditions and the development of compact laser-driven particle and radiation sources [
1,
2,
3]. The case of thin foil (∼0.2–20
m) targets has received particular attention due to their use in the development of ion acceleration based on sheath field formation [
4]. In addition, ultra-thin (∼1–200 nm) foils give rise to promising new ion acceleration mechanisms utilising the radiation pressure of the intense laser light, collectively referred to as radiation pressure acceleration (RPA) [
5,
6]. Foils that are sufficiently thin enough can undergo relativistic self-induced transparency (RSIT) [
7,
8,
9] during the interaction, which can be detrimental to RPA, but can enhance TNSA [
10,
11]. It can also result in phenomena such as streaming instabilities [
12,
13], relativistic electron jets [
14,
15,
16] and diffraction [
17,
18,
19], which can be applied to enhance or manipulate the beams of fast electrons and ions produced.
In the RPA scheme, electrons at the critical density surface (
; where
is the electron mass,
is the vacuum permittivity,
is the laser angular frequency and
is the electron charge), are driven forward into the overdense plasma by the laser pressure, producing a charge separation layer and creating strong electrostatic fields that in turn accelerate the ions. If the target thickness is much greater than the plasma skin depth (
, where
c is the speed of light in vacuum and
is the plasma frequency), then this mode of RPA is known as hole-boring (HB) [
20,
21,
22]. The recession velocity of the plasma critical density surface (PCDS) in this mechanism is recognized conventionally as the hole-boring velocity. This velocity is well described analytically in 1D (spatial) interactions, for relativistic laser intensities, as [
21,
22]:
where
and where
is the normalized vector potential,
is the electron density,
Z is the ionization state,
,
A the mass number and
is the proton mass. The mode of RPA for which the laser pressure is able to push all of the plasma electrons from across the target thickness (in the region of the most intense part of the laser focus) is known as light sail (LS) [
23,
24]. This RPA mode is expected to dominate over HB for the case of target thickness on the order of the plasma skin depth (i.e., nanometres for solid density targets). An important parameter for LS is the pulse energy per unit surface, or pulse fluence,
F:
The light sail velocity is defined as [
23]:
where
and where the target density
, for the case of perfect reflection.
It follows that
and
, and thus the ion kinetic energy, scales favourably with laser intensity. In principle, in the LS scenario, quasi-monoenergetic ion beams with energies in the hundreds-of-MeV to few-GeV per nucleon range should be possible when driving this mechanism with multi-petawatt lasers presently under development [
24,
25,
26,
27]. The onset of RSIT, however, reduces the radiation pressure and thus the ion energies achievable. A precise characterization of the onset of RSIT and the resulting changes to the PCDS dynamics is thus essential to gauge the viability of RPA as an efficient acceleration mechanism for a given laser intensity and target thickness.
In this paper, we present an experimental characterization of the movement of the PCDS in response to ultra-intense laser radiation, in target foils ranging in thickness from tens to hundreds of nanometres. This is based on measurements of the degree of red-shift in back-reflected second harmonic radiation produced at the laser focus. Together with measurements of the fraction of laser light transmitted through the foil, the conditions for which the HB and LS modes of RPA dominate and the onset of RSIT occurs are determined. The measurements are compared with 2D particle-in-cell (PIC) simulation results showing the temporal and spatial evolution of the PCDS dynamics, and with analytical models of HB and LS. The thickness ranges for which distinct laser-plasma interaction regimes, corresponding to HB-dominant, LS-dominant and the onset of RSIT, occur are determined.
2. Experimental Results
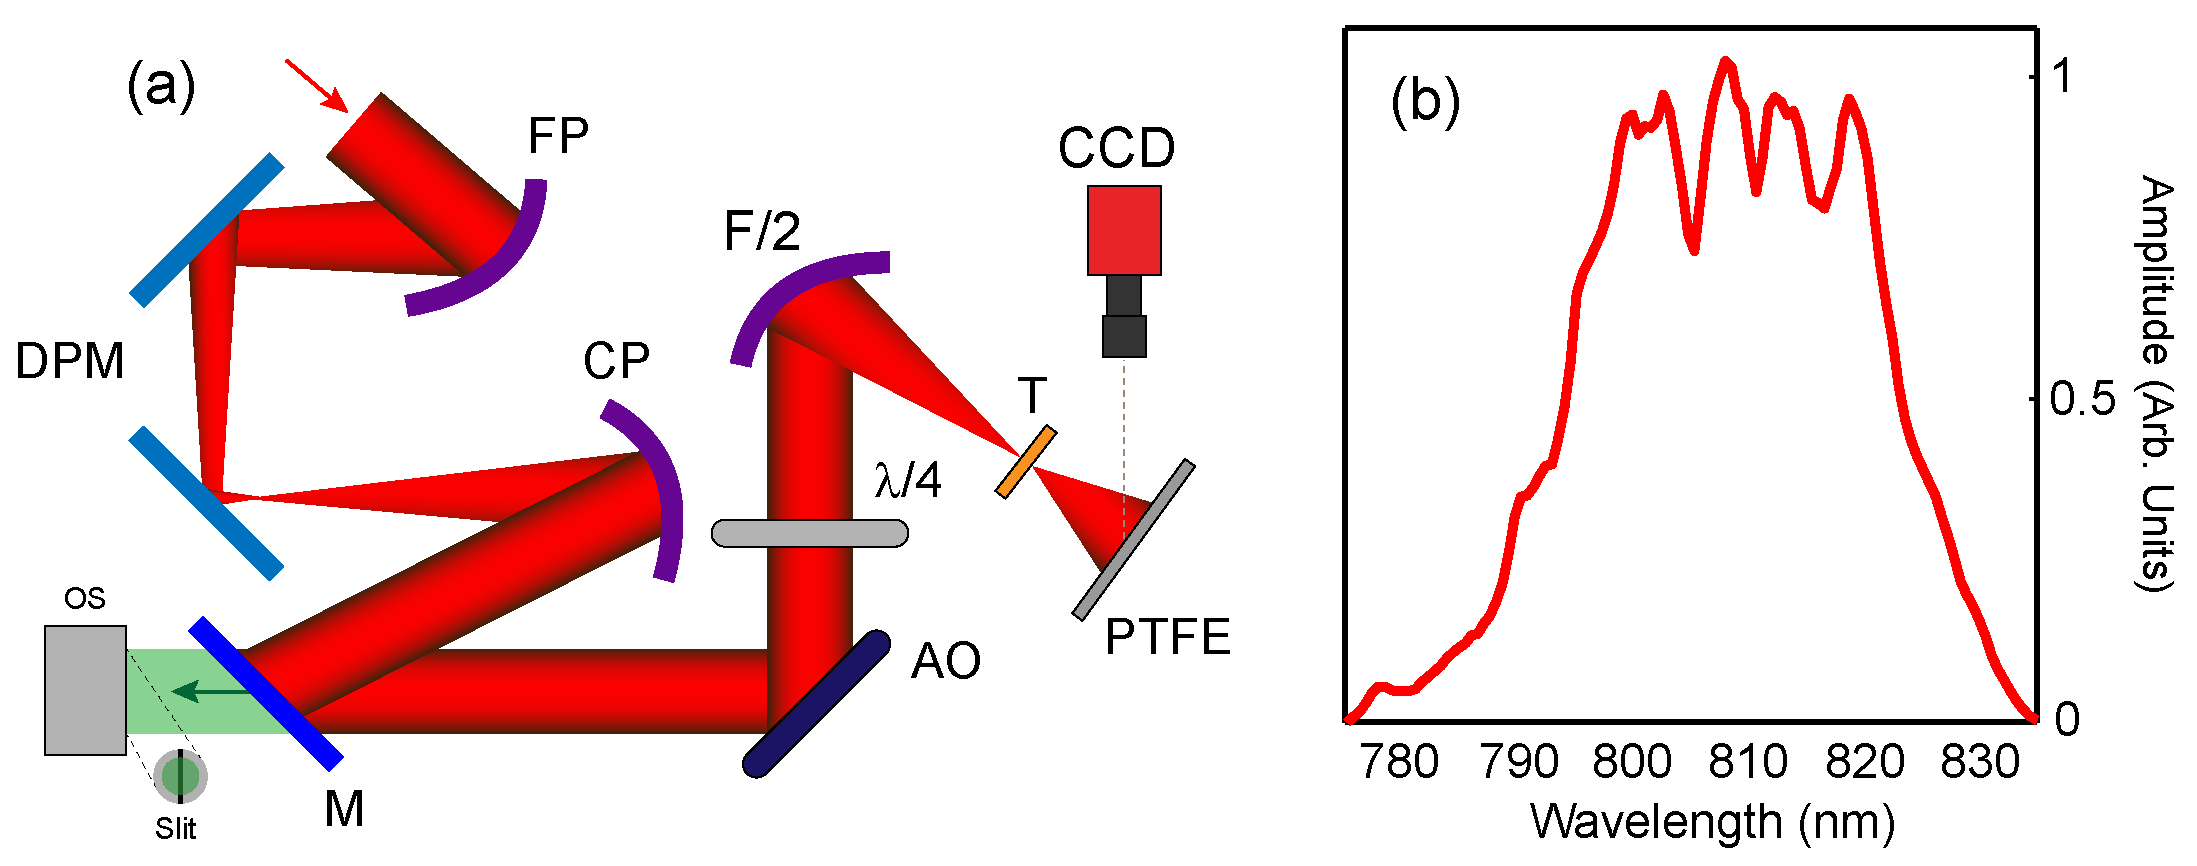
The experiment was performed using the Gemini laser at the Rutherford Appleton Laboratory, which delivers pulses of duration
40 fs (full width at half maximum, FWHM) at ∼810 nm central wavelength,
. The inherent intensity contrast ratio of the laser beam was enhanced by using a double plasma mirror system [
28], to achieve measured values of ∼10
at 5 ps and ∼10
at 1 ns prior to the peak of the pulse. The pulse was also reflected from an adaptive optic mirror in order to minimise aberrations of the laser wavefront and therefore produce a high quality focal spot. A
/4 wave plate was positioned in the beam to produce circularly polarized light. The beam was focused using a F/2 off-axis parabolic mirror to a spot with diameter equal to 3
m (FWHM). An energy of ∼2 J was measured within the focal spot FWHM, resulting in a calculated peak intensity of 6 × 10
Wcm
. Planar aluminium target foils with thickness,
l, equal to 10, 20, 40, 50, 100 and 200 nm were employed, with the target irradiated at normal incidence. Harmonic radiation produced at the PCDS is collected by same parabolic mirror, reflected back down the beam path and transmitted through a dielectric turning mirror, where it is measured using an optical spectrometer (detailed below), as shown in
Figure 1a.
Figure 1b shows a reference spectrum of the incident laser pulse.
Early in the interaction with the laser pulse, plasma electrons are heated, driving expansion of the target and thus the PCDS moves against the laser pulse propagation direction, resulting in it being blue-shifted with respect to a stationary detector, due to the relativistic Doppler effect. As the laser intensity increases, a point is achieved in which the radiation pressure exceeds the plasma thermal pressure and thus the PCDS is driven inward and the laser undergoes hole-boring, giving rise to red-shifting of the reflected light. Both the fundamental wavelength and harmonics produced at the PCDS are shifted by an amount defined by the PCDS velocity, as follows:
where
is the nominal wavelength of the second harmonic (i.e.,
) and
is the shifted wavelength.
Measuring the wavelength shift of the reflected light thus enables the velocity of the PCDS to be determined. The second harmonic is used, in preference to the fundamental wavelength, because it is produced in the intense region of the focal spot (resulting in less spatial averaging), in a smaller temporal window near the peak of the pulse (less temporal averaging) and is subject to significantly less nonlinear effects, such as self-phase modulation, which contribute to spectral broadening (or narrowing). Those processes can mask wavelength shifts arising from the PCDS dynamics. The spectrum of light in the back reflected path was measured using an optical spectrometer (Andor Shamrock model 303i). This spectrometer enables 1D spatially resolved measurements (the other detector dimension corresponds to spectral spread) via the incorporation of a narrow slit (50 m width) in the signal input.
In addition to the measurements of reflected light, the laser energy transmitted through the target foil was also diagnosed by measuring the light on a PTFE scatter screen positioned 30 cm behind it (see
Figure 1a). The laser energy on the screen was calibrated by taking full energy shots without a target in place (to determine the light level corresponding to 100% of the laser energy delivered to target) and the linearity of the response was calibrated by taking shots with reduced energy.
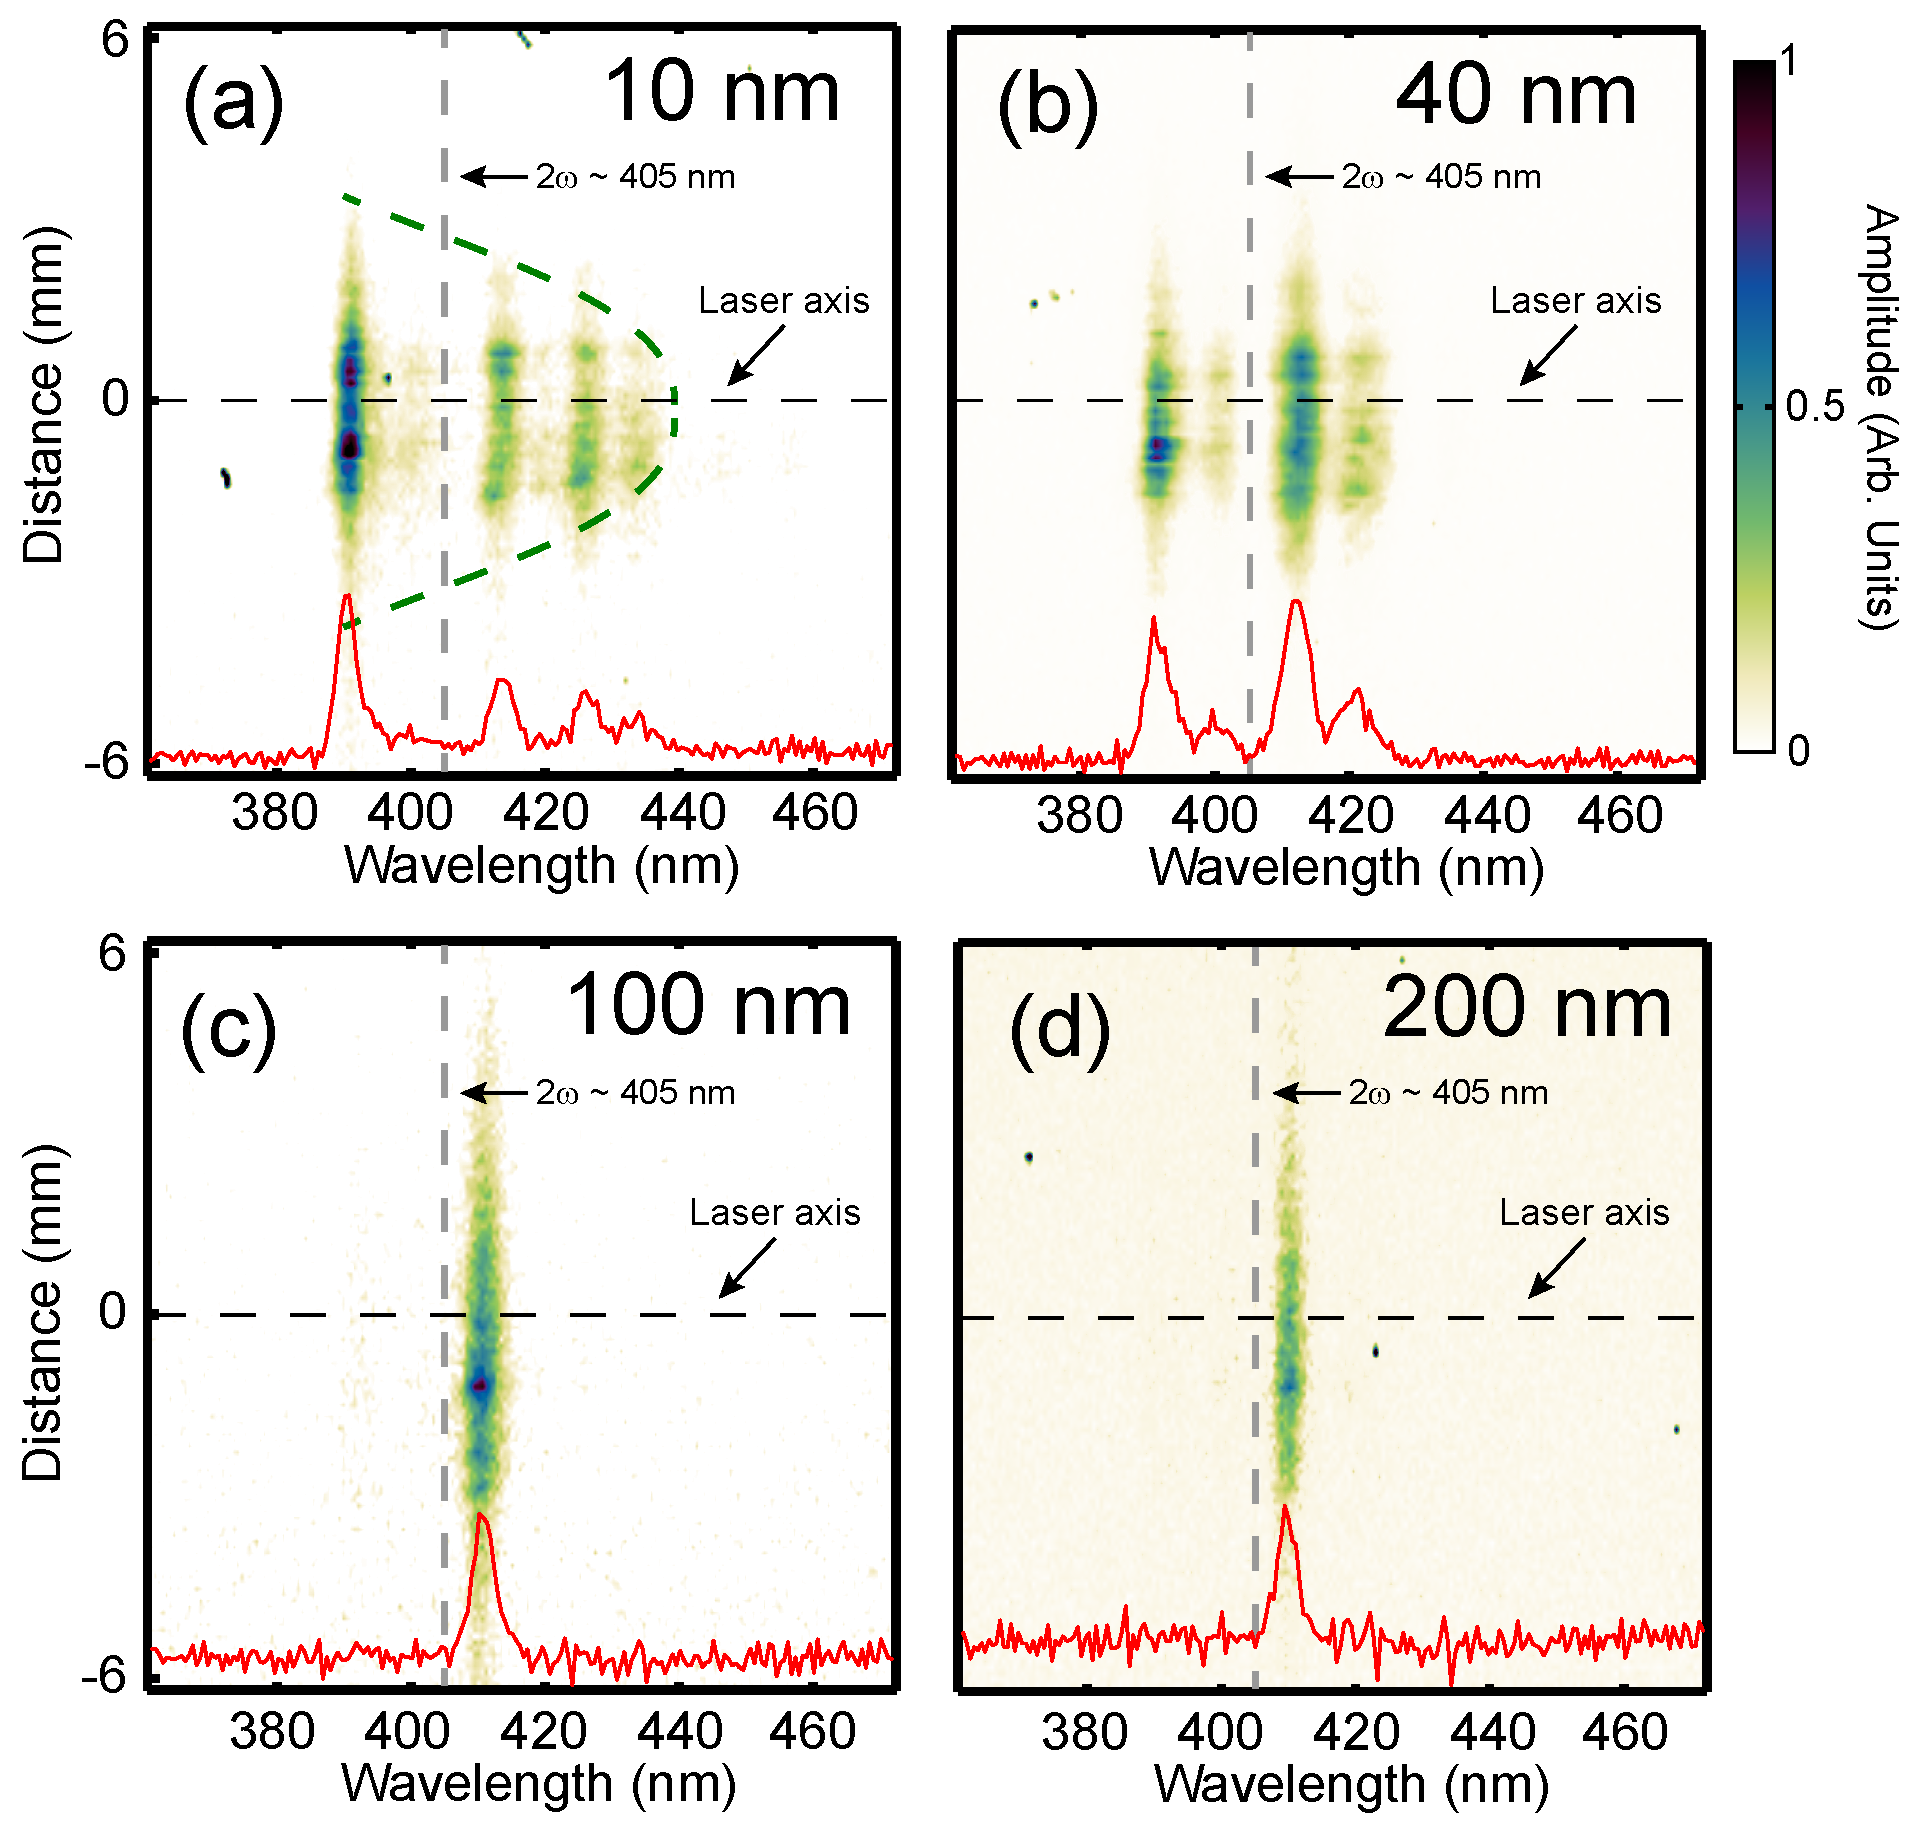
Figure 2 shows examples of the measured 1D spatially-resolved spectrum of the back-reflected second harmonic radiation for
l = 10, 40, 100 and 200 nm targets. The spectral width of the peaks shown in the line-outs is ∼5 nm (FWHM). Whilst this is in relatively good agreement with the expected pulse duration-bandwidth product for a 40 fs pulse of 400 nm light (5.9 nm assuming a Gaussian profile and 4.3 nm for Sech-squared), there may be additional mechanisms occurring during the interaction which lead to this narrow spectral width. This aspect will be investigated in follow-on work. For the
l = 100 nm and
l = 200 nm cases, the measured red shift (due to the surface recession as it is driven forward by the laser pressure) is small and occurs over a wide radius compared to the thinner targets. The measurements for the
l = 10 nm and
l = 40 nm cases show a significantly larger degree of red-shift, as well as some blue shift, which is likely to be produced by significant expansion of the ultrathin foils at the beginning of the interaction. Both are present because the spectral measurements are time-integrated. We also note the presence of spectral structure (or ‘stripes’) with wavelengths corresponding to lower degrees of red-shift. We believe this to result from the excessive deformation of the target critical surface in the thinnest foils, coupled with the variation in PCDS velocity with radius, which produces a complex interference pattern in the back-reflected light. This aspect will be investigated in more detail in future work. The largest red-shift is produced by the region of highest velocity (i.e., the peak of the spatial intensity distribution) and is not affected by the interference at the slightly lower wavelengths. Thus, the maximum PCDS velocity is obtained by measuring the cut-off wavelength corresponding to the largest degree of red-shift (i.e., the rightmost stripe) and using this in the calculation based on Equation (
6).
3. PIC Simulation Results
Simulations were performed using the fully relativistic 2D EPOCH PIC code [
29] to investigate how the PCDS dynamics differ over a range of target thicknesses. In the case of the thinnest target considered (
l = 10 nm), the simulation box was 5
m × 7.68
m, with mesh cell size equal to 1 nm, and for all other targets (with thickness up to
l = 500 nm), the box had dimensions of 2.2
m × 7
m, with a mesh cell size of 4 nm. The smaller mesh size was necessary for
l = 10 nm to have enough cells across the target thickness. There were 840 particles per cell per species for
l = 10 nm, and a range of 440–17.6 particles per cell per species for
l = 20–500 nm. The lower particles per cell numbers may induce additional noise into the system but the effect on the overall behaviour will be negligible. The pulse temporal and spatial profiles are Gaussian, with FWHM equal to 40 fs and 3
m, respectively and the peak of the pulse arrives at the target at
t = 40 fs. The energy of the pulse was defined to produce a peak laser intensity of 6 × 10
Wcm
, to match the experiment. Simulations were performed for circularly polarized light of 800 nm wavelength. The representative targets were initially defined as solid Al
neutralized with a corresponding electron density, justified because the sharp rising edge intensity profile will result in full ionization of the target before significant expansion can occur. The initial electron temperature was 1 keV.
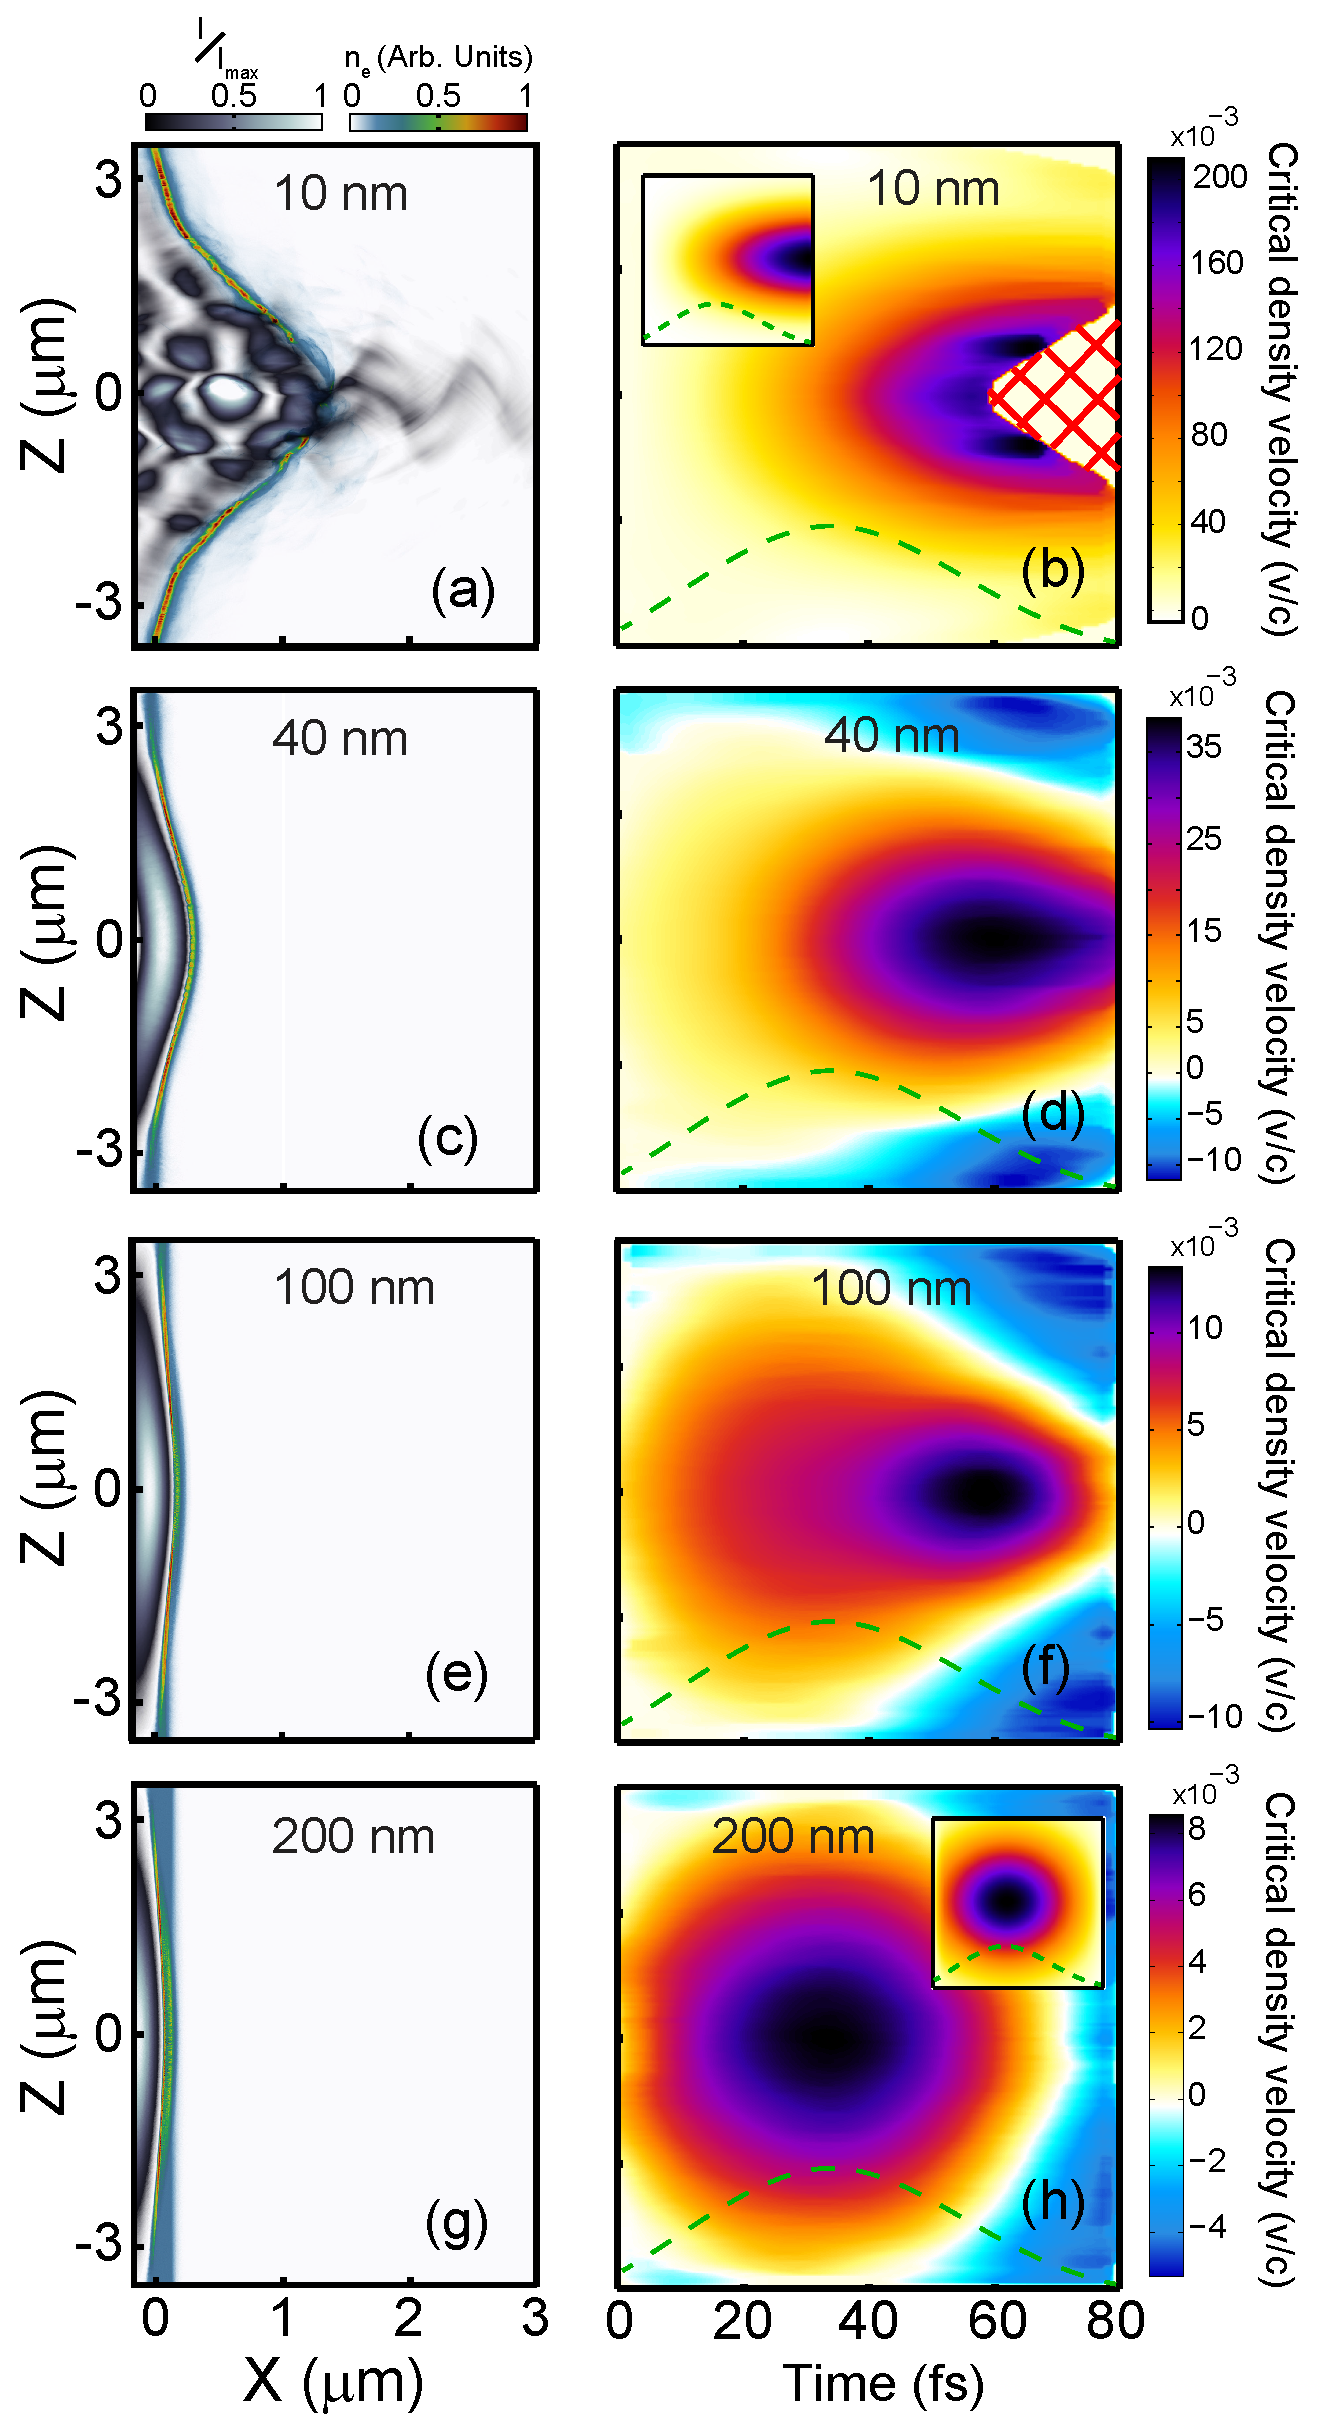
Figure 3a,c,e,g show 2D spatial maps of the electron density and laser intensity in the 2D PIC simulations at a point in time (
t = 65 fs) just after the
l = 10 nm target undergoes RSIT, for stated target thicknesses. It can be seen that the laser radiation pressure compresses and drives forward the plasma electrons. As the laser pulse has a Gaussian intensity profile (both temporal and spatially), the electron velocity is peaked on axis, where the laser intensity is highest.
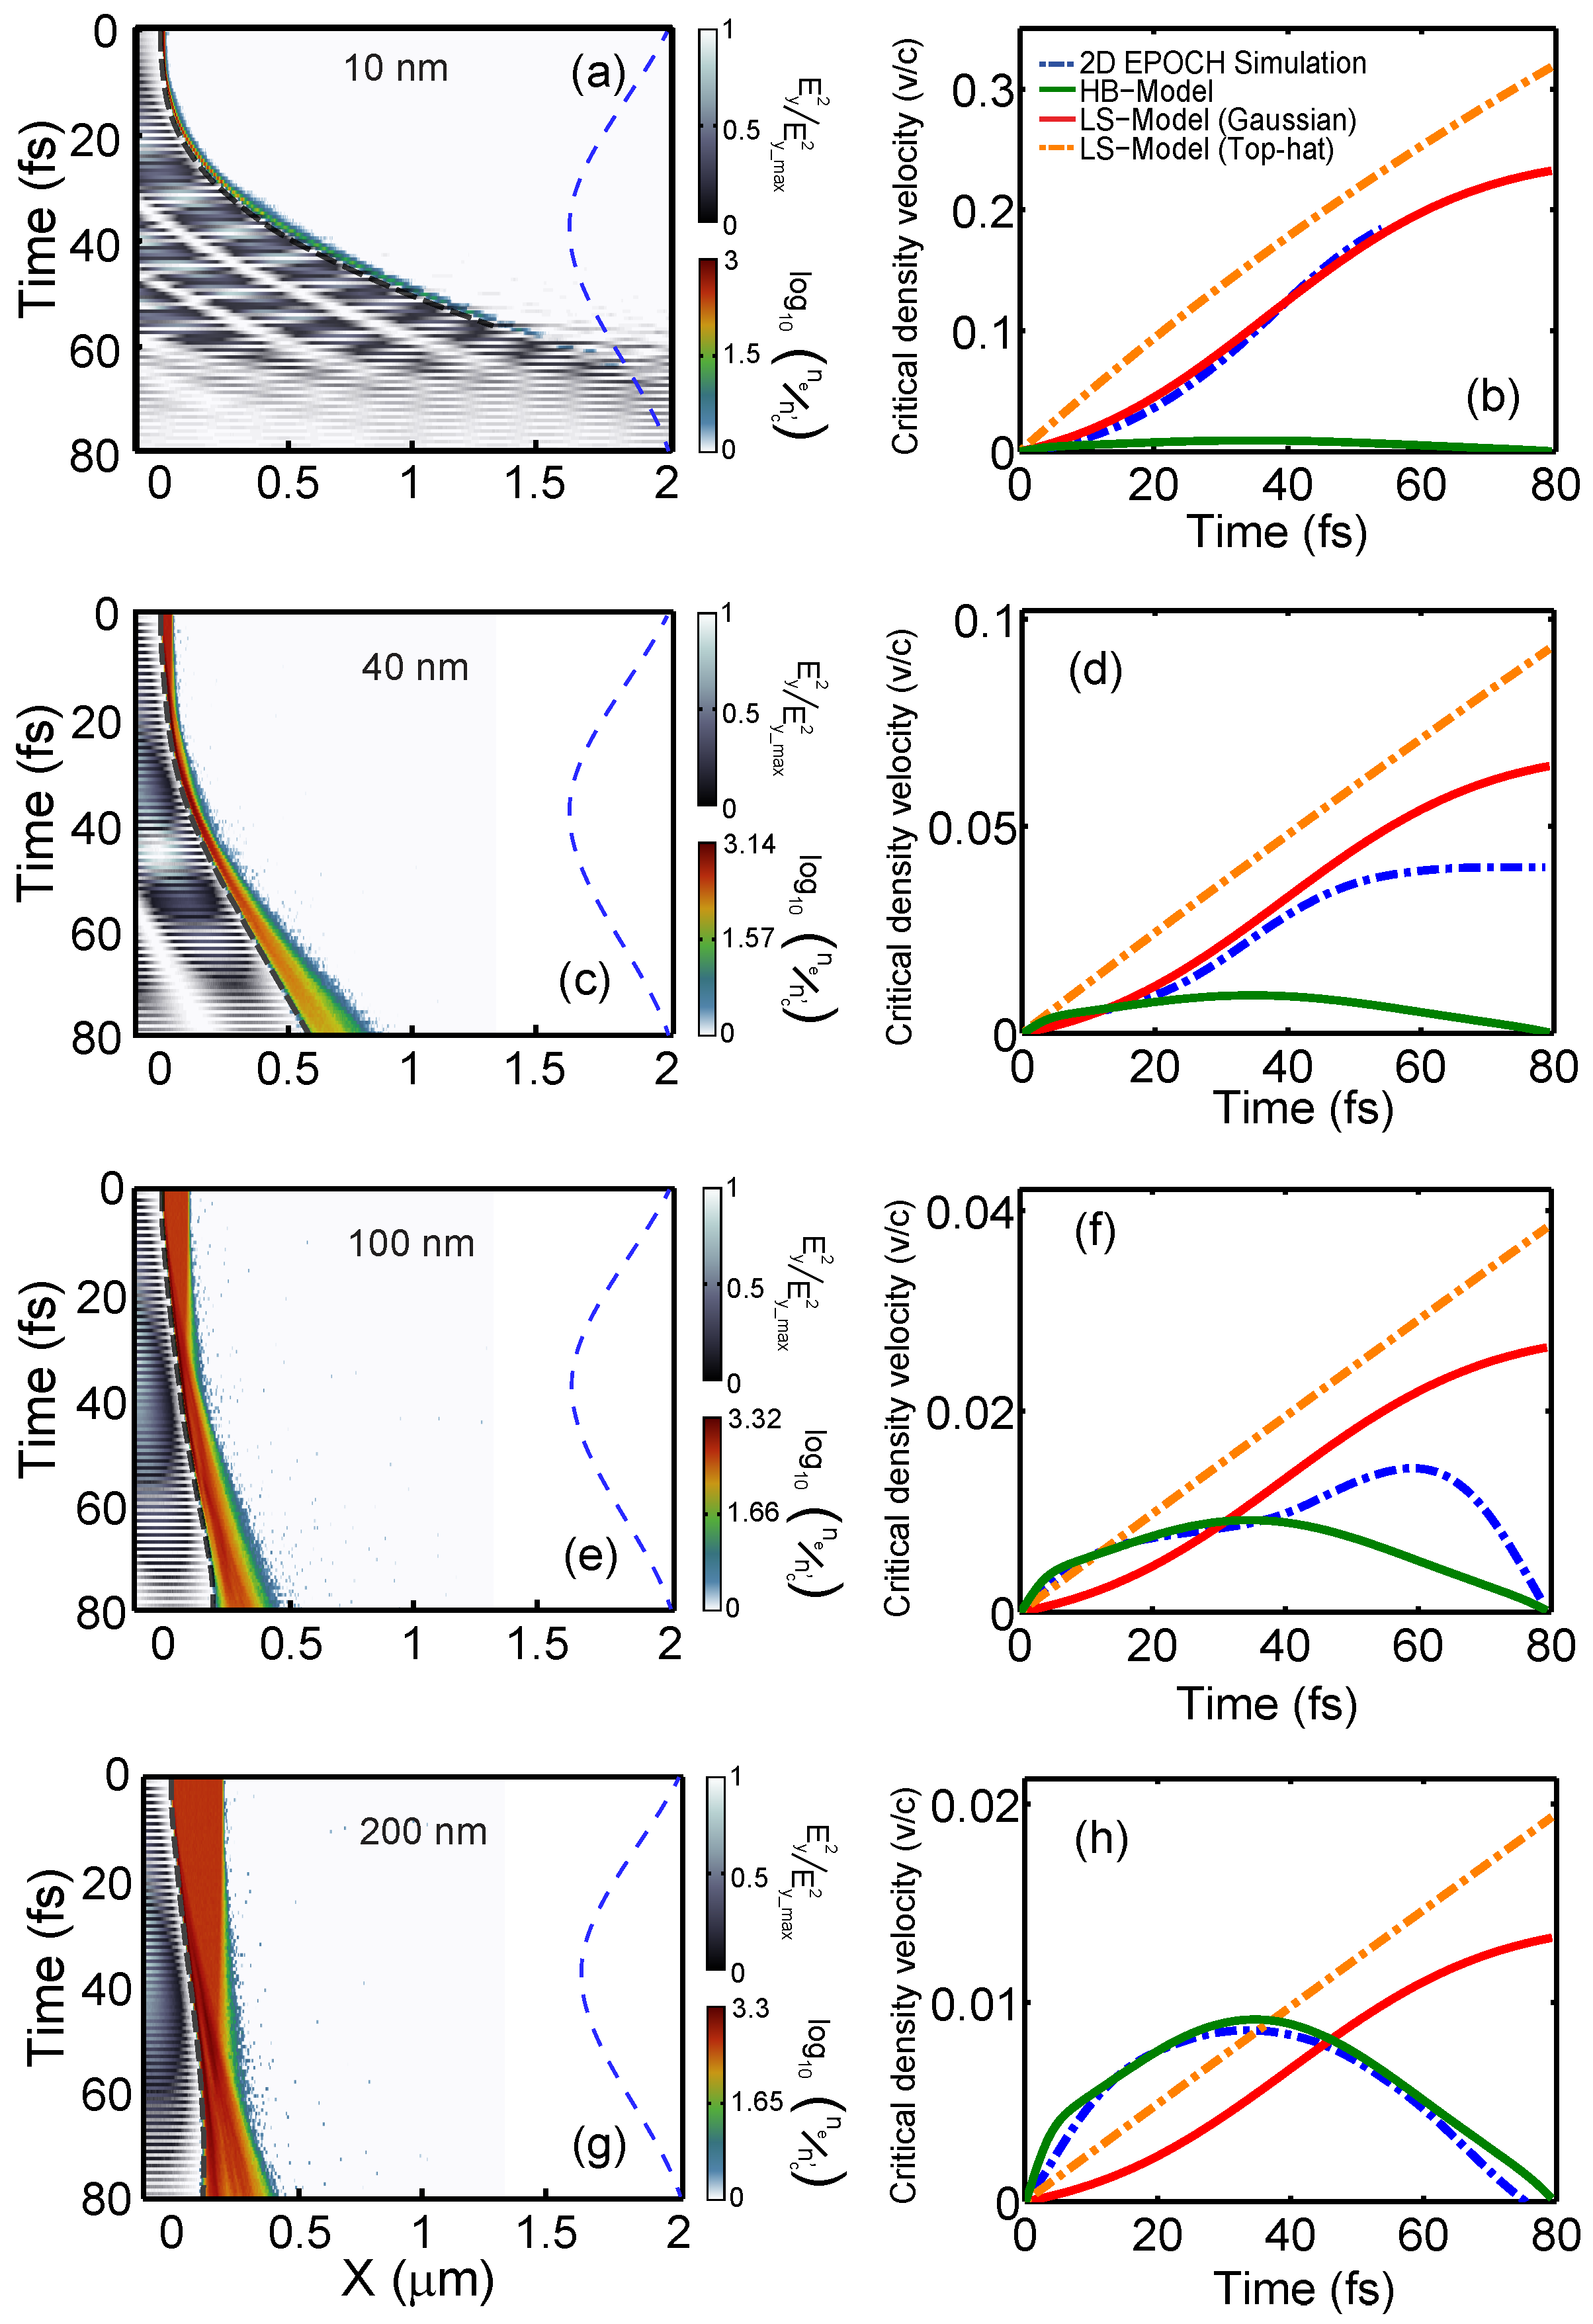
In order to quantify changes to the velocity of the PCDS, the electron density along the laser axis is plotted as a function of time in
Figure 4a,c,e,g. The relativistically corrected critical plasma density (
, where
is the electron Lorentz factor) was obtained and plotted as the black-dashed line. These figures thus show a time-space distribution and the velocity of the relativistically corrected PCDS is obtained directly from the gradient of the black-dashed line. The velocity acquired from this method is plotted as a function of time as the blue dot-dash line in
Figure 4b,d,f,h, for the four example target thicknesses considered. The velocity of the PCDS calculated using the time-dependent HB model (Equation (
1)) is shown as the solid green line. Further discussion on the time-dependency of the HB model can be found in references [
22,
24]. To determine the PCDS velocity in the case of the LS mechanism, a Gaussian-like temporal profile was assumed. Substituting this profile into Equation (
3), the pulse fluence,
F, is described as:
Carrying out the integral, the pulse fluence for a Gaussian pulse is equal to:
where
is set to be equal to the FWHM laser pulse duration (40 fs) and
.
Replacing this new expression for the pulse fluence in Equation (
5), the LS velocity model using a Gaussian-like (time) pulse is obtained from Equation (
4). The solution for each target thickness investigated is shown as the solid-red lines in
Figure 4b,d,f,h.
For the case of
l = 200 nm, it can be seen in
Figure 4h that the PCDS velocity in the 2D simulation is in very good agreement with that calculated using the HB model. The velocity is directly proportional to the laser intensity in the HB model, and thus it increases on the rising edge of the pulse up to a maximum value (
fs) and decreases thereafter. In the simulation, whereas the increasing velocity is driven by the same increase in intensity, the decreasing velocity after the laser peak occurs because the thermal pressure starts to compete again with the radiation pressure when the intensity drops. For this relatively thick target, the compressed electron layer does not reach the target rear side before the laser radiation pressure decays and thus the dynamics are fully accounted for by HB. At the other extreme, for the case
l = 10 nm, the compressed plasma electron layer quickly reaches the target rear. In this case, as shown in
Figure 4b, the PCDS velocity results from the simulation are explained by the LS model, until RSIT occurs (at ∼56 fs), at which point the laser pressure becomes less efficient and the electron acceleration due to radiation pressure ceases. Consequently, relativistic transparency limits the maximum velocity of the PCDS. We note that the agreement is with the LS model when the Gaussian temporal profile of the laser pulse is accounted for (as opposed to a constant intensity profile). The two target thicknesses in between correspond to hybrid scenarios in which the dynamics are explained by the HB model up to a point in time at which the compressed electron layer reaches the target rear and the LS model thereafter. The corresponding time is ∼20 fs and ∼38 fs for
l = 40 nm and
l = 100 nm, respectively.
All of these simulation results correspond to the velocity of the PCDS along the laser propagation axis, where the radiation pressure is highest. The off-axis velocities are plotted in
Figure 3b,d,f,h, which shows a clear dependency on the target thickness. The thickest target (
l = 200 nm) shows that the highest velocities are extended over a broad distribution around the interaction region, whereas in
l = 10 nm target, they are distributed within a narrow region around the laser axis, and moreover, on the falling edge of the laser pulse, just prior to the onset of RSIT. The grid-shading corresponds to the parameter space for which RSIT has occurred. The inset in
Figure 3b,h shows the velocity of the PCDS, in time and space, along the Z direction, predicted by the LS and HB models, respectively. These model calculations are in very good agreement with the simulation results over the full laser focal spot. Transitional characteristics between these two extremes are observed for
l = 40 nm and
l = 100 nm.
4. Comparison of Results
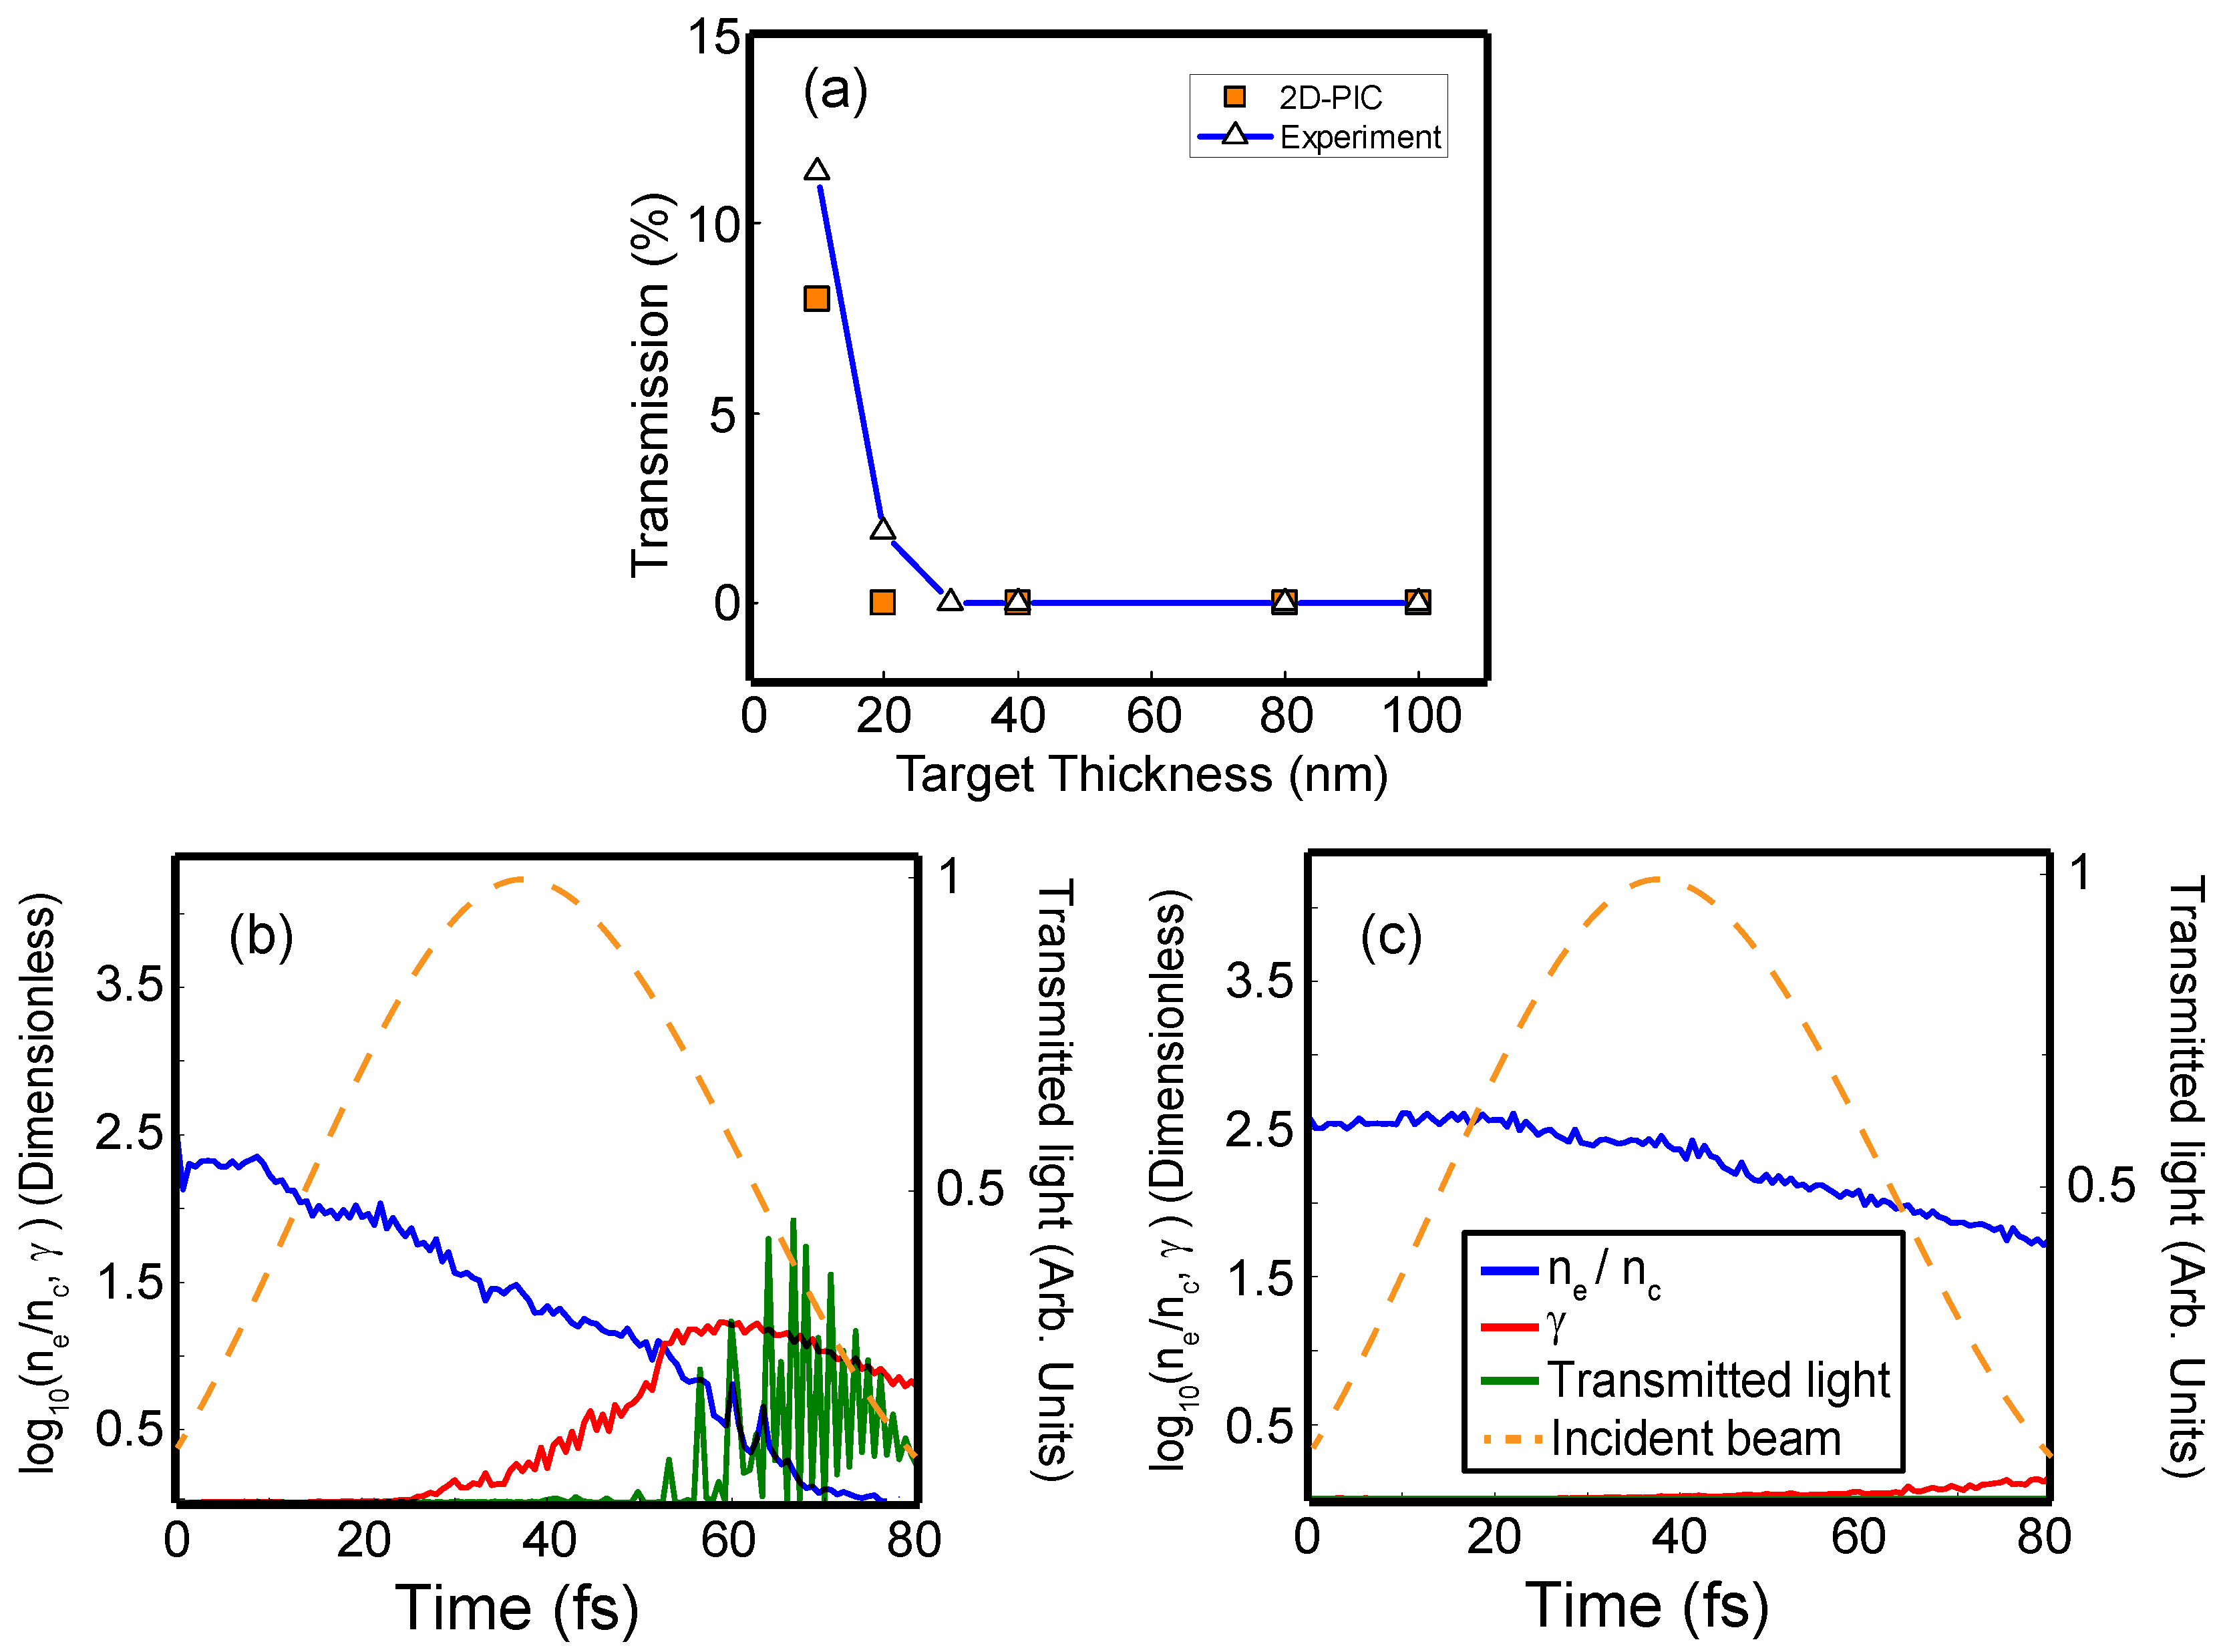
We first compare the experimental and simulation results corresponding to the transmitted laser light due to the onset of RSIT. These are plotted as a function of target thickness in
Figure 5a. The two sets of results are in good agreement regarding the onset of transparency in the thinnest targets, although the measured percentage of laser light transmitted is higher than that obtained in the simulations. The temporal evolution of the peak electron density normalized to the critical density, the electron Lorentz factor and the transmitted fraction of the laser light are plotted in
Figure 5b,c, for
l = 10 nm and
l = 40 nm, respectively. In the former case, the peak electron density normalized to the critical density drops below the electron Lorentz factor at ∼56 fs, after which a small fraction of the laser light is transmitted through the foil. In the latter case this threshold condition is not satisfied over the duration of the laser pulse and thus RSIT does not occur.
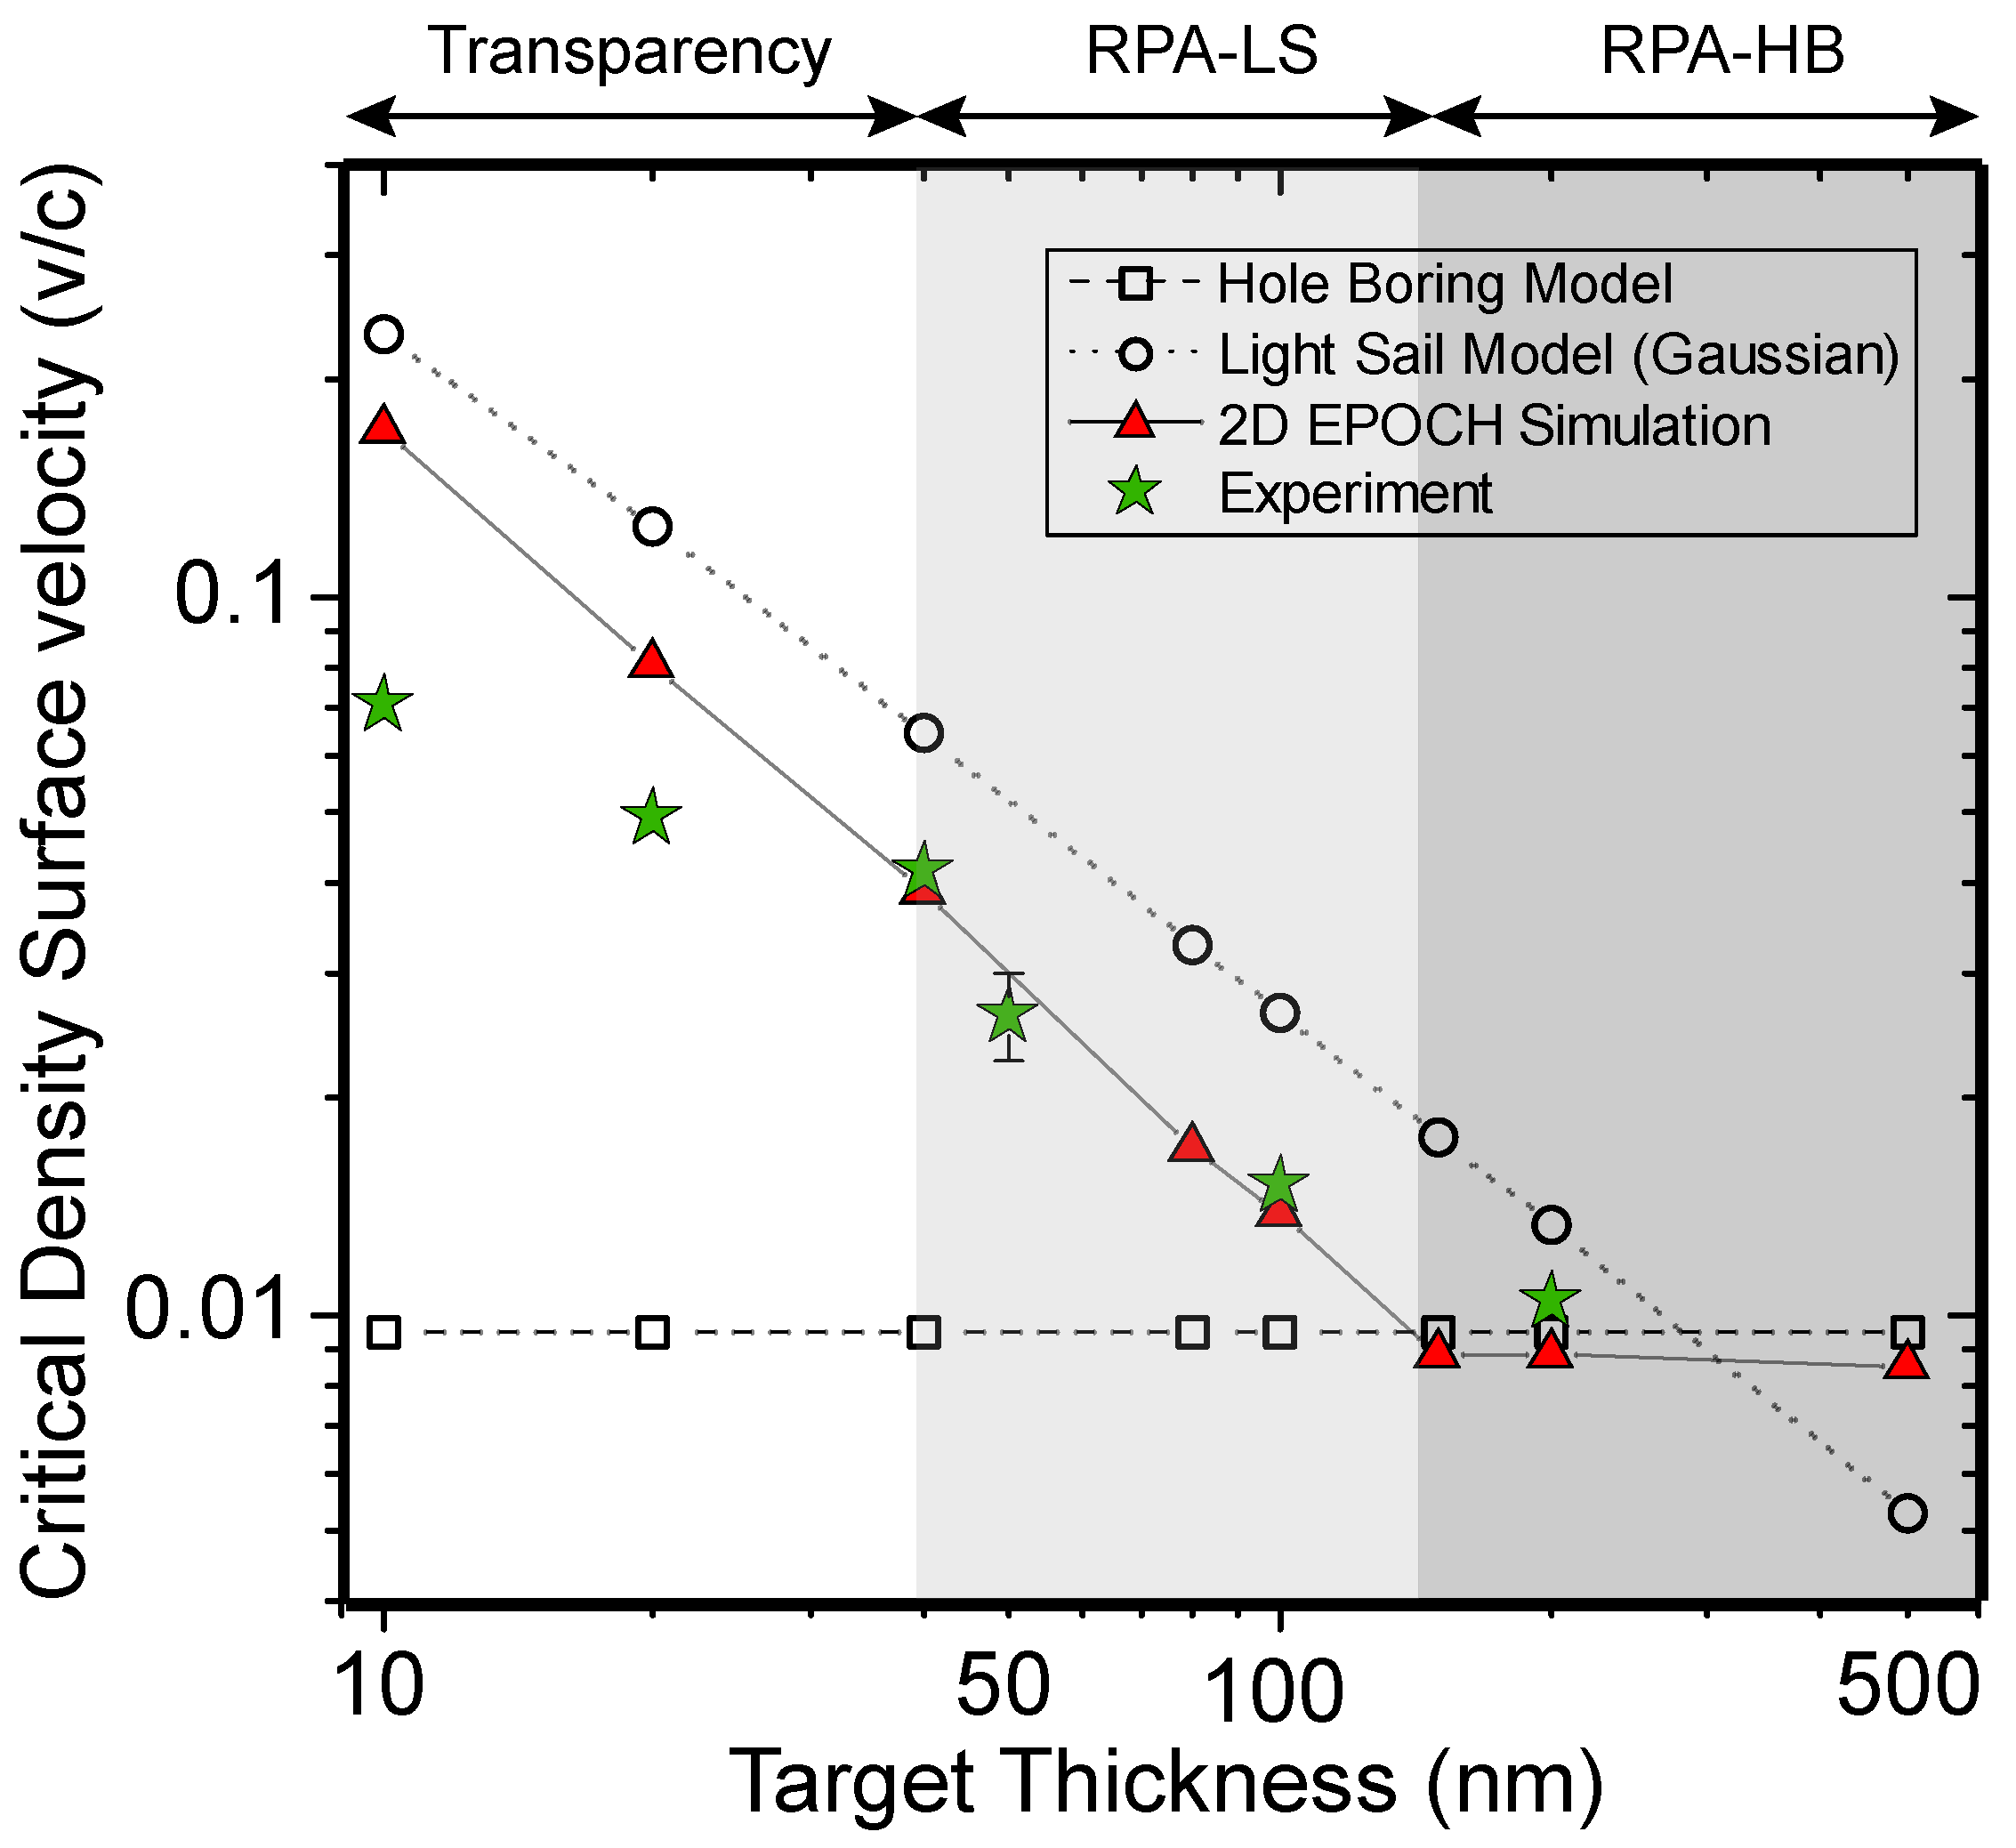
We next compare the maximum PCDS velocity obtained experimentally with the PIC simulation results and model calculations, as plotted in
Figure 6, as a function of target thickness. These results illustrate the following three distinct regimes of laser-foil interaction: (1) for
150 nm, a HB-dominant mode of interaction in which the PCDS velocity is essentially independent of target thickness; (2) for 40 nm
150 nm, a LS-dominant mode in which the velocity increases exponentially with decreasing
l, with a scaling very similar to that predicted by the LS model (taking account of the Gaussian temporal profile of the laser pulse); and (3) for
40 nm, a RSIT-onset mode in which the PCDS velocity drops below that expected from the LS model scaling, due to the reduction in radiation pressure when light is transmitted through the target.
We note that although the experiment and simulation results are in very good agreement over most of the target thickness range explored, the measured velocity is lower than in the simulation results for
l = 10 nm and
l = 20 nm. This difference is explained by the higher measured laser energy transmission compared to the simulations, as shown in
Figure 5a. The PCDS velocity is also overestimated in the simulations, in particular for the LS regime, due to the fact that the perfect mirror approximation (reflection coefficient
R = 1) is assumed, whereas in reality
.
5. Discussion
The dynamics of the PCDS in ultra-intense laser interactions with thin foils, ranging in thickness from tens to hundreds of nanometres, has been investigated experimentally and numerically. The maximum PCDS velocity has been determined experimentally via measurements of the relativistic Doppler shift of second harmonic light produced at the laser focus. Coupled 2D PIC simulations are used to explore the spatial and temporal evolution of the PCDS for each target thickness investigated. Comparison of the experimental and numerical results with corresponding analytical models of the HB and LS modes of RPA reveal the target thickness ranges for which each mode dominates. The numerical results show that a hybrid model, starting with HB and transitioning to LS (when the compressed electron layer reaches the rear surface of the target) is required for thicknesses between the extreme cases. Measurements of the transmitted laser light reveal that at the thinnest targets considered, transparency reduces the radiation pressure, resulting in a lower maximum PCDS velocity.
These results confirm the picture emerging of ion acceleration driven by radiation pressure in thin foil targets. They demonstrate that the PCDS velocity, and thus the maximum ion energy, driven by HB is comparably smaller than that produced by LS in thinner foils. The maximum ion energy driven by LS can be expected to increase with decreasing foil thickness, until the thickness at which the target expands to become relativistically transparent early in the interaction with the laser pulse. The overall maximum ion energy achievable via RPA for a given set of laser parameters is thus effectively set by the condition for the onset of transparency. In principle, compared to linear polarization, the use of circularly polarized light reduces heating of the plasma electrons, and thus the threshold foil thickness for the onset of RSIT is reduced, increasing the PCDS velocity and ion energy. However, we note that the strong target deformation induced by the variation in radiation pressure across the laser spatial-intensity profile (as observed in
Figure 3) results in significant target heating despite the application of circular polarization. Circumventing this issue to achieve higher RPA-ion energies may require engineering of the laser focus intensity distribution or the target profile to reduce the heating and thus extend the target thickness range for which LS dominates.

 ,
, 


