Article

Management of Waste Streams from Dairy Manufacturing Operations Using Membrane Filtration and Dissolved Air Flotation

by
Subbiah Nagappan
1,
David M. Phinney
2 and
Dennis R. Heldman
1,2,*
1
Department of Food, Agriculture and Biological Engineering, 590 Woody Hayes Drive, Columbus, OH 43210, USA
2
Department of Food Science and Technology, 2015 Fyffe road, Columbus, OH 43210, USA
*
Author to whom correspondence should be addressed.
Appl. Sci. 2018, 8(12), 2694; https://doi.org/10.3390/app8122694
Submission received: 27 November 2018 / Revised: 11 December 2018 / Accepted: 14 December 2018 / Published: 19 December 2018
(This article belongs to the Special Issue Membrane Separation Techniques – Optimization and Application)

Abstract

:

Featured Application

This article deals with two different methods of wastewater treatment in the dairy industry. This article will help industrialists in the dairy world who have problems with their wastewater treatment.

Abstract

Membrane filtration can provide a significant role in the management of waste streams from food manufacturing operations. The objective of this research was to evaluate the reductions in the organic content of waste streams accomplished when using membrane filtration. Reductions in Chemical Oxygen Demand (COD) by membrane filtration were compared to a Dissolved Air Floatation (DAF) system. Membranes with six different pore sizes (200, 20, 8, 4, 0.083, and 0.058 kDa) were evaluated. In addition, the various membrane treatments were applied after the DAF as an additional level of comparison. The DAF treatment provided 75.15 ± 3.95% reduction in COD, and the reduction in COD improved from 85% to 99% as the membrane pore size decreased. When all membranes were used after a DAF pre-treatment, a reduction in COD to less than 1200 ppm in the permeate stream was achieved. These reductions were independent of the COD in the feed stream. The membrane fouling rates were evaluated for the membranes with the four largest pore-sizes membranes. The membranes with 20 kDa pore-size had the lowest fouling rates during extended fouling-rate studies.

1. Introduction

Dairy industries consume huge amounts of water, accounting for 33.96% of water consumption in all food industries [1]. Water is consumed in different ways in dairy industries. Examples include; as an ingredient, in clean in place (CIP), as boiler feed, in cooling tower operation, etc. Among these operations, CIP accounts for 38% of the total water consumption in the dairy industry [2]. Due to the large aforementioned point uses of water, the dairy industry generates 0.2 L to 10 L of effluent per L of processed milk [3].
Dairy wastewaters are characterized by high chemical oxygen demand (COD) due to high organic content caused by the presence of fats, proteins and carbohydrates [4]. This high nutrient content in the dairy wastewater is due to dumping dairy products down the drain and cleaning processed equipment and pipes [5,6]. When the highly nutritive effluent from the dairy industry is not treated and dumped into rivers, it causes eutrophication by organic, nitrogen and phosphorous compounds [7,8]. In most municipalities where there is no river close by, the dairy wastewater is sent to a municipal wastewater treatment (MWWT) plant for further treatment, before being discharged into other bodies of water. This gives a final safe layer of treatment. Depending upon the type and volume of products manufactured, municipal wastewater treatment plants set limits on certain water quality parameters (COD, BOD, fats, oils, total solids, etc.). If industries discharge water to the MWWT plant that is over the limit, they receive penalties in terms of surcharges [9]. Hence, treating the wastewater before discharging either into a river or to the municipal treatment plant is necessary to avoid serious environmental and financial impacts. The type and volume of dairy products manufactured varies from one industry to another, causing high variability in the nature of dairy wastewater, making it difficult to choose a particular wastewater treatment method. Current treatment methods for dairy wastewater are aerobic treatment, anaerobic treatment, dissolved air floatation (DAF), activated sludge, clarification, sand bio filters, membrane filtration, advanced oxidation processes, coagulation/electrocoagulation, moving bed biofilm reactors, membrane bioreactors and other treatments. Combined treatments are most effective to tackle the heterogeneity of the wastewater [10,11]. DAF is the most commonly used treatment method for dairy wastewater [12].
CIP consumes the most water in the dairy industry, and thus, also generates the highest volume of effluent among all dairy operations. High concentrations of dissolved salts and high pH in the dairy effluent is due to CIP operation [11]. Therefore, depending upon the operation going on in the dairy plant, the influent to the wastewater treatment plant varies. To tackle this high heterogeneity in the feed, big equilibrium tanks (EQ) are used. These huge tanks collect all the wastewater from the dairy plant over a long period and mix them using pumps to produce a certain degree of homogeneity in the feed to the wastewater treatment plants.
A dairy industry in Ohio utilizes dissolved air floatation (DAF) as its wastewater treatment method. This method uses coagulants, flocculants and air bubbles to remove suspended particles from the water. Coagulants like polyaluminum chloride are used todestabilize the suspended particles, and flocculants—like acrylamides— aggregate these destabilized particles into big clusters. These clusters adhere to the surface of the air bubbles and rise to the top of the DAF where it is skimmed off. This type of treatment method is effective against treating wastewaters containing high fat, oil and greases and suspended solids. The disadvantage of this treatment is that it is a very chemical-intensive process. This dairy industry had a COD discharge limit of 1200 ppm to the municipality and it received surcharges, since its wastewater contained significant dissolved solids and the DAF was not effective against treating them. Thus, there was a need for another wastewater treatment.
Membrane filtration is not only used as a wastewater treatment method in dairy industries [13], but also for the reclamation and reuse of water [14,15], whey fractionation [16], recovery of cleaning solutions [17] and other purposes [18]. In cross flow membrane filtration, the feed is more highly pressurized than the osmotic pressure across a semipermeable membrane, and the particles that can pass through the membrane pores come out through the circumference as permeates, while the other particles are retained and come out the other end as retentate. Membranes will foul with time due to the accumulation of particles on the pores, and thus, the permeate flux reduces. To recover lost flux, a membrane has to be cleaned from time to time, and, after certain a number if cleanings, replaced [19]. With technology, membranes are manufactured to reduce fouling effects and withstand a wide range of pH and temperatures of the feed. The use of membranes for wastewater treatment is increasing due to the availability of low cost and more versatile pore sized membranes. Due to the various advantages of this treatment method, the influence of membrane filtration on dairy waste streams was studied.
The overall objective for this investigation was to evaluate the use of membrane filtration for the management of the wastewater stream from a dairy manufacturing operation. The specific objectives were; (1) to compare the effectiveness of dissolved air floatation (DAF), membrane filtration and combined DAF and membrane filtration for reducing the COD of the waste water stream, (2) to select the appropriate process design for COD reduction of the dairy manufacturing waste stream, based on an established limits and operating conditions, and (3) to confirm the selection of the appropriate approach based on the fouling rates of the membrane filtration system.

2. Materials and Methods

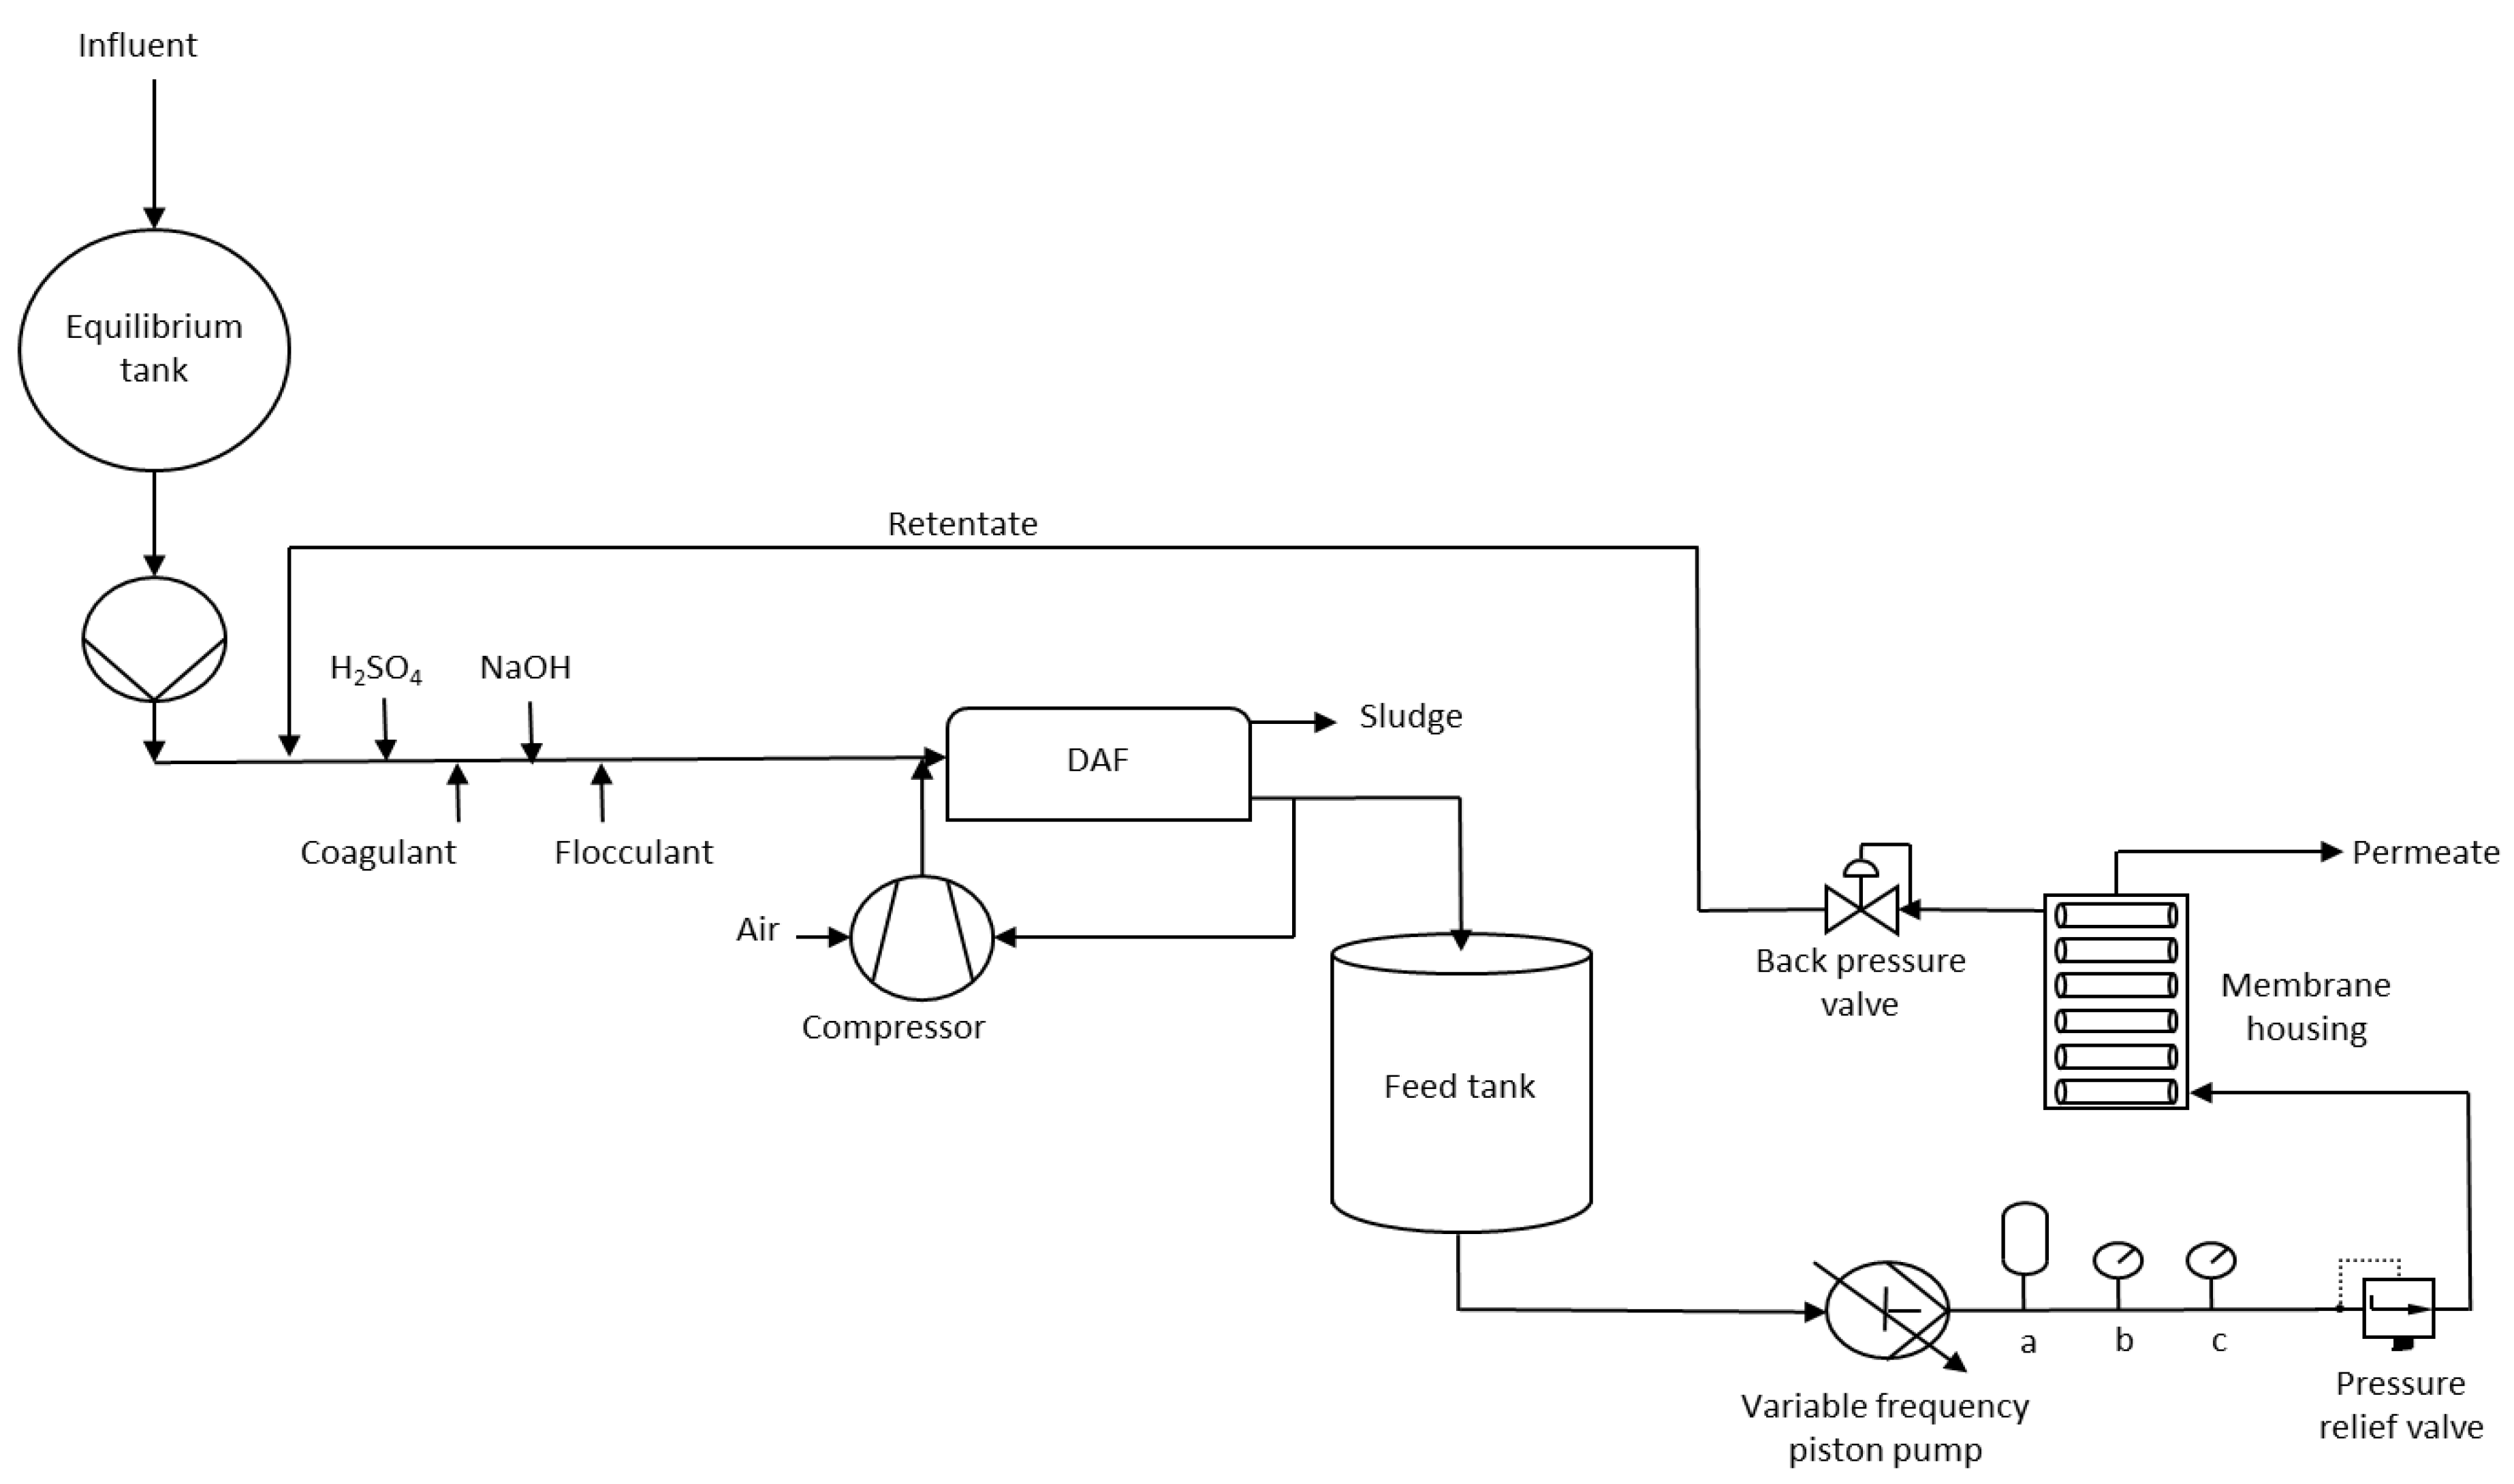
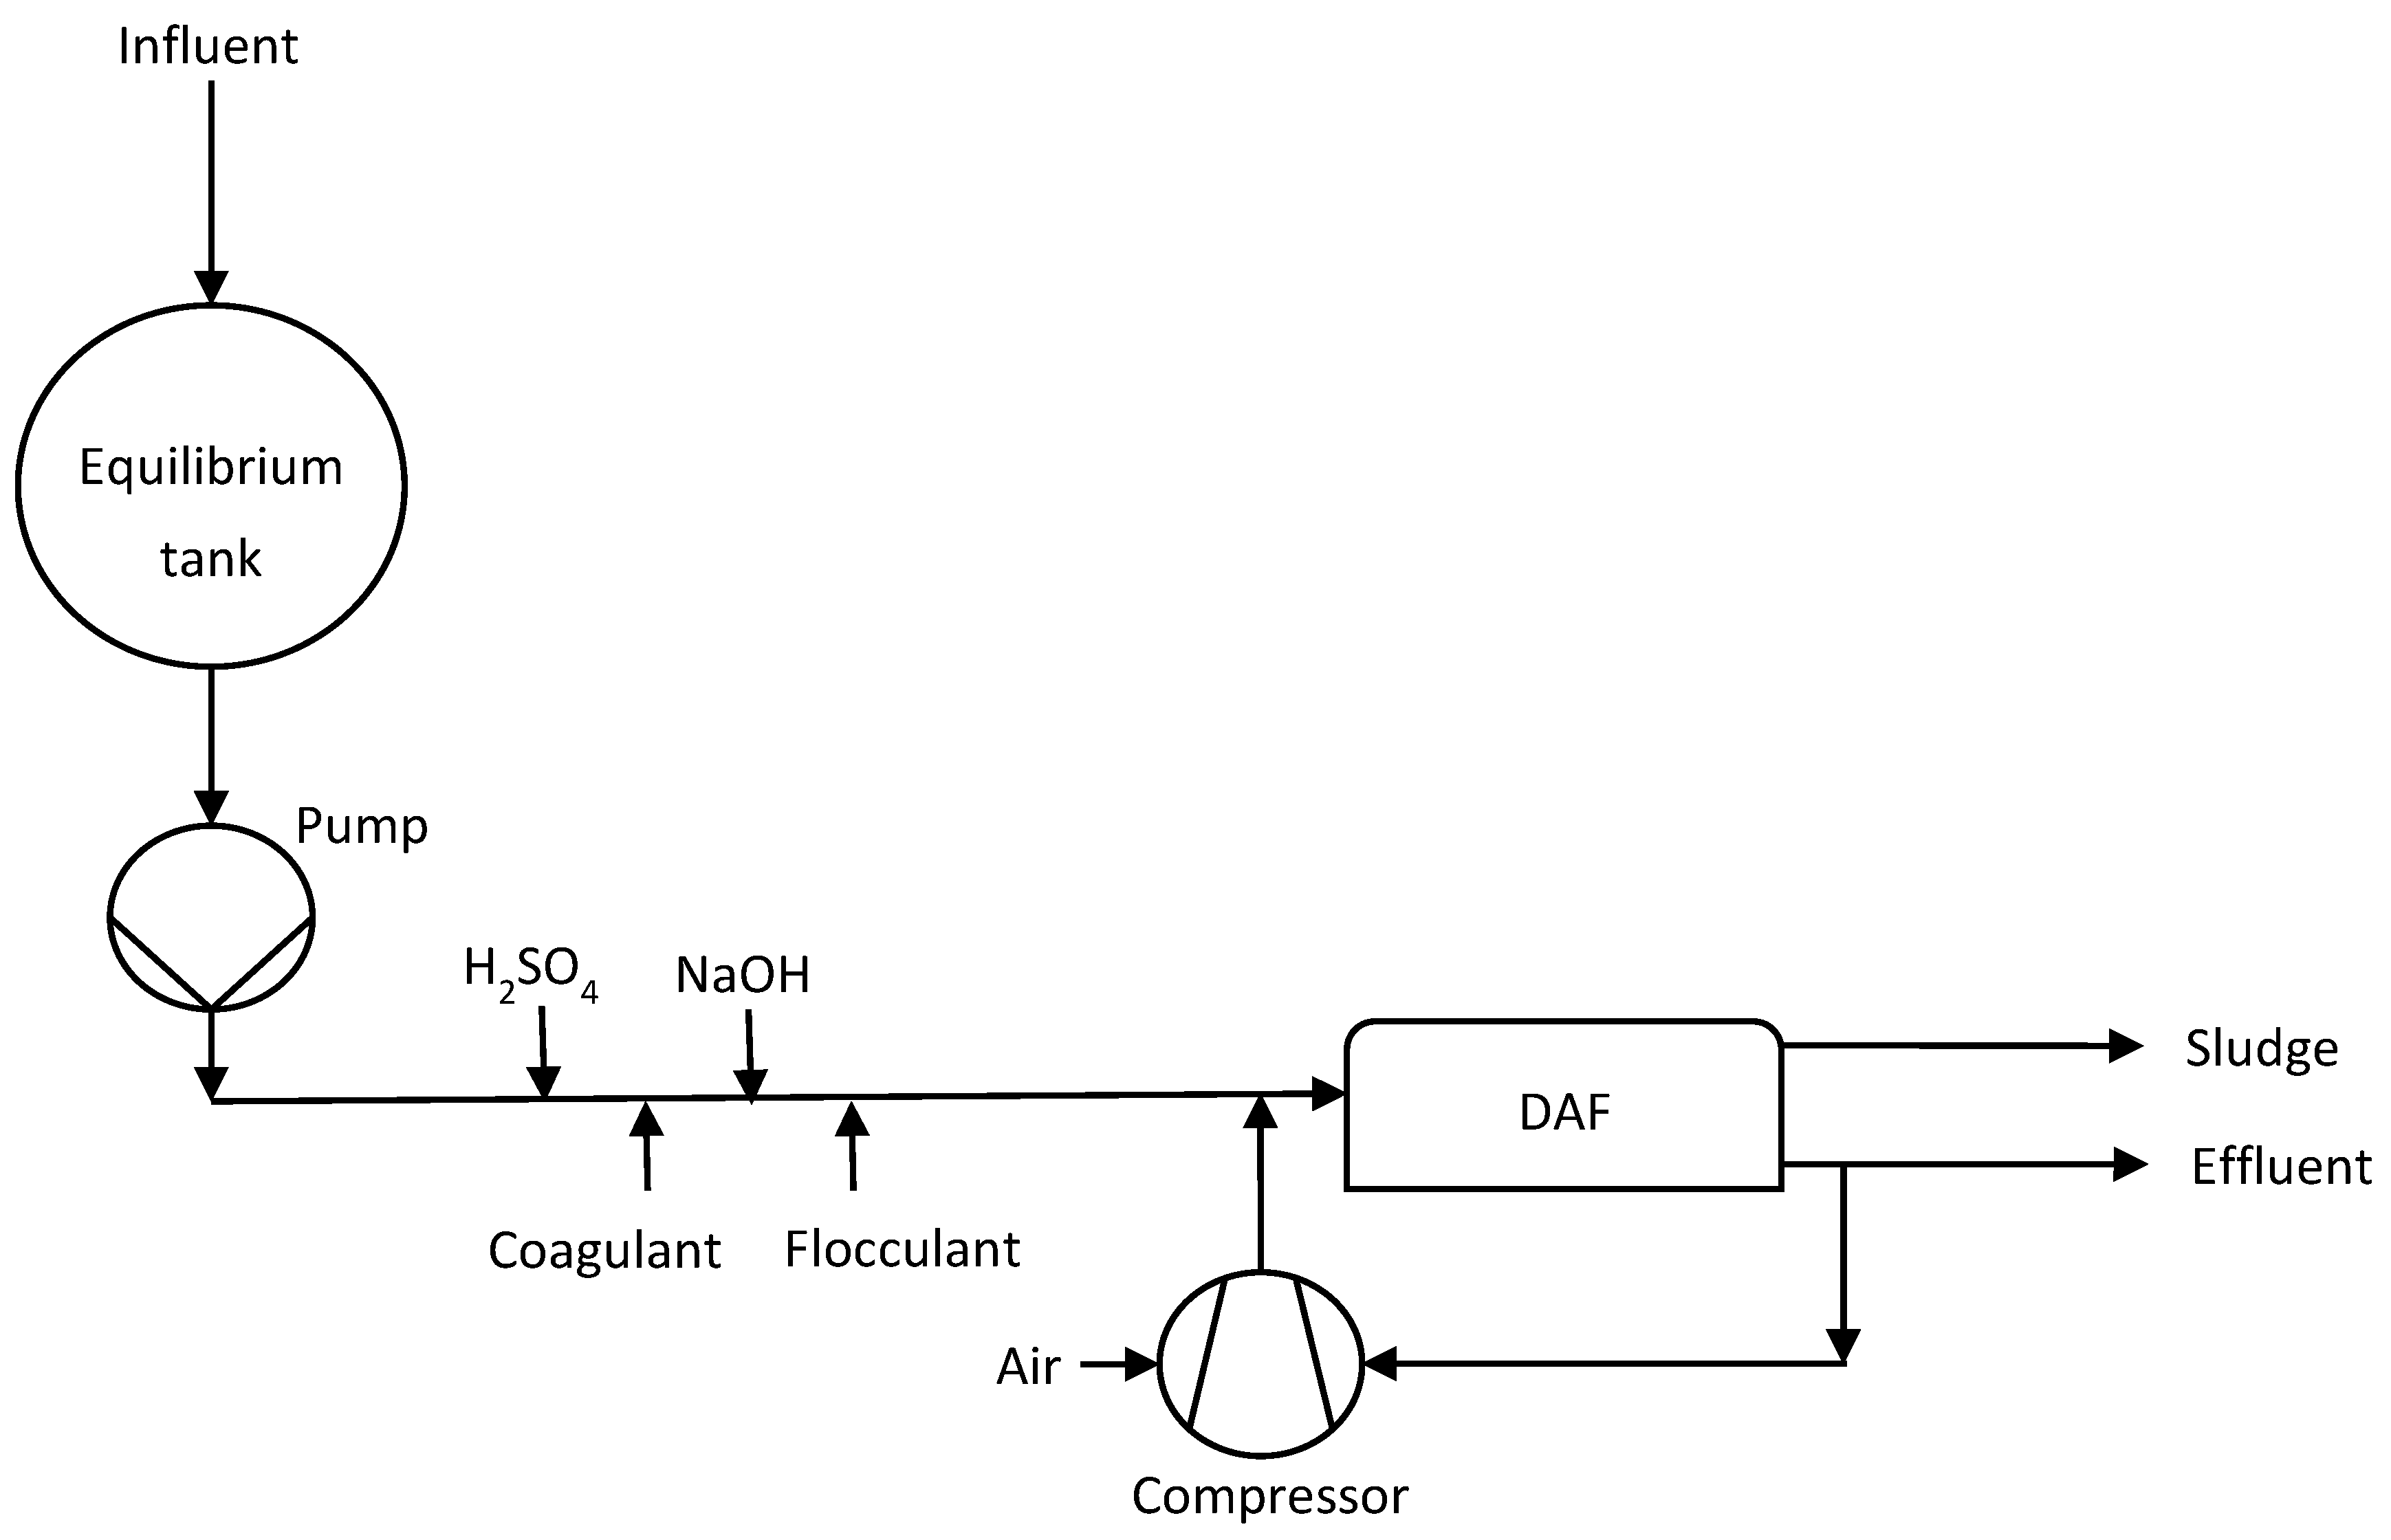
2.1. Current Wastewater Treatment
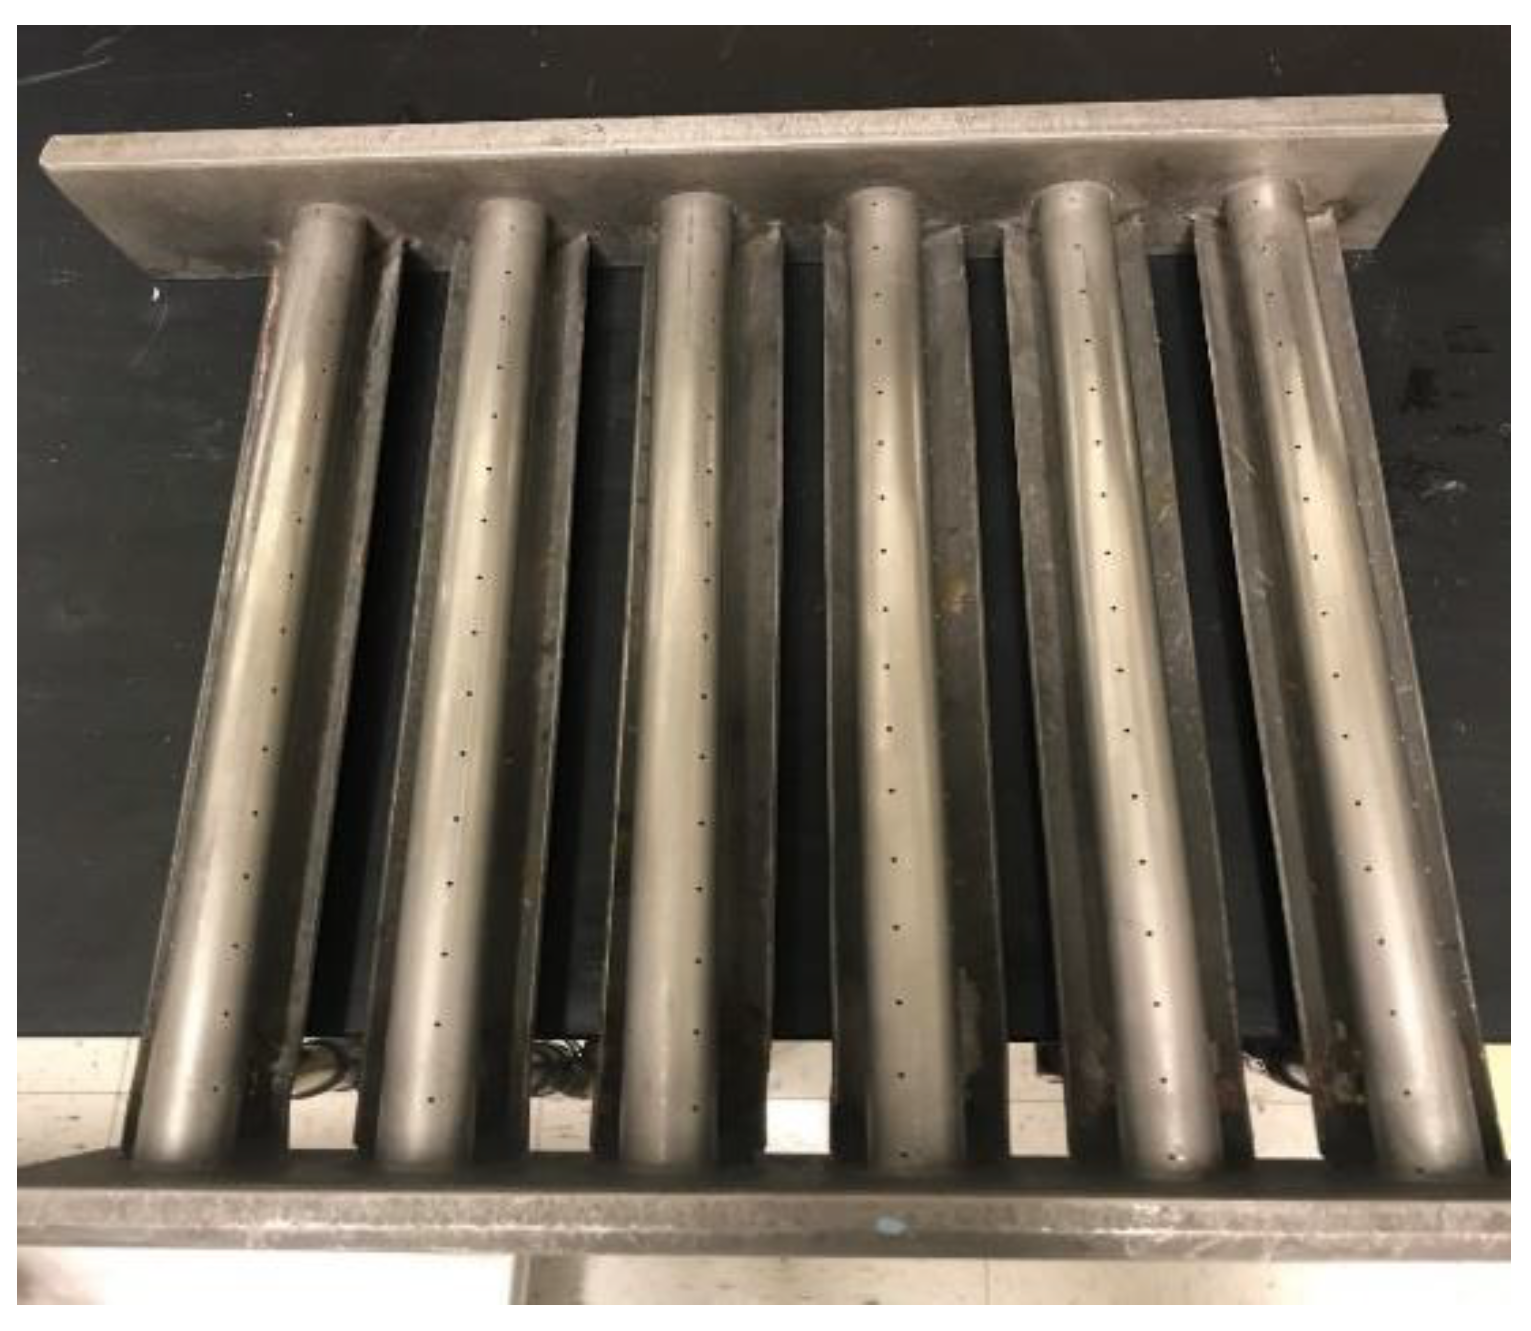
Wastewater from the dairy plant was considered influent to the wastewater treatment process and stored the 946 m3 equilibrium tank (EQ). This tank was used as a buffer tank and also to homogenize the different kinds of wastewater coming at different times. From the EQ tank, this homogenized colloidal liquid was added with coagulants and flocculants, before it was sent to the DAF. The pH of the feed from the EQ tank was brought down to 4.5 before the addition of coagulant, since the coagulant works best at this pH. Then, sodium hydroxide was used to bring the pH back up to 7, before the addition of flocculants, which works best at this pH. After flocculation, air bubbles from a compressor were added to this mixture; it was then introduced to the bottom of the DAF. The suspended particles, fats, oils and greases will rise up to the top of the DAF tank by adhering to the air bubbles. Then, this top layer was skimmed off by mechanical skimmers, and set aside as sludge. The clean effluent comes out at the other side of the DAF and was sent to the municipality. Figure 1 depicts the flow chart of the current wastewater treatment. Samples were collected at two places: after the EQ tank, and from the treated effluent.

2.2. Membranes

Tubular membranes of 0.3048 m length and 0.0127 m diameter and a surface area of 0.012 m2 were used for this study. In order to determine which membrane was able to discharge below the limit, six different pore sizes of this membrane size were used. The whole spectra of membrane filtration were covered by the choice of membranes, starting from micro filtration up to reverse osmosis filtration. A pilot scale membrane filtration skid was used (Model BRO/BUF Membrane Specialists, Hamilton, OH, USA) operated by a Hydra-cell high pressure piston pump (Model D15EASTHFEHF, Wanner Engineering, Minneapolis, MN, USA) with variable frequency drive. The characteristics of each of these six membranes are described in Table 1.
Membranes selected for this study are made up of different materials, but made by the same manufacturer (PCI membranes, Fareham, England, UK). Depending upon the pore size and the material of which the membrane were made, their operating conditions vary. Retention characteristics define the pore size. For example, a retention characteristic of 200 kDa means that any substance that is equal to or greater than this molecular weight (or equivalent hydrodynamic radii) would not pass through the membrane pores, and would be retained on the retentate side. All membranes were cleaned by the procedure defined by PCI membranes before use. The general five steps of clean-in-place were performed—pre-rinse, alkaline wash, rinse, acid wash and final rinse. The concentrations, cleaner type, and the temperature of cleaning are defined in Table 2.

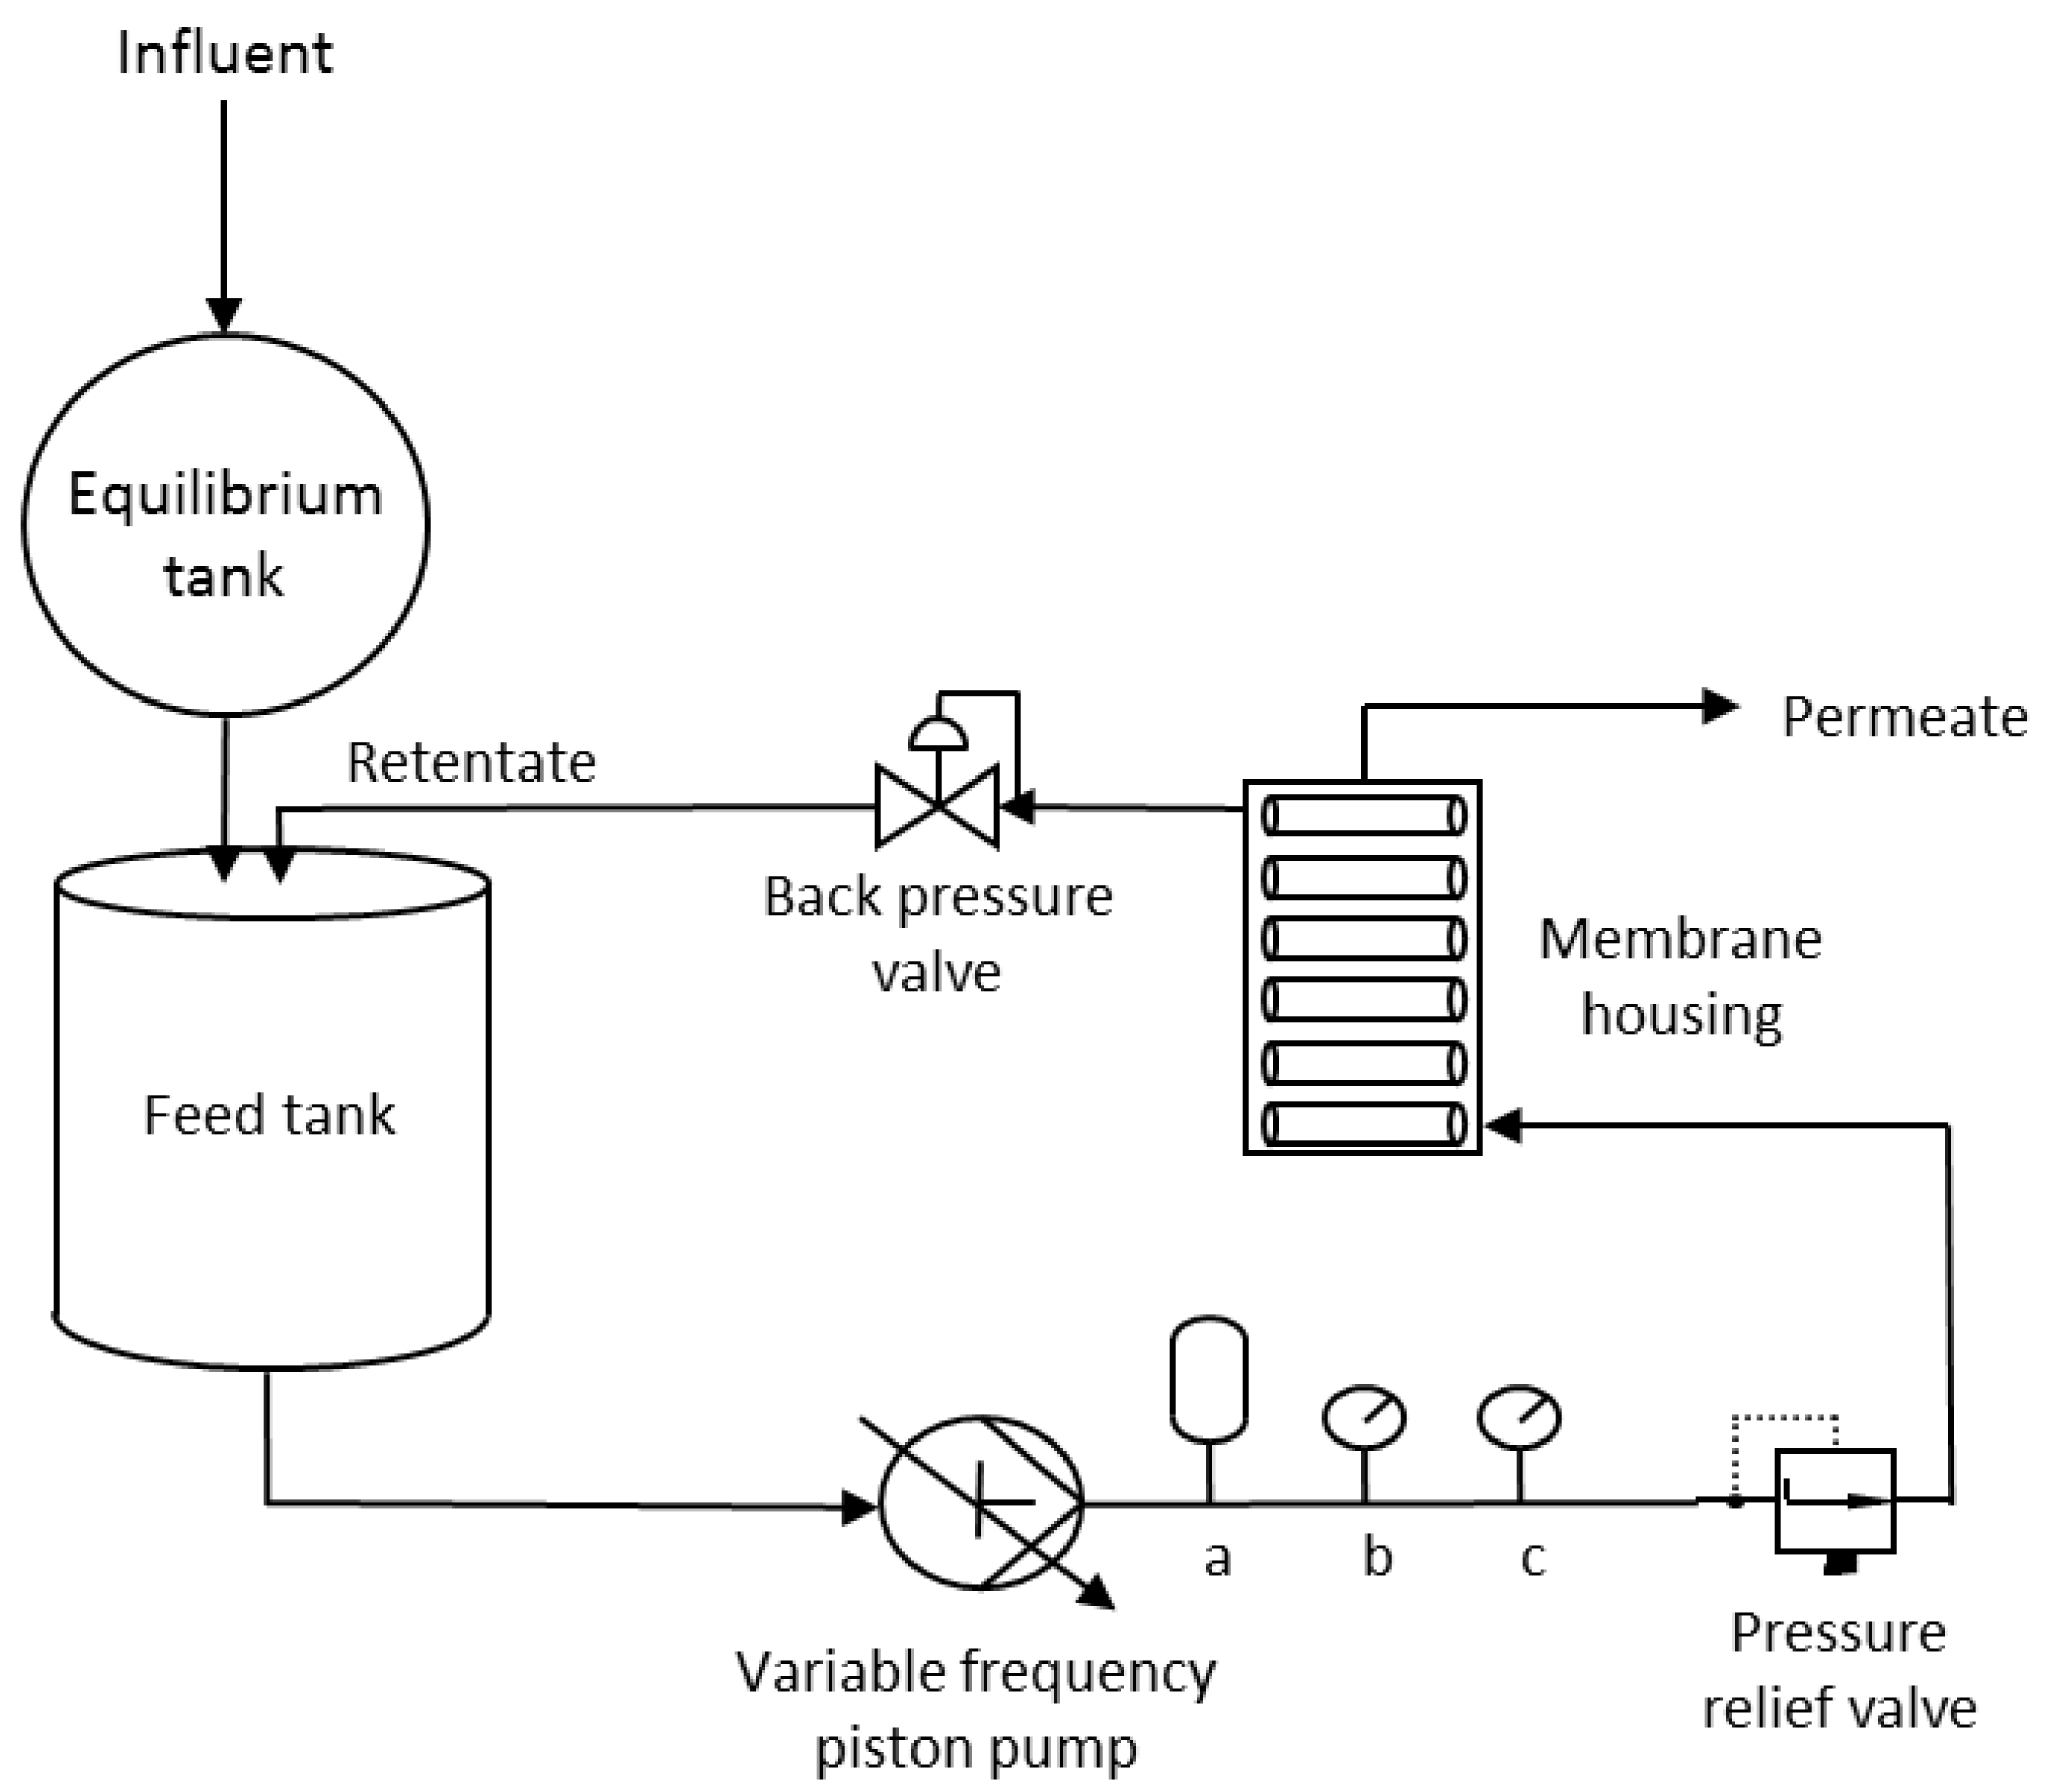
2.3. Filtration Experiment

The six different membranes cannot operate at the same pressure. For example, at low pressures, the smaller pore sized membranes like 0.083 kDa and 0.058 kDa pore sized membranes, will not flux. In this case, the osmotic pressure would be higher than the driving force. And in the other end, if higher pressures were used, bigger pore sized membranes, like the micro filters, would not be able to handle this high pressure, and would therefore crush. A membrane housing with six slots was used for this study, as seen in Figure 2. Filters of each type were filled in these slots one at a time. For each two sets of filters, same feed was used (ran in parallel). Figure 3 and Figure 4 show the membrane filtration experiment and post-DAF membrane filtration experiment respectively. During the membrane filtration experiment, the feed from the equilibrium tank went into a 189 L tank, which was then pumped through the membranes in the membrane module. A variable frequency controlled piston pump was used to pump the feed from the tank. The pressure side of the pump had a baffler, temperature and pressure sensors, and a pressure relief valve. The baffler was used to reduce any pulsations caused by the positive displacement pump. The various operating pressures chosen for each set of membranes are listed in Table 3. The permeate comes out of the circumference of the membranes and was collected and sent down to the municipality.
The retentate was sent back into the feed tank to concentrate it in order to get more recovery. Once the feed was too concentrated, it would be drained to the municipality during down time of the factory. An automated back-pressure valve was used to achieve very high pressures through feedback control. For all three experiments of membrane filtration experiment, the pump was run at a volumetric flow rate of 1135.62 L/h.
During the post-DAF membrane filtration experiment, as seen in Figure 4, the feed from the equilibrium tank was added with coagulants and flocculants with pH correction, and then pumped into the bottom of the DAF together with air bubbles. The sludge was skimmed off from the top and the clear effluent was then sent into a tank to be fed to the membrane filtration unit. A piston pump was used to flow this treated water through the membranes and the permeate was sent to the municipality. The retentate was sent back to the start of treatment, just before the addition of coagulants. This was basically two treatments—DAF and membrane filtration in series.

2.4. Analytical Methods

COD was measured spectrophotometrically at 620 nm using a BioTek Epoch plate reader (BioTec Inc, Winooksi, VT, USA). Combined with CHEMetrics COD vials (CHEMetrics Inc., Midland, VA, USA) and Bioscience Digital COD reactor (BioScience Inc., Allentown, PA, USA). Potassium dichromate was the oxidizing agent used to oxidize the organic material in the wastewater in the presence of silver catalyst and mercury to withstand chlorine interferences. The vials were heated to 150 °C for 2 h and the concentration of chromic ions was determined using a spectrophotometer. Fats, oil and grease (FOG) concentration was determined using hexane extraction. Total solids (TS), and total suspended (TSS) and dissolved solids (TDS) were measured by gravimetric analysis, heating to 110 °C using an oven and a 45 µm filter. Protein analysis was done by the BCA (bicinchoninic acid assay) method.
Statistical analyses for comparisons of the different treatment methods and different membrane sizes were done using one-way ANOVA and Tukey test using JMP Pro 12 software. Significance of p < 0.05 was used for all comparisons.

2.5. Operating Conditions

2.5.1. Membrane Selection

Trials were carried out in two different experiments for membrane selection; (1) exclusive membrane filtration (Figure 3) and (2) post-DAF membrane filtration (Figure 4). In membrane filtration, three of 200 kDa cut-off membrane and 20 kDa cut-off membrane were put into the six slots of the membrane housing. The membranes were cleaned by the CIP procedure first, before testing. The piston pump was operated at 20Hz, which is equivalent to a flow rate of 1135.62 L/h. The pressure was set to 6.89 bar and samples of the feed and the permeate out of each membrane were collected and analyzed for the various water quality attributes. Volumetric flow rate tests were carried out for each membrane to determine the permeate flow rate. The membranes were discarded and then the next two were put into the housing and the whole procedure was repeated, but at different pressures. Table 3 states the pressure at which these membranes were operated. After all six different membranes were tested, the whole experiment was repeated two more times for replication. The same methodology was followed for post-DAF membrane filtration, with the feed in to the membrane filrtation test being the DAF effluent water. In order to calculate the separation efficiency of the membrane, the reduction percentage was calculated using:
R e d u c t i o n   i n   C O D ,   % =   ( 1   C p C f ) 100 %
where Cp and Cf are the concentration of the permeate and the feed, respectively.

2.5.2. Extended Fouling Study

In this study, the retentate and the permeate was sent down the drain. Bucket flow rate tests were carried out on permeate of the membrane to determine flux, and thus, the level of fouling. Permeate fluxes were reported in L/(m2h)) and were calculated by:
P e r m e a t e   f l u x =   V A t
where V is the permeate volume in L, A is membrane surface area in m2 and t is time in h. Extended fouling study was done only on the selected membranes. In this study, the temperature was monitored in order to eliminate the influence of temperature on flux. All fluxes J(T) measured at temperature T were corrected to J(40), measured at 40 °C by [21]:
J ( 40 ) = J ( T ) 1.025 40 T
As the feed from the dairy plant was shut down, the experiment was stopped. In order to determine the fouling rate, the data from this study was modelled as:
J = a + b exp ( c t )
where, ’J’ is the flux (L/(m2h)) ‘a’ is the asymptote (L/(m2h)), also called as the critical flux. ‘b’ is the scale (L/(m2h)) which defines the curvature of the model, ‘c’ is the fouling rate (1/h) and ‘t’ is the time (h). This model is called the exponential fouling model.

3. Results and Discussion

3.1. Feed Source Characterization

The feed to the wastewater treatment plant was characterized based on pH, free chlorine, COD, protein, FOG, TS and TSS concentrations. It is important to know what kind of wastewater is being dealt with before any experiments are done, as this gives an idea on how it may affect the different membranes being studied. Concentrations of these various materials in the wastewater are depicted in Table 4. A total of 12 samples of the feed were collected on four different days and analyzed. The heterogeneity in the feed is seen in terms of standard deviation, and it also depends on the moment at which the samples are taken. The wastewater predominantly contains CIP solutions, which is why the pH is 11.32 ± 0.55, i.e., on the alkaline side of the scale.
The presence of free chlorine in the wastewater is due to the usage of chlorinated caustic cleaners, chlorine sanitizers, and salt use during product manufacturing. Levels of 5 ± 1 ppm of free chlorine are very low, and won’t affect the pores of an RO membrane. Thus, no pretreatment is necessary while using RO membrane. Dairy products finding their way down the drain from various pathways are the primary origin for COD, protein, FOG and solids in the wastewater. From Table 4, it is also seen that total suspended solids constitute only a very small part of the total solids. This means that the wastewater contains a huge amount of dissolved solids due to dumping of acid whey down the drain. Thus, the feed source characterization gives an overall idea on what is being dealt with.

3.2. Chemical Oxygen Demand

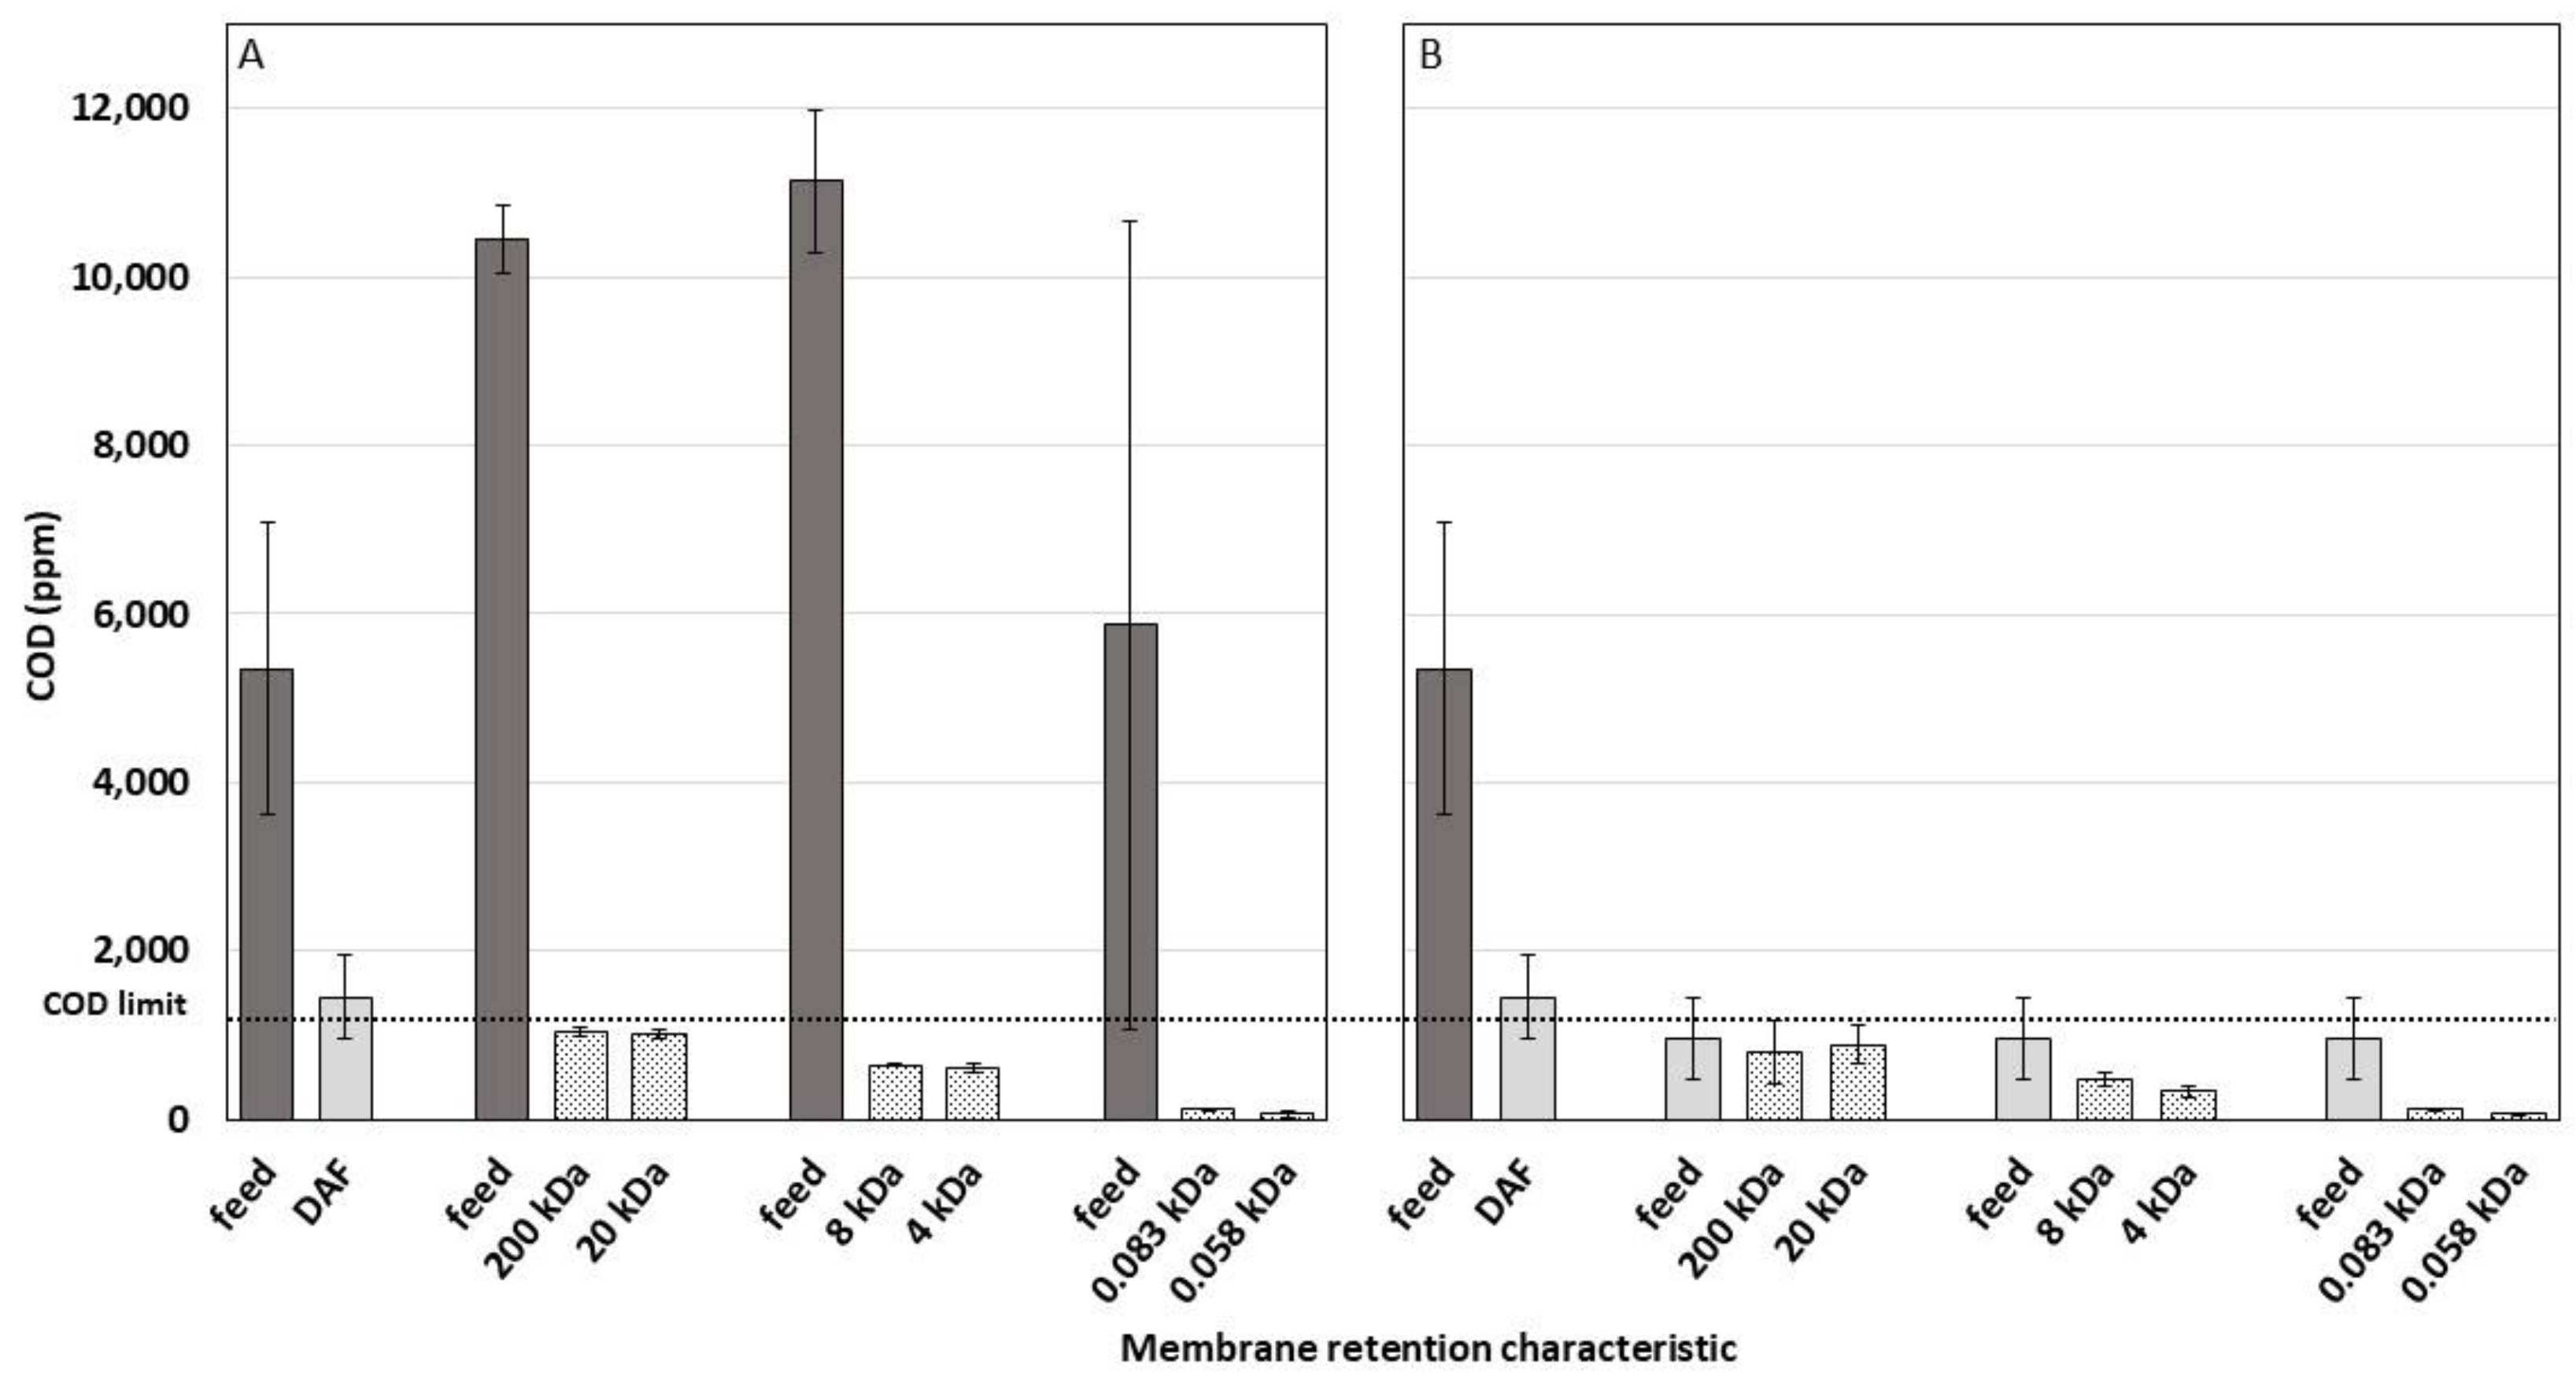
3.2.1. Comparison of Input and Output COD in Various Treatments

The input and output COD of the DAF are compared with the input and output CODs of different membranes in each experiment, as seen in Figure 5. The input and output COD are referred to the feed and permeate/effluent COD respectively. The feed to the DAF and each set of the membranes are the same in part A of Figure 5, but the values are different, since each set of these experiments was started with new feed. The COD limit of 1200 ppm is seen as the dotted line across the two parts of the figure. The DAF discharged to the municipality at 1455 ± 504 ppm, which is over the limit at certain times, thus creating the need for a specific treatment to consistently discharge below the limit. There was no significant difference between the output COD of the DAF and the permeate CODs of the 200 kDa and 20 kDa cut-off membranes in both experiments. This can be seen more evidently in Figure 6. However, the DAF output COD was not constantly below the limit. The permeate COD of these two membranes in both experiments was below the limit (small standard deviation), which means that these membranes are consistently discharging below the limit, independent of the input feed COD. This is very important in industries to avoid surcharges. In Figure 5 part B, the output of the DAF is same as the input to the membranes in this experiment. It is observed that the COD of the permeate reduces with decrease in pore size. This is because as the pore size reduces, less organic material can go through these smaller membrane pores, and thus, the COD decreases. In both A and B, there were no significant differences between the permeate CODs of the various set of membranes (200 and 20 kDa, 8 and 4 kDa, 0.083 kDa and 0.058 kDa). Thus, another parameter is required to select a membrane at a certain pressure.
If the limit on COD is 1200 ppm, then a 200 kDa or a 20 kDa cut-off membrane would suffice for this purpose. Energy consumption is important in membrane selection. If two different membranes are able to discharge below the limit, then the larger pore sized membrane should be selected, since it could be run at lower pressure/speed. If the limit is lower, then smaller pore sized membranes could be chosen. A 0.058 kDa cut-off membrane provides the lowest permeate COD when compared to all other membranes, and thus, could be used for reclamation purposes.

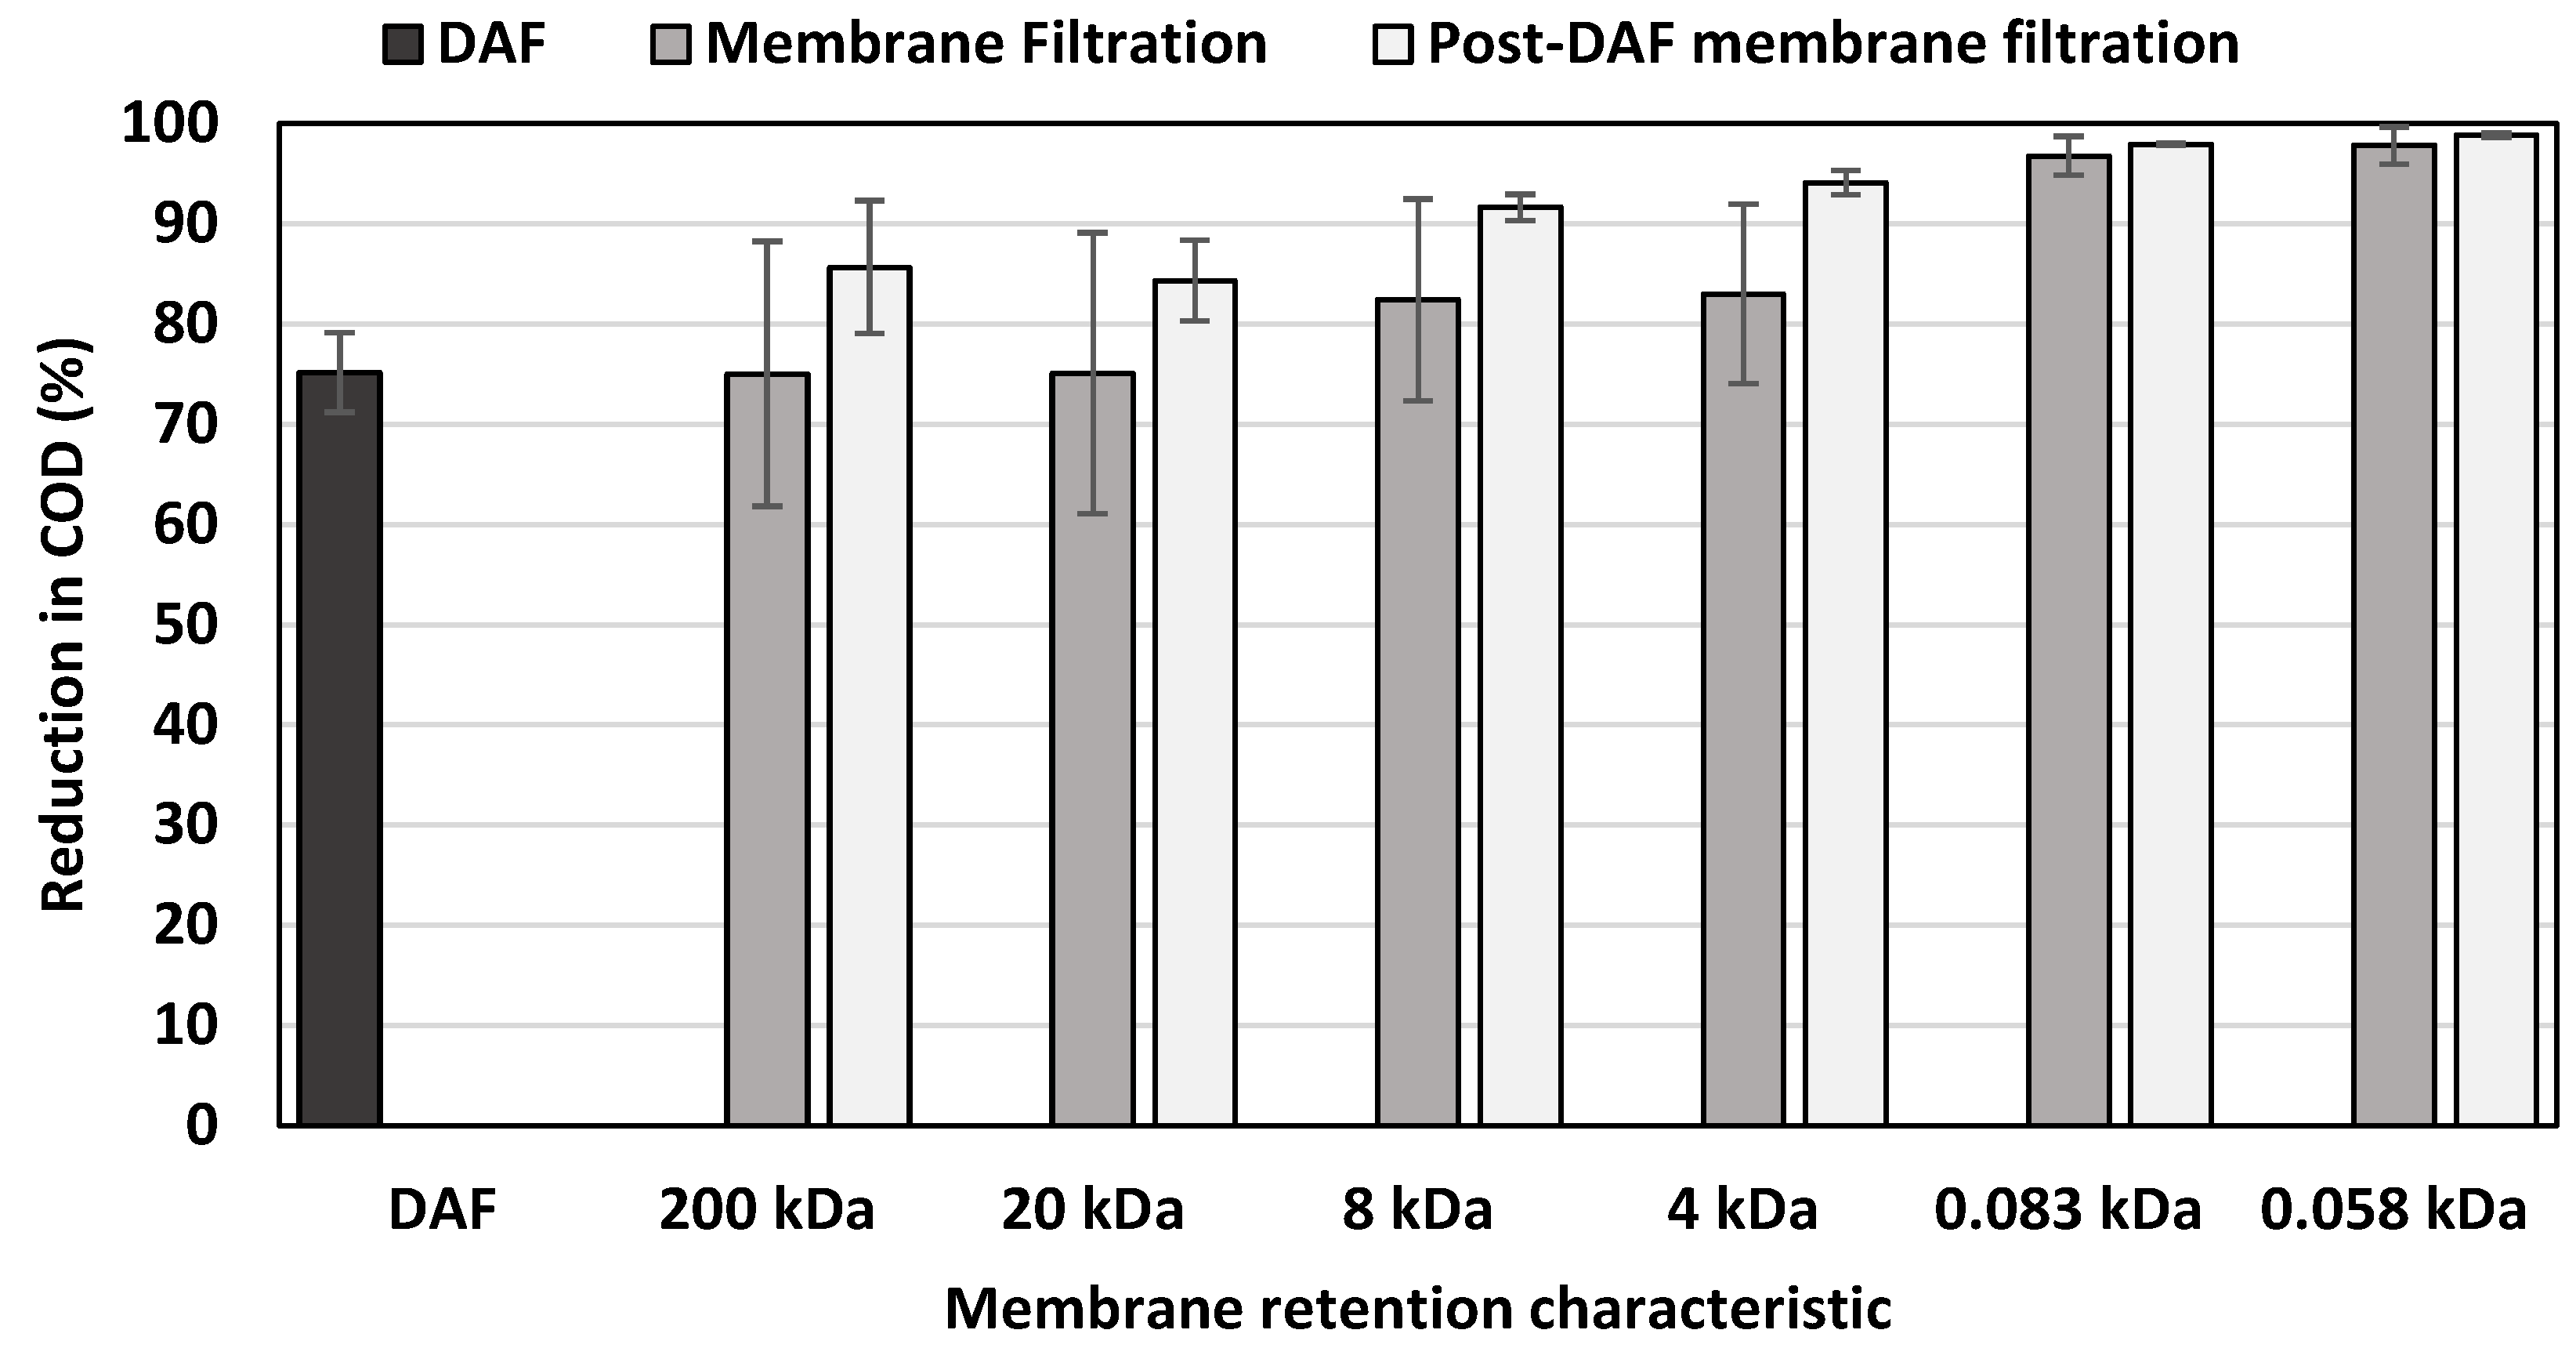
3.2.2. Reduction in COD

DAF provides a 75.15 ± 3.95 % reduction in COD, and this is statistically the same when compared to 200 kDa and 20 kDa pore sized membranes in membrane filtration experiments. The membranes have a higher standard deviation than the DAF because the feed COD changes with time, but the permeate COD – in our results – remained constant in membrane filtration. It was found that 200 kDa and 20 kDa pore sized membranes in membrane filtration experiment are no more efficient than the DAF, but they are more consistent than the DAF. From Figure 6, it is observed that the percent COD reduction increases with a decreased pore size. Among all different treatment methods, the RO membrane in post-DAF membrane filtration provided the highest percent reduction (98.83 ± 0.21 %). Another important observation is that the difference in percent reduction between the two experiments for a particular membrane reduces as the pore size of the membrane decreases. In cases where high percent reductions in COD are required and a smaller pore sized membrane like a 0.083 kDa or a 0.058 kDa cut-off membrane was chosen, it is better to choose the membrane filtration experiment instead of the post-DAF membrane filtration experiment, since the percent COD reductions are not significantly different between the two experiments in those two membranes, and it is economically adventageous to run one treatment method instead of two in series. Therefore, the larger pore sized membranes—200 kDa, 20 kDa, 8 kDa and 4 kDa—are selected for fouling studies, since they operate at lower pressures, which means lower costs than the smaller pore sized membranes—0.083 kDa and 0.058 kDa. Percent reductions in COD were calculated using Equation (1). Fouling rate is the most important parameter in the model as it depicts the rate at which the membrane fouls, and determines the frequency of cleaning, and henceforth, replacement.

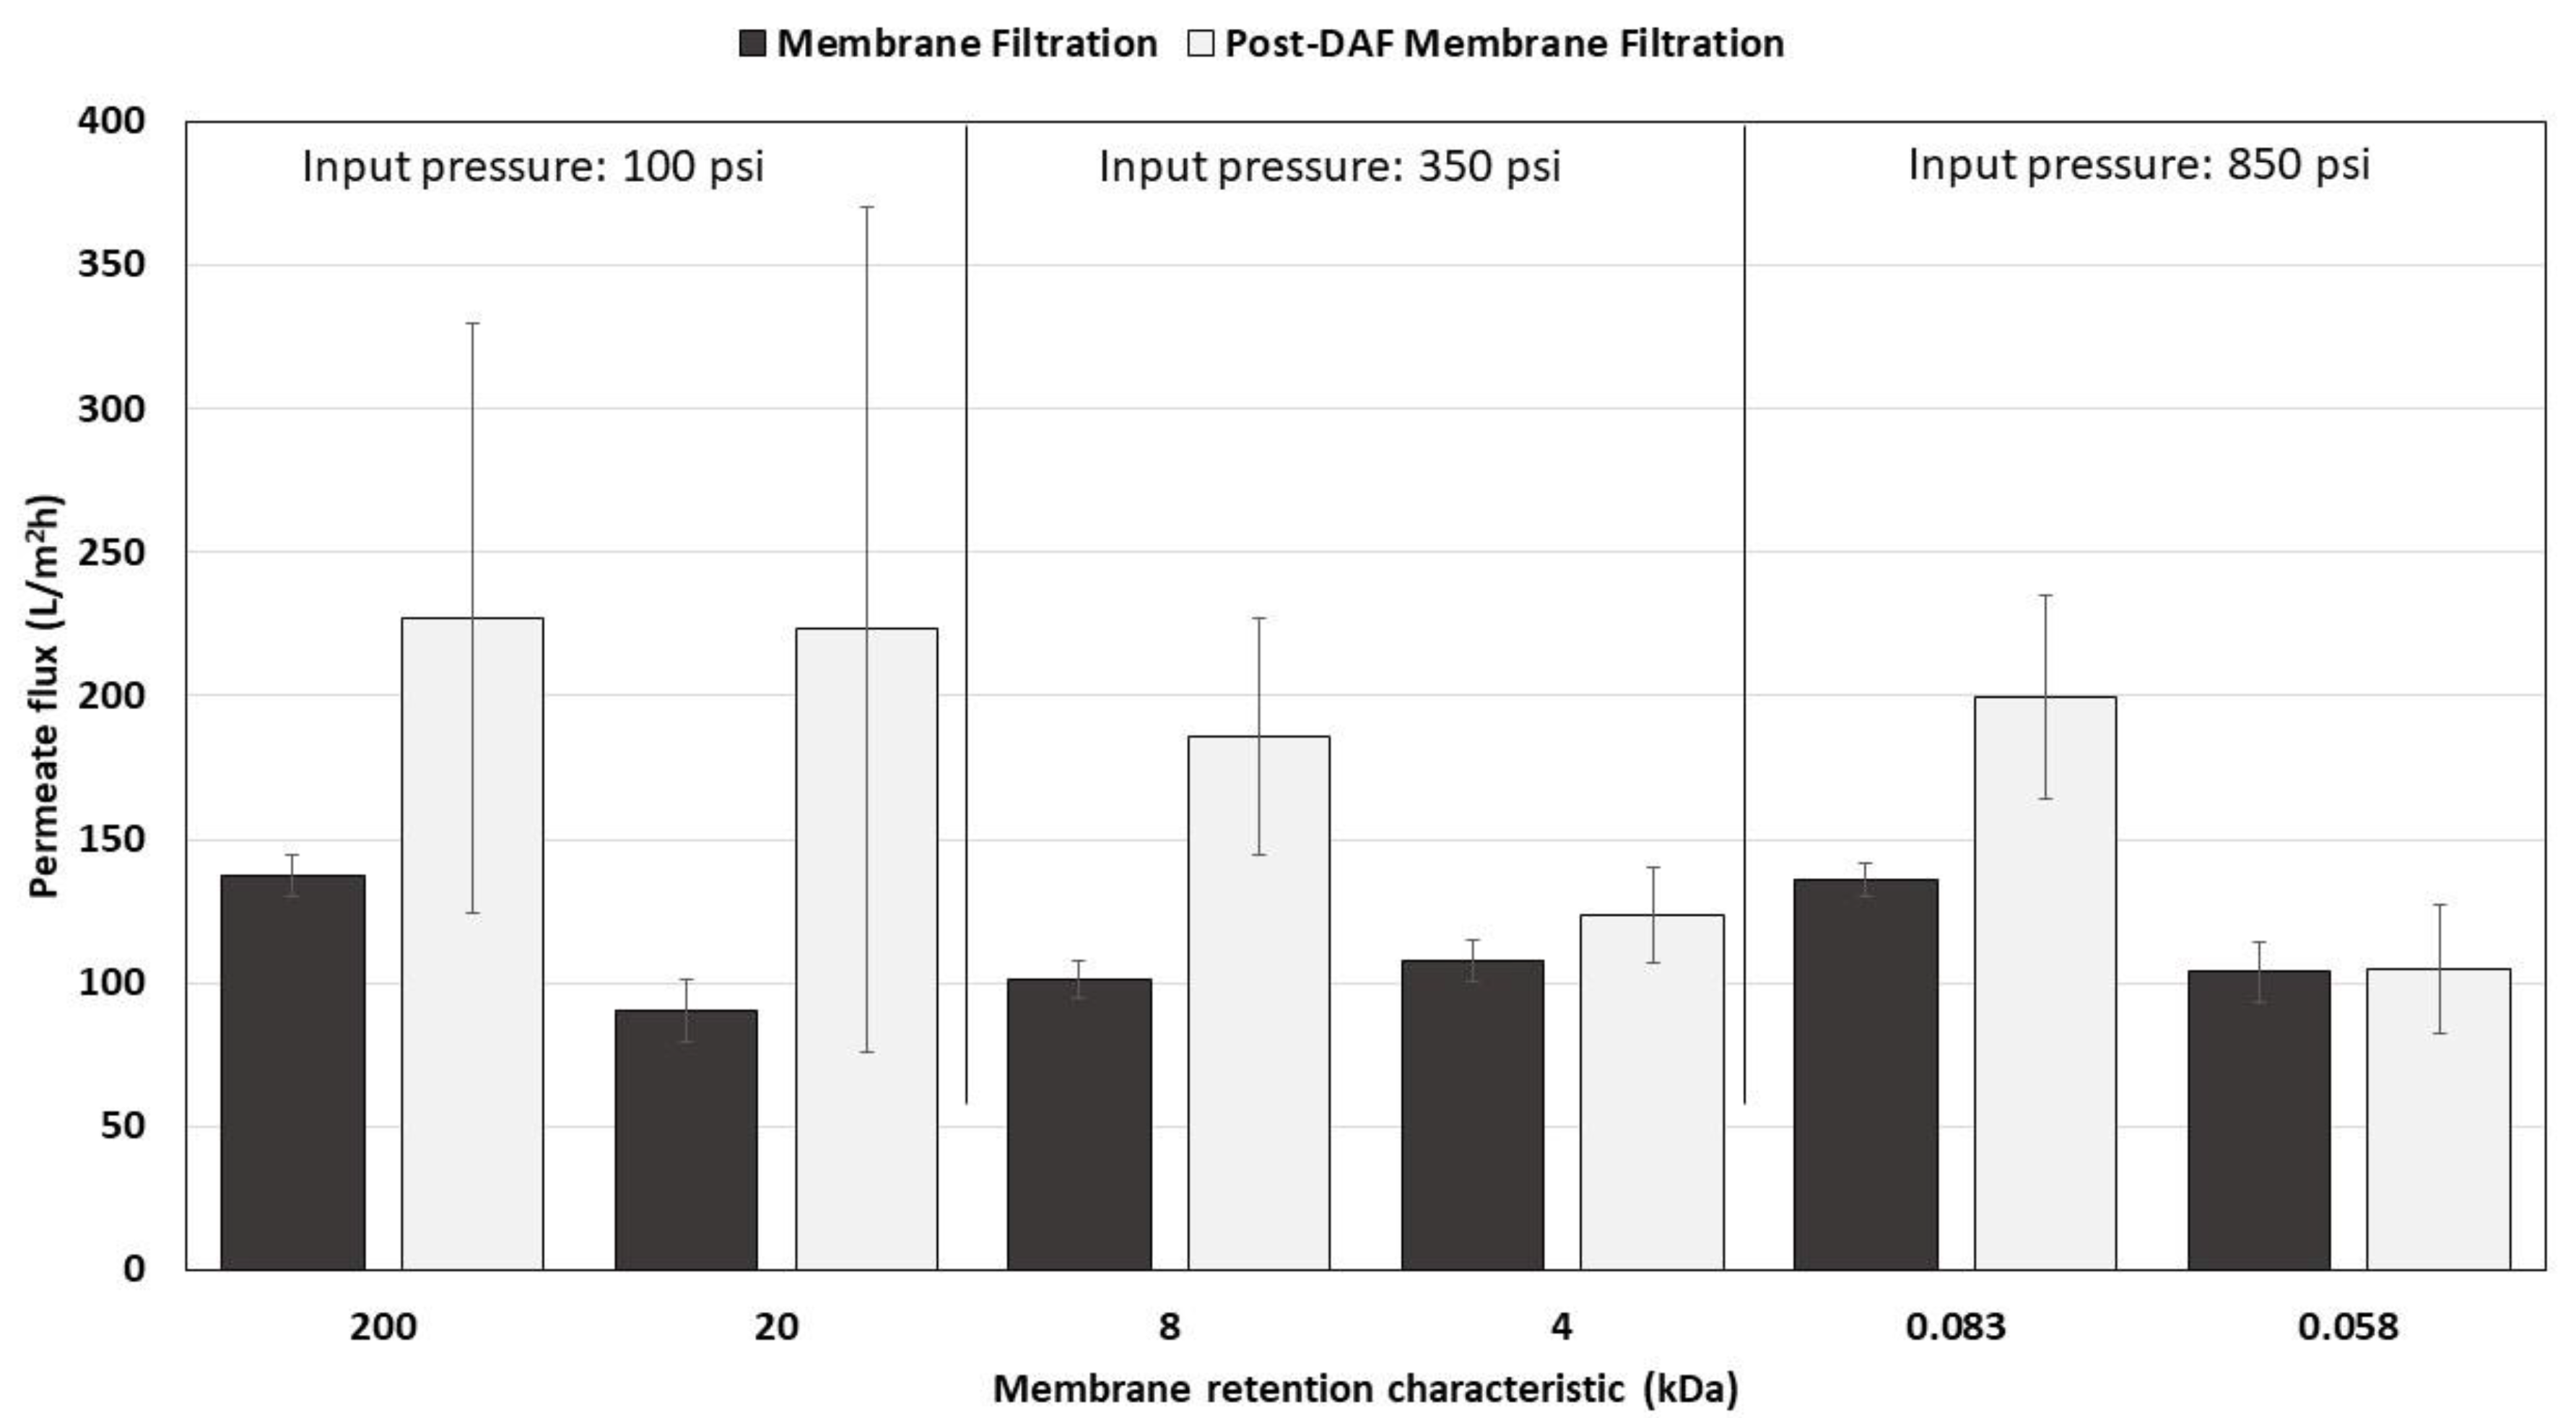
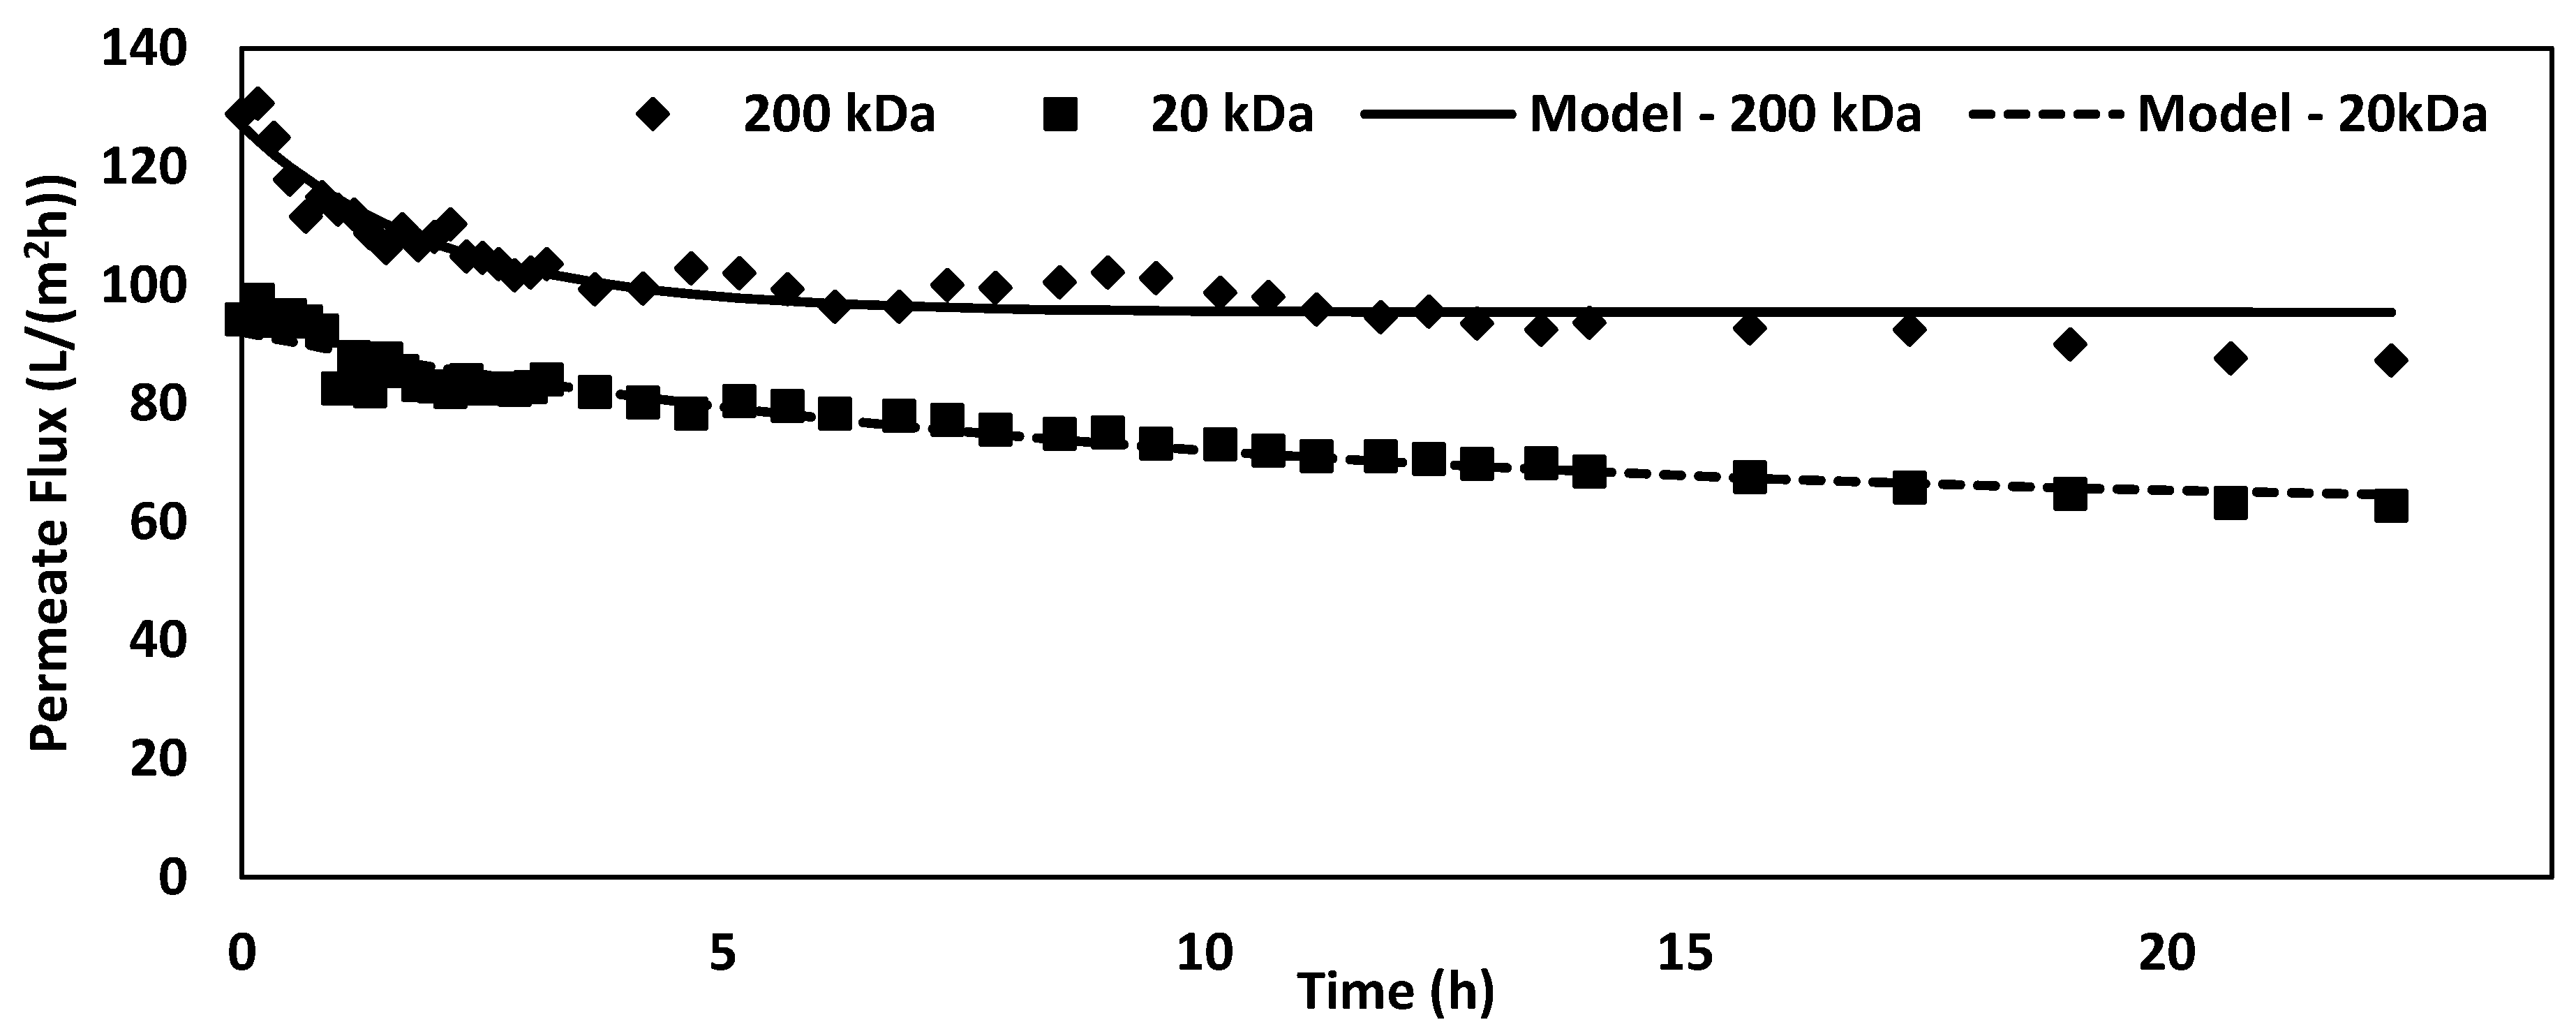
3.2.3. Permeate Flux

The permeate fluxes of different membranes in both experiments are shown in Figure 7 (calculated using Equation 2). Flux is a function of temperature and pressure. Only the membranes which were operated at the same pressure can be compared. Within each set of membranes, it is seen that the smaller pore sized membrane has a lower flux when compared to the larger pore sized membrane. This is because as the pore size reduces, it would be difficult for particles to move across the membrane. And also, in each membrane, the post-DAF membrane filtration flux is higher than the membrane filtration flux. This is because the feed to the membranes in membrane filtration is more concentrated, leading to higher osmotic pressure when compared to the feed in post-DAF membrane filtration.

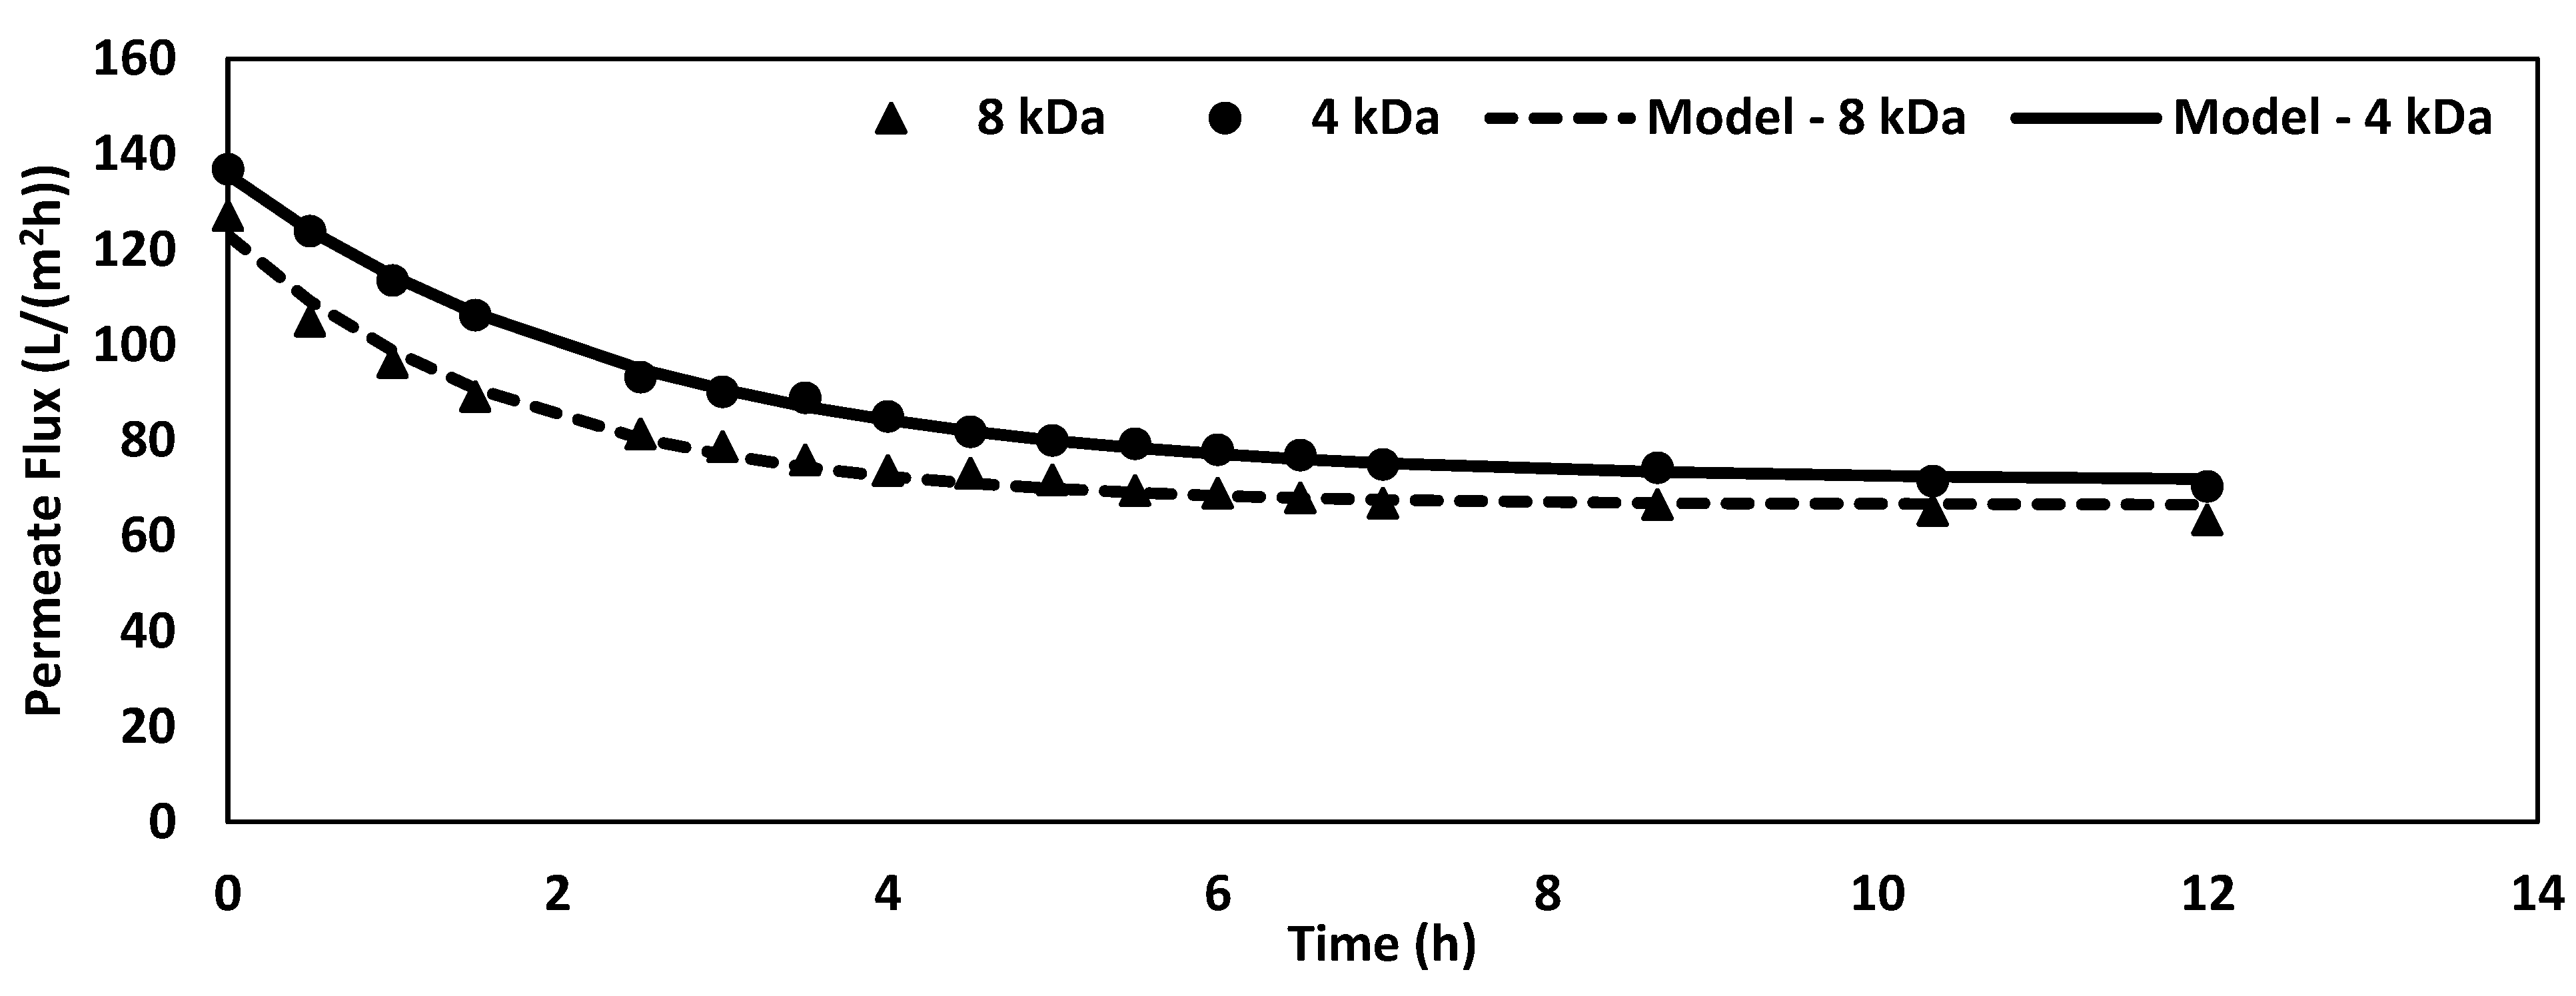
3.3. Extended Fouling Study
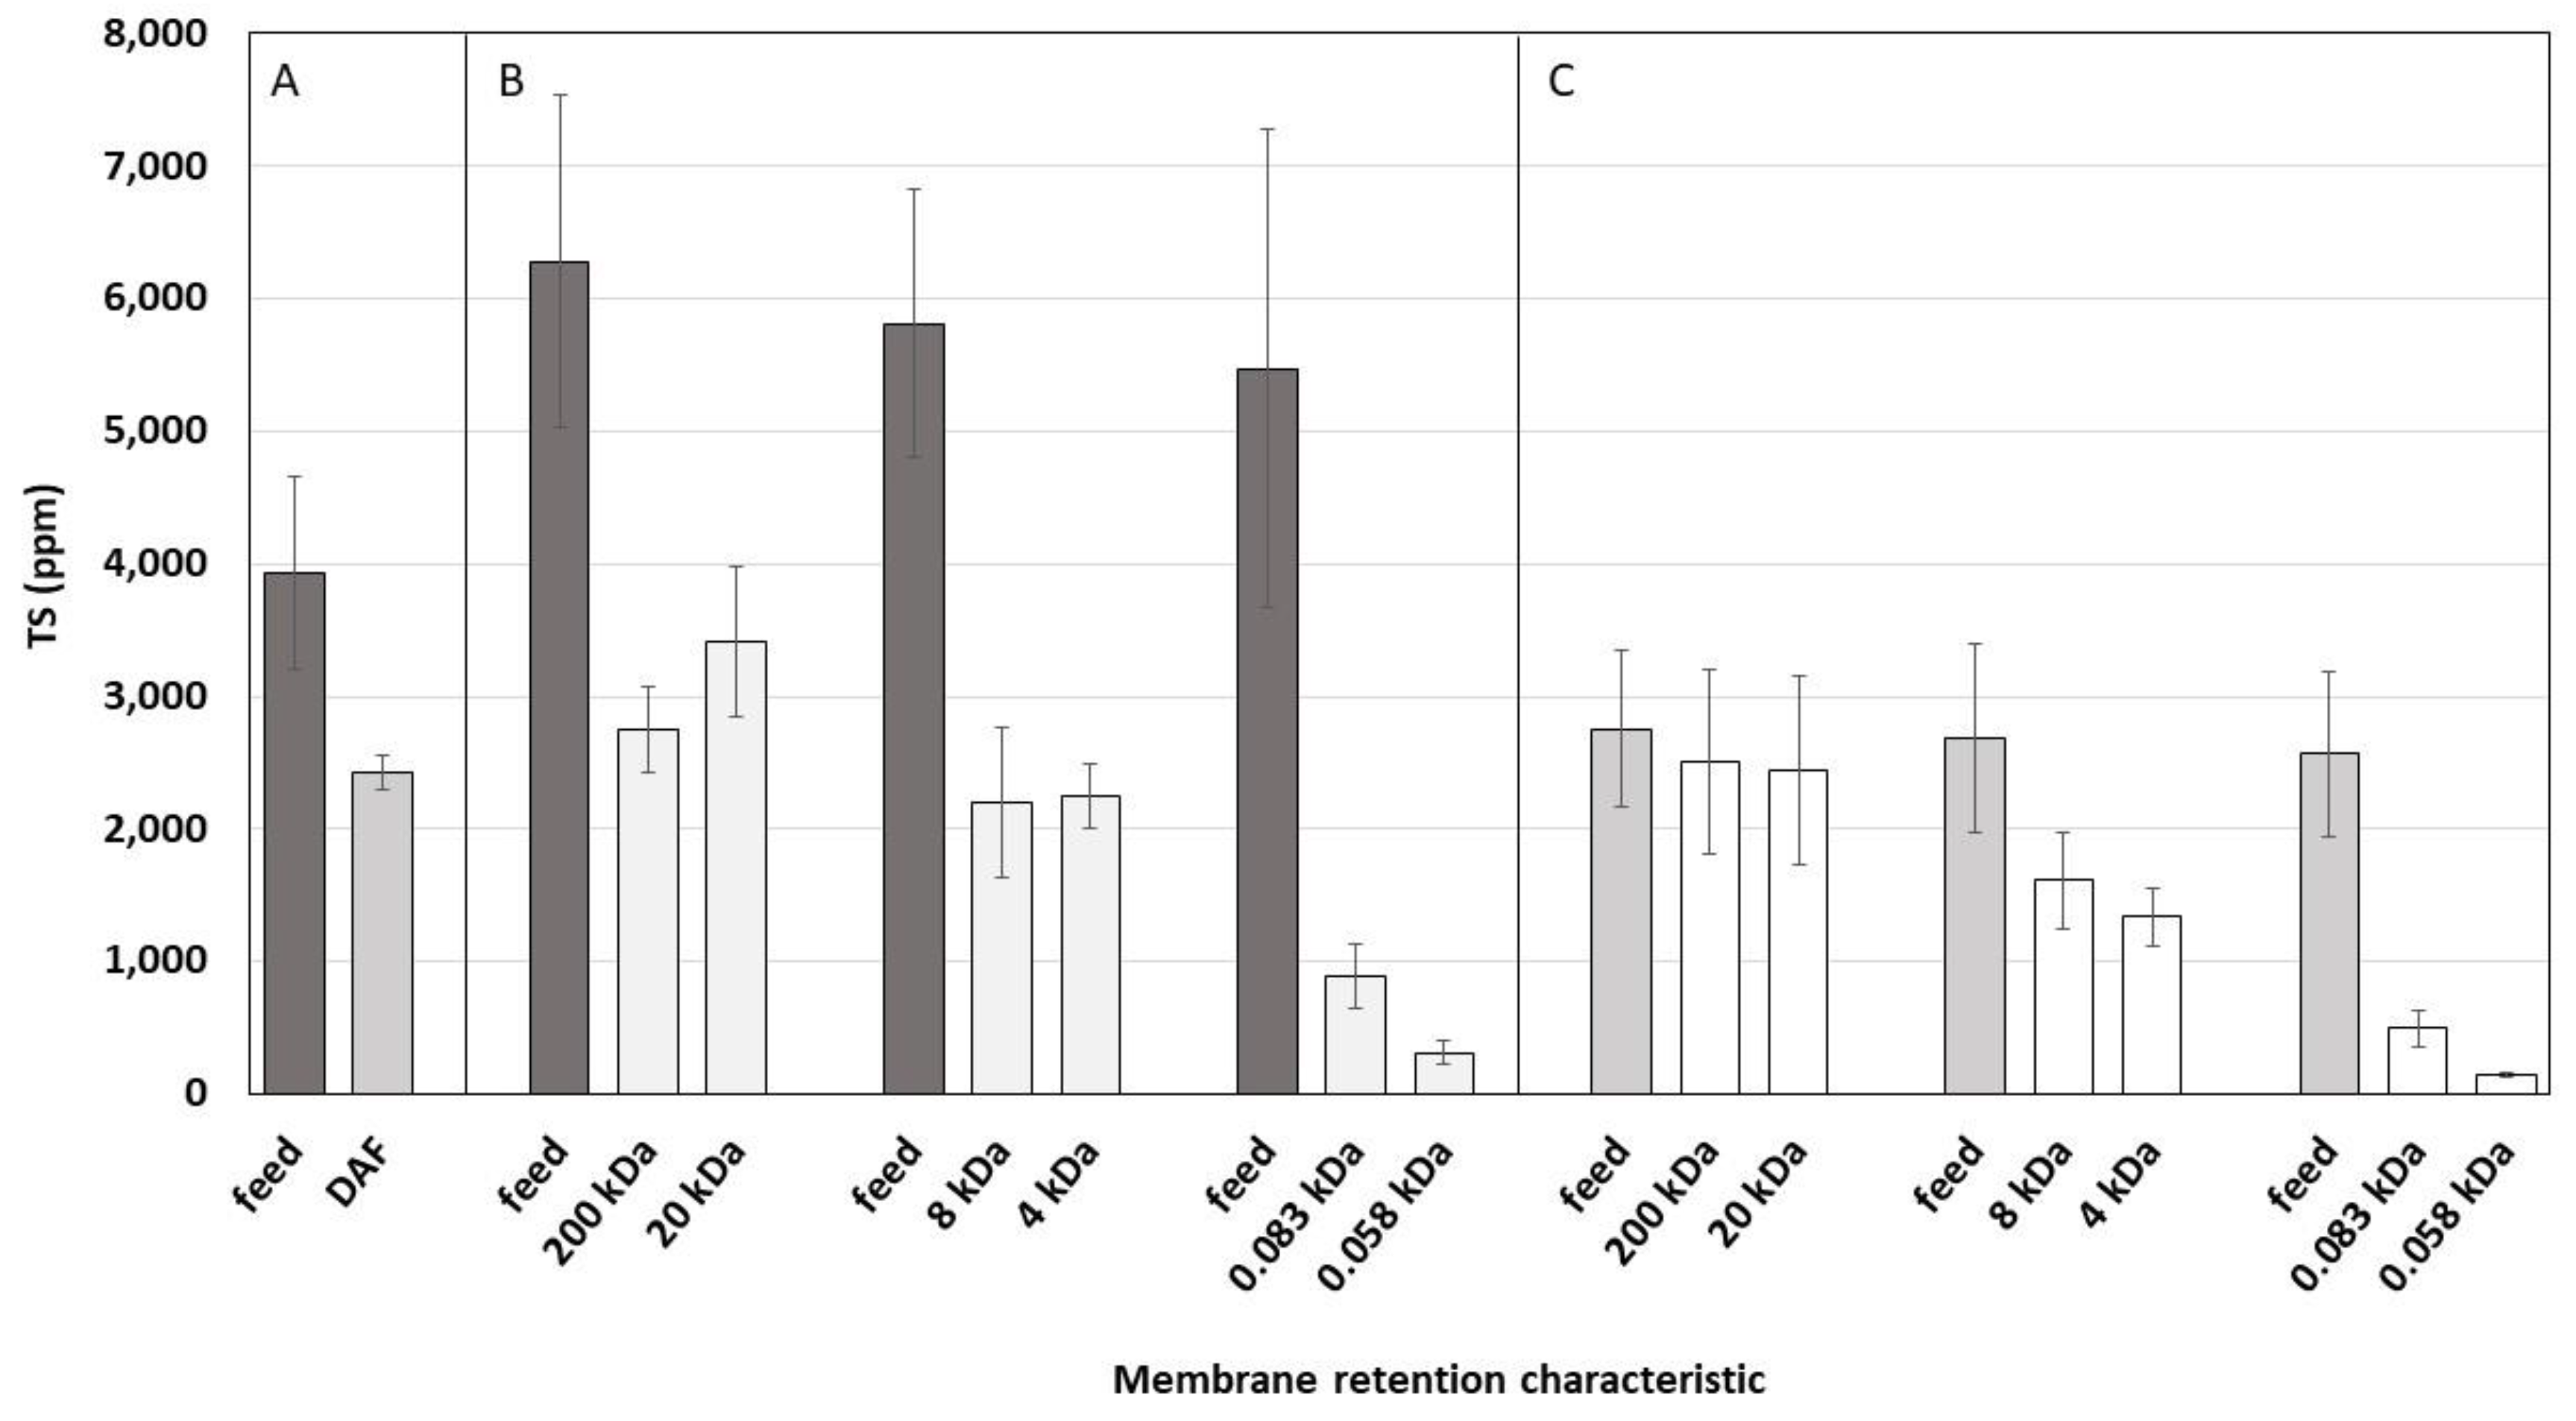
The membranes chosen for extended fouling study were the larger pore sized 200 kDa, 20 kDa, 8 kDa and 4 kDa cut-off membranes. The permeate flux reduces with time as the membrane fouls and asymptotes or equilibrates to a certain flux called the critical flux [22]. Figure 8 and Figure 9 depict the fouling of 200 kDa and 20 kDa cut-off membranes at 100 psi and 8 kDa and 4 kDa cut-off membranes at 350 psi, respectively. The flux reduces exponentially with time for first few minutes, and then it starts to equilibrate to a critical flux with increase in time. Therefore, the raw data was modelled with exponential fouling models, and the parameters of the model were determined from least sqaures, and are shown in Table 5. It is seen that the 200 kDa cut-off membrane has the highest critical flux (asymptote) of 95.4 ± 0.84 L/(m2h) which is related to the biggest pore size. The 20 kDa cut-off membrane has the lowest critical flux of 62.01 ± 2.48 L/(m2h) and fouling rate of 0.11 ± 0.02 h−1 among the four membranes studied. Lower fouling rates relate to longer lifetimes of the membrane; thus, the 20 kDa cut-off membrane is desirable, even though its critical flux is lower.

3.4. Solids Content

Total solids present in the feed and output/permeate of different treatments are depicted in Figure 10. The DAF (A) produced a 37.69% reduction in TS from 3932 ppm to 2424 ppm. In part B of Figure 10, the permeate of the RO membrane had the lowest TS, 311 ppm. The feed to this treatment method and DAF are the same. The feed to the treatment method C post-DAF membrane filtration is same as the output of the DAF. In this method, the permeate of the RO membrane had the lowest TS, i.e., 145 ppm. This TS is lower than that of the RO membrane in treatment B, since the feed to the latter treatment is higher. The feed to the membrane filtration experiment (B) has solids that are greater than 200 kDa, and the feed to the post-DAF membrane filtration (C) has solids that are greater than 8 kDa, but smaller than 20 kDa. So, the DAF is removing the solids which are bigger than 20 kDa, but is not effective at removing solids smaller than that.

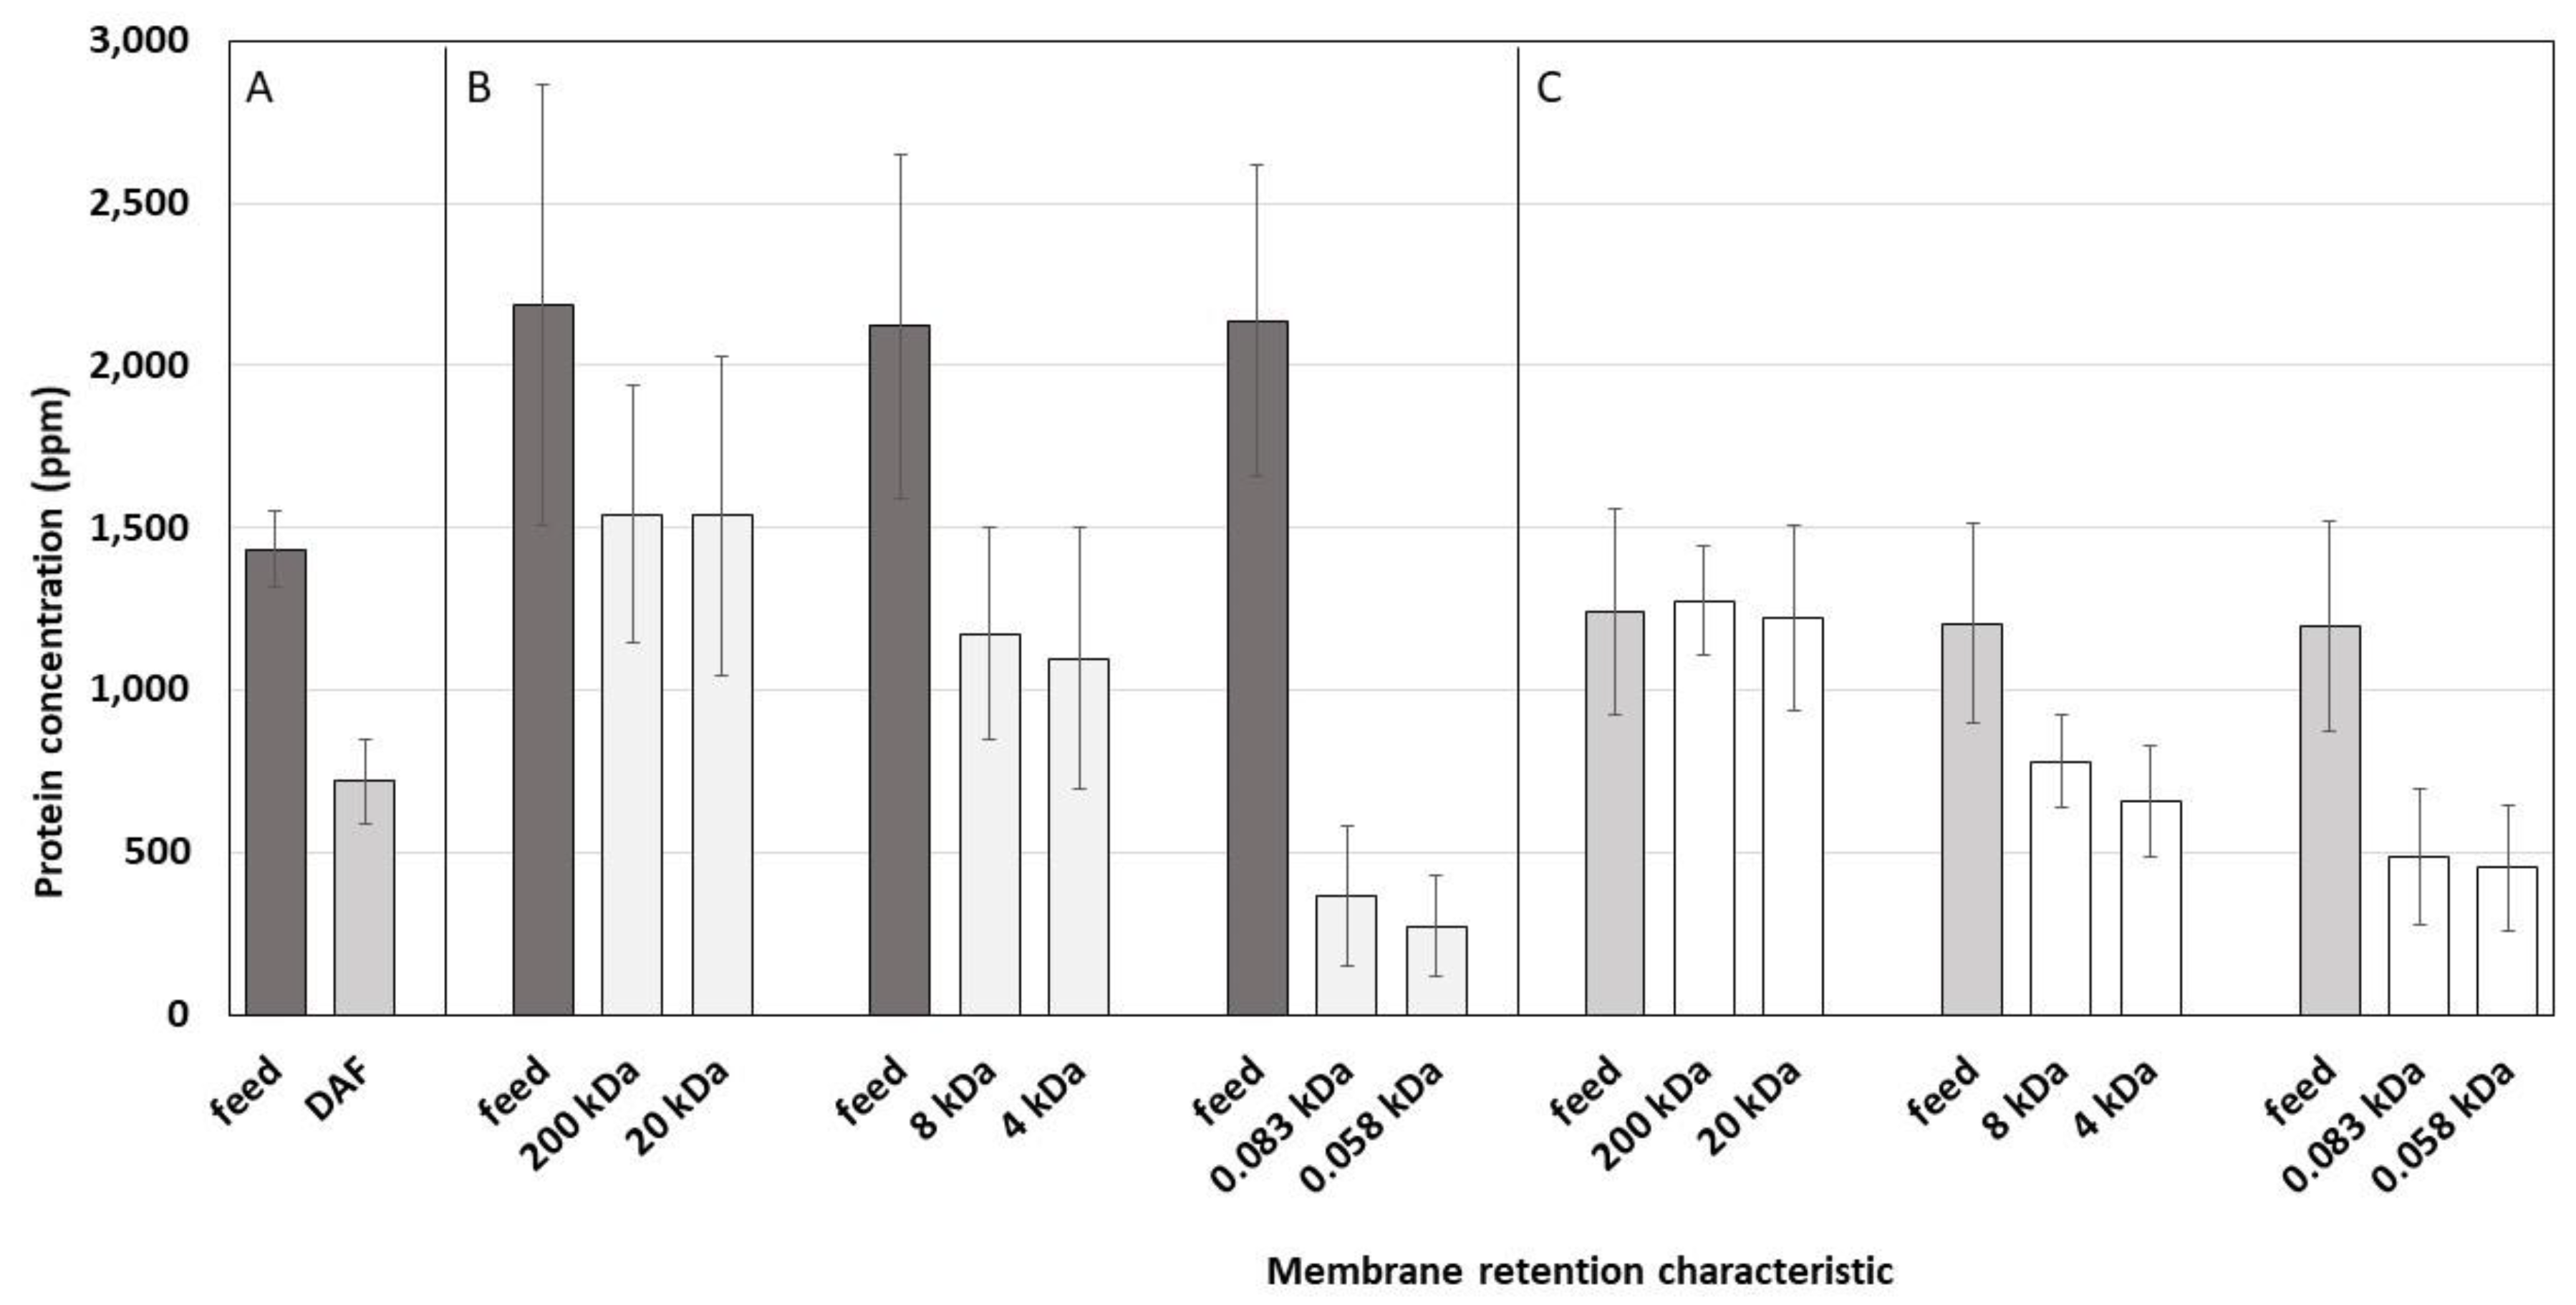
3.5. Protein Concentration

Proteins present in the feed and output/permeate of different treatments are depicted in Figure 11. The DAF (A) produced a 50.12% reduction in protein from 1351 ppm to 625 ppm. In the membrane filtration experiment (part B), the protein concentration in the permeate reduced with a decrease in pore size. In post-DAF membrane filtration experiment (part C), the protein reduction percentage was very low. This means that the DAF has removed all proteins bigger than 20 kDa. Additionally, the protein concentration in the permeate decreased with a decrease in pore size in both membrane filtration and post-DAF membrane filtration experiments.

4. Conclusions

The application of membrane filtration to the management of waste water streams from a dairy manufacturing operation has been completed. The waste water stream had a pH of 11.32 ± 0.55 and was heterogeneous in terms of COD, protein and total solids. A Dissolved Air Flotation (DAF) system removed large particles, total solids and proteins. The DAF system was not effective in reducing the COD of the waste stream to below a target COD of 1200 ppm on a consistent basis.
All six membranes (200, 20, 8, 4, 0.083, 0.058 kDa) reduced the permeate COD to less than 1200 ppm. These reductions were independent of the COD of the feed stream. The permeate COD from the membranes was not influenced significantly by pressure. The reduction in permeate COD improved as the membrane pore size decreased.
Two membranes with operating pressures of 100 psi (200 and 20 kDA) and two with operating pressures of 350 psi (8 and 4kDa) were selected for extended fouling studies. The permeate flux from the four membranes decreased with time due to fouling, and the decrease in flux was described by a three-parameter expression, including a fouling rate constant. The 20 kDa pore size membrane had the lowest fouling rate in the extended fouling study compared to the other three membranes. In addition, the 20 kDa pore size membrane operated at a lower pressure than the 8 or 4 kDa pore size membranes.

Author Contributions

S.N., D.P. and D.H. designed the experiments and goals of the research study; S.N. and D.P. Executed pilot trails and analyzed data; S.N. wrote the paper; D.H. is responsible for overall content of the research.

Funding

Funding for this research was received by the Center for Innovative Food Technology (Toledo, OH, USA) Project number 4703.

Acknowledgments

The authors wish to acknowledge the generous donations from Dale A. Seiberling. And also would like to thank OARDC (Ohio Agricultural Research and Development Center). This work was supported by the Centre for Innovative Food Technology (CIFT) in Ohio.

Conflicts of Interest

The authors declare no conflict of interest.

Nomenclature

Abbreviations
EQEquilibrium tank
DAFDissolved air floatation
PVDFPolyvinylidene fluoride
ROReverse osmosis
CODChemical oxygen demand
BCABicinchoninic acid assay
CIPClean in place
FOGFats, oils and grease
TSTotal solids
TSSTotal suspended solids
kDaKilo Dalton
MWWTMunicipal waste water treatment
Symbols
CpPermeate concentration (ppm)
CfFeed concentration (ppm)
JPermeate flux (L/(m2h))
aAsymptote (L/(m2h))
bScale (L/(m2h))
cFouling rate h−1

References

  1. Wojdalski, J.; Drózdz, B.; Piechocki, J.; Gaworski, M.; Zander, Z.; Marjanowski, J. Determinants of Water Consumption in the Dairy Industry. Pol. J. Chem. Technol. 2013, 15, 61–72. [Google Scholar] [CrossRef]
  2. Carawan, R.E.; Jones, V.A.; Hansen, A.P. Water Use in a Multiproduct Dairy. J. Dairy Sci. 1979, 62, 1238–1242. [Google Scholar] [CrossRef]
  3. Balannec, B.; Vourch, M.; Rabiller-Baudry, M.; Chaufer, B. Comparative Study of Different Nanofiltration and Reverse Osmosis Membranes for Dairy Effluent Treatment by Dead-End Filtration. Sep. Purif. Technol. 2005, 42, 195–200. [Google Scholar] [CrossRef]
  4. Demirel, B.; Yenigun, O.; Onay, T.T. Anaerobic Treatment of Dairy Wastewaters: A Review. Process Biochem. 2005, 40, 2583–2595. [Google Scholar] [CrossRef]
  5. Perle, M.; Kimchie, S.; Shelef, G. Some Biochemical Aspects of the Anaerobic Degradation of Dairy Wastewater. Water Res. 1995, 29, 1549–1554. [Google Scholar] [CrossRef]
  6. Wang, L.K.; Hung, Y.; Lo, H.H.; Yapijakis, C. Handbook of industrial and hazardous wastes treatment; CRC Press: Boca Raton, FL, USA, 2004. [Google Scholar]
  7. Chimenos, J.M.; Fernández, A.I.; Hernández, A.; Haurie, L.; Espiell, F.; Ayora, C. Optimization of Phosphate Removal in Anodizing Aluminium Wastewater. Water Res. 2006, 40, 137–143. [Google Scholar] [CrossRef] [PubMed]
  8. Tchamango, S.; Nanseu-Njiki, C.P.; Ngameni, E.; Hadjiev, D.; Darchen, A. Treatment of Dairy Effluents by Electrocoagulation Using Aluminium Electrodes. Sci. Total Environ. 2010, 408, 947–952. [Google Scholar] [CrossRef] [PubMed]
  9. Mavrov, V.; Bdli, E. Reuse of Vapour Condensate from Milk Processing Using Nanofiltration. Filtr. Sep. 2000, 37, 24–27. [Google Scholar] [CrossRef]
  10. Buntner, D.; Sánchez, A.; Garrido, J.M. Feasibility of Combined UASB and MBR System in Dairy Wastewater Treatment at Ambient Temperatures. Chem. Eng. J. 2013, 230, 475–481. [Google Scholar] [CrossRef]
  11. Şengil, I.A.; özacar, M. Treatment of Dairy Wastewaters by Electrocoagulation Using Mild Steel Electrodes. J. Hazard. Mater. 2006, 137, 1197–1205. [Google Scholar] [CrossRef] [PubMed]
  12. Thompson, G.; Swain, J.; Kay, M.; Forster, C.F. The Treatment of Pulp and Paper Mill Effluent: A Review. Bioresour. Technol. 2001, 77, 275–286. [Google Scholar] [CrossRef]
  13. Vourch, M.; Balannec, B.; Chaufer, B.; Dorange, G. Treatment of Dairy Industry Wastewater by Reverse Osmosis for Water Reuse. Desalination 2008, 219, 190–202. [Google Scholar] [CrossRef]
  14. Suárez, A.; Fidalgo, T.; Berdasco, M.A.; Riera, F.A. UHT Condensate Recovery by Reverse Osmosis: A Pilot-Plant Study. Ind. Eng. Chem. Res. 2014, 53, 15237–15244. [Google Scholar] [CrossRef]
  15. Riera, F.A.; Suárez, A.; Muro, C. Nanofiltration of UHT Flash Cooler Condensates from a Dairy Factory: Characterisation and Water Reuse Potential. Desalination 2013, 309, 52–63. [Google Scholar] [CrossRef]
  16. Zydney, A.L. Protein Separations Using Membrane Filtration: New Opportunities for Whey Fractionation. Int. Dairy J. 1998, 8, 243–250. [Google Scholar] [CrossRef]
  17. Trägardh, G.; Johansson, D. Purification of Alkaline Cleaning Solutions from the Dairy Industry Using Membrane Separation Technology. Desalination 1998, 119, 21–29. [Google Scholar] [CrossRef]
  18. Gésan-Guiziou, G. Removal of Bacteria, Spores and Somatic Cells from Milk by Centrifugation and Microfiltration Techniques. In Improving the Safety and Quality of Milk; Elsevier: Amsterdam, The Netherlands, 2010; pp. 349–372. [Google Scholar] [CrossRef]
  19. Shi, X.; Tal, G.; Hankins, N.P.; Gitis, V. Fouling and Cleaning of Ultrafiltration Membranes: A Review. J. Water Process Eng. 2014, 1, 121–138. [Google Scholar] [CrossRef]
  20. PCI Membranes, “PCI Tubular Membranes Product Information,” Product sheet, 2018. Available online: https://www.pcimembranes.com/en-US/download-centre/product-information (accessed on 20 May 2017).
  21. Huang, X.; Liu, R.; Qian, Y. Behaviour of Soluble Microbial Products in a Membrane Bioreactor. Process Biochem. 2000, 36, 401–406. [Google Scholar] [CrossRef]
  22. Chan, R.; Chen, V. The Effects of Electrolyte Concentration and PH on Protein Aggregation and Deposition: Critical Flux and Constant Flux Membrane Filtration. J. Memb. Sci. 2001, 185, 177–192. [Google Scholar] [CrossRef]
Figure 1. Process flow of current wastewater treatment method.
Applsci 08 02694 g001
Figure 2. Membrane housing with six slots for 1 foot, ½ inch diameter tubular membranes.
Applsci 08 02694 g002
Figure 3. Process flow for membrane filtration experiment. a—Baffler; b—Temperature sensor; c—Pressure sensor.
Applsci 08 02694 g003
Figure 4. Process flow for post-DAF membrane filtration experiment. a—Baffler; b—Temperature sensor; c—Pressure sensor.
Applsci 08 02694 g004
Figure 5. Chemical Oxygen Demand (COD) of the feed and permeate stream of different membranes in (A) membrane filtration and (B) post-DAF membrane filtration experiment.
Applsci 08 02694 g005
Figure 6. Percent reduction in COD across various treatment methods.
Applsci 08 02694 g006
Figure 7. Permeate fluxes (L/(m2h)) of different membranes in both experiments—membrane filtration and post-DAF membrane filtration.
Applsci 08 02694 g007
Figure 8. Exponential fouling model on 200 kDa and 20 kDa in membrane filtration experiment at 6.89 bar.
Applsci 08 02694 g008
Figure 9. Exponential fouling model on 8 kDa and 4 kDa in membrane filtration experiment at 24.13 bar.
Applsci 08 02694 g009
Figure 10. Total solids in the feed and the output/permeate of different treatments: A—DAF; B—membrane filtration; C—post-DAF membrane filtration.
Applsci 08 02694 g010
Figure 11. Protein concentration in the feed and the output/permeate of different treatments: A—DAF; B—membrane filtration; C—post-DAF membrane filtration.
Applsci 08 02694 g011
Table 1. Membrane characteristics [20].
Membrane Commercial NameRetention Characteristic (kDa)Membrane MaterialpH RangeMaximum Pressure (bar)Maximum Temperature (°C)
FP200200PVDF *1.5–121080
FPA0320PVDF *1.5–10.5760
PU6088Polysulphone1.5–123080
ES4044Polyethersulphone1.5–123080
AFC300.083Polyamide film1.5–9.56060
AFC99 **0.058Polyamide film1.5–126480
* Polyvinylidene fluoride, ** Reverse osmosis.
Table 2. Membrane cleaning characteristics [20].
Membrane TypeCleaning chemistryAcidTemperature (°C)
AFC990.25% sodium hydroxide0.3% nitric acid50
AFC300.5% enzyme0.3% nitric acid45
Others1% chlorinated alkaline detergent0.3% nitric acid50
Table 3. Operation pressures of the various membranes used.
MembraneRetention characteristic (kDa)Operating Pressure (bar)
FP2002006.89
FPA03206.89
PU608824.13
ES404424.13
AFC300.08358.61
AFC990.05858.61
Table 4. Feed source characterization.
ParameterConcentration ± SD
pH11.32 ± 0.55
Free Cl5 ± 1 ppm
COD8201 ± 3010 ppm
Protein1970 ± 359 ppm
FOG98 ± 113 ppm
TS5857 ± 1261 ppm
TSS2 ± 1 ppm
Table 5. Exponential fouling model parameters (Mean ± standard error).
MembraneAsymptote (L/(m2h))Scale (L/(m2h))Fouling Rate (1/h)
200 kDa95.40 ± 0.8431.59 ± 2.020.50 ± 0.06
20 kDa62.01 ± 2.4830.09 ± 2.180.11 ± 0.02
8 kDa66.43 ± 1.0056.54 ± 1.940.56 ± 0.05
4 kDa71.37 ± 0.6264.34 ± 0.880.40 ± 0.01

