Article

An Approach to Predicting Sediment Microbial Fuel Cell Performance in Shallow and Deep Water

by
Kenneth E. Richter
* and
Jennifer M. Ayers
SPAWAR Systems Center Pacific, 53560 Hull Street, San Diego, CA 92152-5001, USA
*
Author to whom correspondence should be addressed.
Appl. Sci. 2018, 8(12), 2628; https://doi.org/10.3390/app8122628
Submission received: 31 October 2018 / Revised: 29 November 2018 / Accepted: 4 December 2018 / Published: 14 December 2018
(This article belongs to the Special Issue Microbial Fuel Cells)

Abstract

:

Featured Application

Predictions of sediment microbial fuel cell power output.

Abstract

Here we present an approach to predicting sediment microbial fuel cell performance based on environmental conditions. Sediment total organic carbon and water temperature were found to be important determinants in predicting the power output from microbial fuel cells in shallow sediments (<100 m) in San Diego. We extrapolated data from the in situ San Diego experiments to predict MFC performance in shallow sediments in other locations, namely the Gulf of Mexico and the Yellow Sea. Finally, using laboratory data of MFC performance in deep water (~1000 m) sediment samples, we extend our predictions to ocean sediments worldwide. We predict low power output from the deep sea (microwatts) relative to the shallow sediments (milliwatts), and attribute that to a possible lack of electrogenic bacteria in the sediments, lower sediment permeability, or a greater proportion of refractory organic matter reaching the bottom.

1. Introduction

Microbial fuel cells (MFCs) work by providing electrogenic bacteria, e.g., Geobacter spp., in anaerobic sediments with an electron acceptor (initially a conductive anode) that stimulates metabolism of organic matter [1,2,3,4,5,6,7]. The buried anode is connected via control circuitry to a cathode exposed to oxygen in the overlying water. During metabolism, bacteria release hydrogen ions into the sediment and transfer electrons extra-cellularly to the anode, which eventually reduces dissolved oxygen at the cathode, forming water. The open circuit voltage is approximately 0.8 V [5,7]. The voltage between electrodes is operationally kept at 0.4 V with a potentiostat. The current is chiefly limited by the rate of microbial metabolism at the anode. Work at SPAWAR Systems Center Pacific, a Navy laboratory in San Diego, involves fuel cell design and testing, applications to low power sensors [8,9,10,11,12], and studies of important environmental parameters that affect fuel cell performance.
Earlier work in shallow sediments of San Diego Bay [13] showed that the most important environmental parameters that control fuel cell power output in San Diego Bay were total organic carbon (TOC) in the sediment and seasonal water temperature. Parameters that were dismissed as non-limiting were dissolved oxygen levels, light level, and initial sediment bacterial populations. Other ancillary but important parameters were found to be anode exposure to oxygen via bioturbation of the sediment, and fouling of the suspended cathode. Anode size was found to be an important non-environmental design parameter in predicting power output. Power density, the power output per anode surface area (typically mW/m2), was observed to decrease as the anode size increased, presumably due to resistive losses in the anode [10,11,13,14]. With carbon fabric or brushes, the anode material commonly used in laboratory and field tests, MFC power is not linearly scalable with anode size. Factors influencing microbial fuel cell performance are clearly complex. Herein we show an approach for predicting sediment microbial fuel cell performance based on two tractable environmental features: sediment TOC and water temperature. We separate performance characteristics into those of shallow (<100 m) and deep (≥1000 m) sediments.

2. Materials and Methods

A marine sediment microbial fuel cell is made by placing a non-metallic conductive surface (anode), usually graphite or carbon cloth, on or in sediment under anaerobic conditions. A wire (22 gauge insulated titanium, ~0.1 ohm/m) conducts electrons to a conductive surface (cathode), again usually made of carbon cloth or carbon brushes, suspended in oxygenated seawater via a potentiostat circuit. The potentiostat controls the voltage between anode and cathode by varying the amount of current flowing between the anode and cathode, and may be teamed with a data recorder [15]. Non-metallic, non-corrosive materials are used to minimize corrosion-induced currents and extend the life of the electrodes. A reference electrode (usually Ag/AgCl) is often connected to the data recorder in order to assess the “health” of the electrodes relative to their expected voltage. It is important that the cathode is large enough, relative to the anode, so that it does not limit the MFC current. A cathode voltage ~0.4 V above the reference electrode is indicative of a non-limiting cathode. Experimentally, we have found that open circuit voltage between and a stabilized MFC anode and cathode is ~0.78 V. This voltage is typically reached in one to five days. The open circuit voltage, while smaller than the theoretical value when transferring electrons from glucose to oxygen, is reasonable, given various internal resistances [7]. The voltage of the cathode is typically ~0.4 V above the reference when the open-circuit system is stable, and we operationally use this value to determine that the cathode is not limiting when current is allowed to flow from anode to cathode.
Laboratory measurements of MFC performance were made using the following setup. Measurements at ambient pressures reported here used triplicate swatches of carbon cloth 2 cm on a side as anodes. One liter of sediment samples from different collection sites were nestled together in a temperature bath constructed from a covered 20 gallon cooler with aerated seawater and electrical chiller. Individual potentiostats outside of the bath controlled the current from each sediment sample and were connected to a large common carbon cloth cathode in the bath. Seawater was refreshed weekly. The cumulative anode surface area was approximately 36 cm2, and the common cathode surface area was approximately 1200 cm2. The cathode was suspended approximately 10 cm above the sediment samples in seawater to minimize ionic and internal resistance. The electrode wire lengths to the potentiostat were typically 30 cm or less. Laboratory measurements under pressure were conducted using a programmable custom system by Thar Designs. Approximately 0.5 L of sediment was placed in a 2 L cylinder filled with seawater. The anode and cathode were composed of carbon cloth swatches connected to a potentiostat outside of the bath. The anode surface area in the pressure housing was typically 12 cm2 and cathode area was approximately 200 cm2.
In situ measurements of MFC performance were also made as follows. Shallow (<10 m) field measurements were made with a diver-deployed 8 m2 graphite grid anode and a complex of carbon brushes acting as cathode. The potentiostat and data recorder were housed in a pressure vessel. In situ deep field measurements were made with triplicate hollow core graphite tubes driven into the sediment by weights on a remote vehicle [13]. The cathodes were large swatches of carbon cloth. The electronics were again housed in a pressure vessel. In the field deployments, the cathode was <1 m away from the buried anodes, the cathode surface area was approximately 20 times anode surface area, and wire lengths to the intervening potentiostat were approximately 0.5 m. An acoustic release was used to drop the weights (ballast) and allow the vehicle to return to the surface for retrieval.

3. Results

3.1. Shallow Water Predictions (<100 m)

Figure 1 and Figure 2 (previously published in [13]) show a general approach to estimating MFC continuous power output in San Diego Bay. Output in response to variable TOC as percent weight in the sediment and water temperatures can be applied to sediment TOC maps and seasonal temperature distributions to derive seasonal estimates of MFC power employing a 1 m2 anode. These estimates can be used as an engineering constraint when designing sensor and communications gear for marine deployment. Herein we illustrate this approach to predict MFC power output in two shallow water environments (the Gulf of Mexico and the Yellow Sea) during the summer and winter, and in the deep sea where seasonal temperature changes are not considered important.
Power density from shallow sediments was calculated by applying three equations sequentially:
Power density = 4.62 ln(TOC) + 13.8 (mW/m2 at 20 °C)
Power density = 0.65 * (°C) − 6.5 (mW/m2) (independent of TOC)
Power density = −0.89 * ln(cm2) + 15 (field probe was 2.6 cm2 graphite)
The Equation (1) first relate power density output to TOC as measured with a small graphite anode at 20 °C in the field, then (2) relate power density to in situ bottom temperatures, and (3) scale expected power density to a 1 m2 anode.
We illustrate this approach to predicting MFC performance in the Gulf of Mexico based on our measured performance curves and environmental data (Figure 3, Figure 4, Figure 5 and Figure 6). Figure 3 shows sediment TOC sample locations overlain on bathymetry off the south Texas coast. The bathymetry is from a high-resolution coastal relief model [16]. Locations of sediment samples are from the South Texas Outer Continental Shelf Project (STOCS) conducted by the University of Texas and the USGS with funding from BLM/NOAA. The USGS analyzed the geochemistry of sediment and suspended sediment, clay mineralogy, and physical properties from 264 samples collected from 26 October 1974 to 21 December 1974. The data are available online [17]. Figure 4 shows the interpolated TOC in surficial sediment as percent weight. Data were interpolated using Golden Graphics Surfer TM software using a kriging algorithm. Figure 5 shows bottom water temperatures taken from numerous XBT and CTD casts whose locations are shown as black dots. Bottom temperatures rise approximately 10 °C from February to August. Figure 6 shows the calculated power density with a 1 m2 anode. The power density varies spatially from approximately 1 to 10 mW/m2, and increases by about 1 to 2 mW/m2 from February to August, due to seasonal increases in water temperature.
We similarly predicted MFC performance in the Yellow Sea between China and South Korea (Figure 7, Figure 8, Figure 9 and Figure 10). Figure 7 shows the bathymetry in the Yellow Sea. Bottom depths were taken from ~10,000 CTD and XBT casts where bottom depth was noted. Data are available online from NOAA [18]. Figure 8 shows sediment TOC sample locations and their interpolated values. The TOC data are from the Naval Oceanographic Office (NAVOCEANO) unclassified collection and available upon request. The data are sparser than in the Texas example, so only broad interpolated contours are assumed. Figure 9 shows bottom temperatures in February and August, derived from the NOAA CTD and XBT casts. Nearshore temperatures are again seen to increase approximately 10 °C from February to August. Figure 10 shows the estimated power density from a 1 m2 anode, varying from approximately 1 to 8 mW/m2. Power density again increases about 1 to 2 mW/m2 in the summer when the water warms.

3.2. Deep Water Predictions (≥1000 m)

Sediment microbial fuel cell performance in deep sediments was measured in laboratory experiments. Deep (≥1000 m) sediment samples collected by Michael Landry at Scripps Institution of Oceanography, and personnel at SPAWAR were implanted with microbial fuel cells in a laboratory temperature bath. Samples were collected from 1000 m, 1188 m, 1228 m, and 2002 m in the Southern California Bight between San Diego and Santa Barbara, CA in 2014 (Figure 11). Over a period of approximately 18 months, triplicate fuel cells, composed of small carbon cloth anodes and a large common carbon cloth cathode, were immersed in bubbled seawater at temperatures from −1 °C to 12 °C. Total organic carbon, the nominative electron supplier to the anaerobic bacteria living in the sediment and the providers of the microbial fuel cell power, ranged from 1% by weight in the 1228 m samples, 2.1% in the 2002 m samples, and 3.6% in the 1000 m and 1188 m samples.
MFC performance results from the deep sediment experiments are shown in Figure 12 and Figure 13. Figure 12 (previously presented in [19]) shows the effect of temperature and TOC on power density from the deep sediments, measured in the laboratory at atmospheric pressure. Figure 13 compares power density from the deep-water sediments at 5 °C to that from shallow water samples which were scaled to expected values at 5 °C. The linear scaling is:
Power density at 5 °C = power density at temp C − 0.65 * (temp C − 5)
where temp C is the sediment temperature when power density was measured. This is the linear power density to temperature relationship shown in Figure 1 (right panel). The extrapolation to 5 °C causes some San Diego Bay power density predictions (blue dots and line) to be near zero or negative. These extrapolations were not used to create the shallow water power density estimates, but rather, only for comparison to power output from deeper sediments at the same temperature.
Earlier SPAWAR laboratory data showed that pressure (or lack thereof) did not appear to have much of an effect on power output from MFCs in deep water sediments [20]. Figure 14 (previously published in [20]) shows relatively short-term (~1 month) MFC experiments on sediment collected at 1000 m directly west off the coast of San Diego, conducted in a pressure vessel with flowing oxygenated seawater. The sediment was not kept pressurized during retrieval from the bottom. This experiment was conducted at ambient laboratory temperature conditions in 2013. The power output shows daily fluctuations, most likely in response to changing room temperatures. These data and similar experiments suggest that pressure is not a significant determinant in MFC power output, particularly in light of the experimental difficulties imposed (see also [21]). An MFC deployed in situ at 1000 m near where the sediment was retrieved for the laboratory pressure experiment yielded power densities of only 0.5 mW/m2. The MFC was deployed for the month of July 2013 in sediment with 3% TOC at a temperature of 8 °C (see fig. 6 in [20]).
Figure 15 emphasizes the relatively flat response of the power density to temperature in deep sediments as compared to shallow water sediments. Laboratory experiments were performed by slowly raising and lowering the temperature bath in 1 °C increments over a test period of 18 months. Temperatures were held at constant levels for at least one week. The percent TOC of sediment samples varied, as indicated in the legend. The linear fit equations for each sample are indicated on the figure. The linear fit for MFC output as a function of temperature from 5 m sediments is similar to the expected response [22]. The flat response from the deeper sediments was not expected.
Finally, we extrapolate these MFC performance data from our deep sediment samples to global TOC and temperature data to make worldwide performance predictions. TOC data used are by Seiter et al. [23] (Figure 16), and interpolated based on deep water measurements, as well as predictions based on primary production, river input, and water depth. Bottom temperature was assumed to be a constant 2 °C. Power density from deep sediments was calculated by applying two equations sequentially to the map of global TOC (Figure 16):
Power density = 158.86 * (TOC) + 119.13 (µW/m2 at 2 °C) (linear fit on Figure 13)
Power density= −0.89 * ln(cm2) + 15 (field probe was 24 cm2 carbon cloth)
Figure 17 (previously published in [19]) shows the expected power density from deep sediments from an MFC with 1 m2 anode. Note the change in units (µW/m2 for deep water sediments versus mW/m2 for shallow water sediments). Power density from deep water sediments is approximately 10% of that expected from shallow water sediments.

4. Discussion

The limited number of deep-water samples tested in the laboratory for MFC power is not a solid basis from which to make worldwide predictions. Rather, this exercise provides a simple prediction framework that makes use of rich online data sets that we believe are pertinent to MFC performance. These observations yield predictions of MFC power in the deep sea as being typically an order of magnitude lower than that from shallow water [19]. The low power output and lack of temperature response from anode microbes in deeper sediments (Figure 15) came as a surprise, particularly when we saw a diurnal temperature signal from 1000 m sediment (Figure 14). However, this finding is corroborated with in situ measurements which, over one month duration, yielded a low 0.5 mW/m2 from sediments at 1000 m off San Diego (3% TOC) [20] and no power output from sediments at 4000 m in the Puerto Rico Trench (0.6% TOC) (unpublished data). These in situ tests employed triplicate graphite tubes as anodes. Possible laboratory test conditions (i.e., lack of a large renewable pool of organic matter, lack of tidal pumping of pore water) during measurements of power as a function of temperature did not appreciably impact power output from MFCs in shallow water sediments, and are similarly assumed to not impact measurements in deep sediments. Conducting tests on deeper water sediments at surface pressure rather than in situ conditions is also assumed to not negatively impact power output (Figure 14). We offer a few possible explanations of the low power output:
(1)
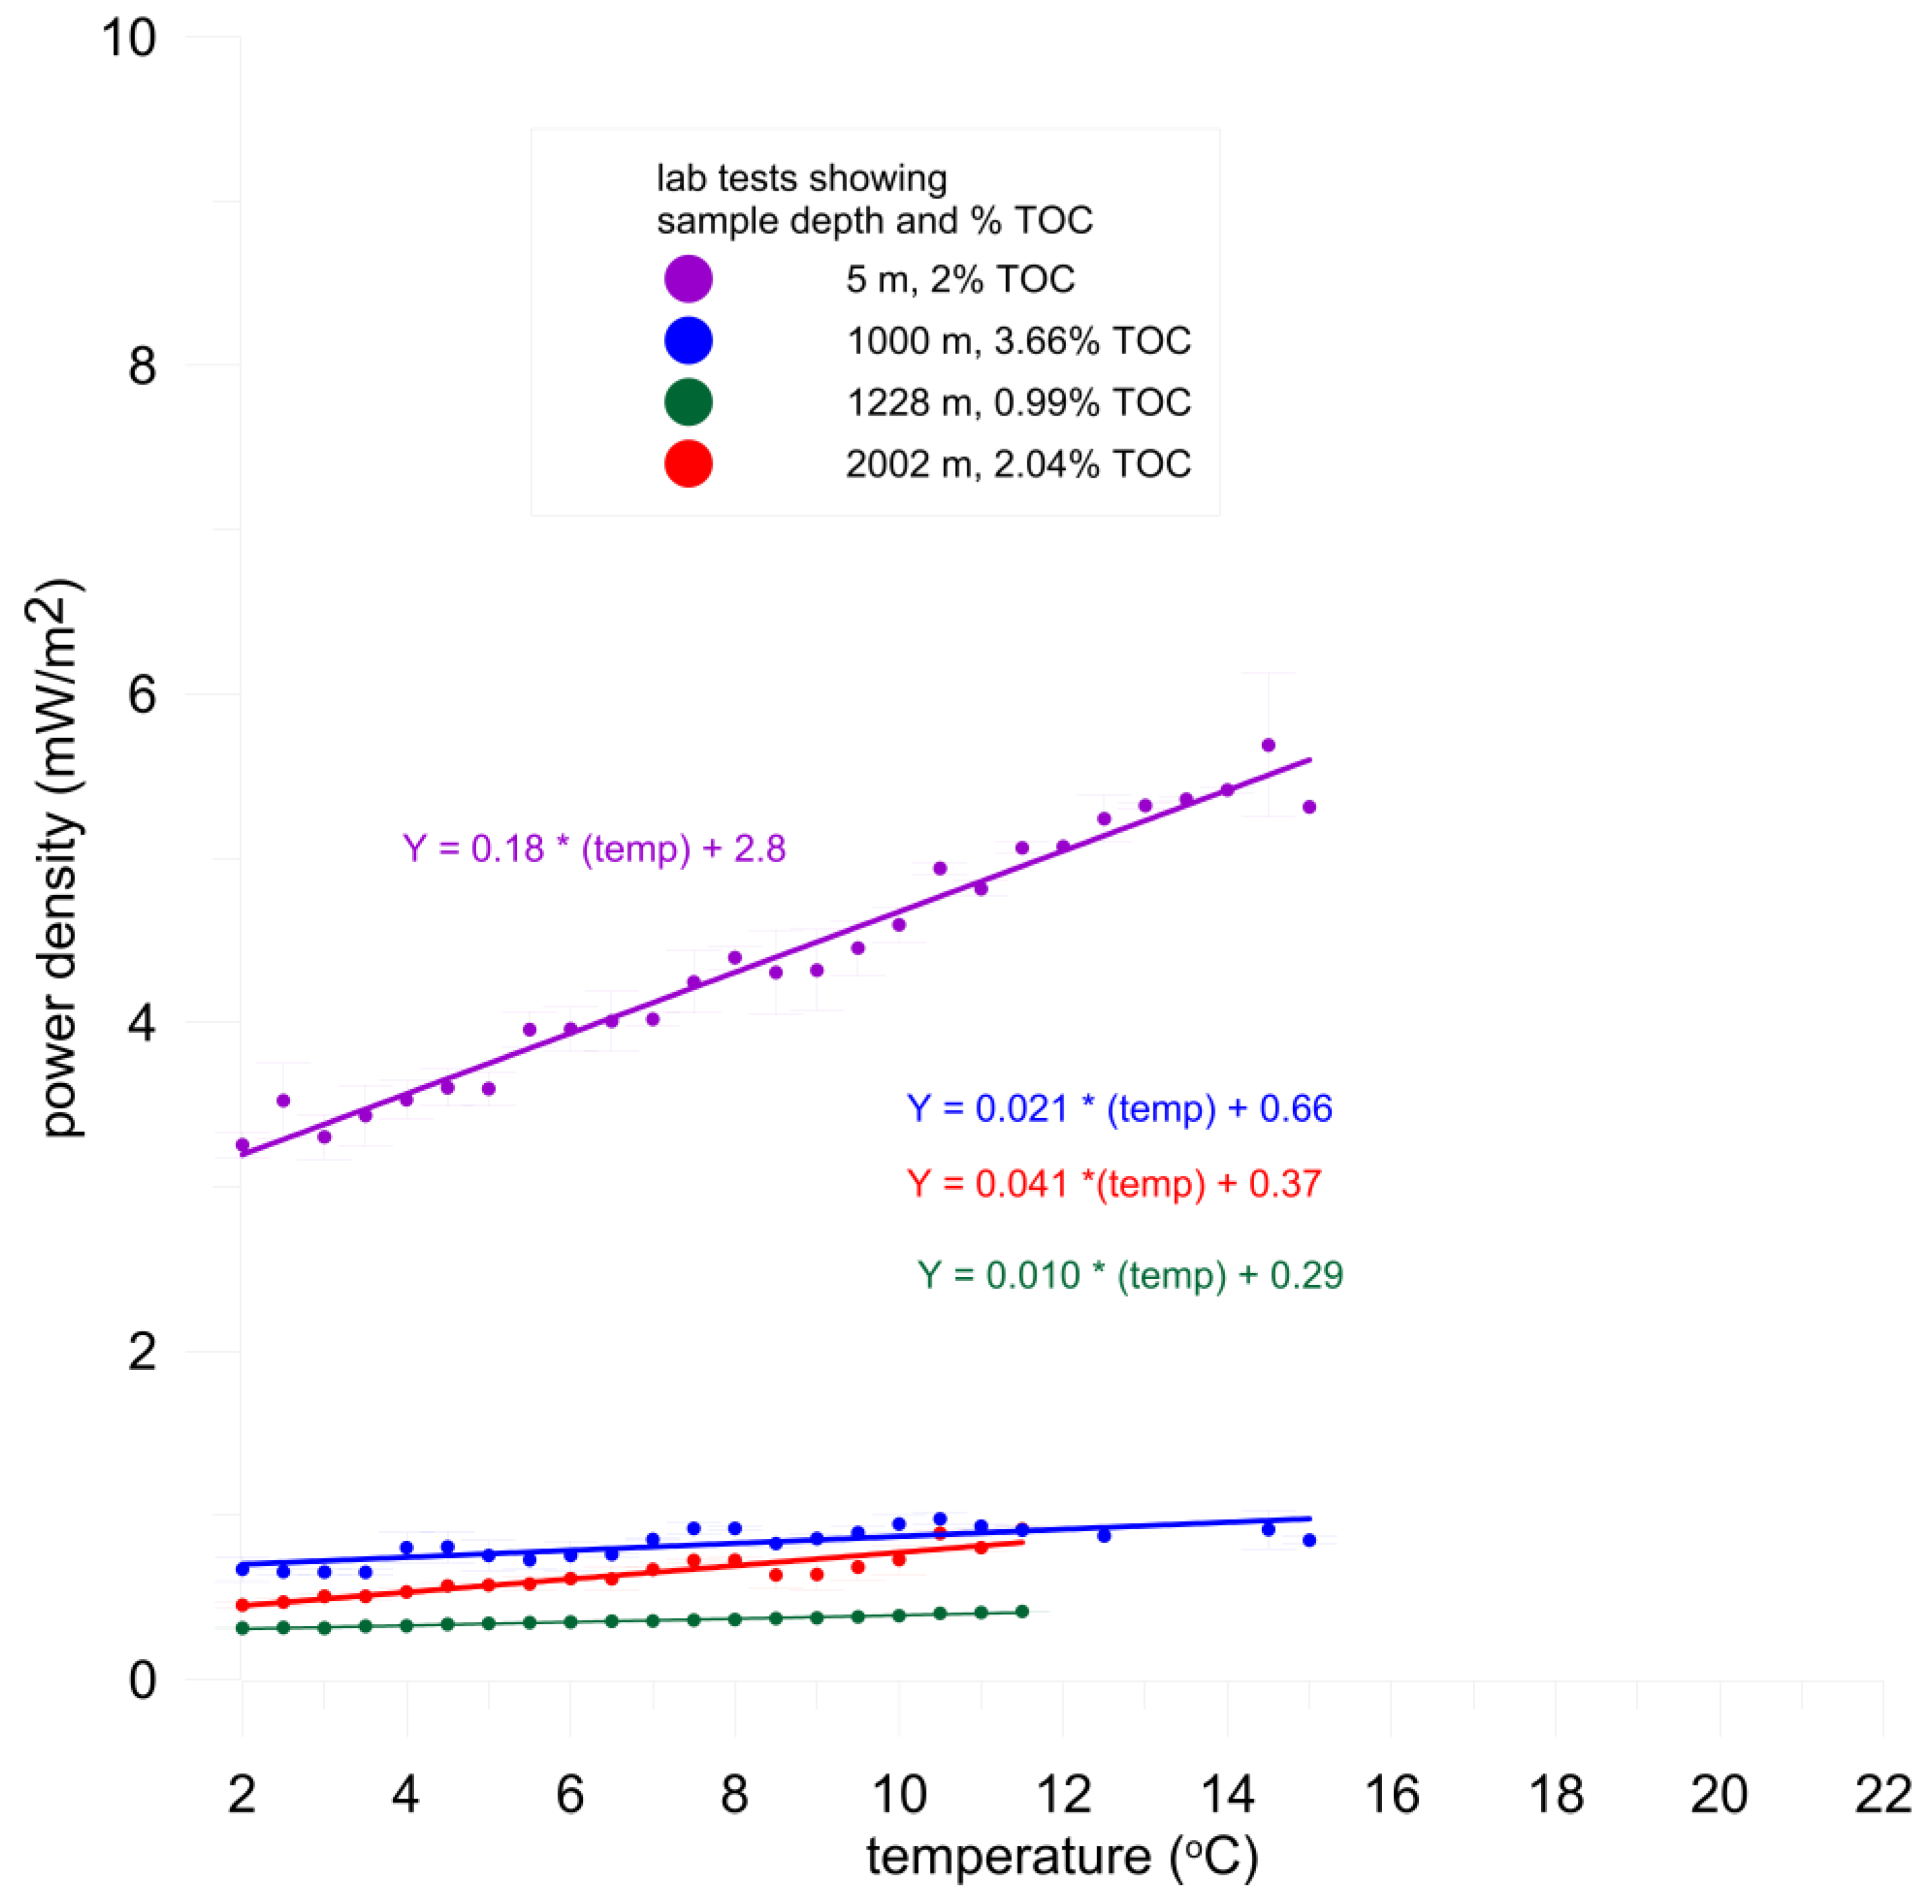
It could be due to lack of Geobacter-like electrogenic bacteria at deeper depths, hinted at by the unexpected temperature response from the deeper sediment tests. While Geobacter is widely distributed in marine sediments, we did not test for its presence in our samples.
(2)
It could be due to finer sediment particle size in deeper sediments. Finer particle size results in less permeability and reduced pore water circulation [24]. Since microbial metabolism at the anode is partially limited by the advection and diffusion of organic material in the pore water, reduced permeability would negatively impact MFC power output. Coarse analysis of grain size in the sediment samples revealed that the shallow sediments from 5 m depth had percent fines (percent of clay plus silt by weight) of ~45% while percent fines of sediments from >1000 m depth ranged from 80% to 100% (unpublished data).
(3)
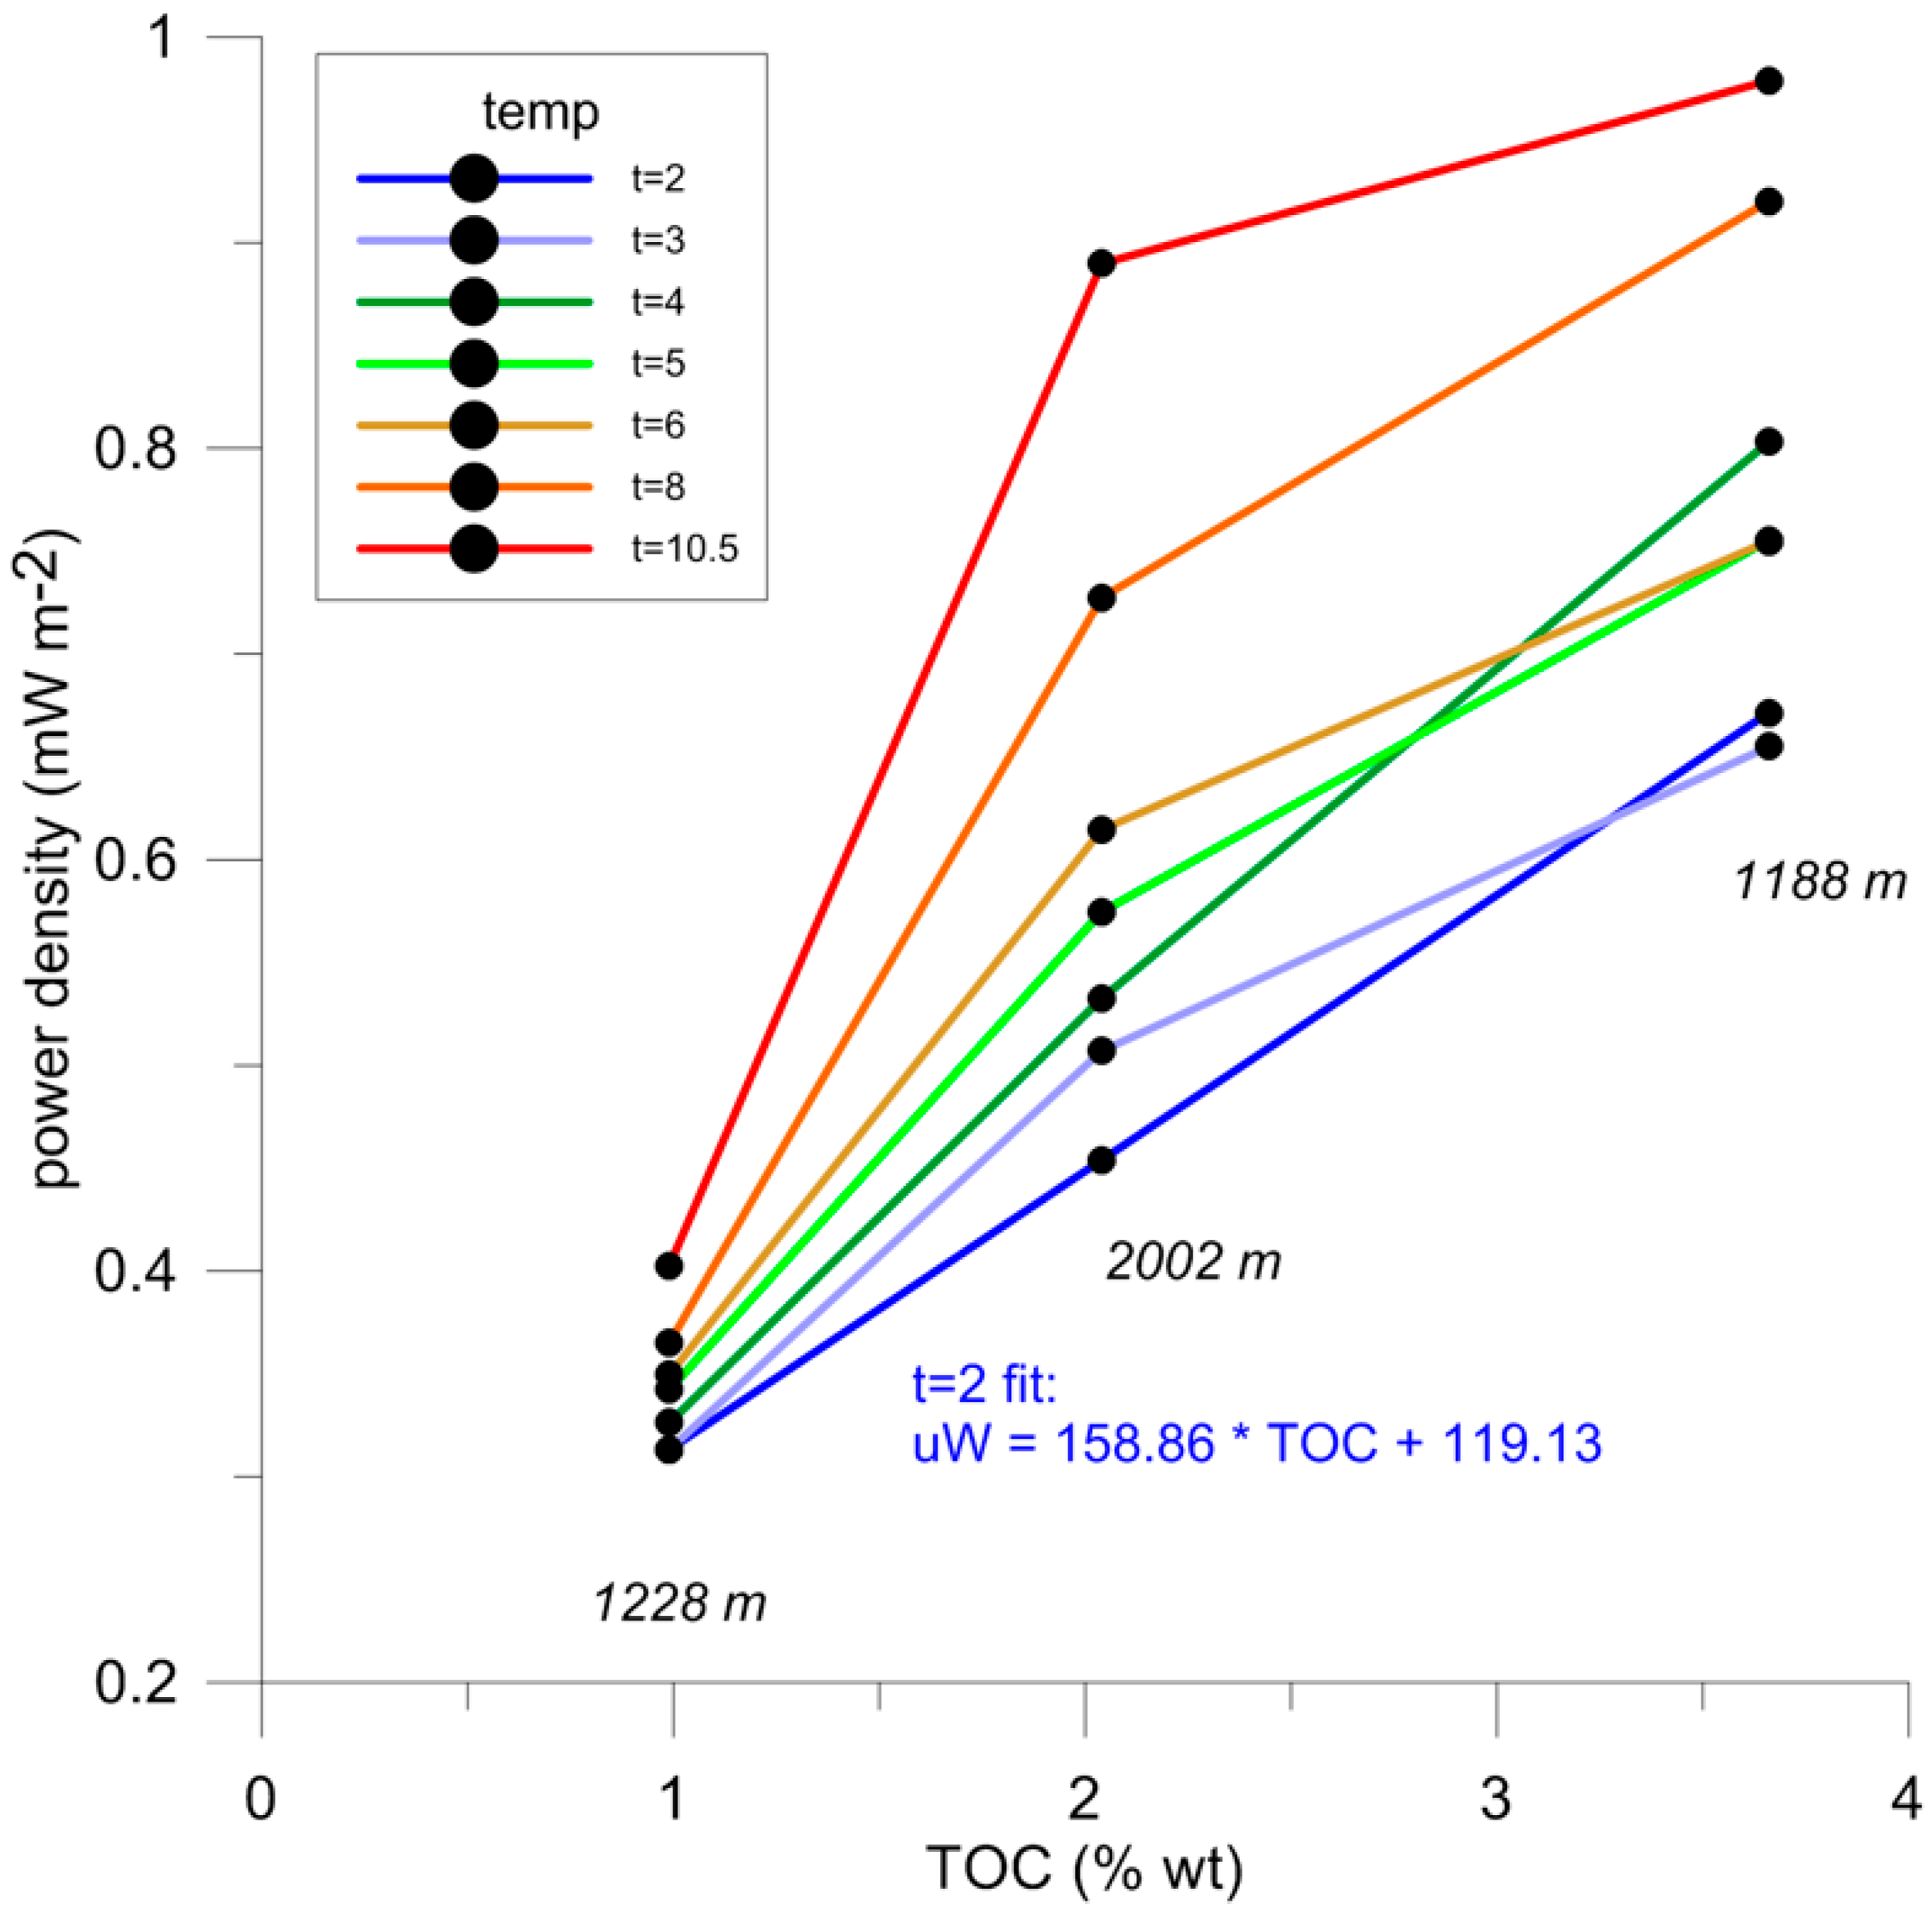
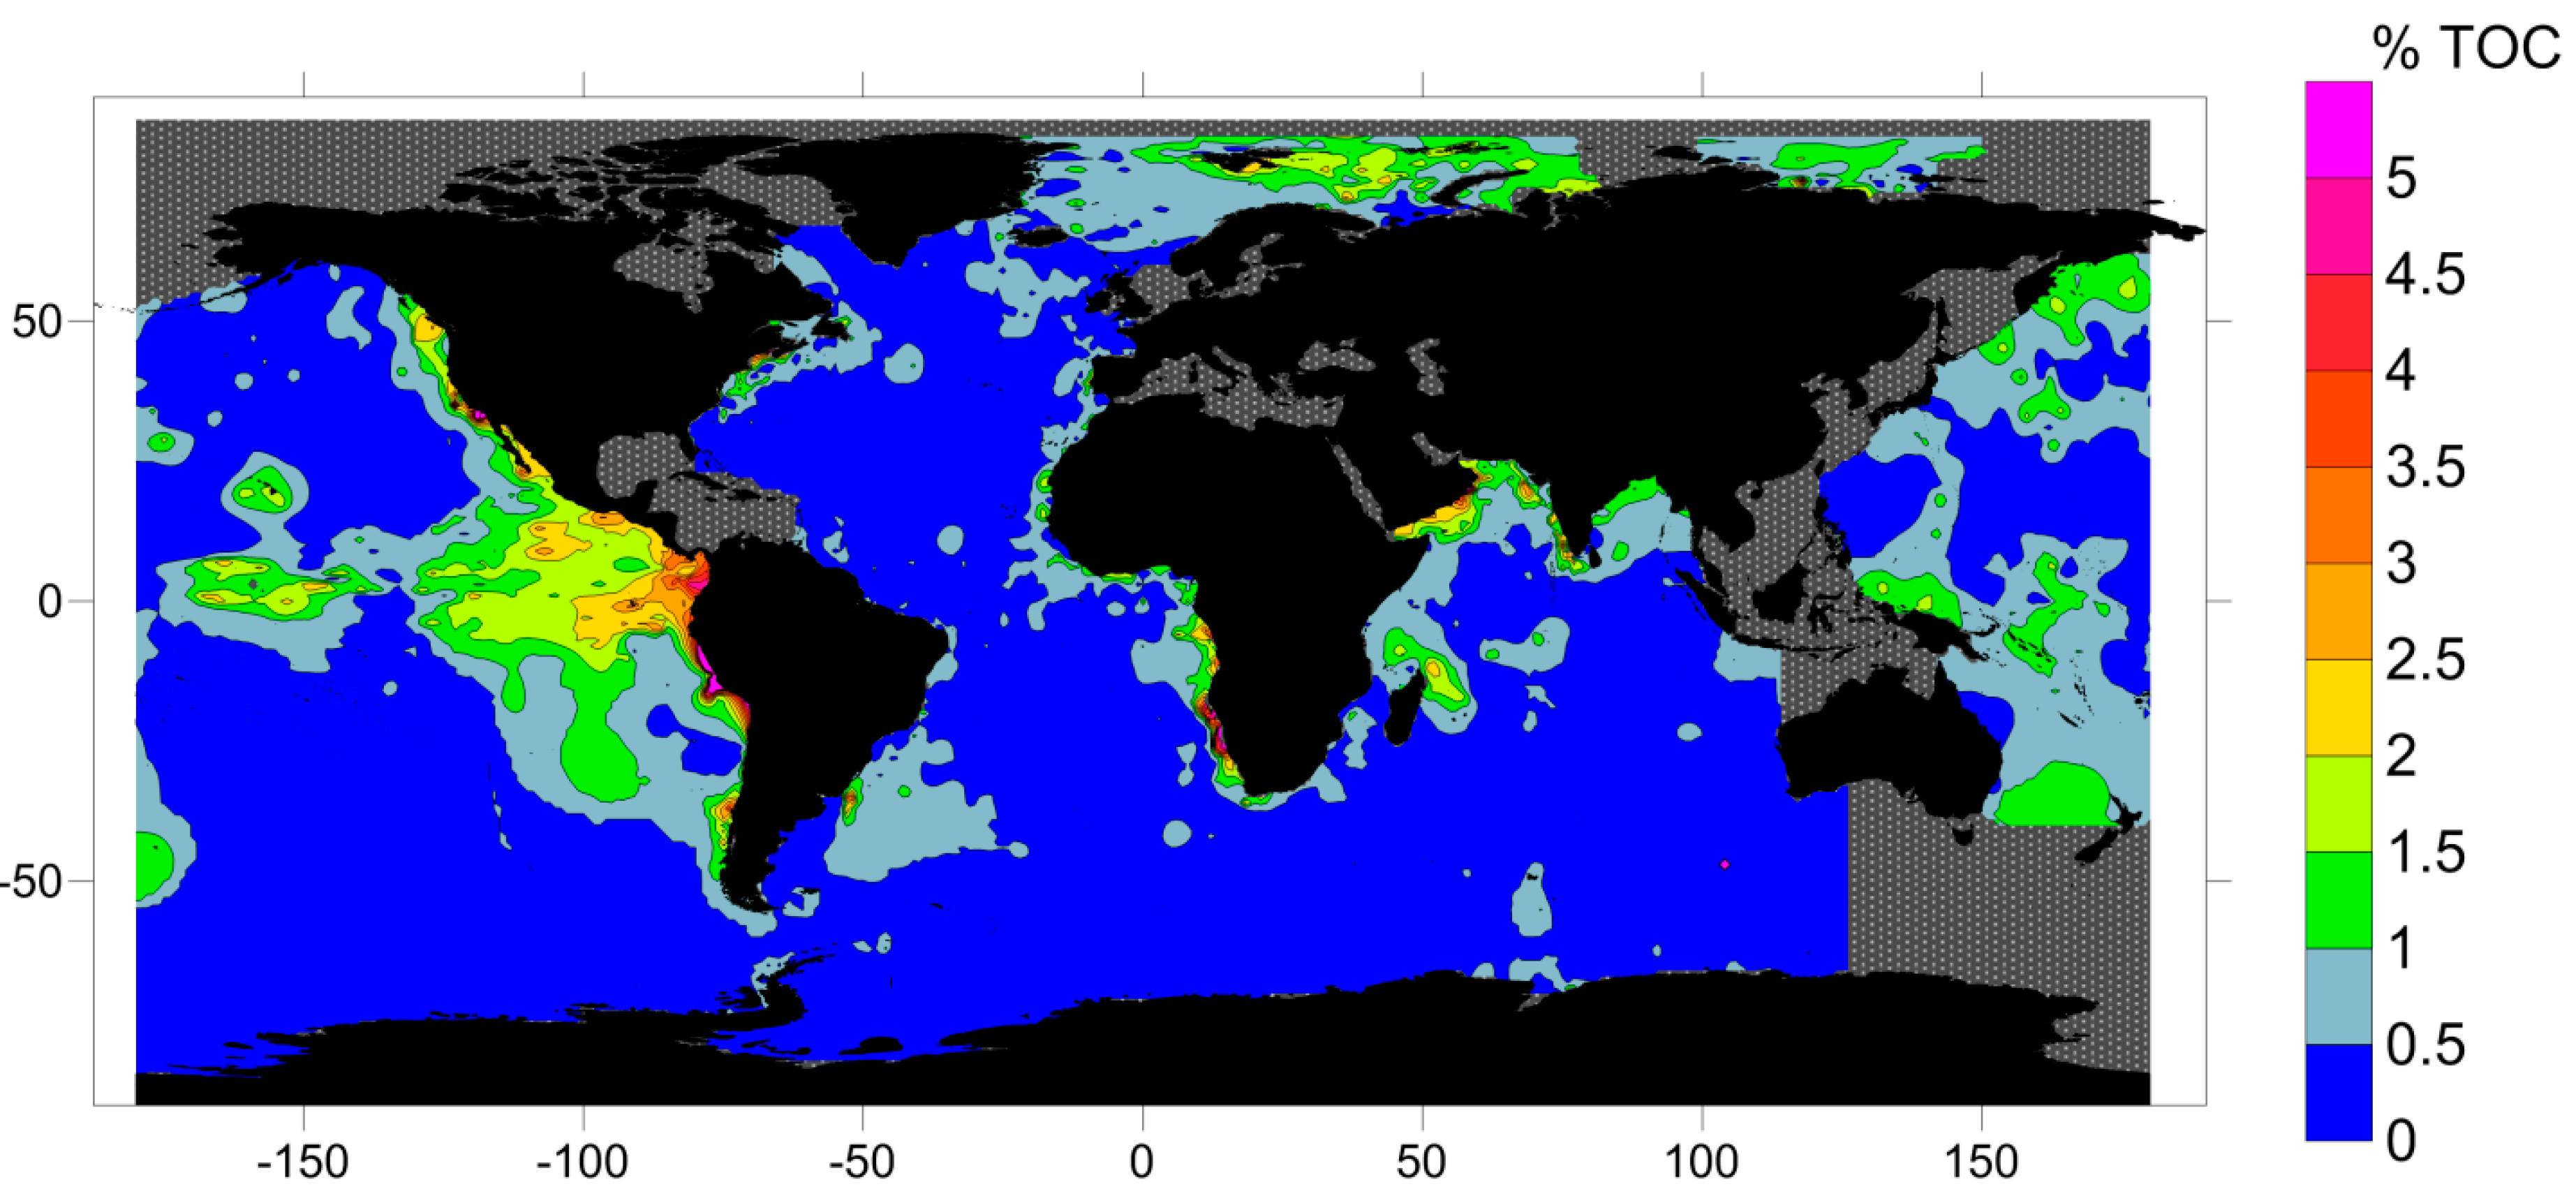
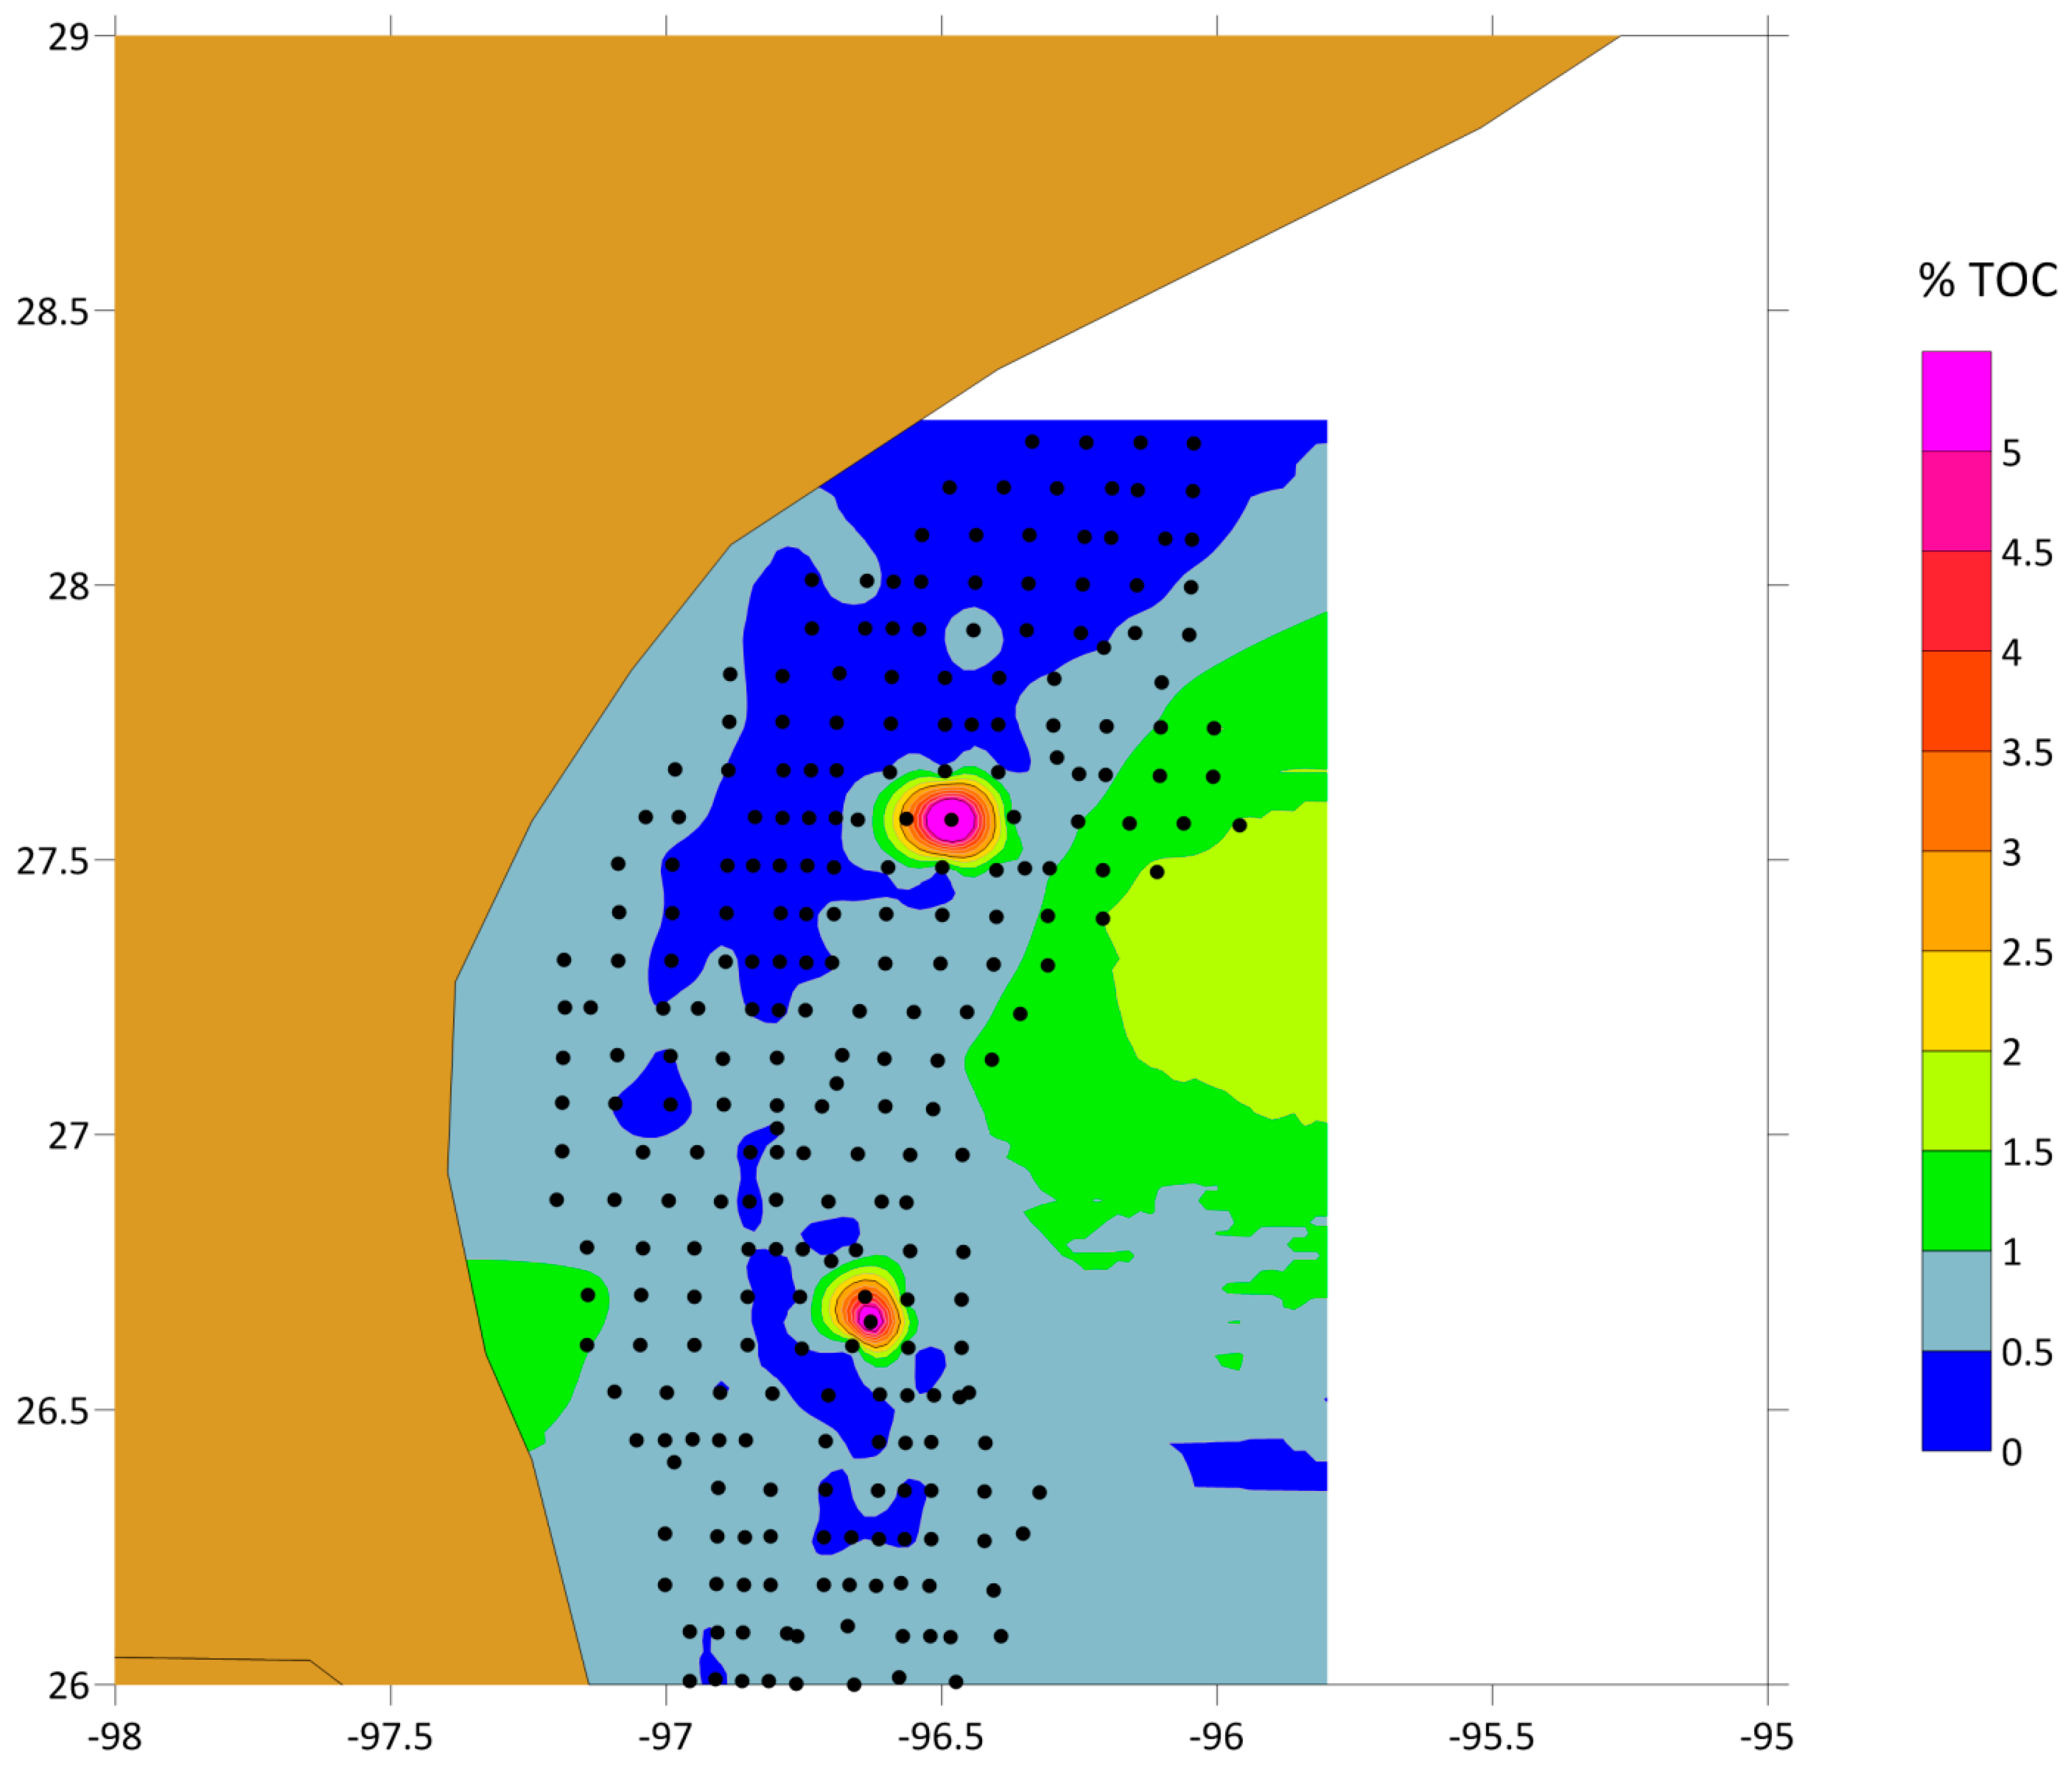
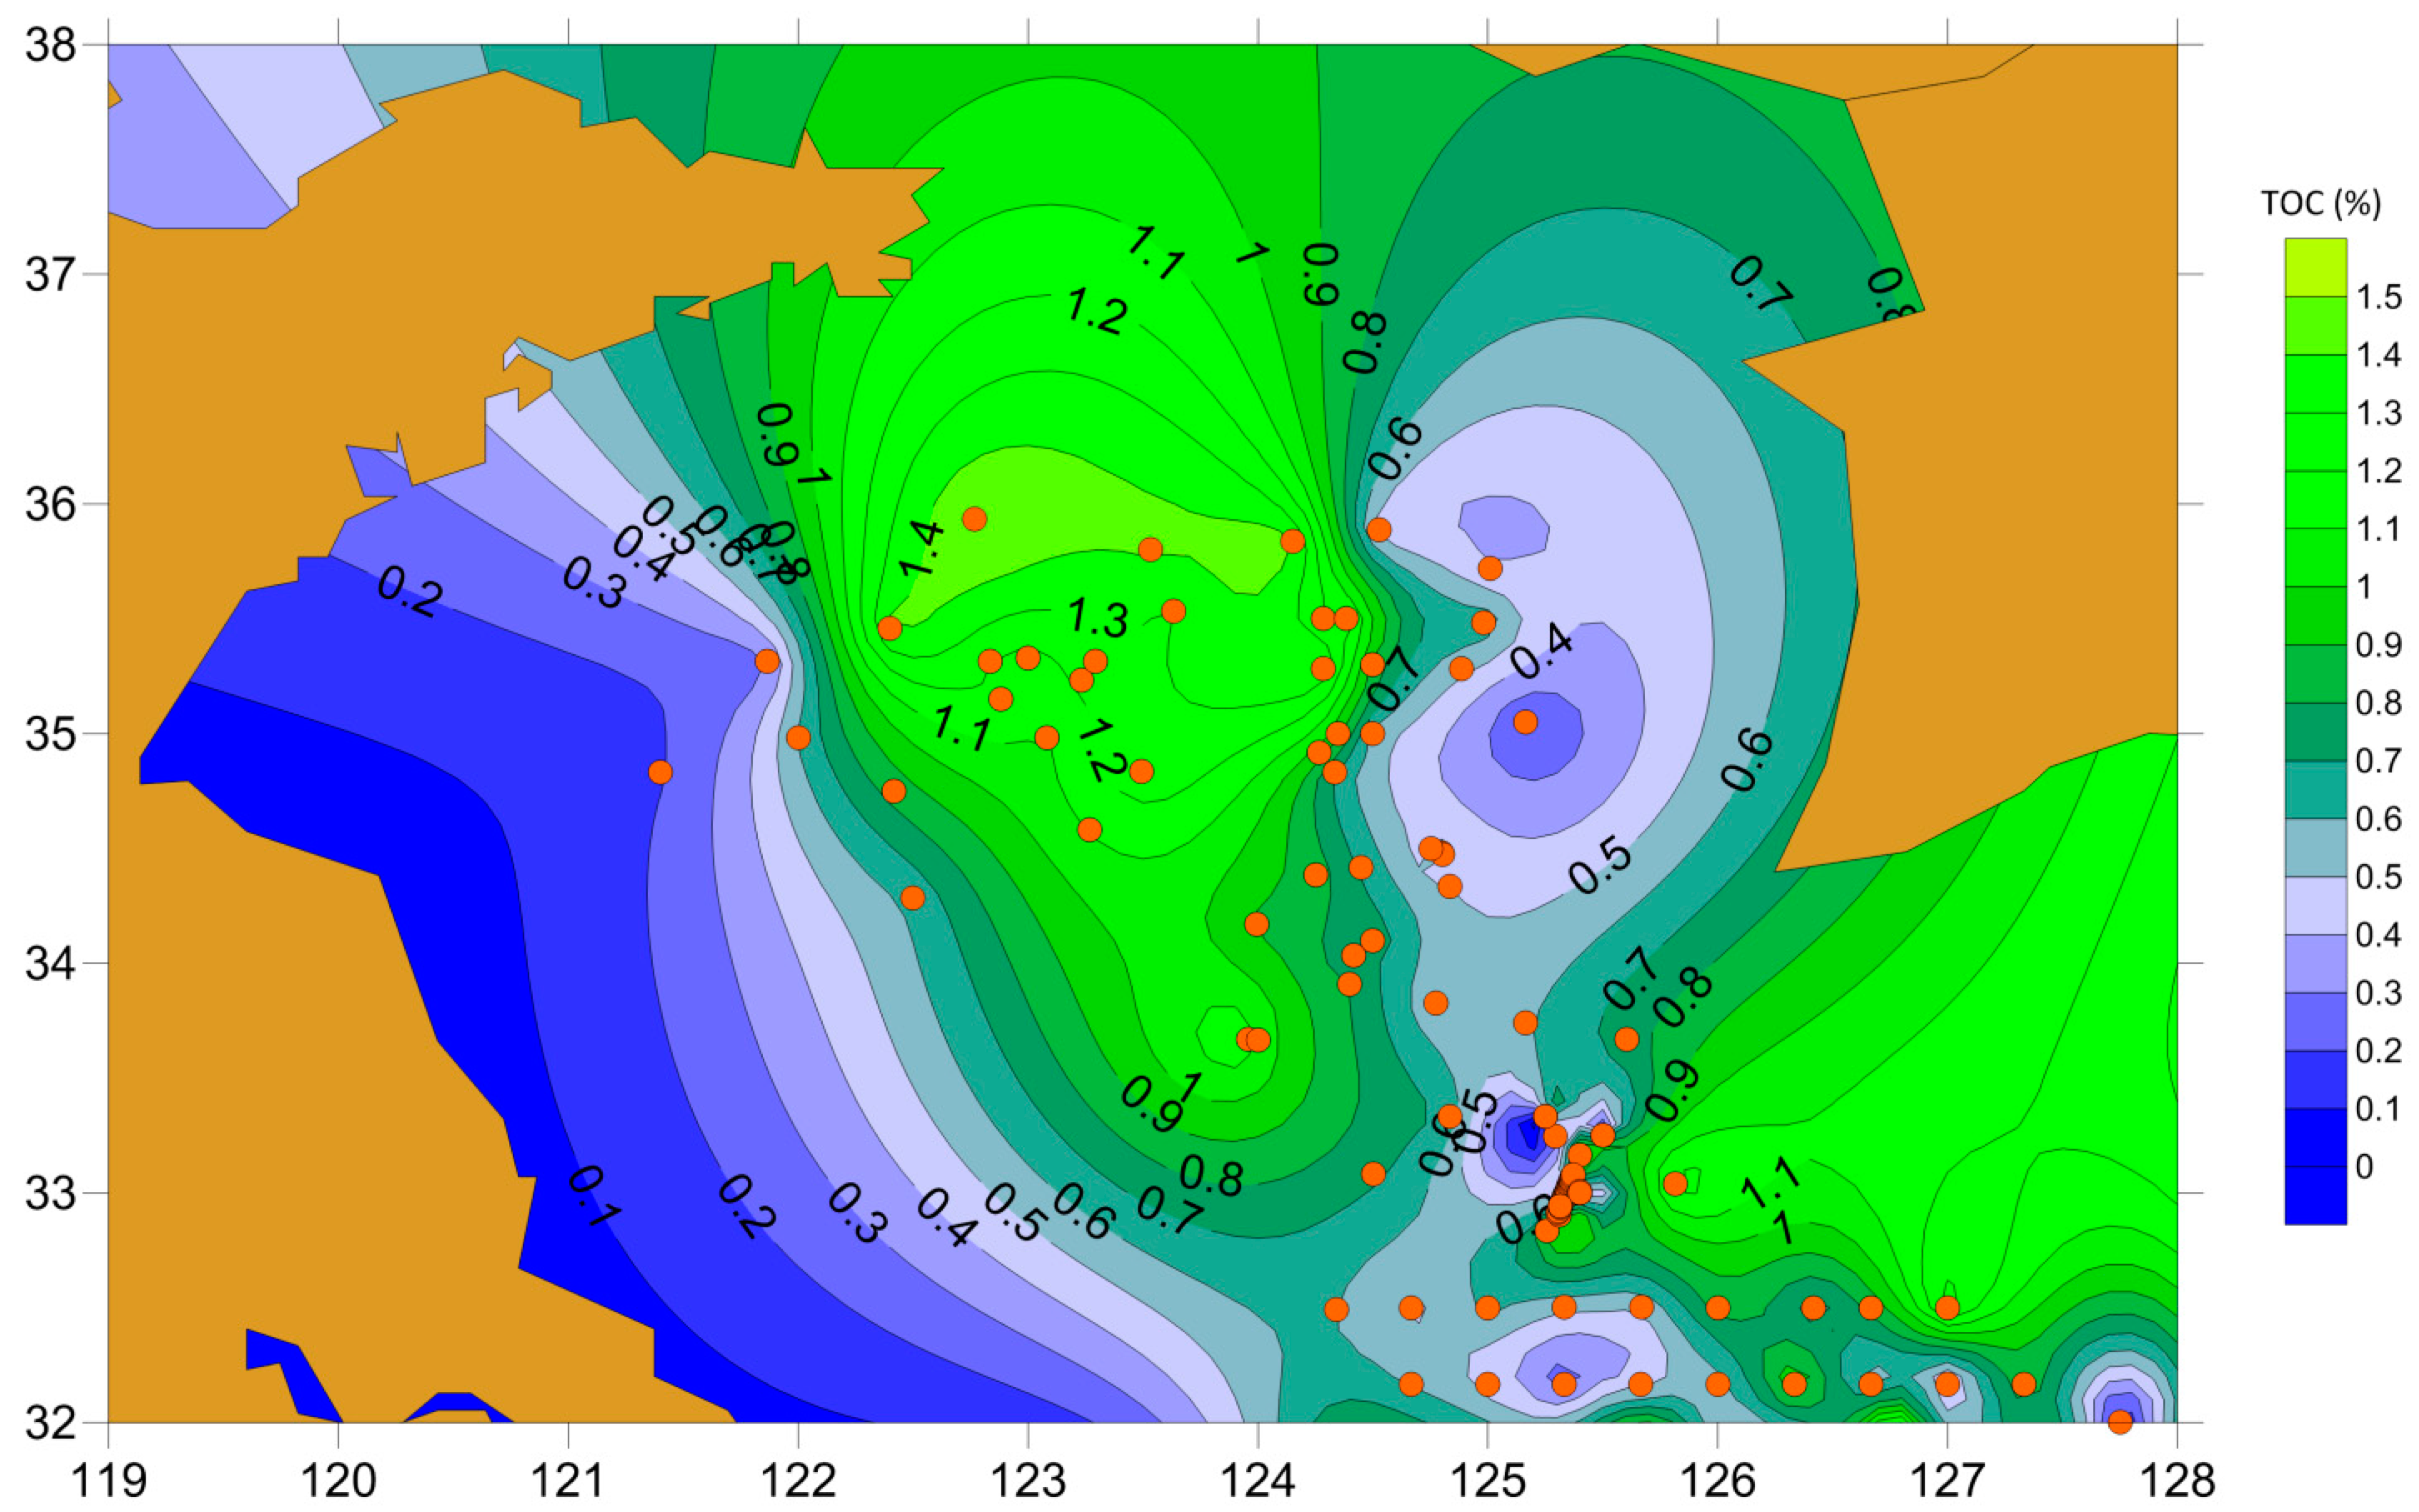
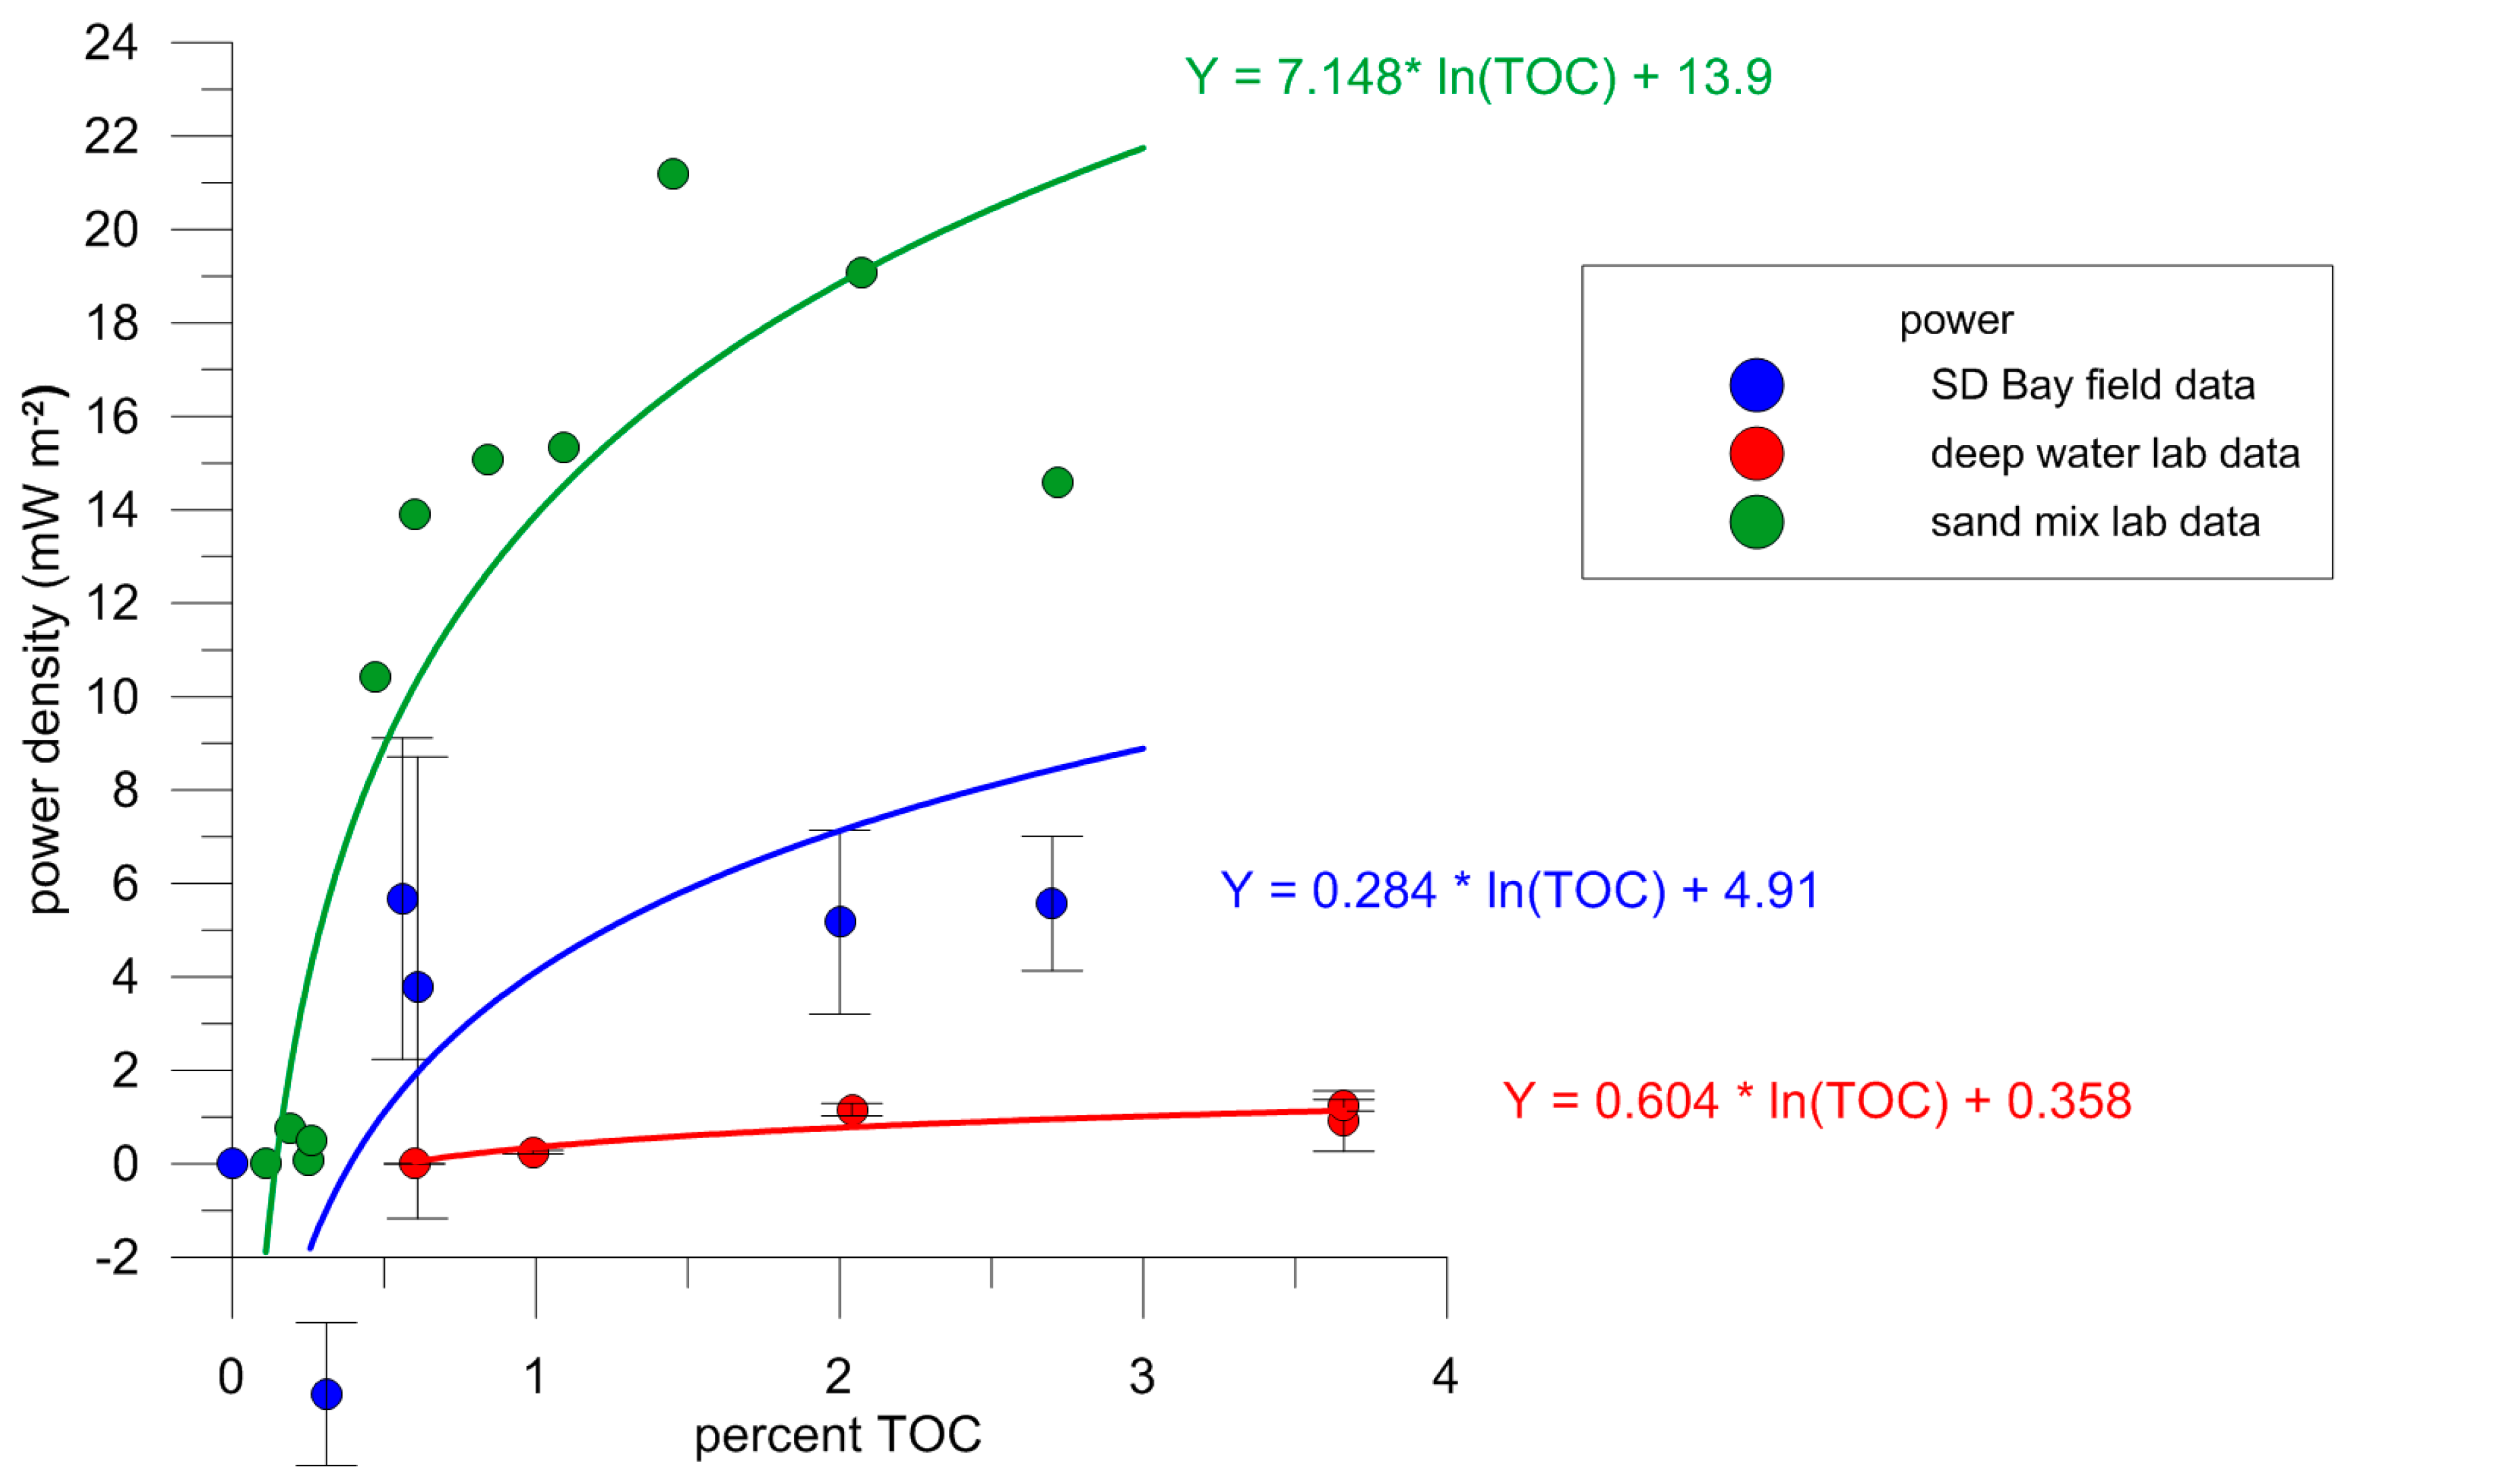
It could be due to a relative lack of labile material at depth. Global benthic bacteria biomass has been found to be proportional to TOC sediment concentrations, and sediment concentrations are generally inversely proportional to water depth and distance from land [24]. Small organic particles (e.g., dead plankton) sink slowly and are subject to bacterial attack. The labile fraction of total organic matter reaching the bottom in the Mediterranean Sea decreased with depth [25]. The benthic bacterial population density in Mediterranean sediments was correlated with carbohydrate (labile TOC) concentrations at depths from 100 m to 2400 m.
The internal resistance of large carbon cloth anodes presents some design challenges if one were to try to compensate low power density with larger anode surfaces. Going from a 1 m2 anode, as modelled above, to a 5 m2 would drop power density by approximately 21% from Equation (3) above. We are currently working on self-unfurling microbial fuel cells that will lay on top of the sediment. The carbon cloth anode is attached to the bottom of a large rubber mat and is directly exposed to the sediment. The larger rubber mat (relative to the anode) allows anaerobic conditions to quickly develop and acts as a structure to secure electronics and sensors, and as an anchor for a buoyant cathode sail. The self-deploying nature of a surface MFC allows us to dodge the difficulties of a diver-assisted or motorized anode burial, particularly in deeper water. Our largest deployments have been approximately 2.5 m2 for the anode, consisting of four separate carbon sheets attached to a single unrolling strip of rubber mat in shallow water outside of our laboratory (unpublished data). The separate, electrically-isolated anodes feed current to a common cathode with acceptable power densities (initially > 20 mW m−2). We hope that this evolving design will improve the possibilities of MFCs to power underwater sensors.

5. Conclusions

We offer the following conclusions from this work:
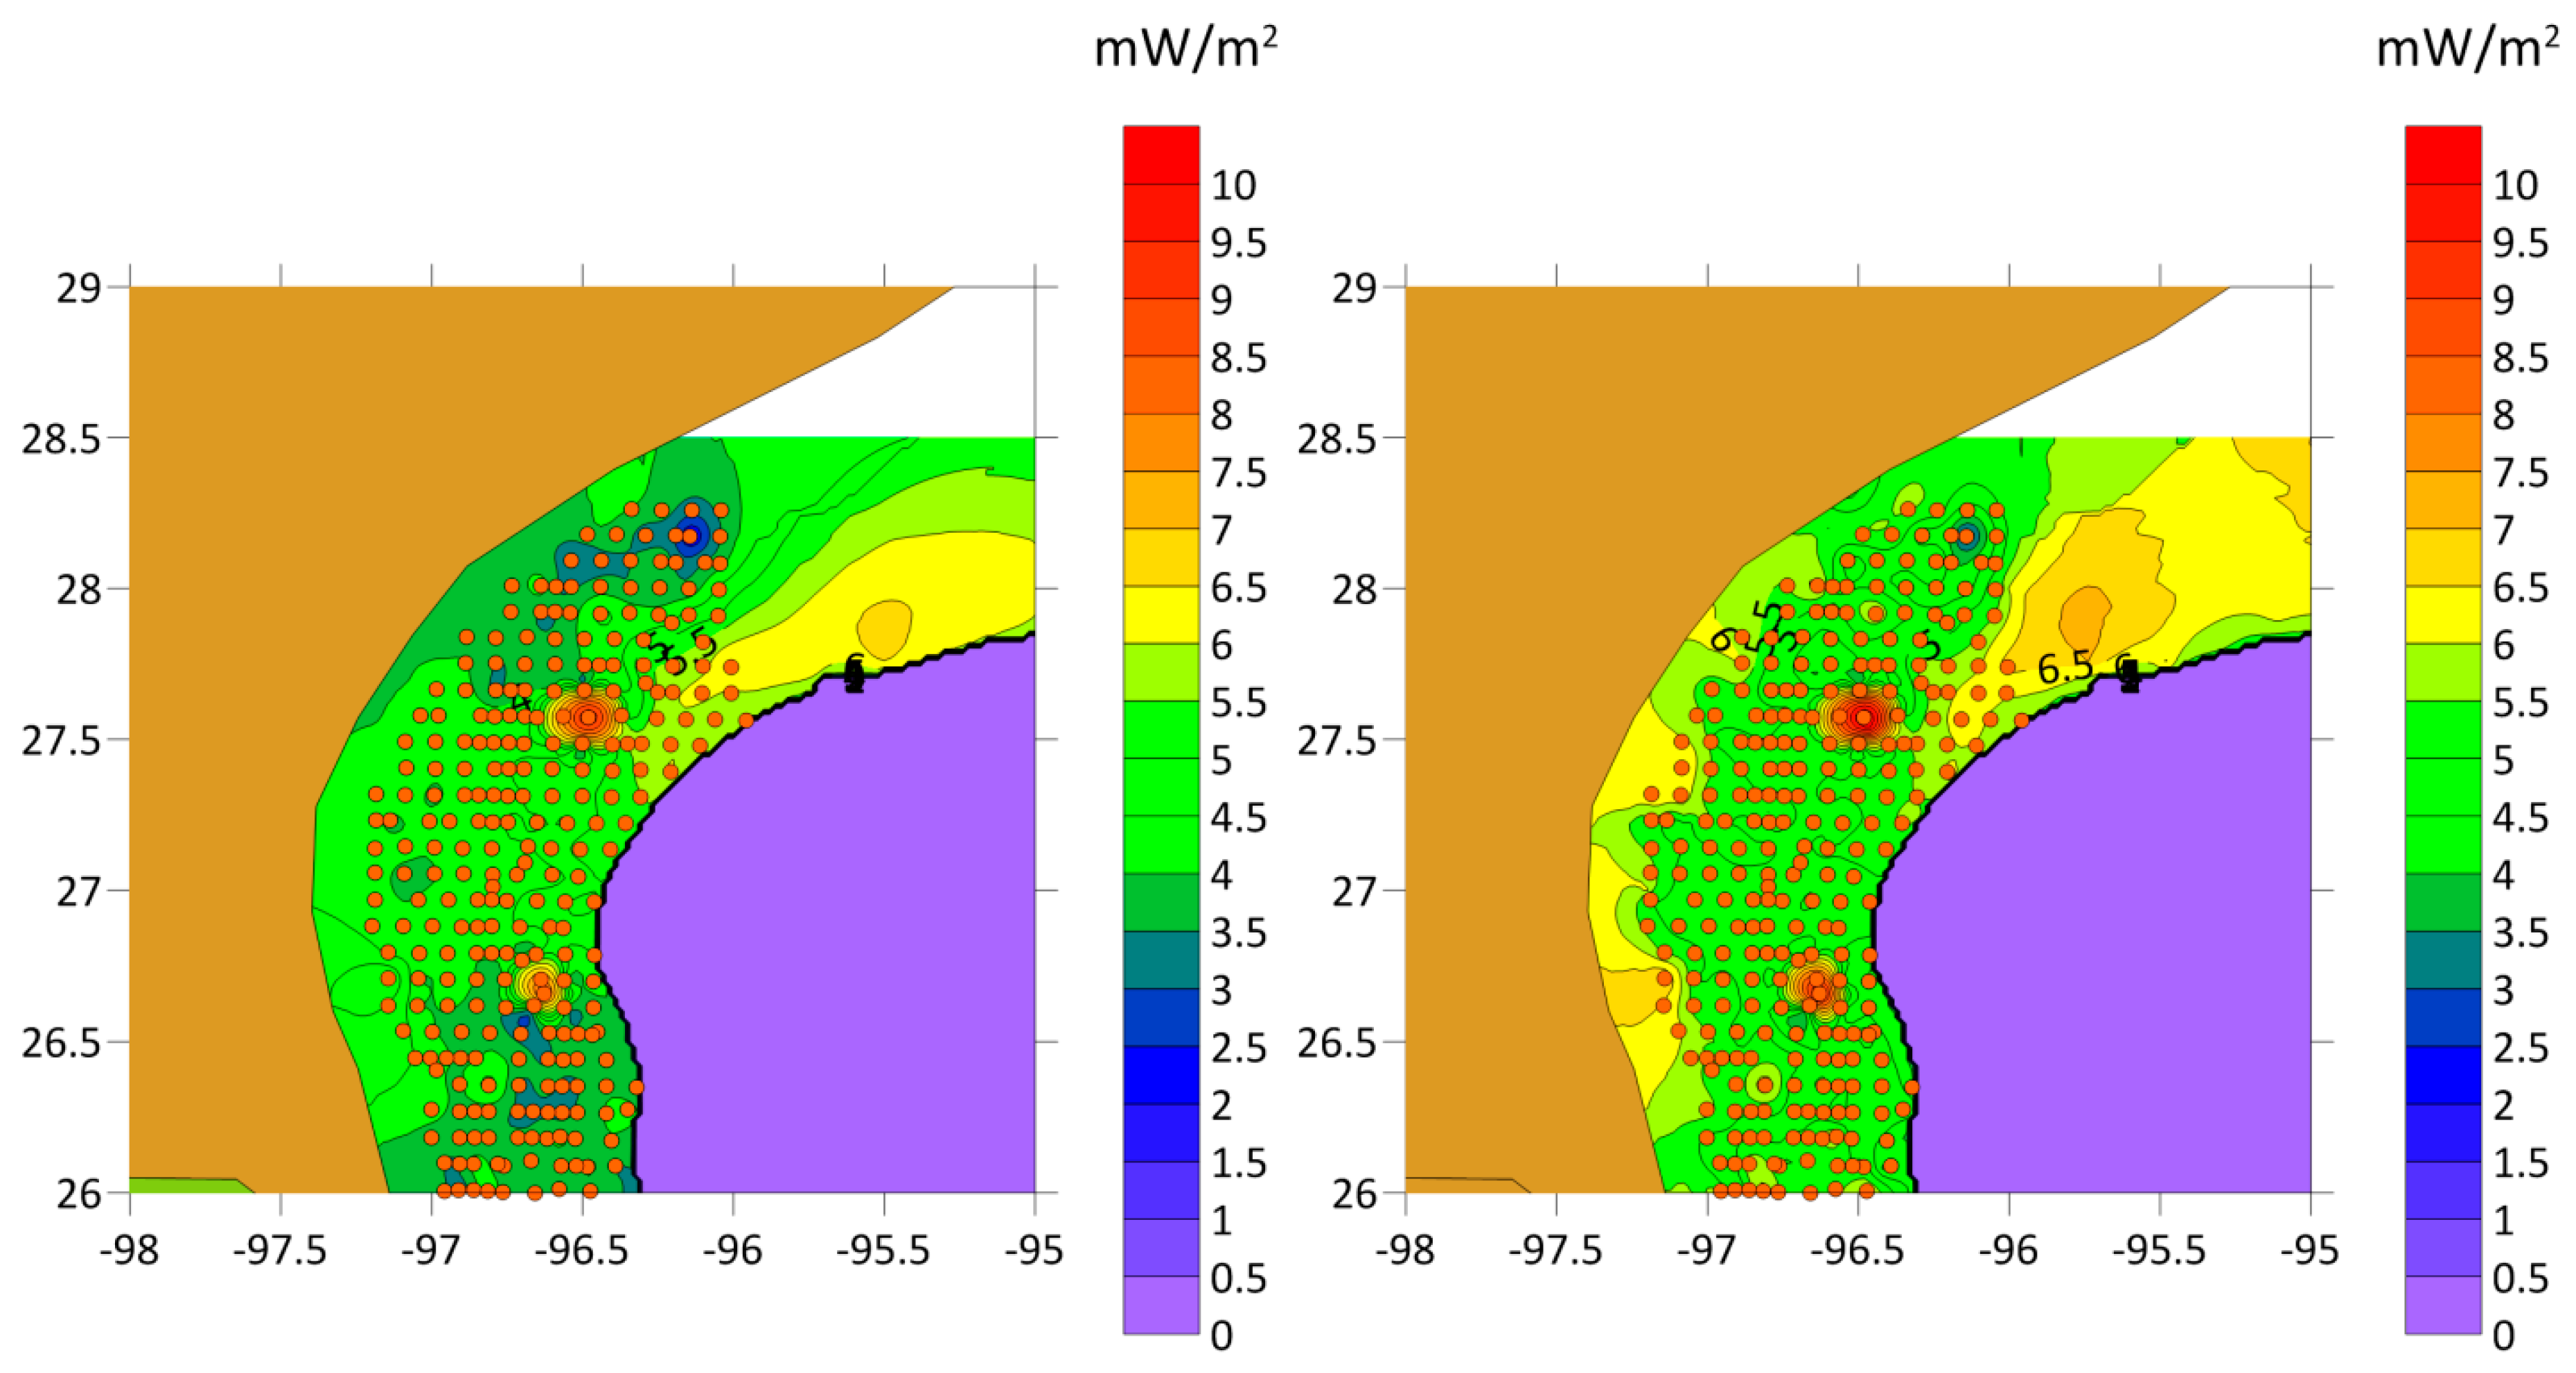
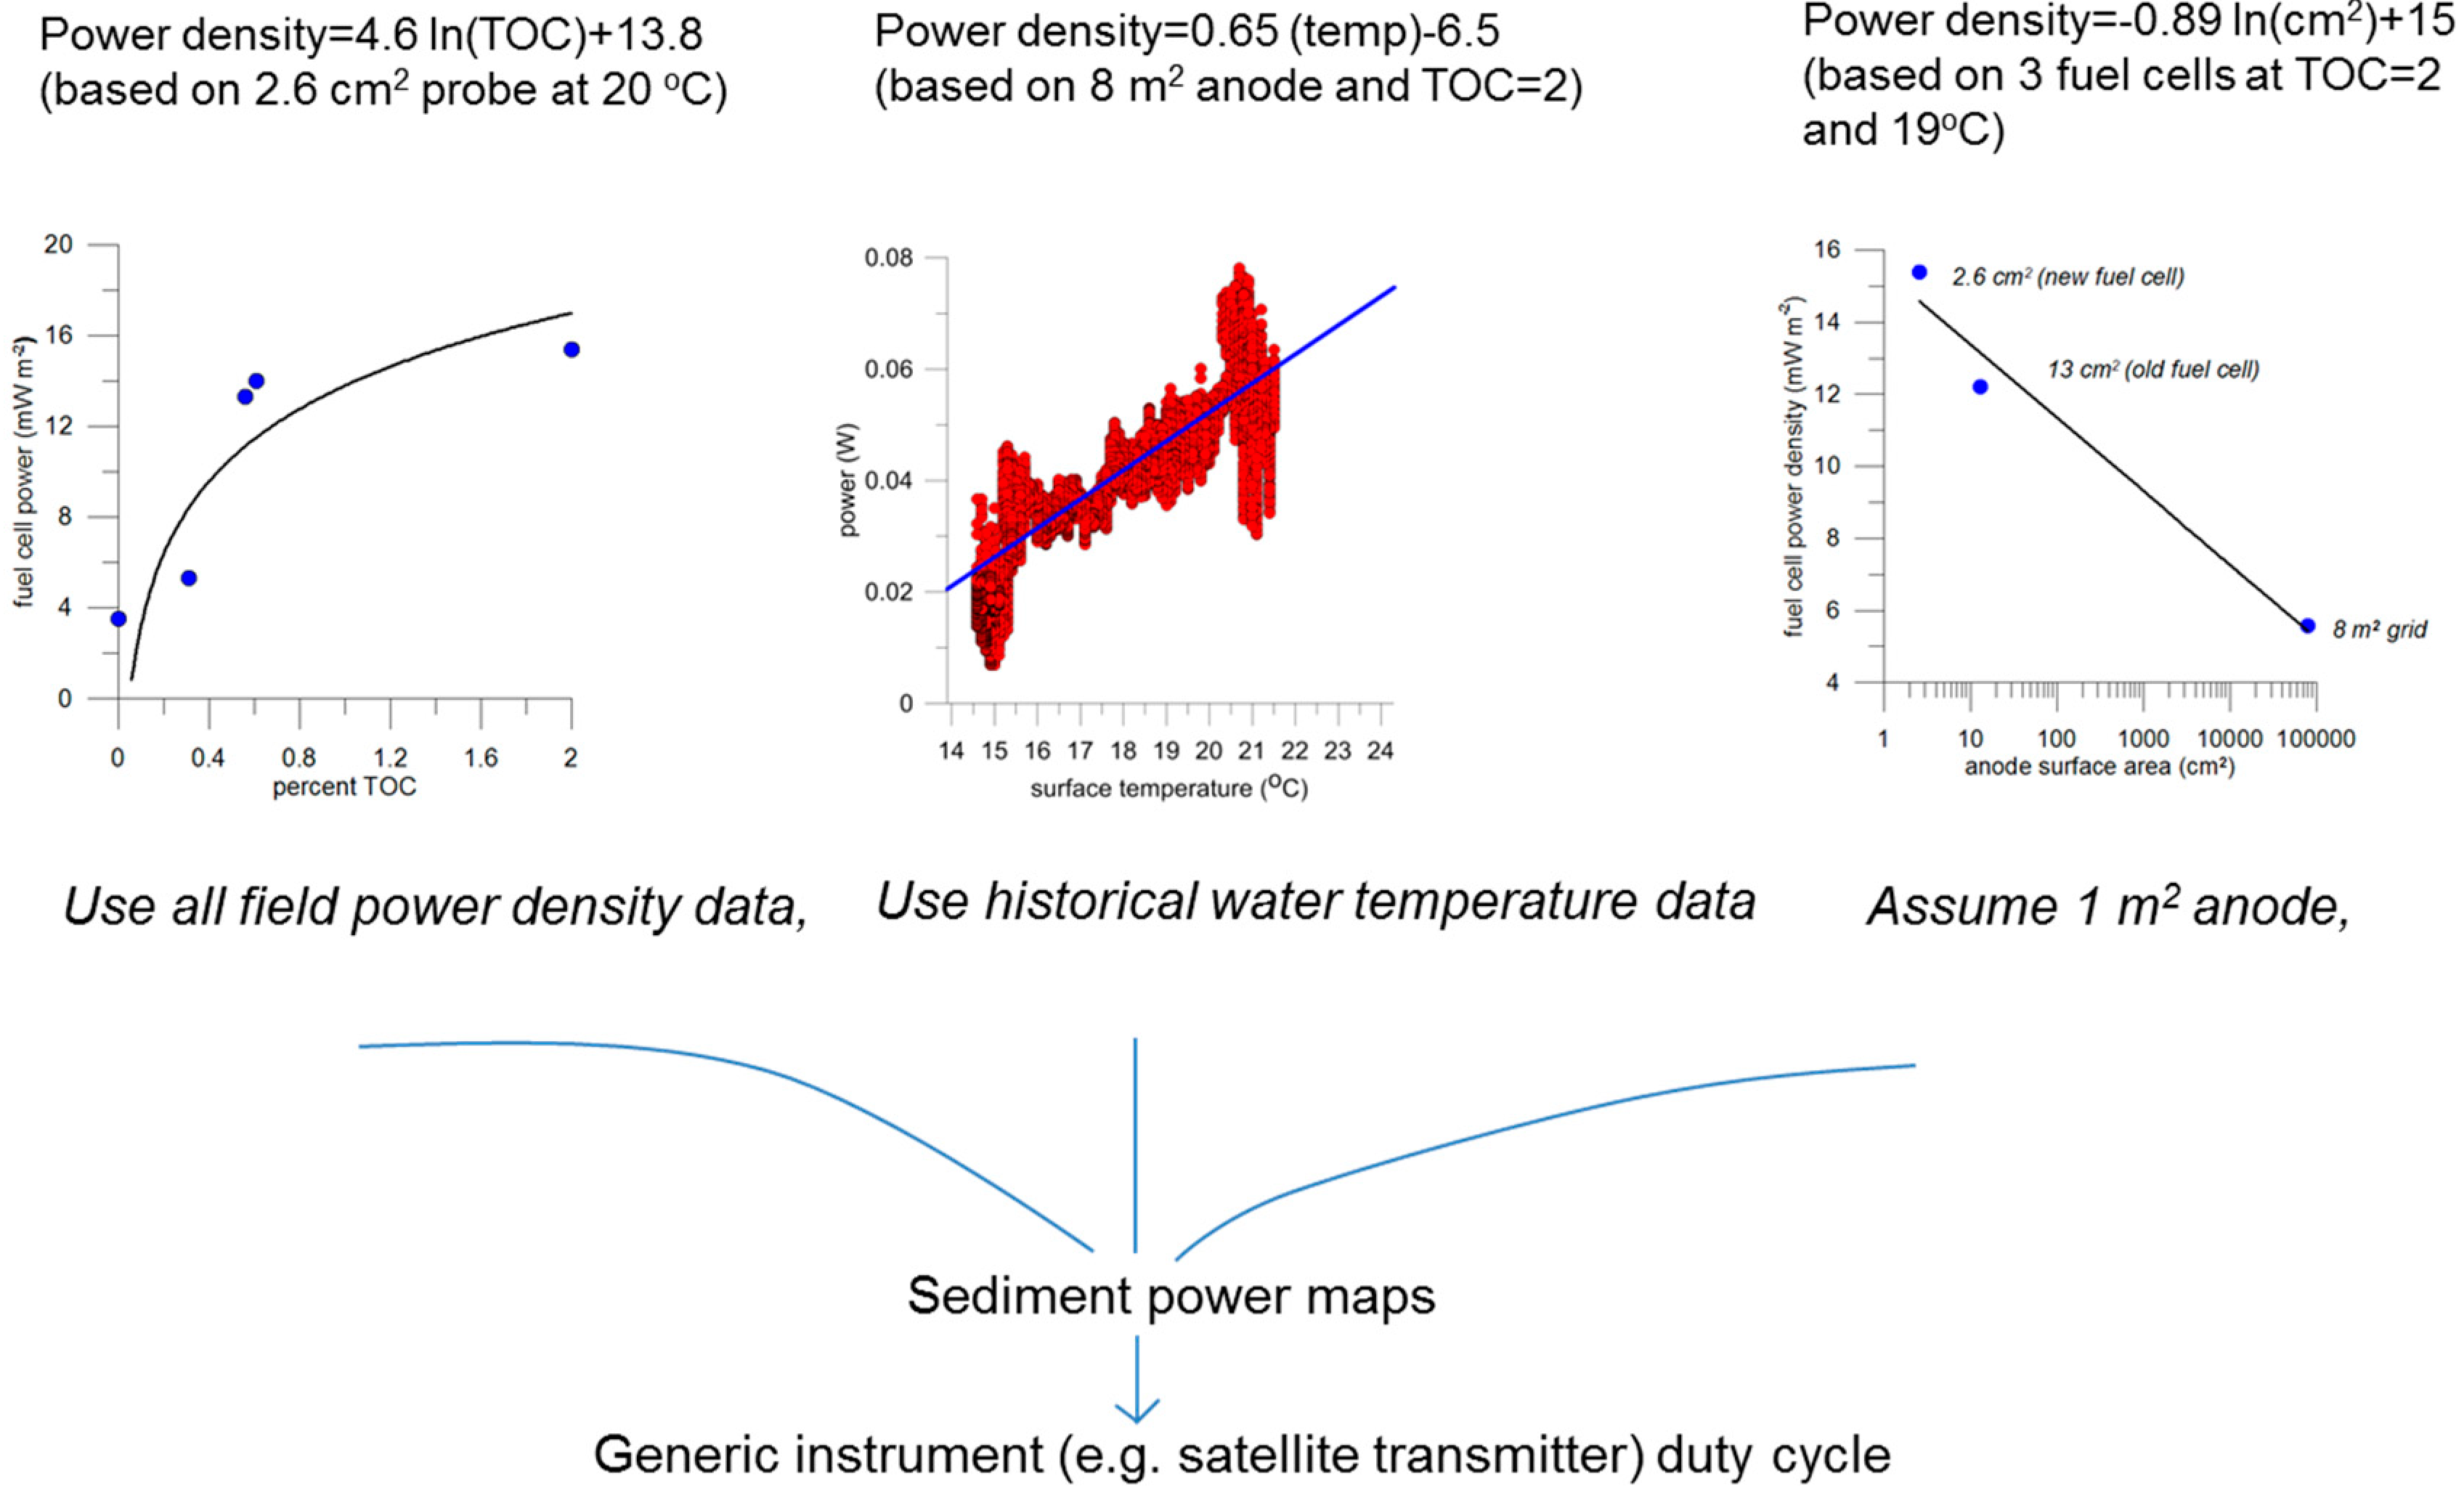
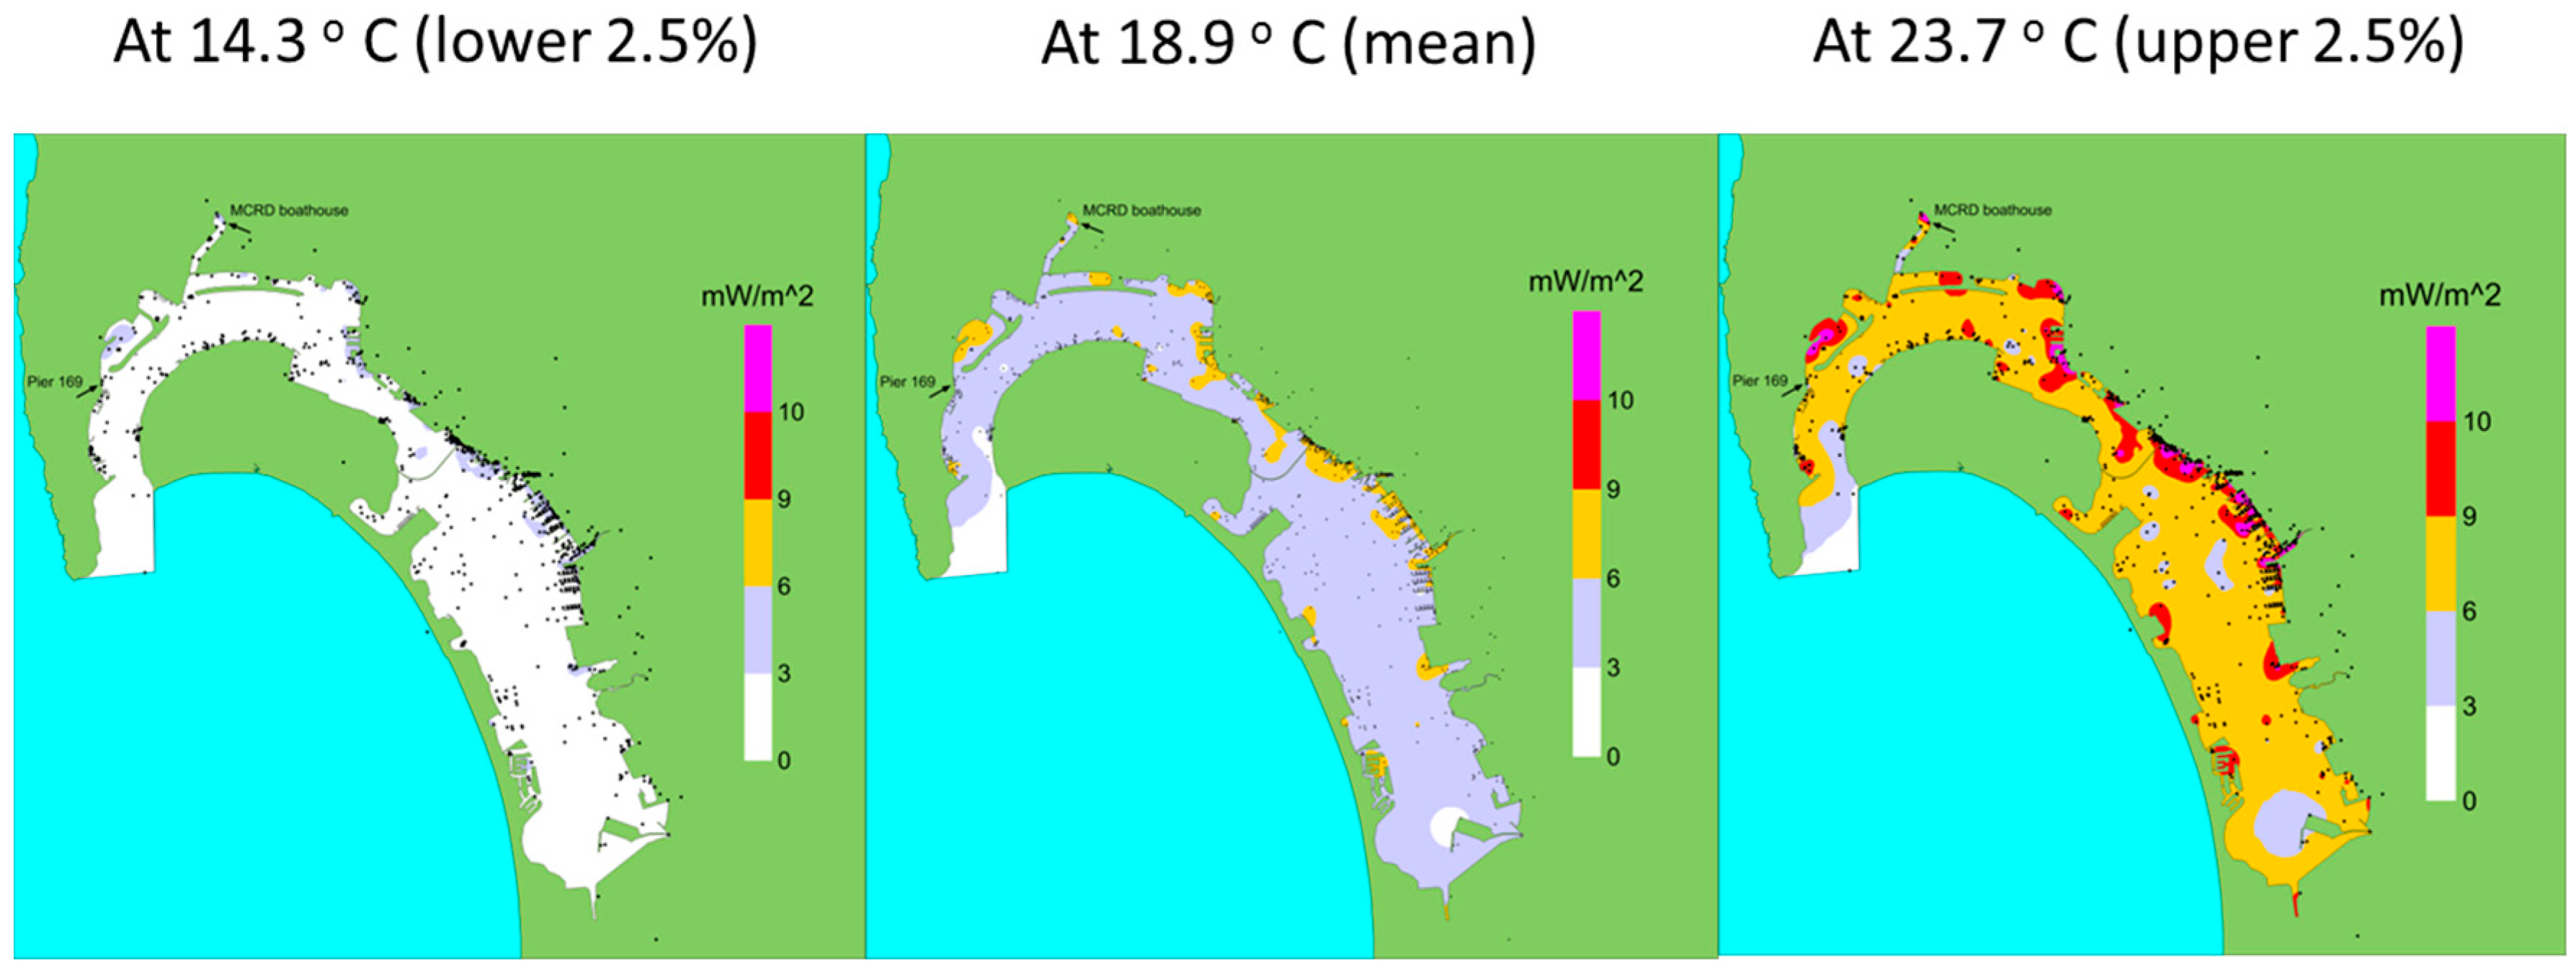
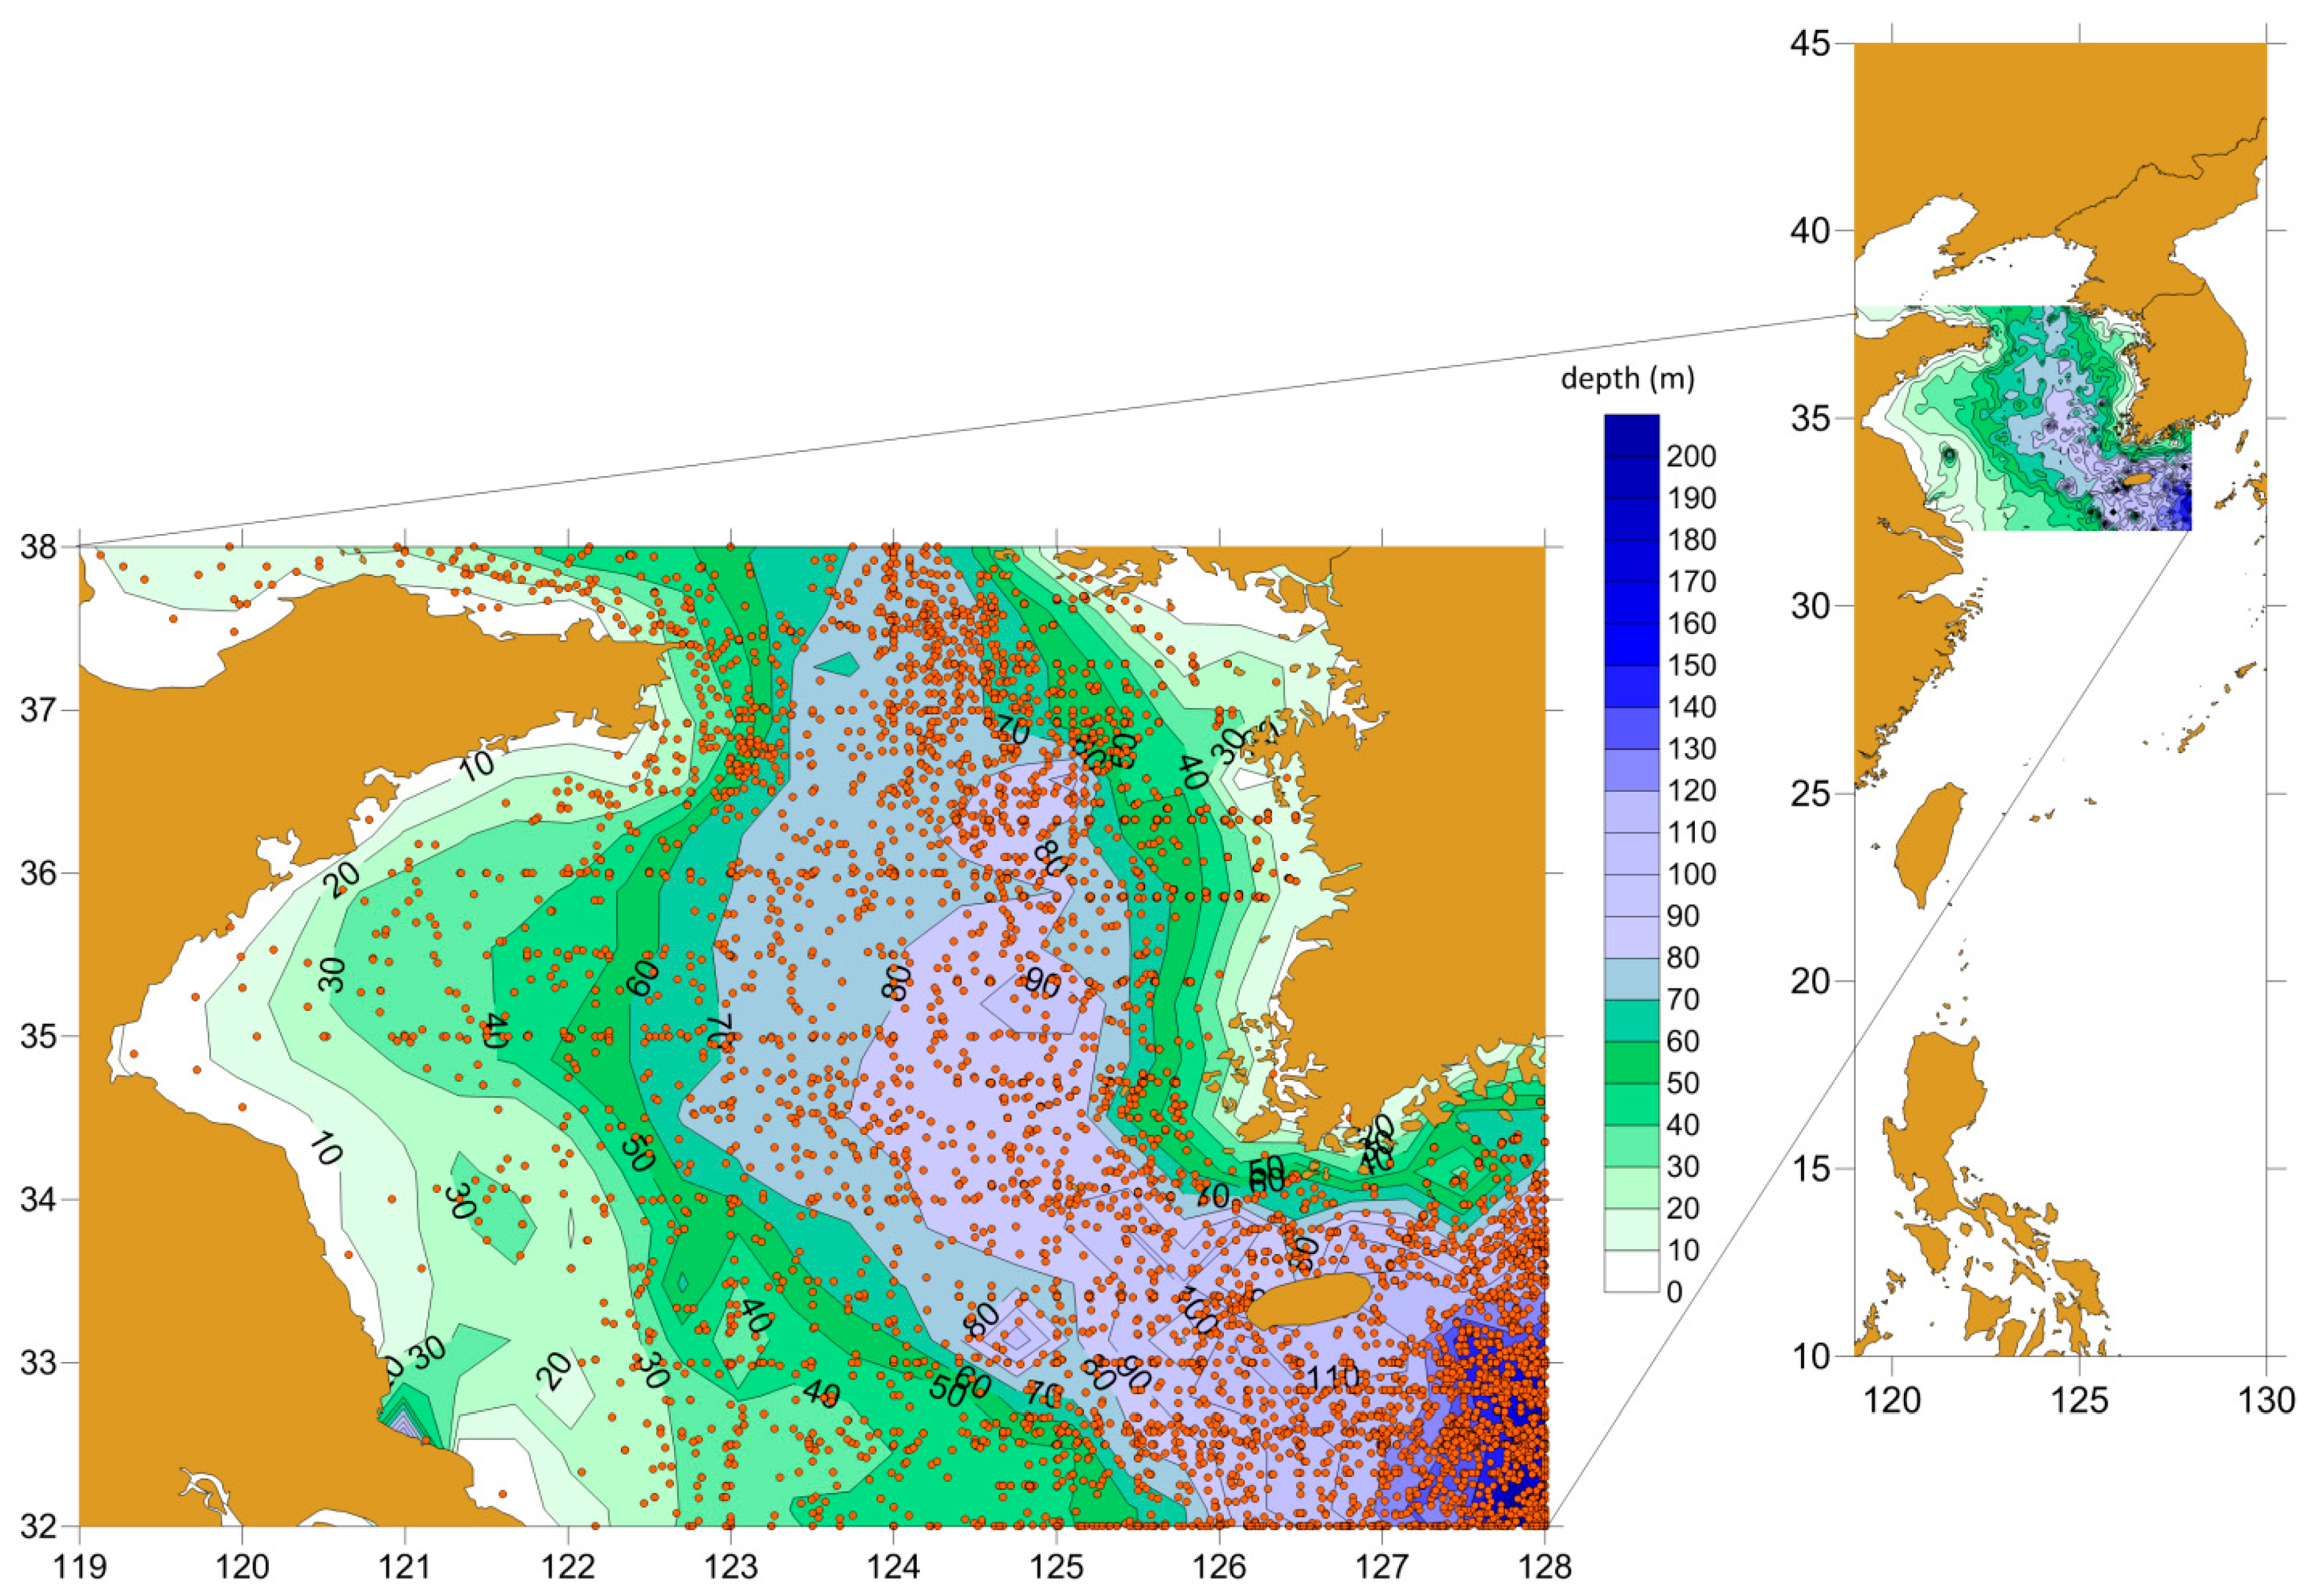
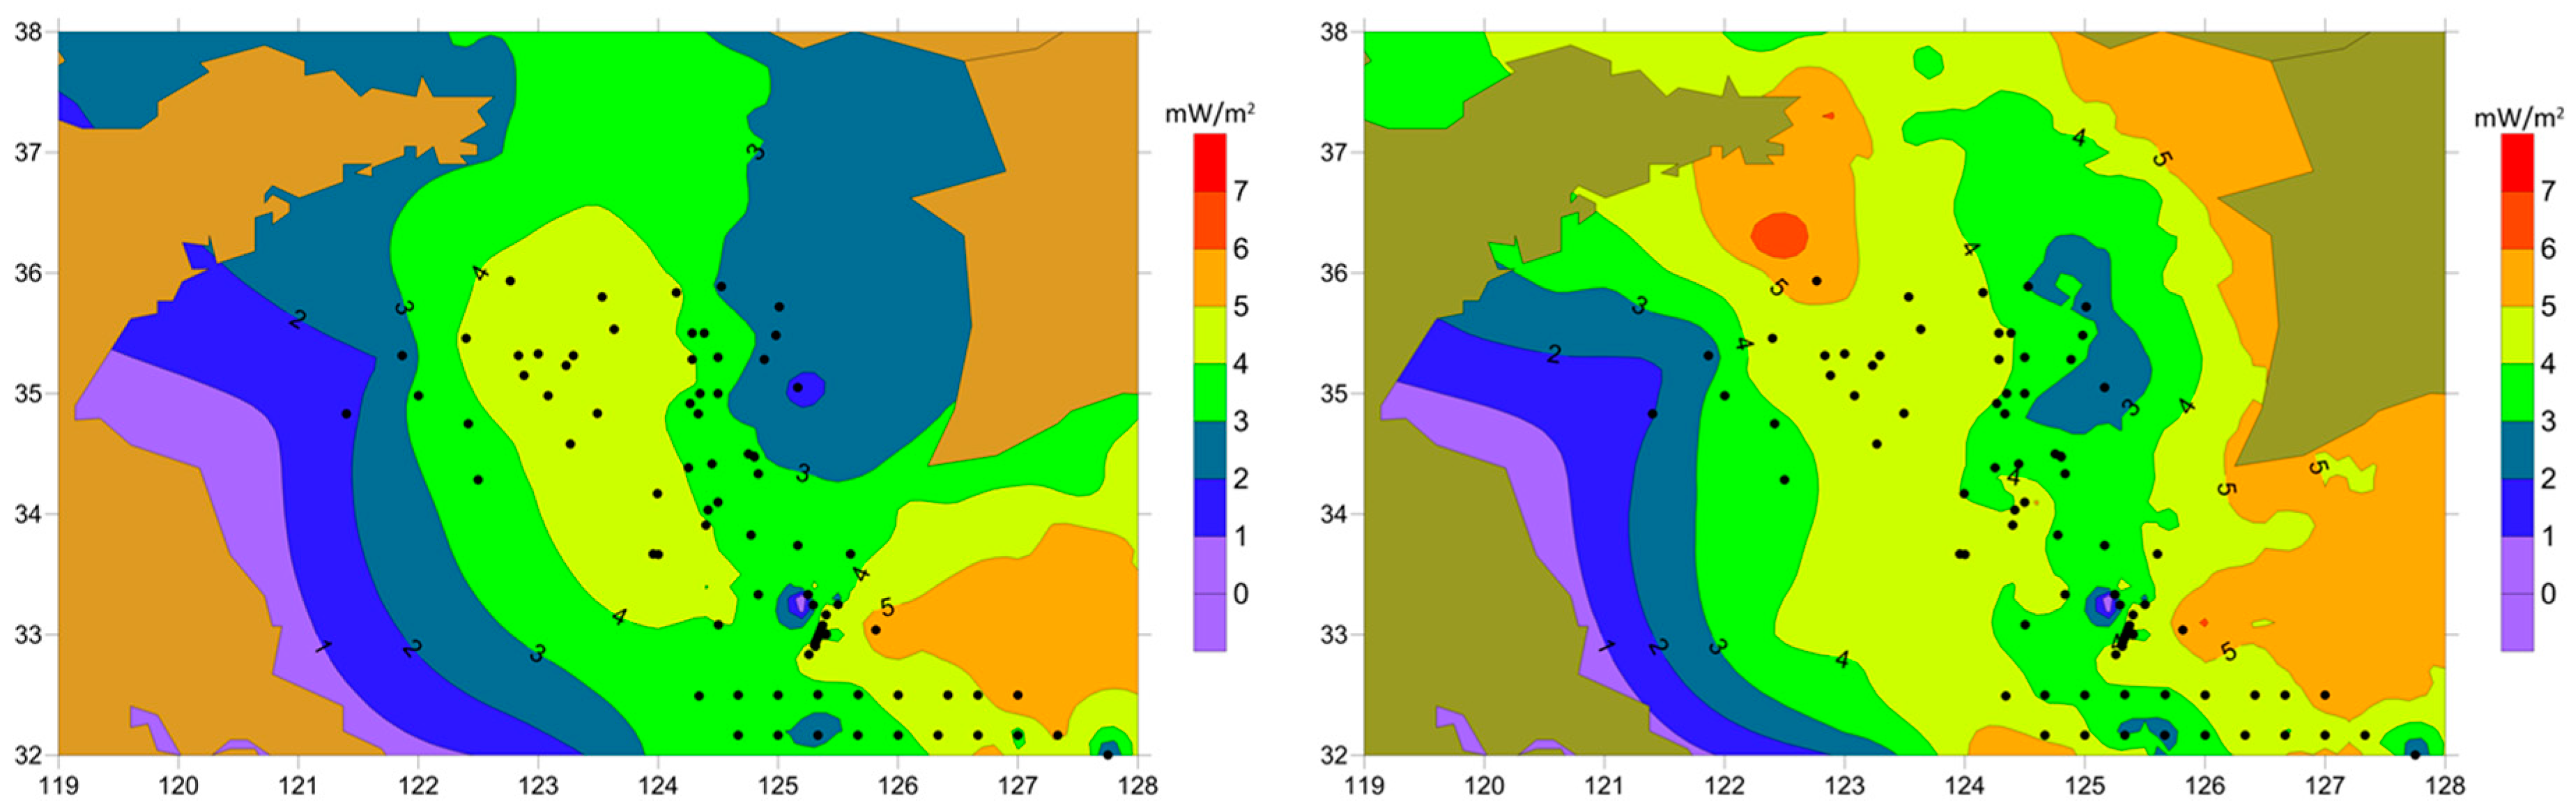
  • Shallow sediment MFCs are predicted to yield significantly greater power densities than deep sediment MFCs. We predict shallow sediment MFC power density to range from 5 to 10 mW/m2 off the Texas coast and 4 to 7 mW/m2 off the South Korean coast, using a 1 m2 anode. We predict deep sediment power density < 1 mW/m2 for the same anode size.
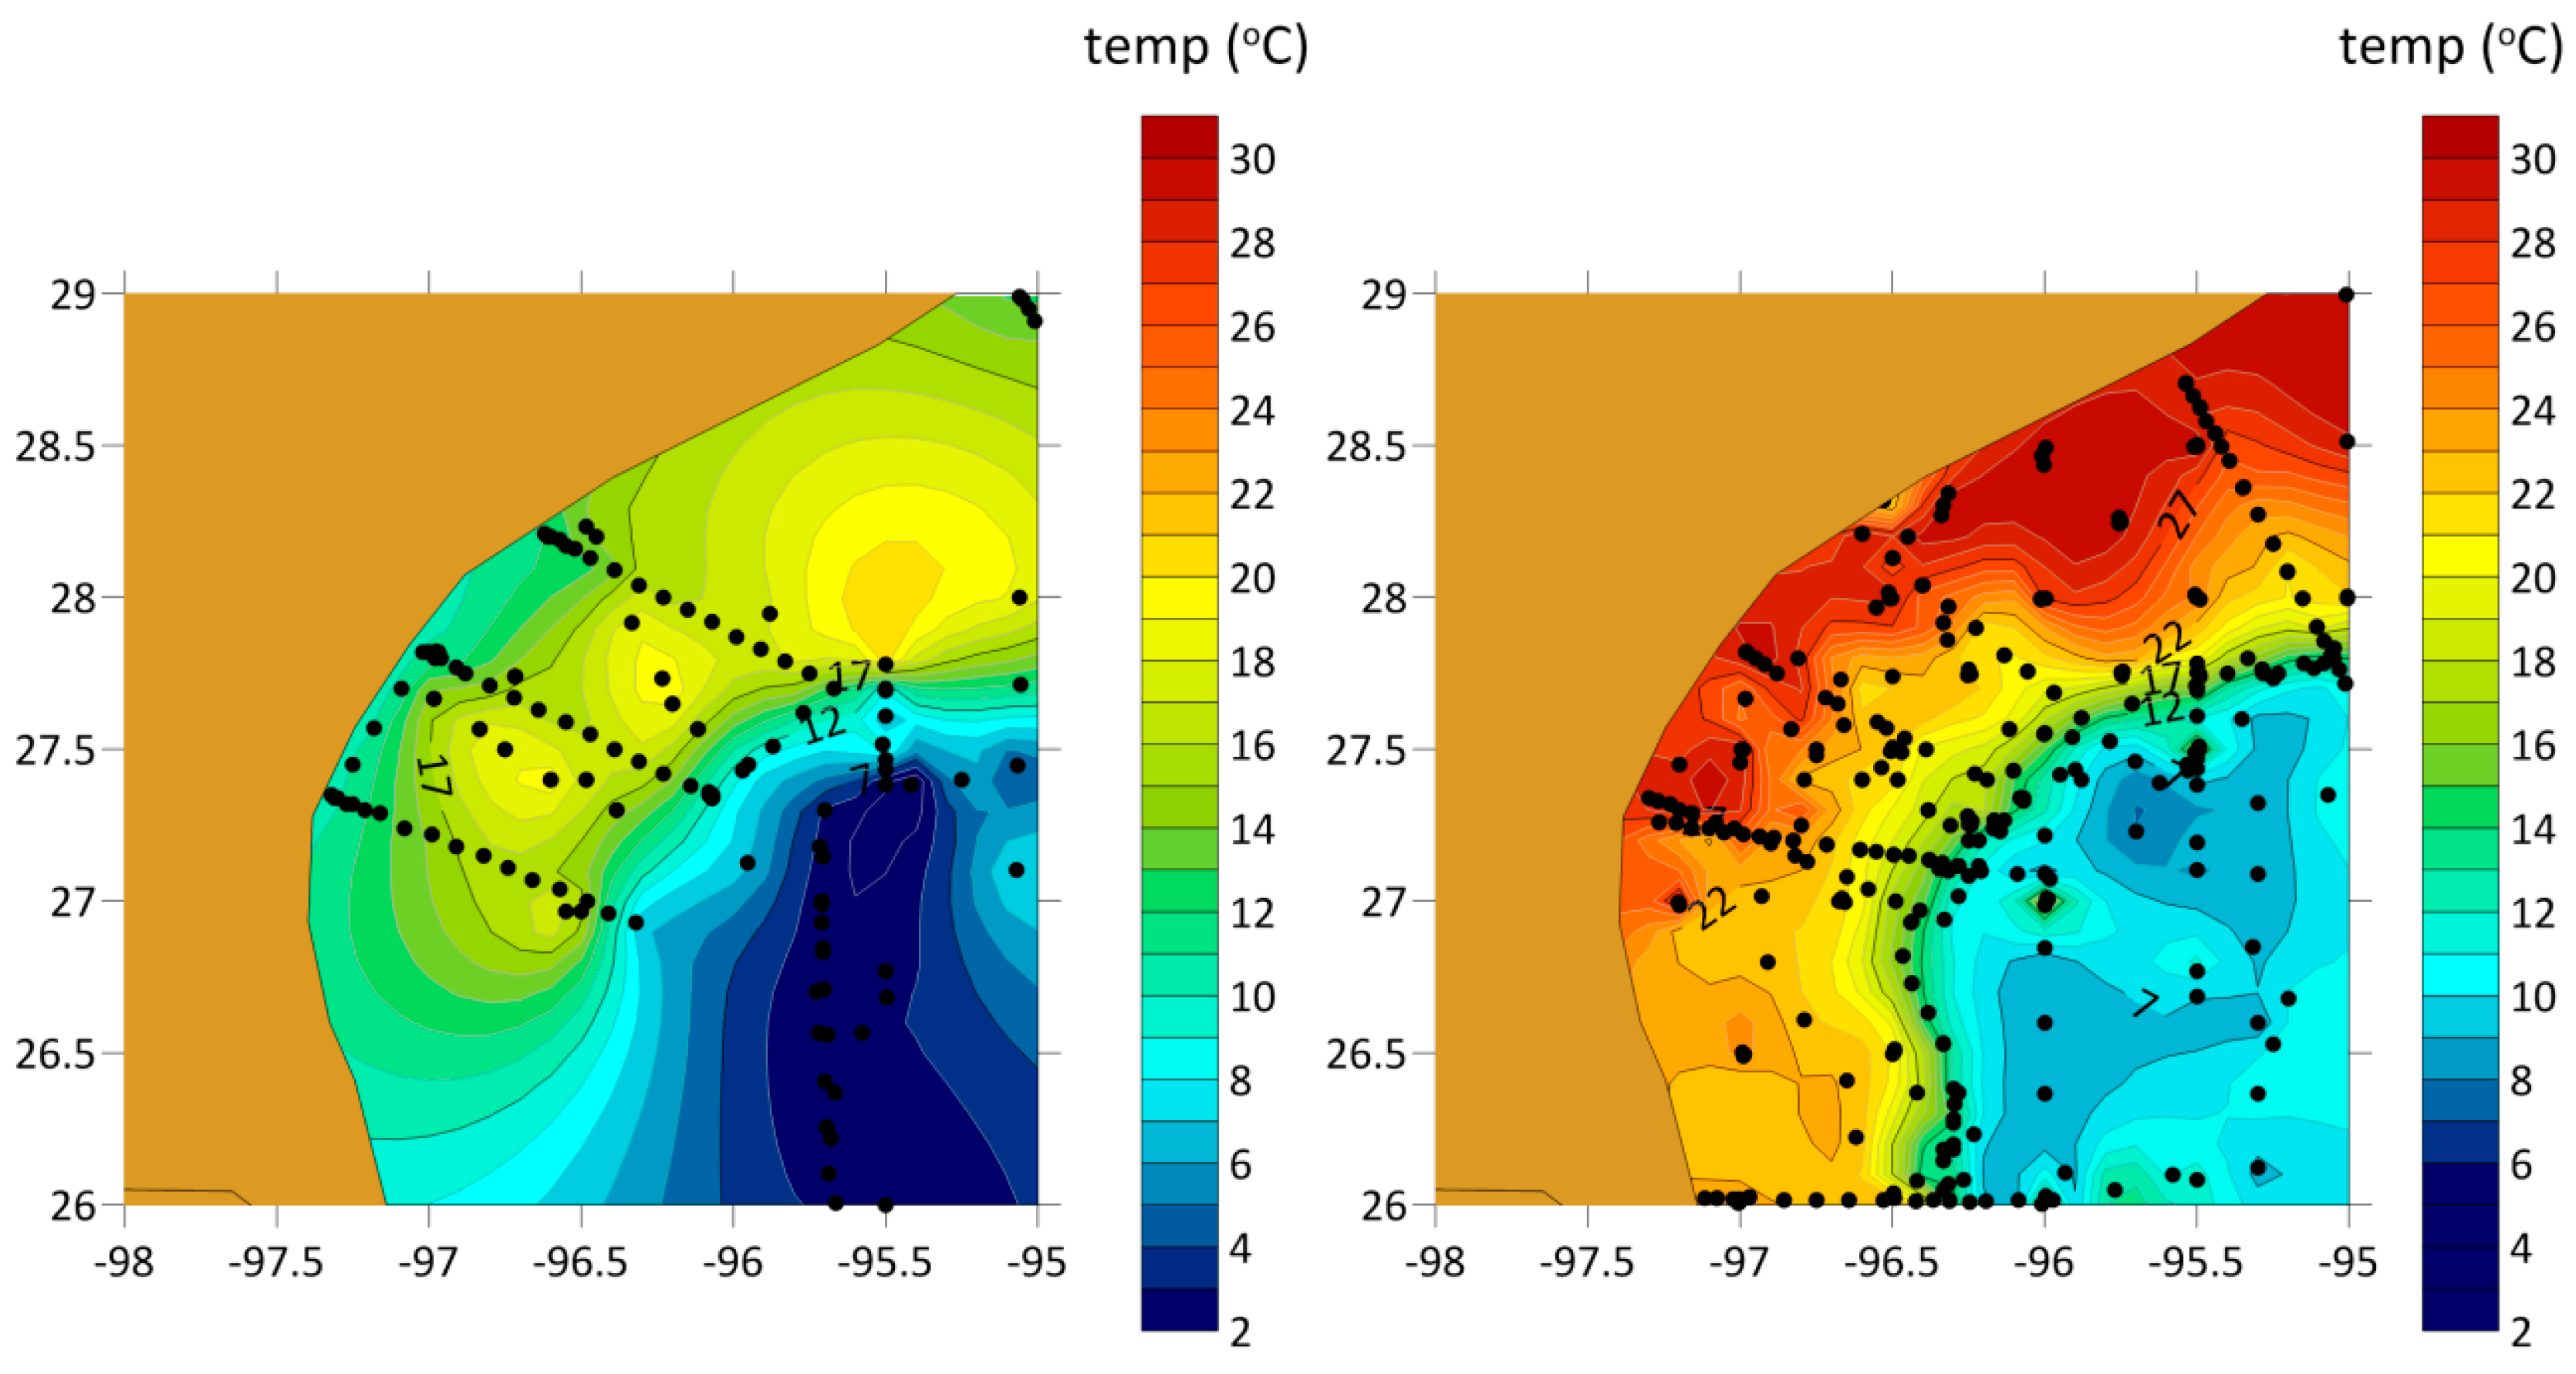
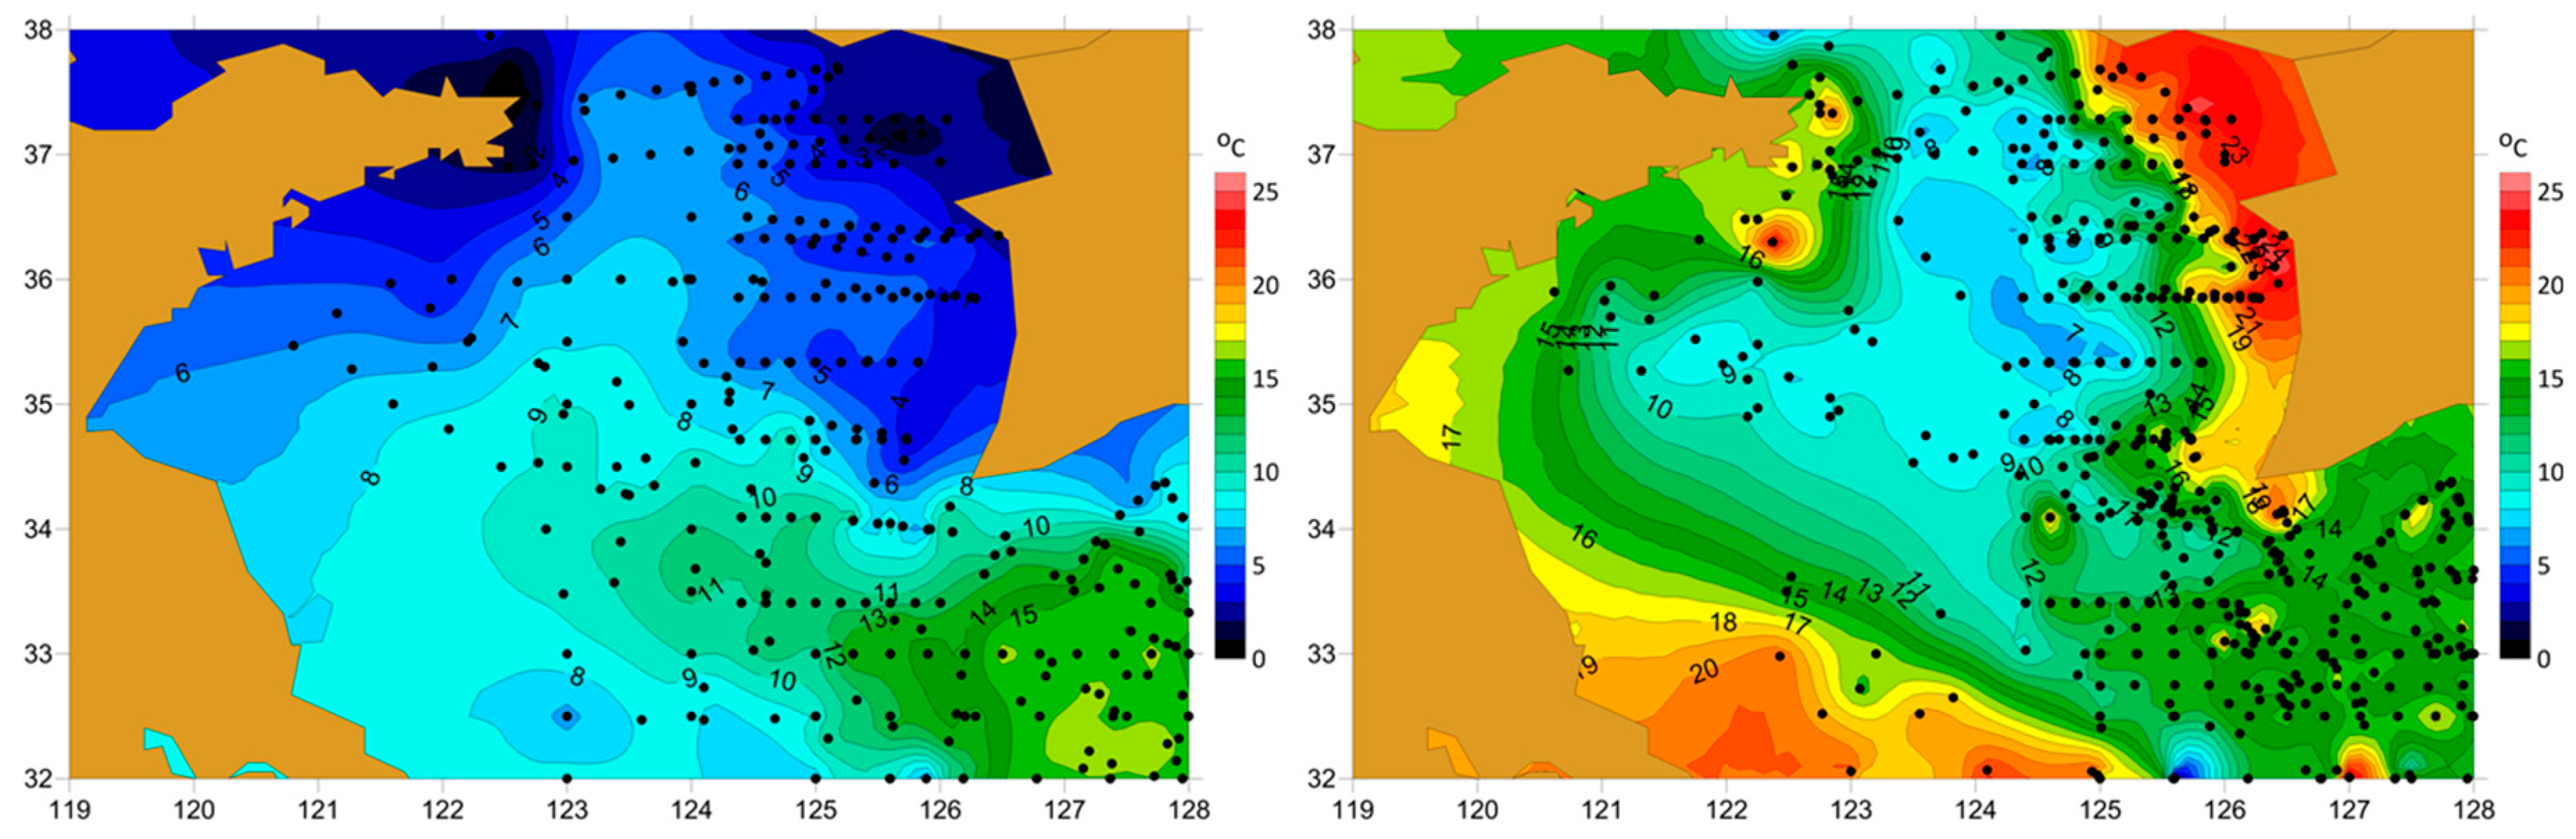
  • Near-bottom water temperatures off Texas and South Korea warm ~10 °C seasonally from February to August. This temperature increase is predicted to increase MFC power densities by 1 to 2 mW/m2.
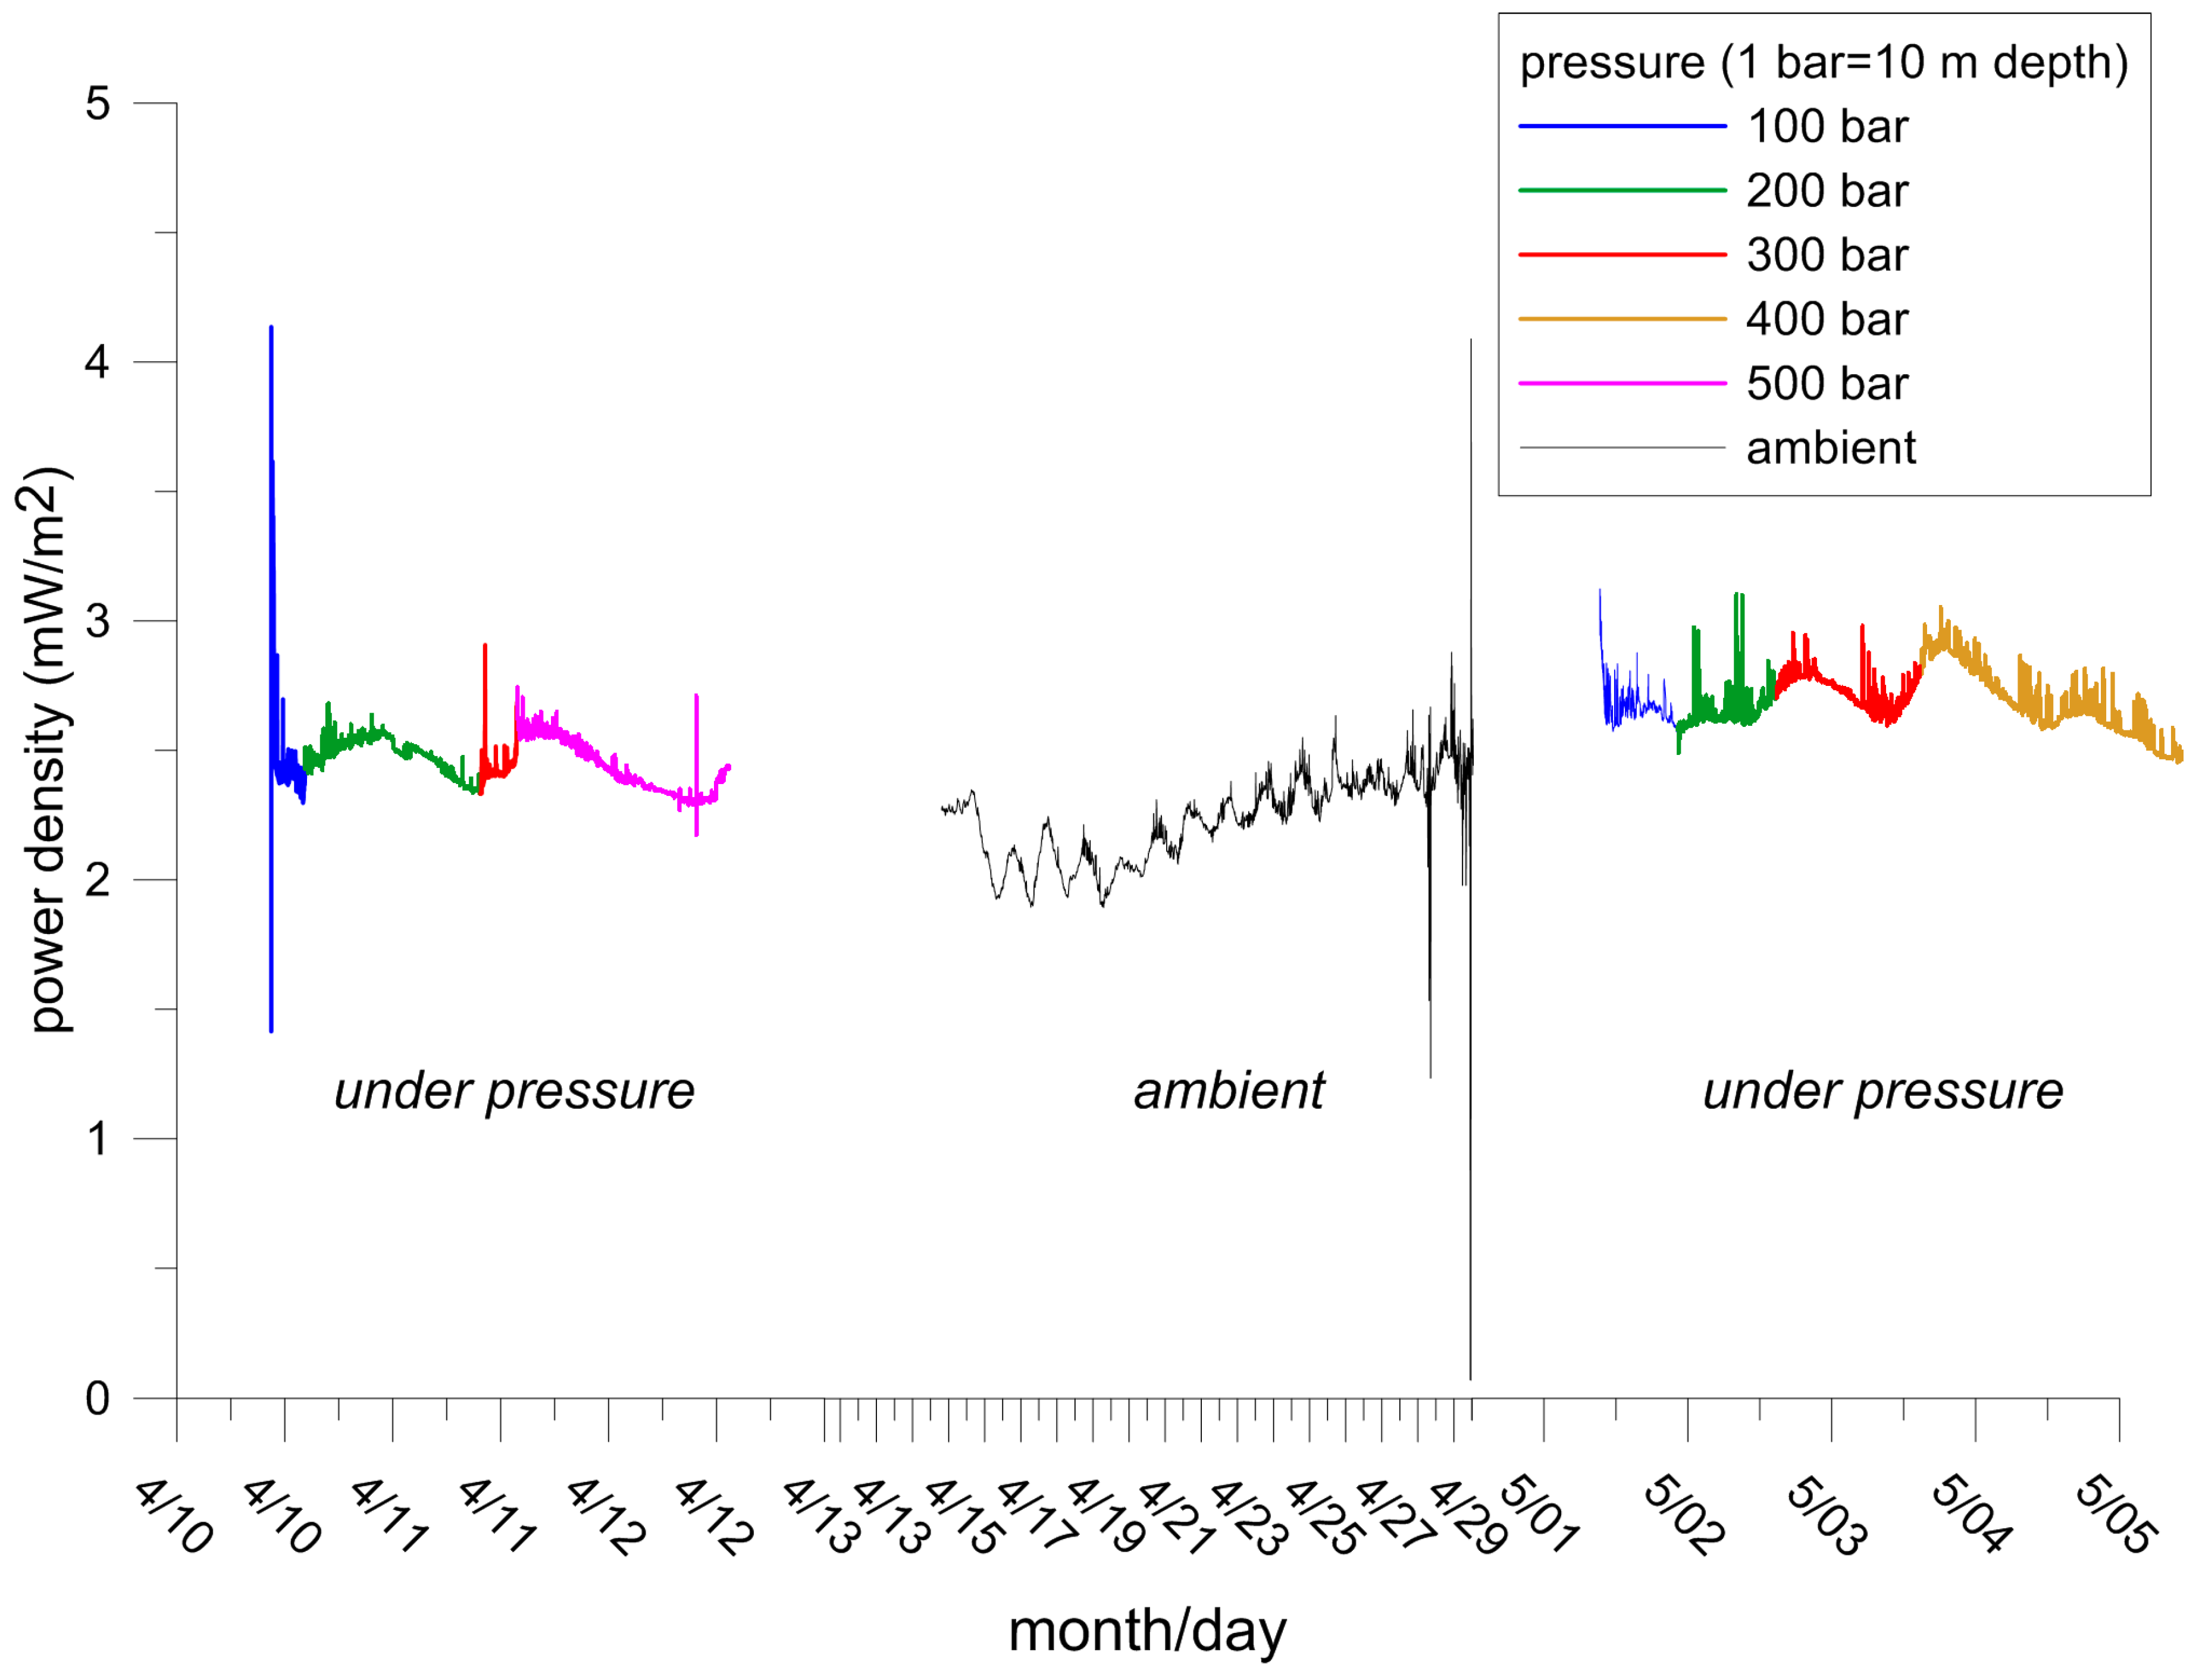
  • Observations connected with this study suggest that testing MFCs with sediments collected at depth (≥1000 m) and not pressurized during retrieval or in the laboratory does not unduly impact power density estimates.

Author Contributions

Conceptualization, K.R.; Formal analysis, K.R.; Funding acquisition, J.A.; Project administration, J.A.; Writing—original draft, K.R.; Writing—review & editing, K.R. and J.A.

Funding

This project was funded by Office of Naval Research, Naval Biosciences Program (code 342) and the Office of Naval Research’s ILIR program through SPAWAR.

Acknowledgments

This work is part of larger team at SPAWAR who delve into numerous disparate MFC studies but who cross-pollinate each other with ideas and results. In particular, Linda Chrisey in ONR’s Warfighters Protection and Applications Division has supported and continues to support and encourage our work. We note that Figure 1 and Figure 2 were previously published in the Oceans ’11 proceedings [13], Figure 12 and Figure 17 in the Oceans ’16 proceedings [19], and Figure 6 and Figure 8 in the Oceans ’15 proceedings [20]. We also thank two anonymous reviewers for their comments which improved this manuscript.

Conflicts of Interest

The authors declare no conflict of interest. The funders had no role in the design of the study; in the collection, analyses, or interpretation of data; in the writing of the manuscript, or in the decision to publish the results.

References

  1. Coates, J.D.; Phillips, E.J.P.; Lonergan, D.J.; Jenter, H.; Lovley, D.R. Isolation of Geobacter Species from Diverse Sedimentary Environments. Appl. Environ. Microbiol. 1996, 62, 1531–1536. [Google Scholar] [PubMed]
  2. Tender, L.M.; Gray, S.A.; Groveman, E.; Lowy, D.A.; Kauffman, P.; Melhado, J.; Tyce, R.C.; Flynn, D.; Petrecca, R.; Dobarro, J. The first demonstration of a microbial fuel cell as a viable power supply: Powering a meteorological buoy. J. Power Sources 2008, 179, 571–575. [Google Scholar] [CrossRef]
  3. Bond, D.R.; Holmes, D.E.; Tender, L.M.; Lovley, D.R. Electrode-reducing microorganisms that harvest sediments. Science 2002, 295, 483–485. [Google Scholar] [CrossRef] [PubMed]
  4. Logan, B.E.; Hamelers, B.; Rozendal, R.; Schroder, U.; Keller, J.; Freguia, S.; Aelterman, P.; Verstraet, W.; Rabaey, K. Microbial Fuel Cells: Methodology and Technology. Environ. Sci. Technol. 2006, 40, 5181–5192. [Google Scholar] [CrossRef] [PubMed]
  5. Lovley, D.R. Bug juice: Harvesting electricity with microorganisms. Nat. Rev. Microbiol. 2006, 4, 497–508. [Google Scholar] [CrossRef] [PubMed]
  6. Lovley, D.R.; Ueki, T.; Zhang, T.; Malvankar, N.S.; Shrestha, P.M.; Flanagan, K.A.; Aklujkar, M.; Butler, J.E.; Giloteaux, L.; Rotaru, A.E.; et al. Geobacter: The microbe electric’s physiology, ecology, and practical applications. Adv. Microbiol. Physiol. 2011, 59, 1–100. [Google Scholar] [CrossRef]
  7. Rabaey, K.; Verstraete, W. Microbial fuel cells: Novel biotechnology for energy generation. TRENDS Biotech. 2005, 23, 291–298. [Google Scholar] [CrossRef] [PubMed]
  8. Tender, L.M.; Reimers, C.E.; Stecher, H.A., III; Holmes, D.E.; Bond, D.R.; Lowy, D.A. Harnessing microbially-generated power on the seafloor. Nat. Biotech. 2008, 20, 821–825. [Google Scholar] [CrossRef] [PubMed]
  9. Donovan, C.; Dewan, A.; Heo, D.; Beyenal, H. Batteryless, wireless sensor powered by a sediment microbial fuel cell. Environ. Sci. Technol. 2008, 42, 8591–8596. [Google Scholar] [CrossRef] [PubMed]
  10. Hsu, L.; Chadwick, B.; Kagan, J.; Thacher, R.; Wotawa-Bergen, A.; Richter, K. Scale-up considerations for sediment microbial fuel cells. RSC Adv. 2013, 3, 15947–15954. [Google Scholar] [CrossRef]
  11. Kagan, J.; Hsu, L.; Chadwick, B. Large-Scale Benthic Microbial Fuel Cell Construction, Deployment, and Operation. In Biofilms in Bioelectrochemical Systems: From Laboratory Practice to Data Interpretation; Beyenal, H., Babauta, J., Eds.; Wiley: Hoboken, NJ, USA, 2015; pp. 367–416. ISBN 978-1-118-41349-4. [Google Scholar]
  12. Schrader, P.S.; Reimers, C.E.; Girguis, P.; Delaney, J.; Doolan, C.; Wolf, M.; Green, D. Independent Benthic Microbial Fuel Cells Powering Sensors and Acoustic Communications with the MARS Underwater Observatory. Am. Meteorol. Soc. 2016, 33, 607–617. [Google Scholar] [CrossRef]
  13. Richter, K.; Wotawa-Bergen, A. Predicting in situ sediment fuel cell potential. In Proceedings of the OCEANS’11 MTS/IEEE KONA, Waikoloa, HI, USA, 19–22 September 2011; pp. 39–50. [Google Scholar] [CrossRef]
  14. Dewan, A.; Beyenal, H.; Lewandowski, Z. Scaling up microbial fuel cells. Environ. Sci. Technol. 2008, 42, 7643–7648. [Google Scholar] [CrossRef] [PubMed]
  15. Logan, B.E. Sediment MFCs. In Microbial Fuel Cells; Wiley-Interscience: Hoboken, NJ, USA, 2008; pp. 162–166. ISBN 978-0-470-23948-3. [Google Scholar]
  16. NOAA Coastal Relief Model Grid Extract. Available online: https://maps.ngdc.noaa.gov/viewers/wcs-client/ (accessed on 1 October 2018).
  17. NOAA BLM/OCS South Texas Outer Continental Shelf (STOCS) Project Sediment Data. Available online: https://www.ngdc.noaa.gov/docucomp/page?xml=NOAA/NESDIS/NGDC/MGG/Geology/iso/xml/G02888.xml&view=getDataView&header=none (accessed on 1 October 2018).
  18. NOAA National Centers for Environmental Information, Ocean Profile Data. Available online: https://www.nodc.noaa.gov/General/profile.html (accessed on 10 October 2018).
  19. Ayers, J.M.; Richter, K. The potential of small-scale turbines and microbial fuel cells to support persistent oceanographic sensors. In Proceedings of the OCEANS 2016 MTS/IEEE Monterey, Monterey, CA, USA, 19–23 September 2016. [Google Scholar] [CrossRef]
  20. Richter, K.; George, R.; Hardy, K. Autonomous, retrievable deep sea microbial fuel cell. In Proceedings of the Oceans ’15 MTS/IEEE Genova, Genoa, Italy, 18–21 May 2015. [Google Scholar] [CrossRef]
  21. Toby, P.S.; Deming, J.W.; Ohwanda, K.; Colwell, R. Activity and growth of microbial populations in pressurized deep-sea sediment and animal gut samples. Appl. Environ. Microbiol. 1982, 44, 413–422. [Google Scholar]
  22. Price, P.B.; Sowers, T. Temperature dependence of metabolic rates for microbial growth, maintenance and survival. PNAS 2004, 101, 4631–4636. [Google Scholar] [CrossRef] [PubMed]
  23. Seiter, K.; Hensen, C.; Schröter, J.; Zabel, M. Organic carbon content in surface sediments—Defining regional provinces. Deep Sea Res. Part I 2004, 51, 2001–2026. [Google Scholar] [CrossRef]
  24. Shepherd, R.G. Correlations of permeability and grain size. Ground Water 1989, 27, 633–638. [Google Scholar] [CrossRef]
  25. Danovaro, R.; Fabiaon, M.; Della Croce, N. Labile organic matter and microbial biomasses in deep-sea sediments (Eastern Mediterranean Sea). Deep Sea Res. Part I 1993, 40, 953–965. [Google Scholar] [CrossRef]
Figure 1. General approach used to predict in situ sediment MFC power potential. Empirical data with varying anode sizes, water temperature, and sediment percent TOC were normalized to consider the performance of a 1 m2 anode with variable temperature and TOC.
Applsci 08 02628 g001
Figure 2. Predicted MFC power potential in San Diego Bay from a 1 m2 anode and ~700 known sediment TOC concentrations (black dots) and seasonal water temperatures.
Applsci 08 02628 g002
Figure 3. Sediment TOC collection sites off the Texas coast.
Applsci 08 02628 g003
Figure 4. Interpolated sediment TOC concentrations off the Texas coast.
Applsci 08 02628 g004
Figure 5. Bottom water temperatures in February (left) and August (right) off the Texas coast.
Applsci 08 02628 g005
Figure 6. Calculated MFC power density in February (left) and August (right) on the Texas shelf in the Gulf of Mexico.
Applsci 08 02628 g006
Figure 7. Bathymetry in the Yellow Sea.
Applsci 08 02628 g007
Figure 8. Interpolated sediment TOC concentrations in the Yellow Sea.
Applsci 08 02628 g008
Figure 9. Bottom water temperatures in February (left) and August (right) in the Yellow Sea.
Applsci 08 02628 g009
Figure 10. Calculated MFC power density in February (left) and August (right) in the Yellow Sea.
Applsci 08 02628 g010
Figure 11. Field sample sites for laboratory measurements (Google Earth).
Applsci 08 02628 g011
Figure 12. MFC power density versus TOC and bath temperature.
Applsci 08 02628 g012
Figure 13. MFC power density from deep (red line) and shallow (blue and green lines) sediments normalized to 5 °C.
Applsci 08 02628 g013
Figure 14. Effects of pressure on MFC output in the laboratory from sediment collected at 1000 m.
Applsci 08 02628 g014
Figure 15. MFC power density versus temperature in deep sediments (bottom three plots) and shallow sediments (top plot).
Applsci 08 02628 g015
Figure 16. Interpolated sediment TOC concentrations over much of the world ocean.
Applsci 08 02628 g016
Figure 17. Estimated MFC power output with a 1 m2 anode at 2 °C.
Applsci 08 02628 g017

