Article

Multi-Channel Electrical Impedance-Based Crack Localization of Fiber-Reinforced Cementitious Composites under Bending Conditions

1
Department of Architectural Engineering, Sejong University, 209, Neungdong-ro, Gwangjin-gu, Seoul 05006, Korea
2
Department of Construction and Disaster Prevention Engineering, Kyungpook National University, 2559, Gyeongsang-daero, Gyeongsangbuk-do, Sangju 37224, Korea
3
Department of Civil and Environmental Engineering, Sejong University, 209, Neungdong-ro, Gwangjin-gu, Seoul 05006, Korea
*
Authors to whom correspondence should be addressed.
Appl. Sci. 2018, 8(12), 2582; https://doi.org/10.3390/app8122582
Submission received: 30 September 2018 / Revised: 4 December 2018 / Accepted: 6 December 2018 / Published: 12 December 2018

Abstract

:
This study proposes a multi-channel electrical impedance-based crack localization technique of fiber-reinforced cementitious composites (FRCCs) under bending conditions. FRCCs have a self-sensing capability by adding conductive steel fibers into nonconductive cementitious composites, making it possible to measure electrical impedance without sensor installation. Moreover, FRCCs materials can be used as a structural member thanks to its own enhanced structural ductility as well as stiffness. In a structural health monitoring point of view, these characteristics make FRCCs suitable for monitoring structural hot spots, particularly where the crack is most likely to be initiated. Since the electrical impedance obtained from FRCCs is typically sensitive to environmental and operational conditions, false alarms are often triggered. The proposed technique can minimize the false alarms by using currently measured multi-path data as well as localize a crack within the sensing range. To examine the feasibility of crack localization in FRCCs, an instantaneous multi-channel electrical impedance acquisition system and a crack localization algorithm are developed. Subsequently, three-point bending tests are carried out under various temperature conditions. The validation test results reveal that cracks are successfully identified and localized even under varying temperature conditions.

1. Introduction

Concrete is one of the most commonly and widely used construction materials over the world thanks to its high compressive strength and economic superiority [1]. However, a concrete structure is inherently susceptible to cracks due to its low tensile resistance. The crack propagation often causes the abrupt brittle failure of the concrete structure without any forewarning. Thus, the brittle failure leading to heavy losses of lives and properties is difficult to be prevented. In order to prevent such brittle failure of the concrete structures, a number of structural health monitoring (SHM) techniques have been developed. For example, strain gauge, acoustic emission, impact test and lead zirconate titanate (PZT)-based ultrasonic techniques have been widely used as contact-type sensor-based crack detection techniques. Neild et al. utilized vibrating wire strain gauges for measuring the small strain in a concrete structure [2]. Then, Kageyama et al. used fiber optic sensors to monitor concrete cracks using the acoustic emission technique [3,4]. Also, Paul et al. tried to characterize the cracking behavior in strain-hardening cement-based composite using acoustic emission technique [5]. Pimentel et al. performed the impact test using an impact hammer to detect a crack in a concrete slab [6]. Ribolla et al. performed ultrasonic-based inspection for detecting the defect in concrete [7]. Voutetaki et al. experimentally assessed crack in a reinforced concrete structure using PZTs [8,9,10,11], and Rucka and Wilde also utilized PZTs for detecting splitting failure of a reinforced concrete structure under incrementally increased loading conditions [12]. Song et al. tried to numerically and experimentally observe PZT-generated surface wave propagation in a concrete structure to detect cracks [13]. Divsholi and Yang proposed a combination of embedded PZTs with surface bonded PZTs to assess the cracks in a reinforced concrete beam [14]. The aforementioned contact-type sensor-based SHM techniques have the advantages of low cost and high accuracy, but there are technical limitations such as sensor durability, maintenance related to sensor replacement, massive cabling issues and so on. In particular, the performance of the sensor might be degraded much earlier than the target structure itself [15,16]. Furthermore, the spatial sensing range is typically limited [17].
To overcome the aforementioned technical limitations, noncontact crack detection techniques have been proposed. As representative tools, digital camera [18,19,20], laser displacement sensor [21] and infrared (IR) thermography [22,23] have been reported. Recently, unmanned aerial vehicle (UAV) has been employed for incorporating with the noncontact crack detection techniques, because UAV can effectively inspect broad target areas including even inaccessible areas. For instance, UAV-mounted vision cameras were used for evaluating concrete cracks [24,25]. Pereira and Pereira also used UAV with an embedded image processing system for automatic recognition of cracks on a concrete surface [26]. IR camera incorporated with laser excitation was also utilized for detecting multiple concrete cracks [27]. More recently, Jang et al. proposed the fully noncontact hybrid sensing system combining a continuous-wave line laser, IR and digital cameras for enhancing deep learning-based crack detectability of a concrete structure [28]. Although the noncontact crack detection techniques can address the technical limitations of the contact-type sensing mechanism, they are more suitable for periodic inspection rather than real-time monitoring of a target structure. In a SHM point of view, real-time monitoring is one of the most important issues for preventing abrupt structural failure.
As an alternative, embedded sensing techniques such as embedded PZT-based smart aggregates and self-sensing concrete have been proposed for concrete crack detection. For example, Laskar et al. evaluated a crack of two-story reinforced concrete frame instrumented with embedded PZT-based smart aggregates [29]. Another embedded sensing technique is the self-sensing concrete. The self-sensing concrete is made by adding conductive fibrous materials into nonconductive normal cement to increase its electrical sensing capability as well as structural ductility [30,31]. Thus, it can be used as a sensor for crack monitoring in structural hot spots. By inspecting cracks within the structural hot spots, the entire structure can be effectively monitored [32]. Fiber-reinforced cementitious composites (FRCCs) is one of the representative self-sensing concrete types. FRCCs can be typically made by inserting conductive materials such as steel fibers, glass fibers, synthetic fibers, graphite powders, carbon nanofibers and carbon black fibers into the cement matrices, enabling to have the self-sensing capability [33,34,35,36,37,38,39]. Thus, the electrical responses can be measured from FRCCs without additional sensor installation. Hou et al. utilized the cementitious concrete with polymeric fibers to detect and localize cracks by employing an electrical impedance tomography method [40], and Downey et al. demonstrated the applicability of crack detection and localization using nanocomposite cement-based beams [41,42]. Also, Zhou et al. presented an electrical resistance tomography technique for localizing and detecting cracks in a concrete structure [43]. Since the electrical response is, however, sensitively affected by environmental variation [44], the only crack-induced feature should be carefully extracted from the measured electrical responses.
In this study, an instantaneous multi-channel electrical impedance-based crack localization technique of using FRCCs is proposed. First, the instantaneous multi-channel electrical impedance acquisition system and crack localization algorithm are developed, and the FRCCs specimens are manufactured by inserting two different sizes of fibers into a mortar matrix. Then, experimental validation including temperature variation effect and three-point bending tests are performed.
This paper is organized as follows. Section 2 describes the instantaneous multi-channel electrical impedance acquisition system integrated with FRCCs and explains the crack localization algorithm. Then, the temperature variation effect and crack localization are experimentally investigated in Section 3. Finally, this paper is concluded with a brief discussion in Section 4.

2. FRCCs-Based Electrical Impedance Acquisition System and Crack Localization Algorithm

In this section, the instantaneous multi-channel electrical impedance acquisition system incorporated with FRCCs and the corresponding crack localization algorithm is introduced. First, the instantaneous multi-channel electrical impedance acquisition system, enabling to generate the instantaneous alternating current (AC) input with broadband frequency range and simultaneously measure the corresponding responses, is introduced. Then, the manufacturing process of FRCCs used for the subsequent experiments is described. Finally, the corresponding crack localization algorithm is also explained.

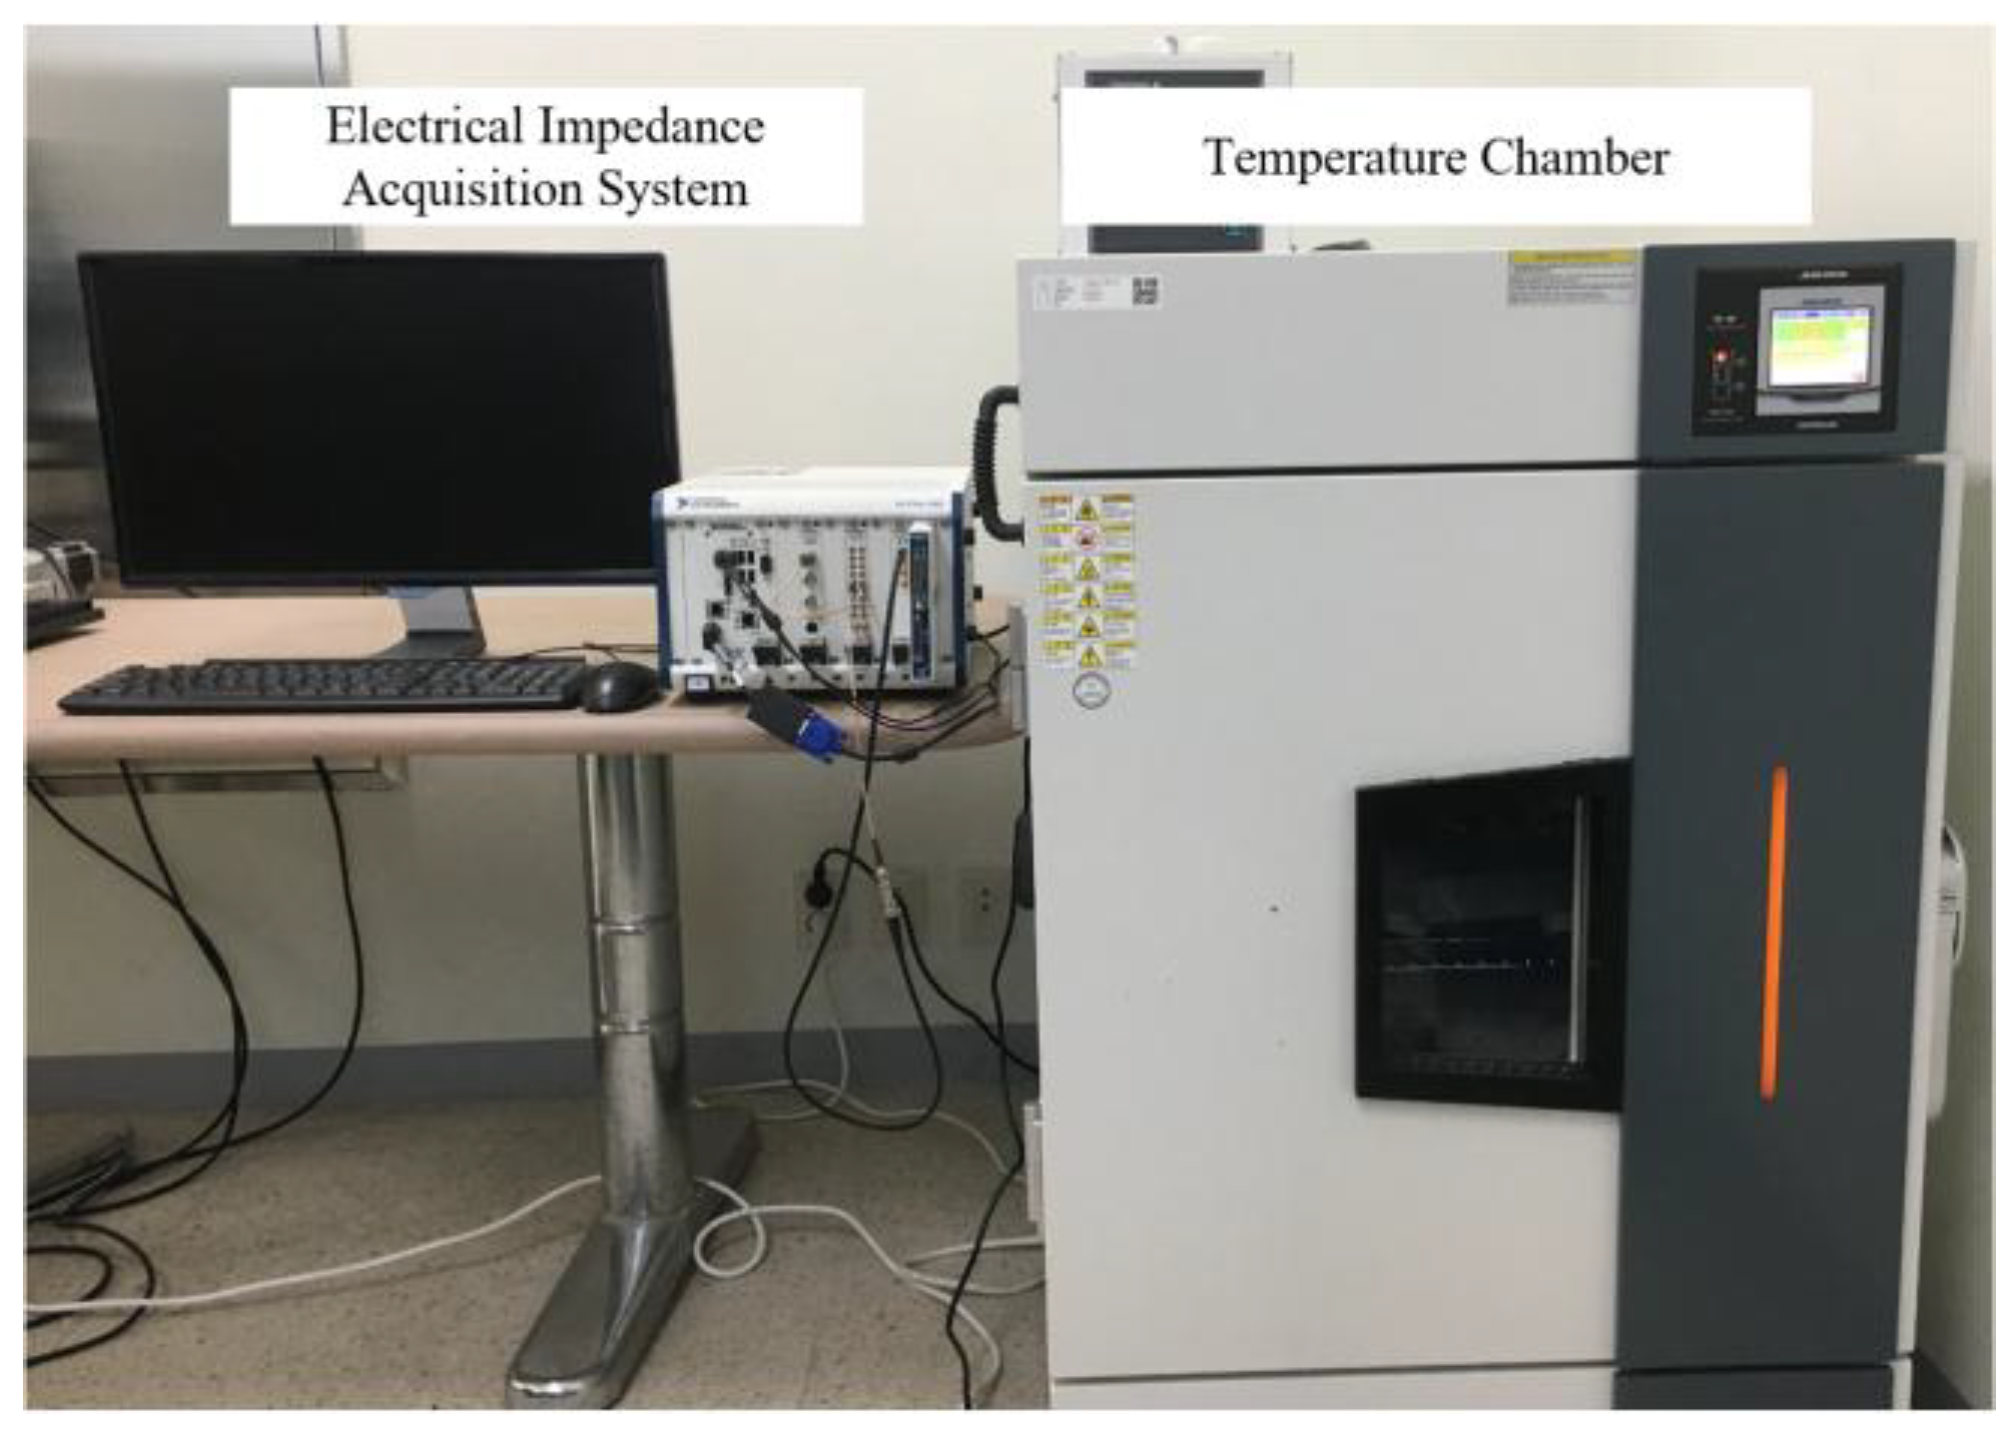
2.1. Instantaneous Multi-Channel Electrical Impedance Acquisition System

Figure 1 shows the working principle of the instantaneous multi-channel electrical impedance acquisition system. The developed system is composed of the control computer, an arbitrary waveform generator (AWG), digitizer, multiplexer and self-sensing circuit. The developed system is programed and controlled by LabVIEW installed in the control computer. The working procedure is as follows. First, control computer sends the trigger signals to AWG and digitizer. Second, AWG generates an AC input with a tailored waveform and the corresponding electrical current propagates along the manufactured FRCCs. Third, the propagated current is measured by the digitizer through the self-sensing circuit and send to control computer. Finally, the process from the first step to the third step is repeated with respect to the multi-sensing regions using the multiplexer. Since the FRCCs specimen is acting as a semi-conductive component due to combined fibers, the driving voltage is required above a certain level. Here, the self-sensing circuit which acts as a charge amplifier is needed to simultaneously excite and sense the small voltage in FRCCs [45]. The self-sensing circuit based on voltage divider can measure the voltage of FRCCs using Equation (1):
v c ( t ) =   C r C c v 0 ( t ) v i ( t ) ,
where v c ( t ) is generated from the electrical response over time ( t ). C r and C c represent the reference capacitor of the self-sensing circuit and the capacitance values of FRCCs respectively. v 0 and v i are the output and input voltages as shown in Figure 1.

2.2. Preparation of Fiber-Reinforced Cementitious Composites

Four FRCCs specimens are basically made by adding steel fibers to the mortar matrix, making it possible to have conductive nature. The mortar matrix used in this study is composed of water, Portland type I cement, sand and superplasticizer as summarized in Table 1. Here, the grain sizes are less than 5 mm. The fine aggregate is prepared as the surface-dry saturated condition. The steel fibers have two different diameters of 0.3 mm and 0.2 mm, and their lengths are 30 mm (long fiber) and 19.5 mm (short fiber), respectively. The short fiber increases the electrical sensing capacity of FRCCs, while the long fiber enhances the mechanical strength of FRCCs [46]. Each type of fibers is mixed as 12.5% of cement weight ratio, and total steel fibers for the FRCCs specimen is 25% of cement weight ratio. For better workability between mortar matrix and steel fibers, 0.2% poly naphthalene sulfonate superplasticizer with respect to the cement weight is used in this study. Note that the four specimens have the same water-to-cement ratio and the aggregate-to-cement ratio of 0.45 and 1, respectively.
First, the mortar matrix and steel fibers are mixed during 5 min using a planetary mixer. Then, it is placed in a cuboid-shaped mold on the vibrating table for eliminating cavity inside FRCCs. The cuboid-shaped mold having the dimension of 50 × 40 × 400 mm3 is fabricated for curing of FRCCs. As shown in Figure 1, the five copper electrodes with a diameter of 1.78 mm and a length of 70 mm are embedded in FRCCs with intervals of 50 mm from the center location of FRCCs. For the crack localization of FRCCs, experimental regions are divided into four different regions defined as Regions A, B, C and D. After mixing, the FRCCs specimens are cured at a constant temperature of 20 °C and a relative humidity of 80% in a thermo-hygrostat for 24 h. After demolding, the FRCCs specimens are water-cured at a room temperature for a week.

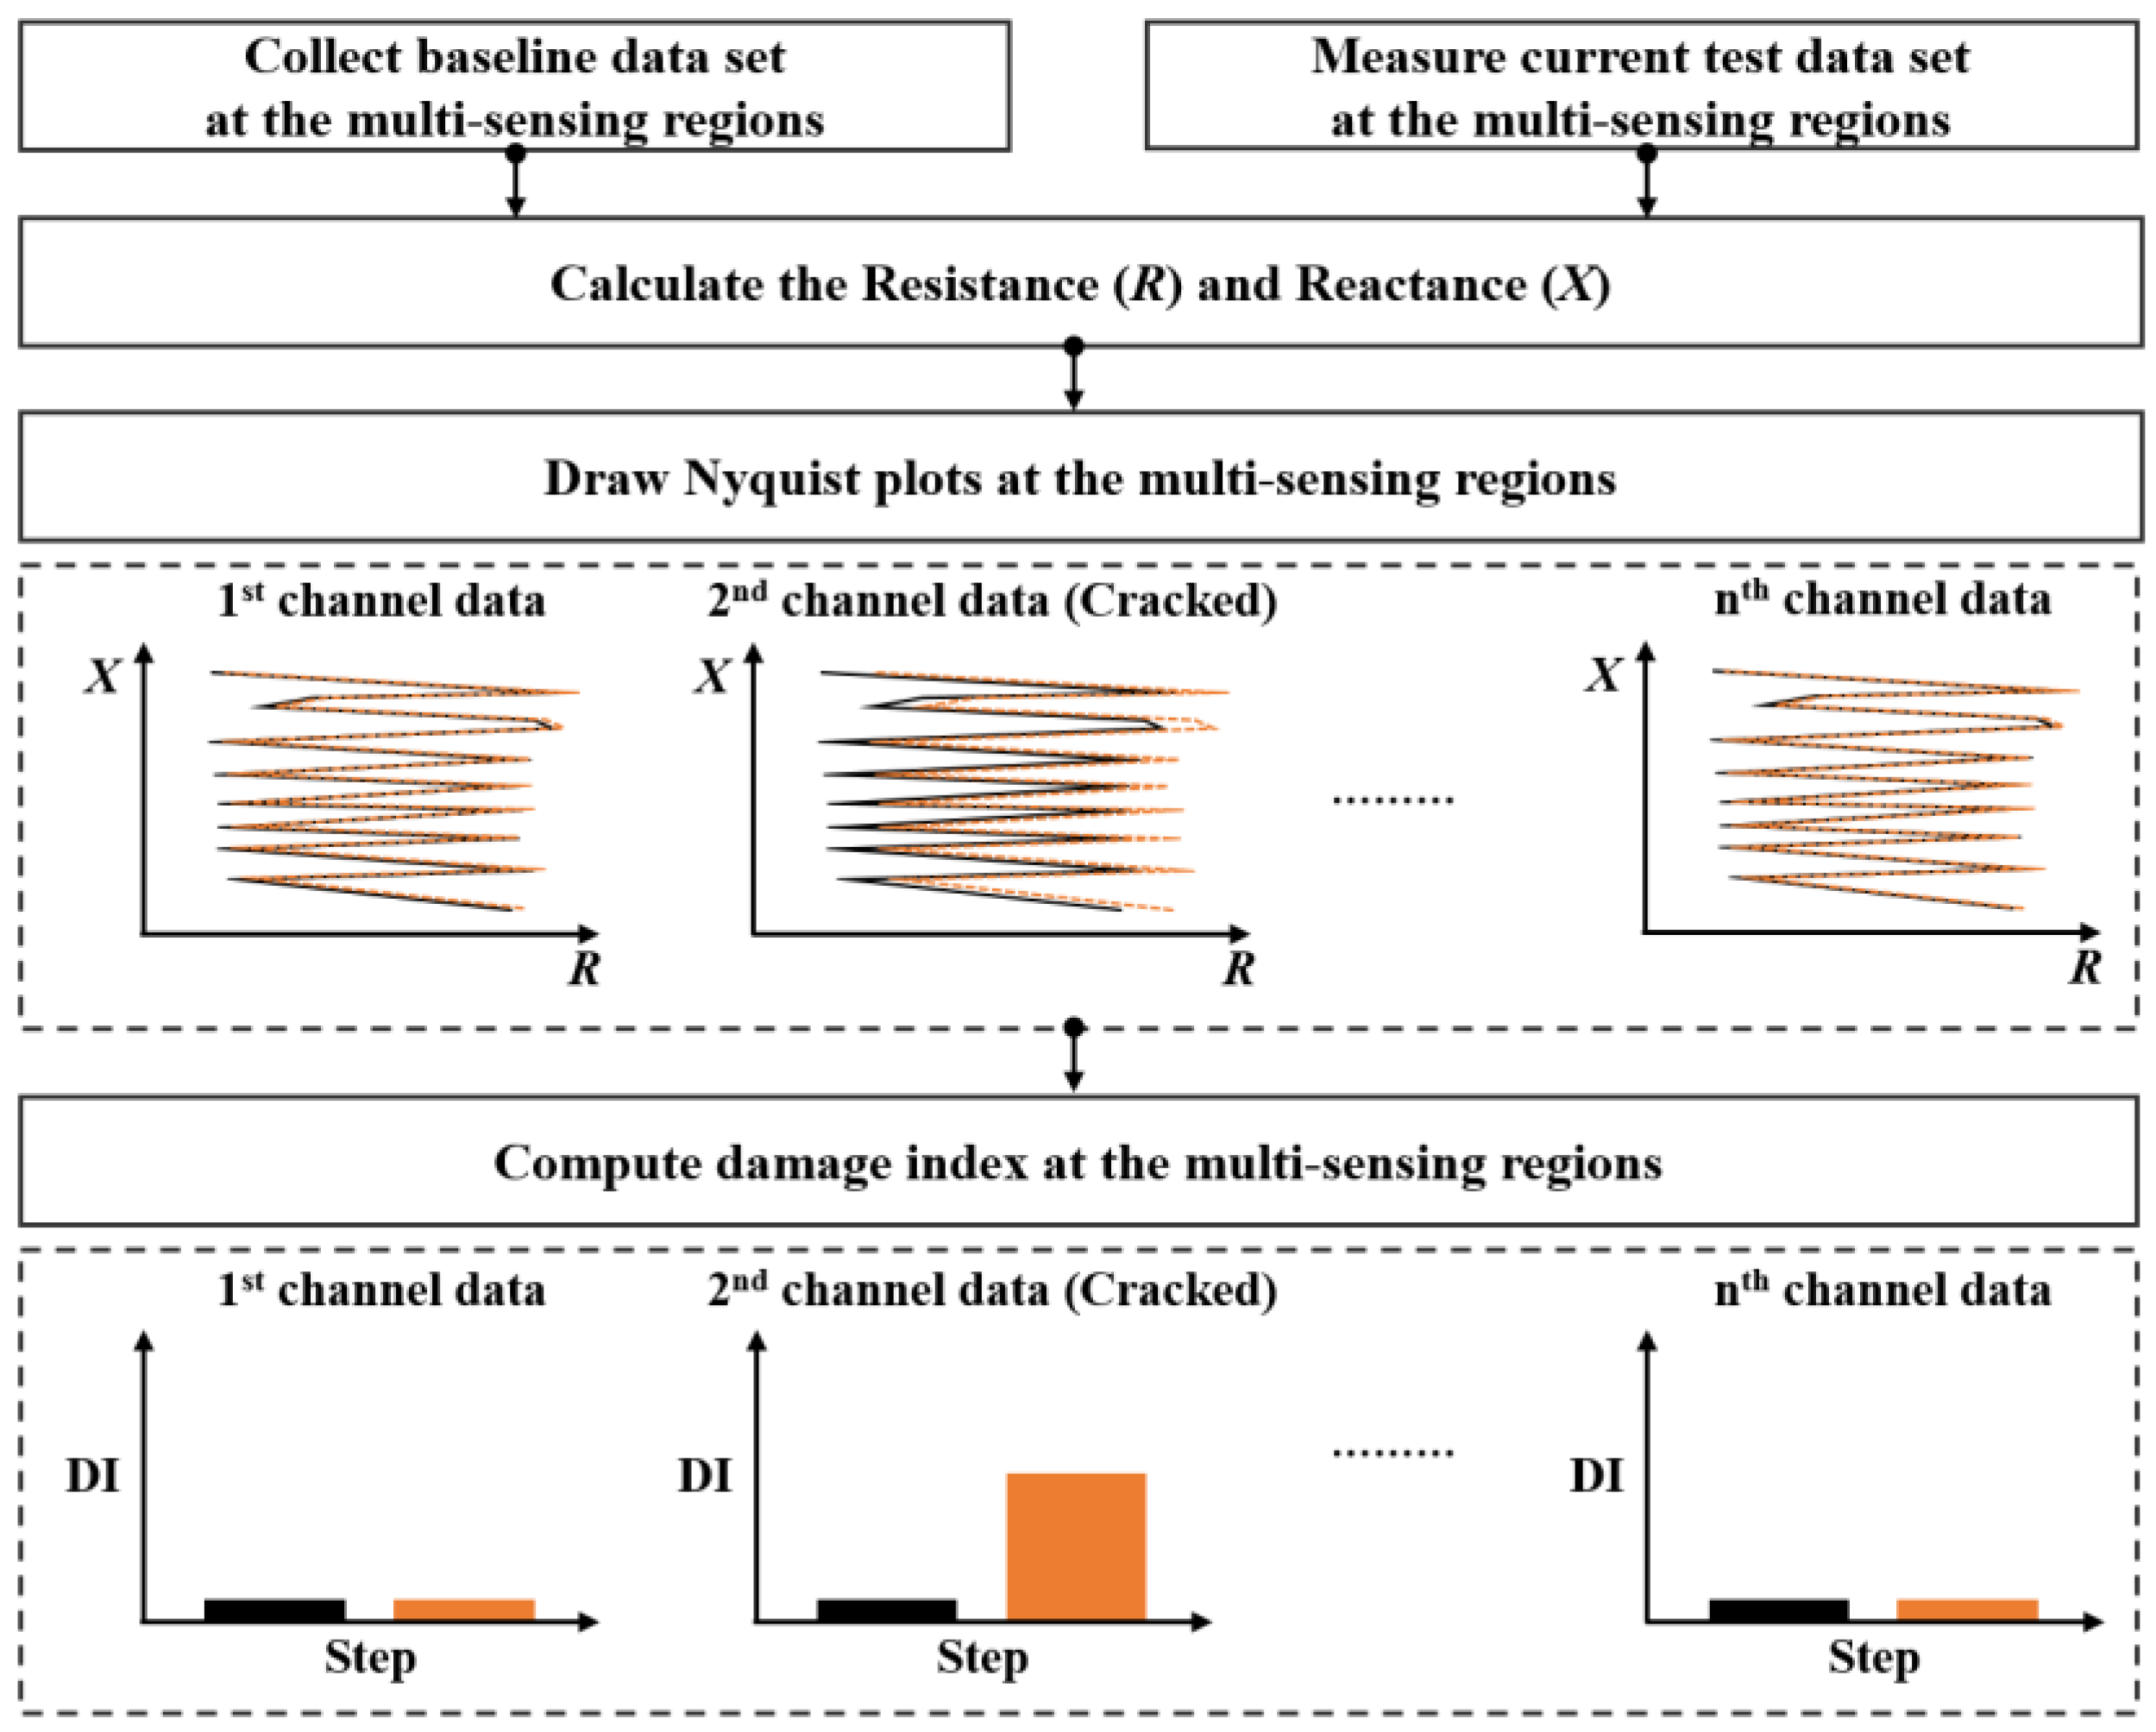
2.3. Crack Localization Algorithm

Figure 2 describes the overall procedure of the crack localization algorithm. The details of each step are as follows. First, baseline datasets including resistance (R) and reactance (X) are collected at the multiple sensing regions using the developed instantaneous multi-channel electrical impedance acquisition system. It is assumed that the baseline data set is collected from the pristine condition of FRCCs. Second, the test data set is measured from the current state of FRCCs at the same sensing regions. Then, the corresponding Nyquist plots are made using both R and X. Next, the Euclidean distances of the Nyquist plots between baseline and test data sets are computed, and damage index (DI) is then calculated as the sum of the Euclidean distances from starting to ending frequencies using Equation (2).
DI   =   f s f e ( x n i x 0 i ) 2 + ( y n i y 0 i ) 2 ,
where x n i and y n i means the R and X in the nth step of i Hz. The subscript 0 denotes the pristine condition. The f s and f e are the starting and ending frequencies, respectively. In case of environmental conditions change in FRCCs, DIs’ in the multiple sensing regions will be simultaneously increased. On the other hand, if cracks are initiated at a certain sensing region, only DI at the corresponding sensing region is straightforwardly increased.

3. Experimental Validation

Based on the developed system and algorithm, the feasibility tests are performed. First, the temperature effects on the electrical impedance and DI, which is one of the biggest error sources in the making-decision for crack detection [44], are investigated. Then, three-point bending tests are conducted for validating the proposed crack localization algorithm.

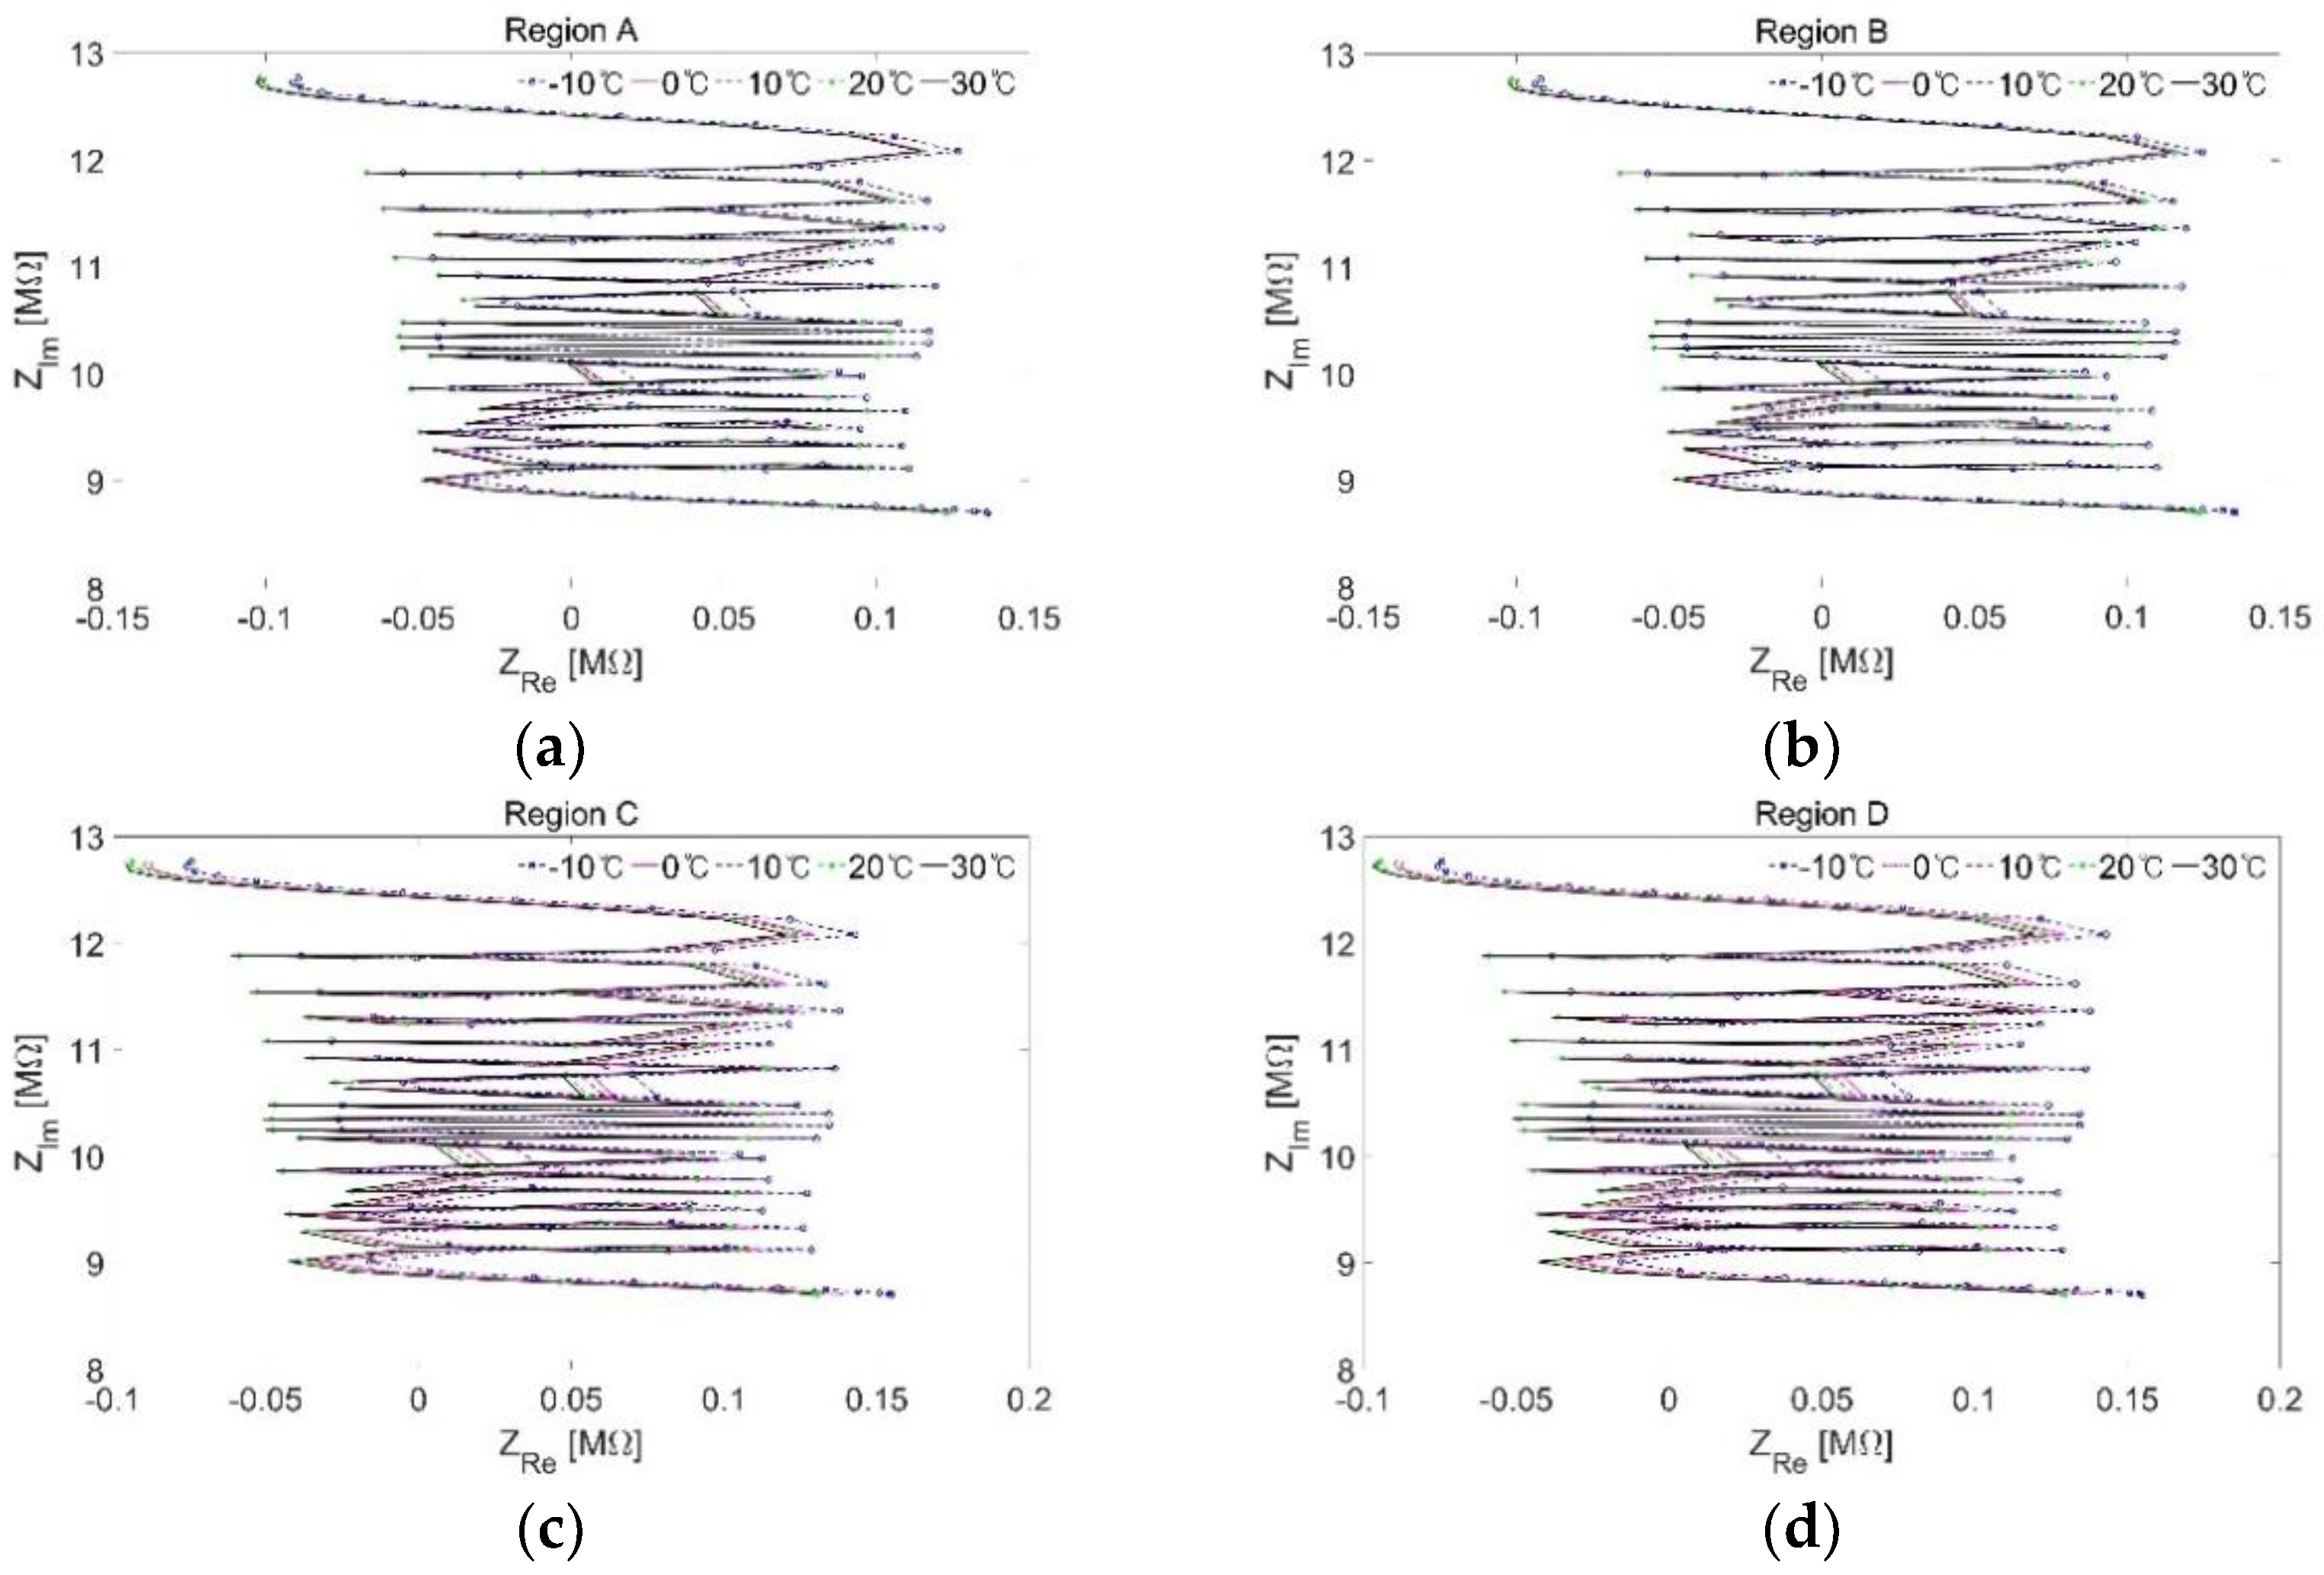
3.1. Investigation of Temperature Variation Effects

To validate the assumption that DIs’ at multiple sensing regions are simultaneously changed due to temperature variation, the temperature variation effects on multi-region DIs’ are investigated. The test setup for investigating temperature variation effects is shown in Figure 3. AWG (NI PXI-5412) generates the chirp input waveform with a broad frequency ranged from 100 Hz to 150 Hz, and digitizer (NI PXI-5122) simultaneously measures the corresponding responses with a sampling rate of 1 MHz. The responses are 5 times measured and averaged in the time domain to avoid undesired noise components. The reference capacitor of 10 nF is used for the self-sensing circuit. For the temperature variation effect tests, the temperature data sets are collected from the intact condition of the FRCCs at −10 °C, 0 °C, 10 °C, 20 °C and 30 °C with a relative humidity 60% using a temperature chamber. The representative temperature variation test results are shown in Figure 4.
The multiple sensing regions of the FRCCs specimens are designed as Regions A, B, C and D as described in Figure 1. The Nyquist plots overall move to the left as the temperature increases. It can be observed that the temperature increase leads to simultaneously affect to the all sensing regions. The physical reason is speculated that the temperature changes cause the change of the ion mobility along the internal electrical bridge of FRCCs, although the absolute values might be different in each region because of FRCCs’ inhomogeneity.
Figure 5 shows the DIs’ computed from the temperature variation test results. The baseline data set is assumed as the data at −10 °C in each region. Although the maximum DIs’ at each region are different as expected, the similar changing patterns are observed at all sensing regions.

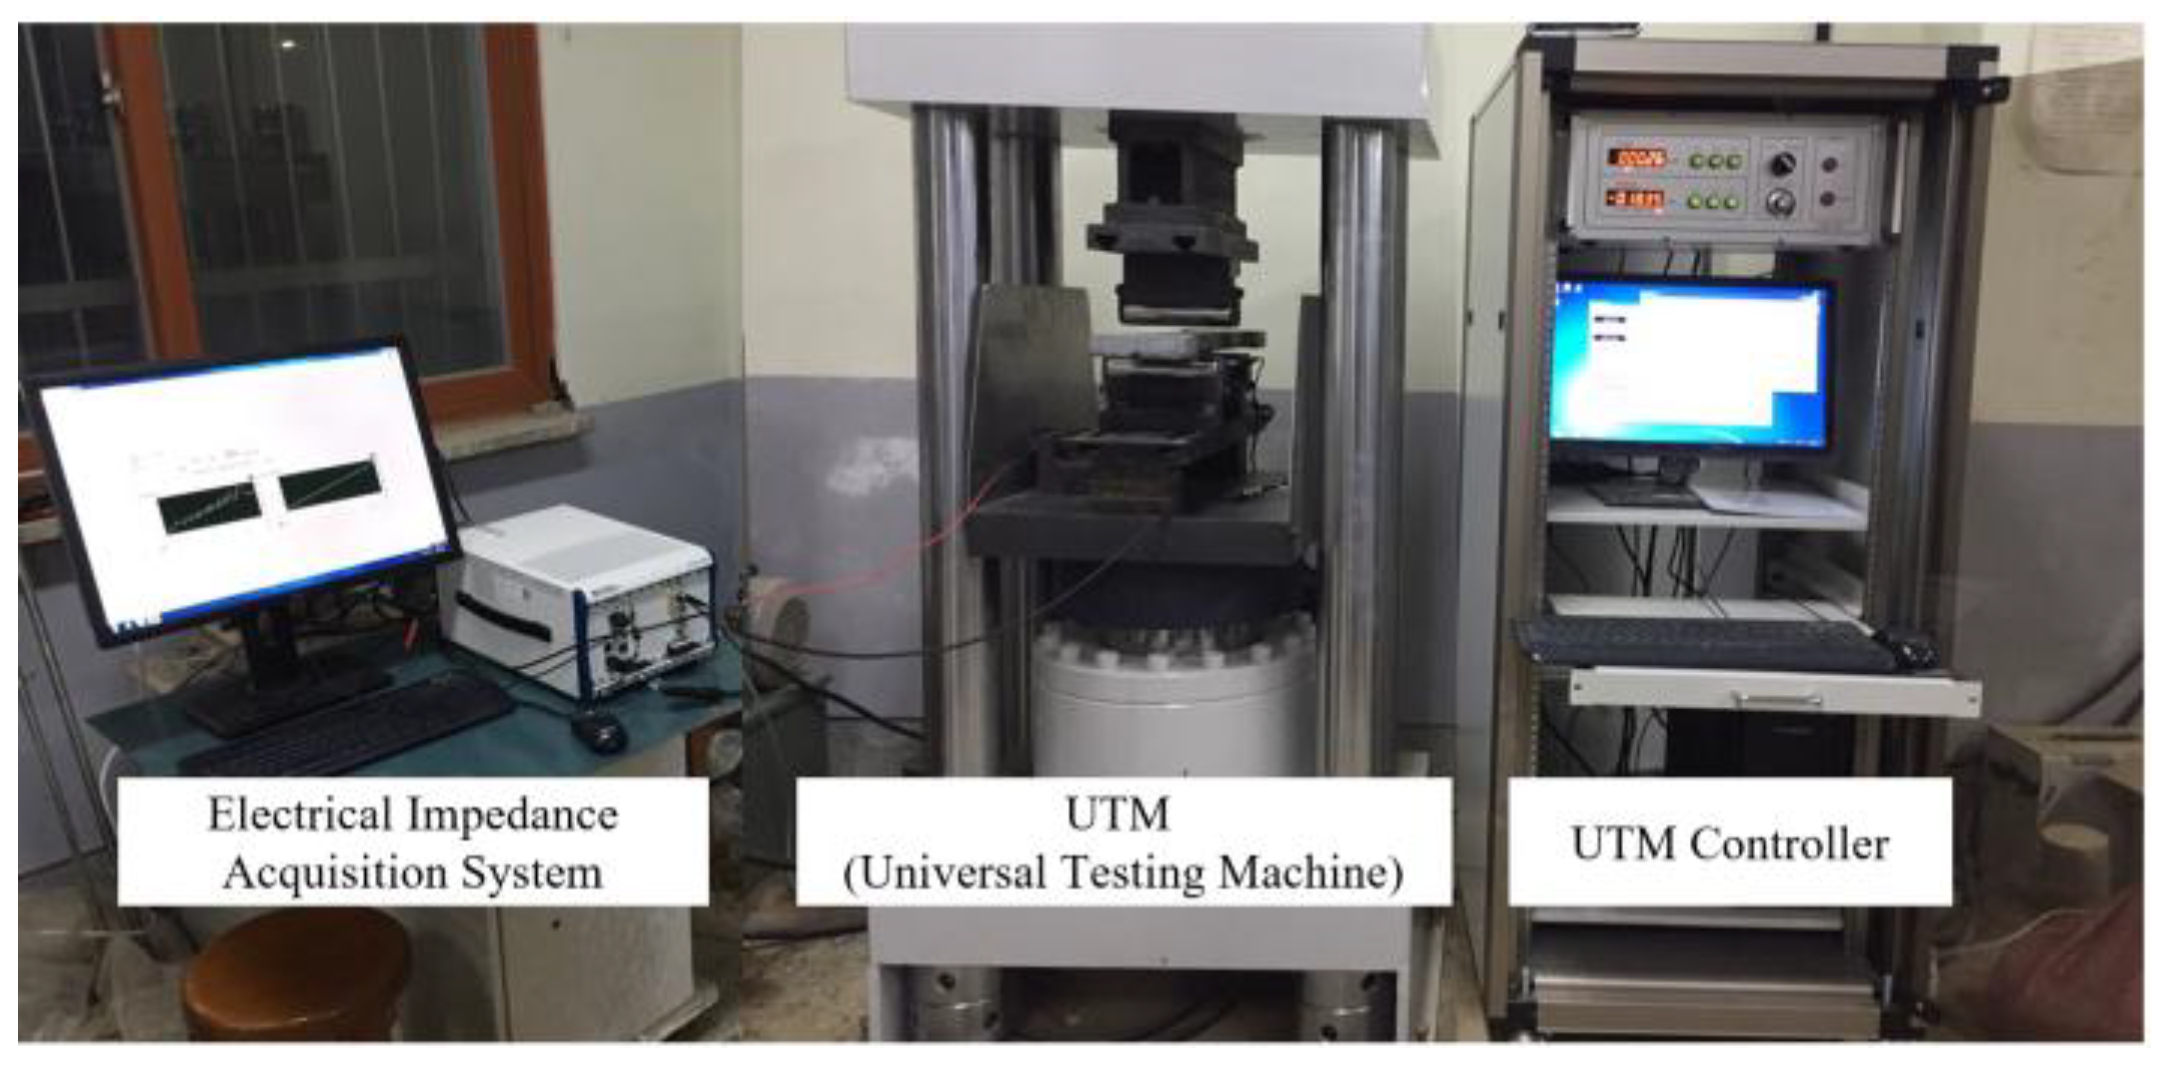
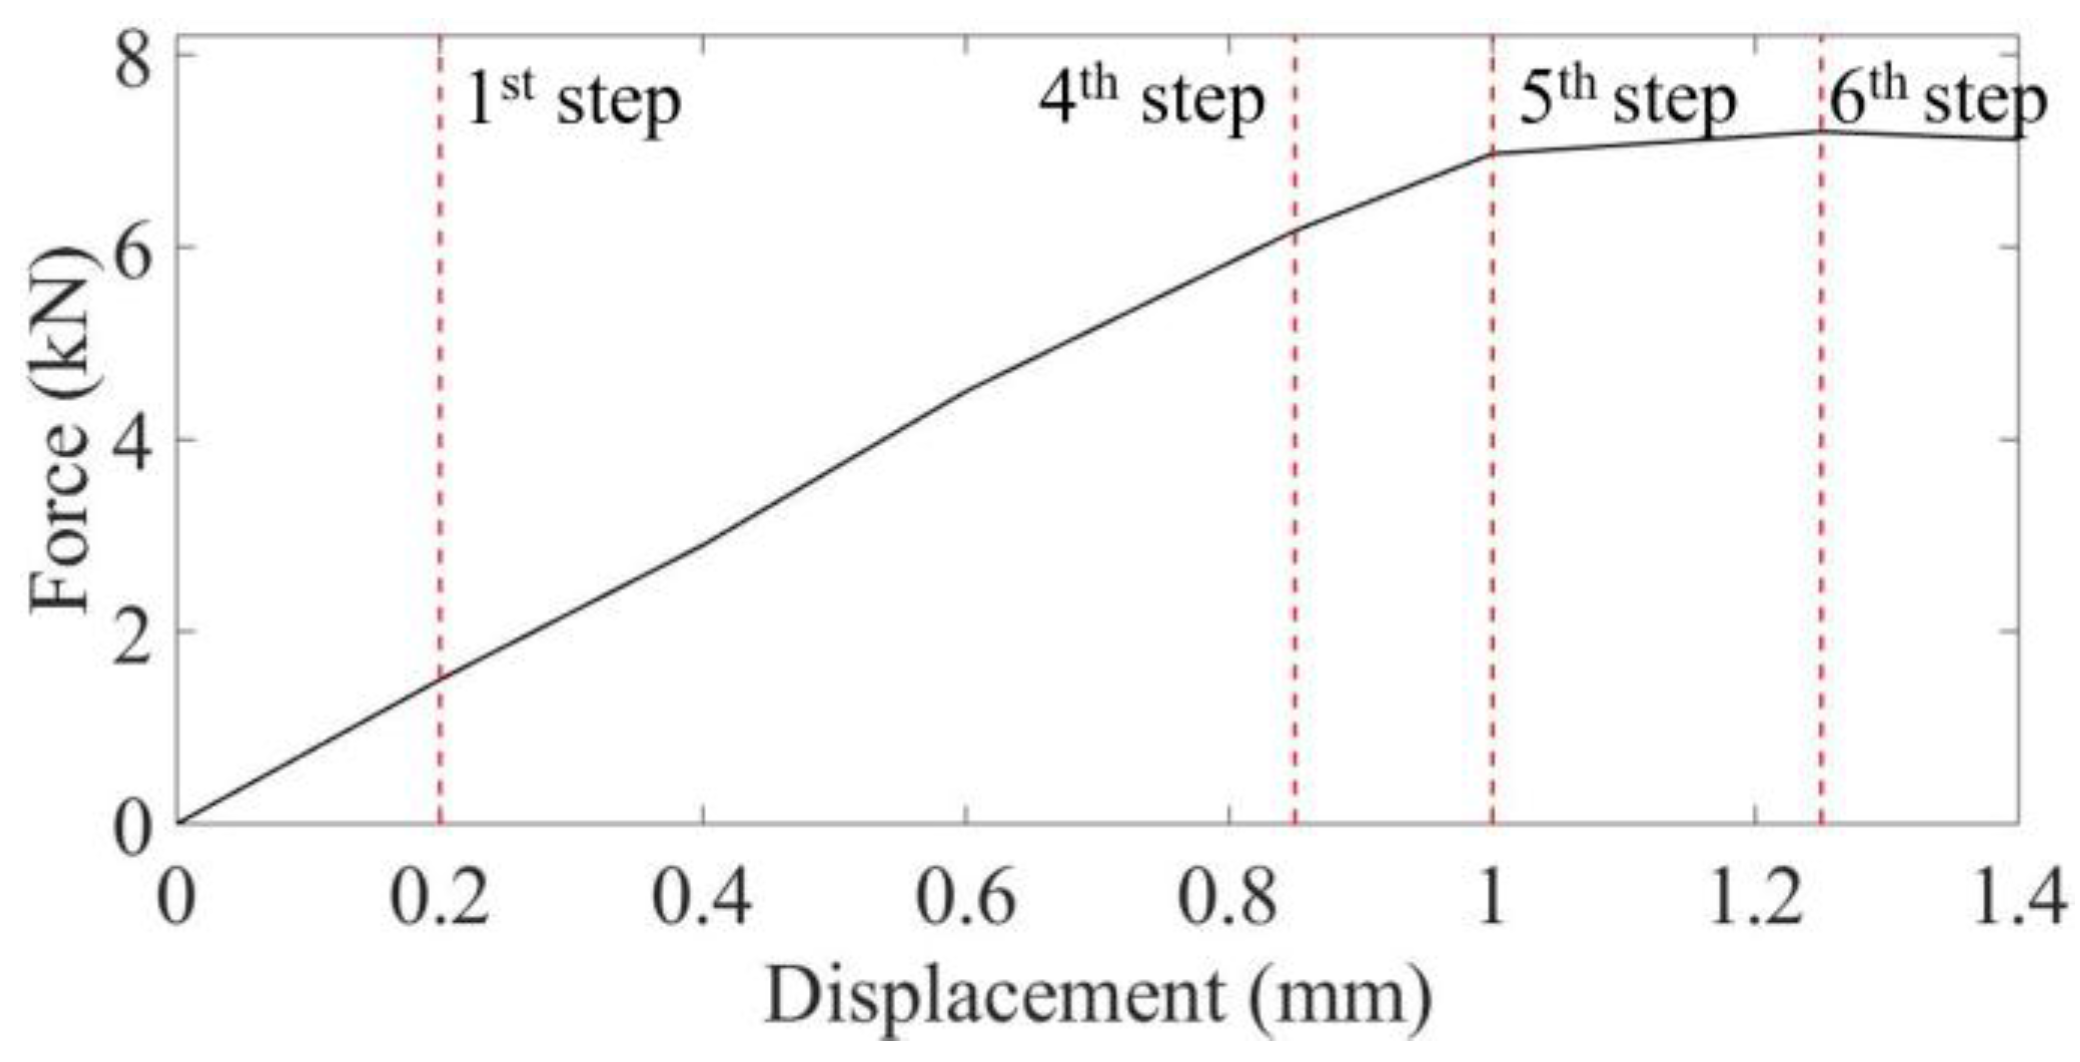
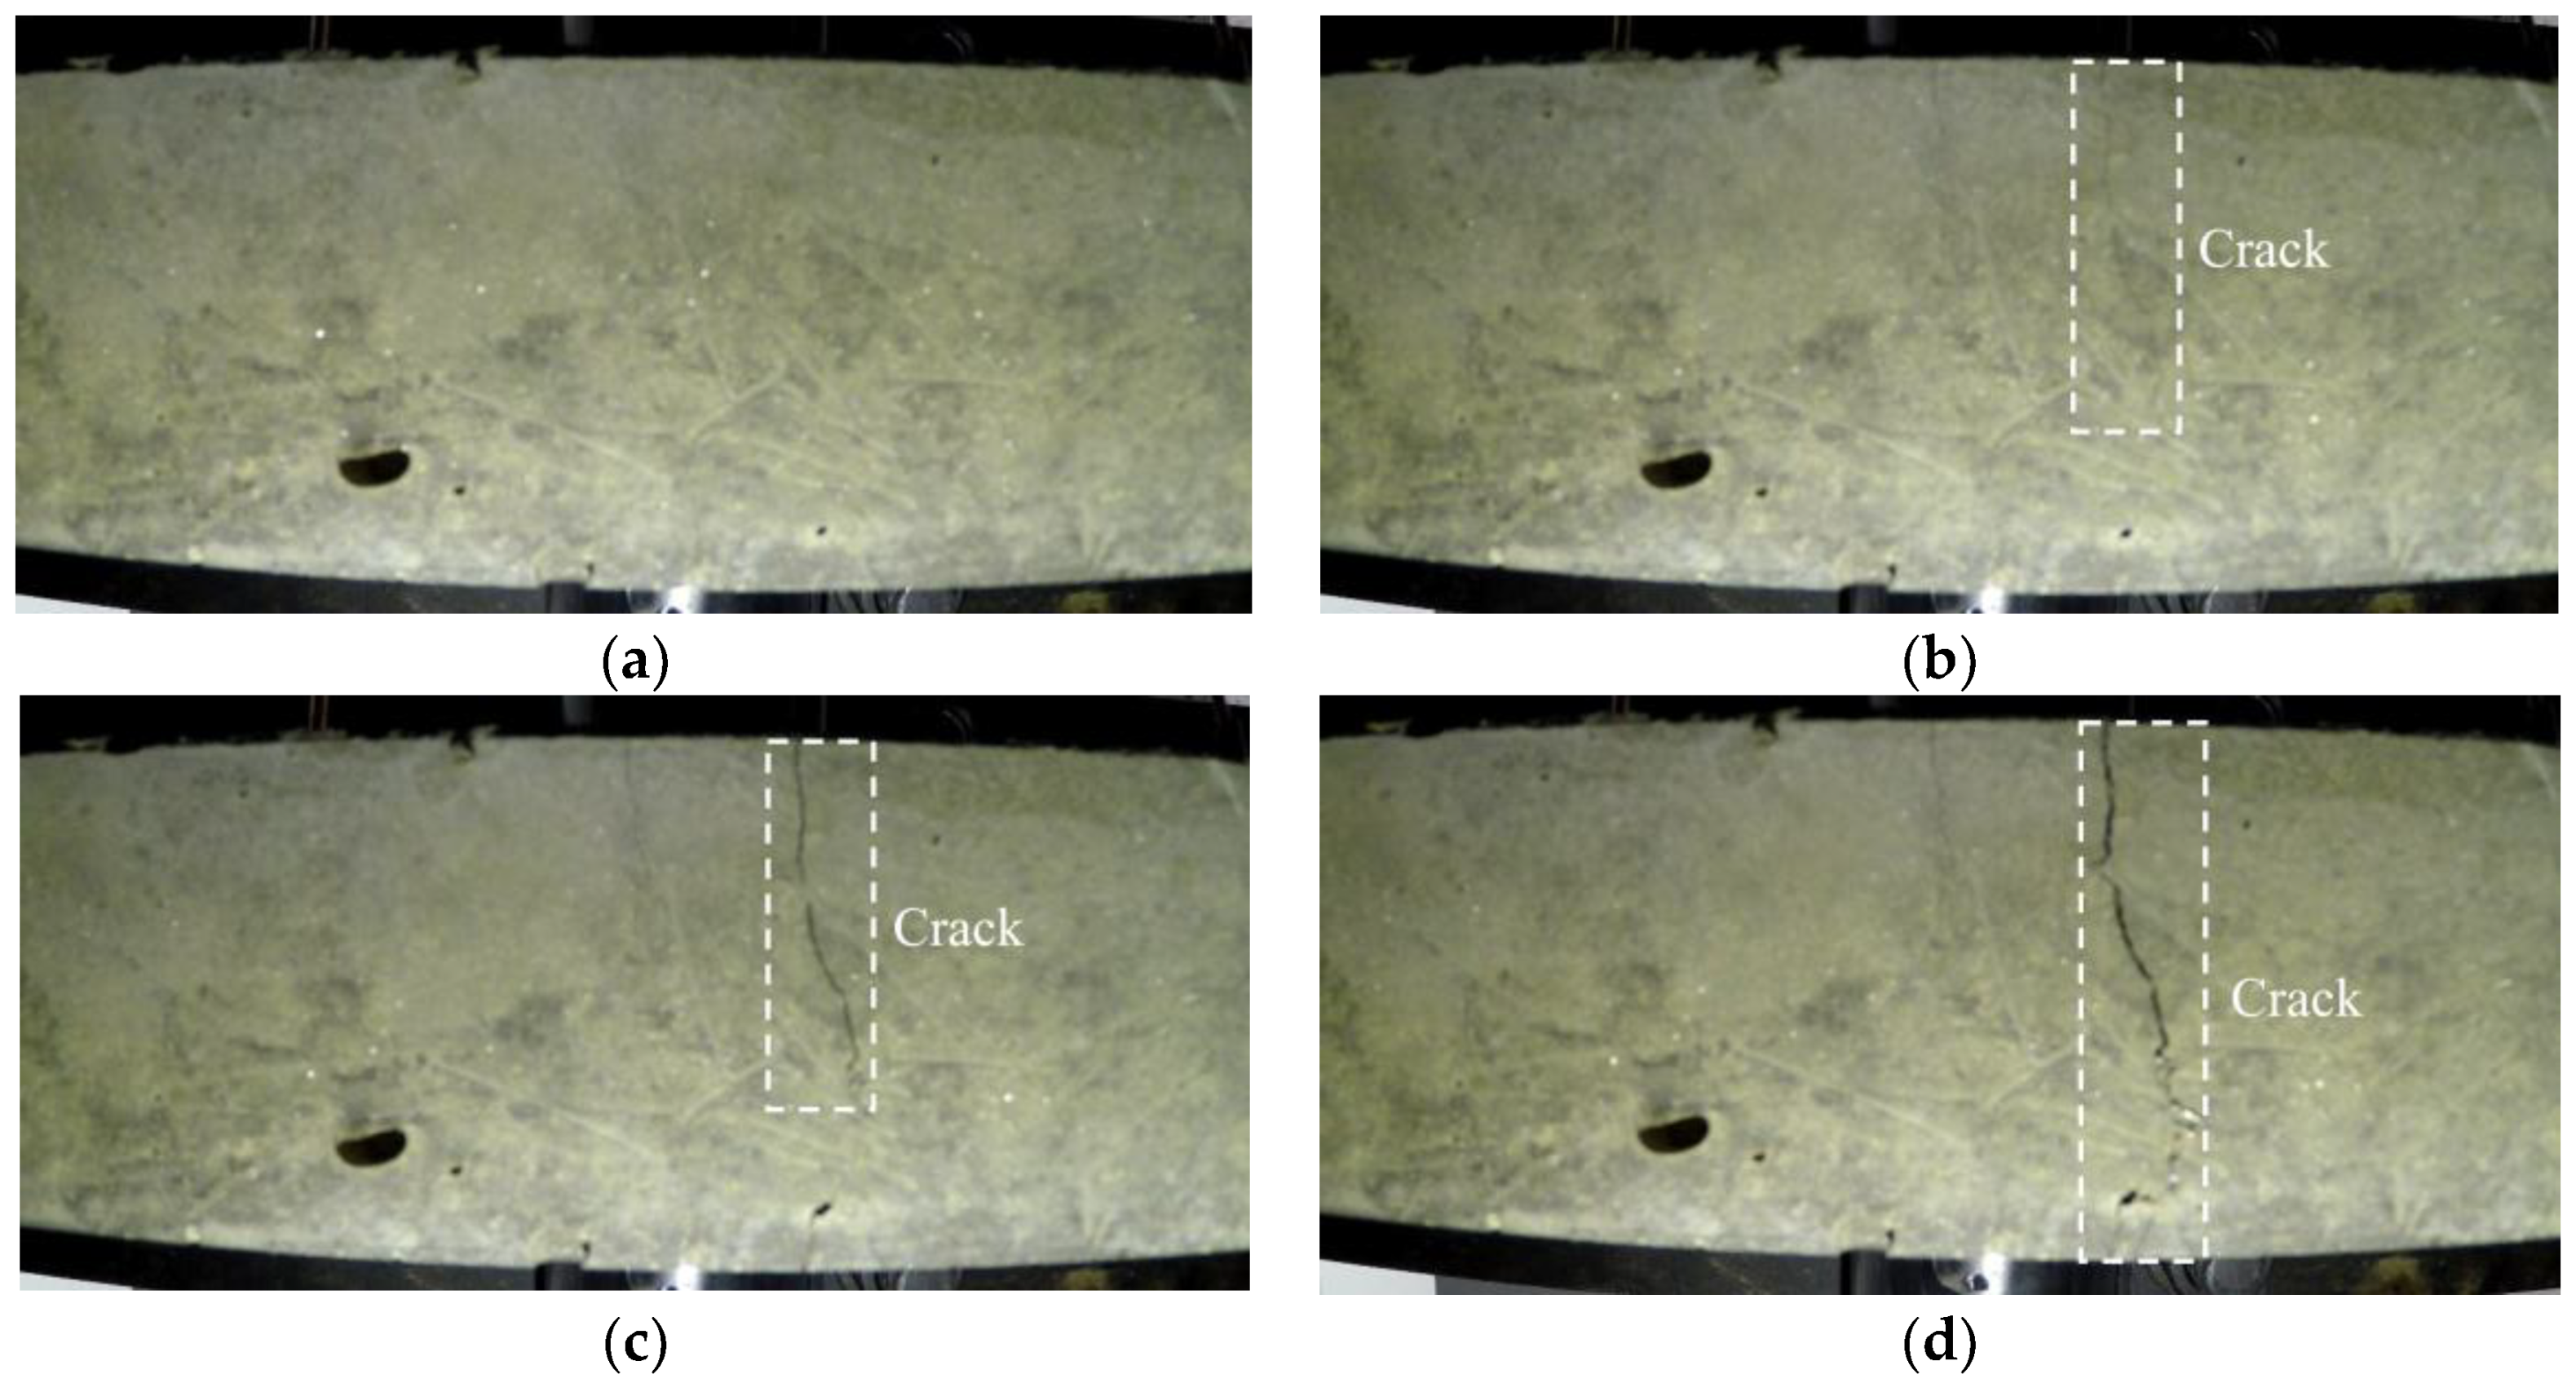
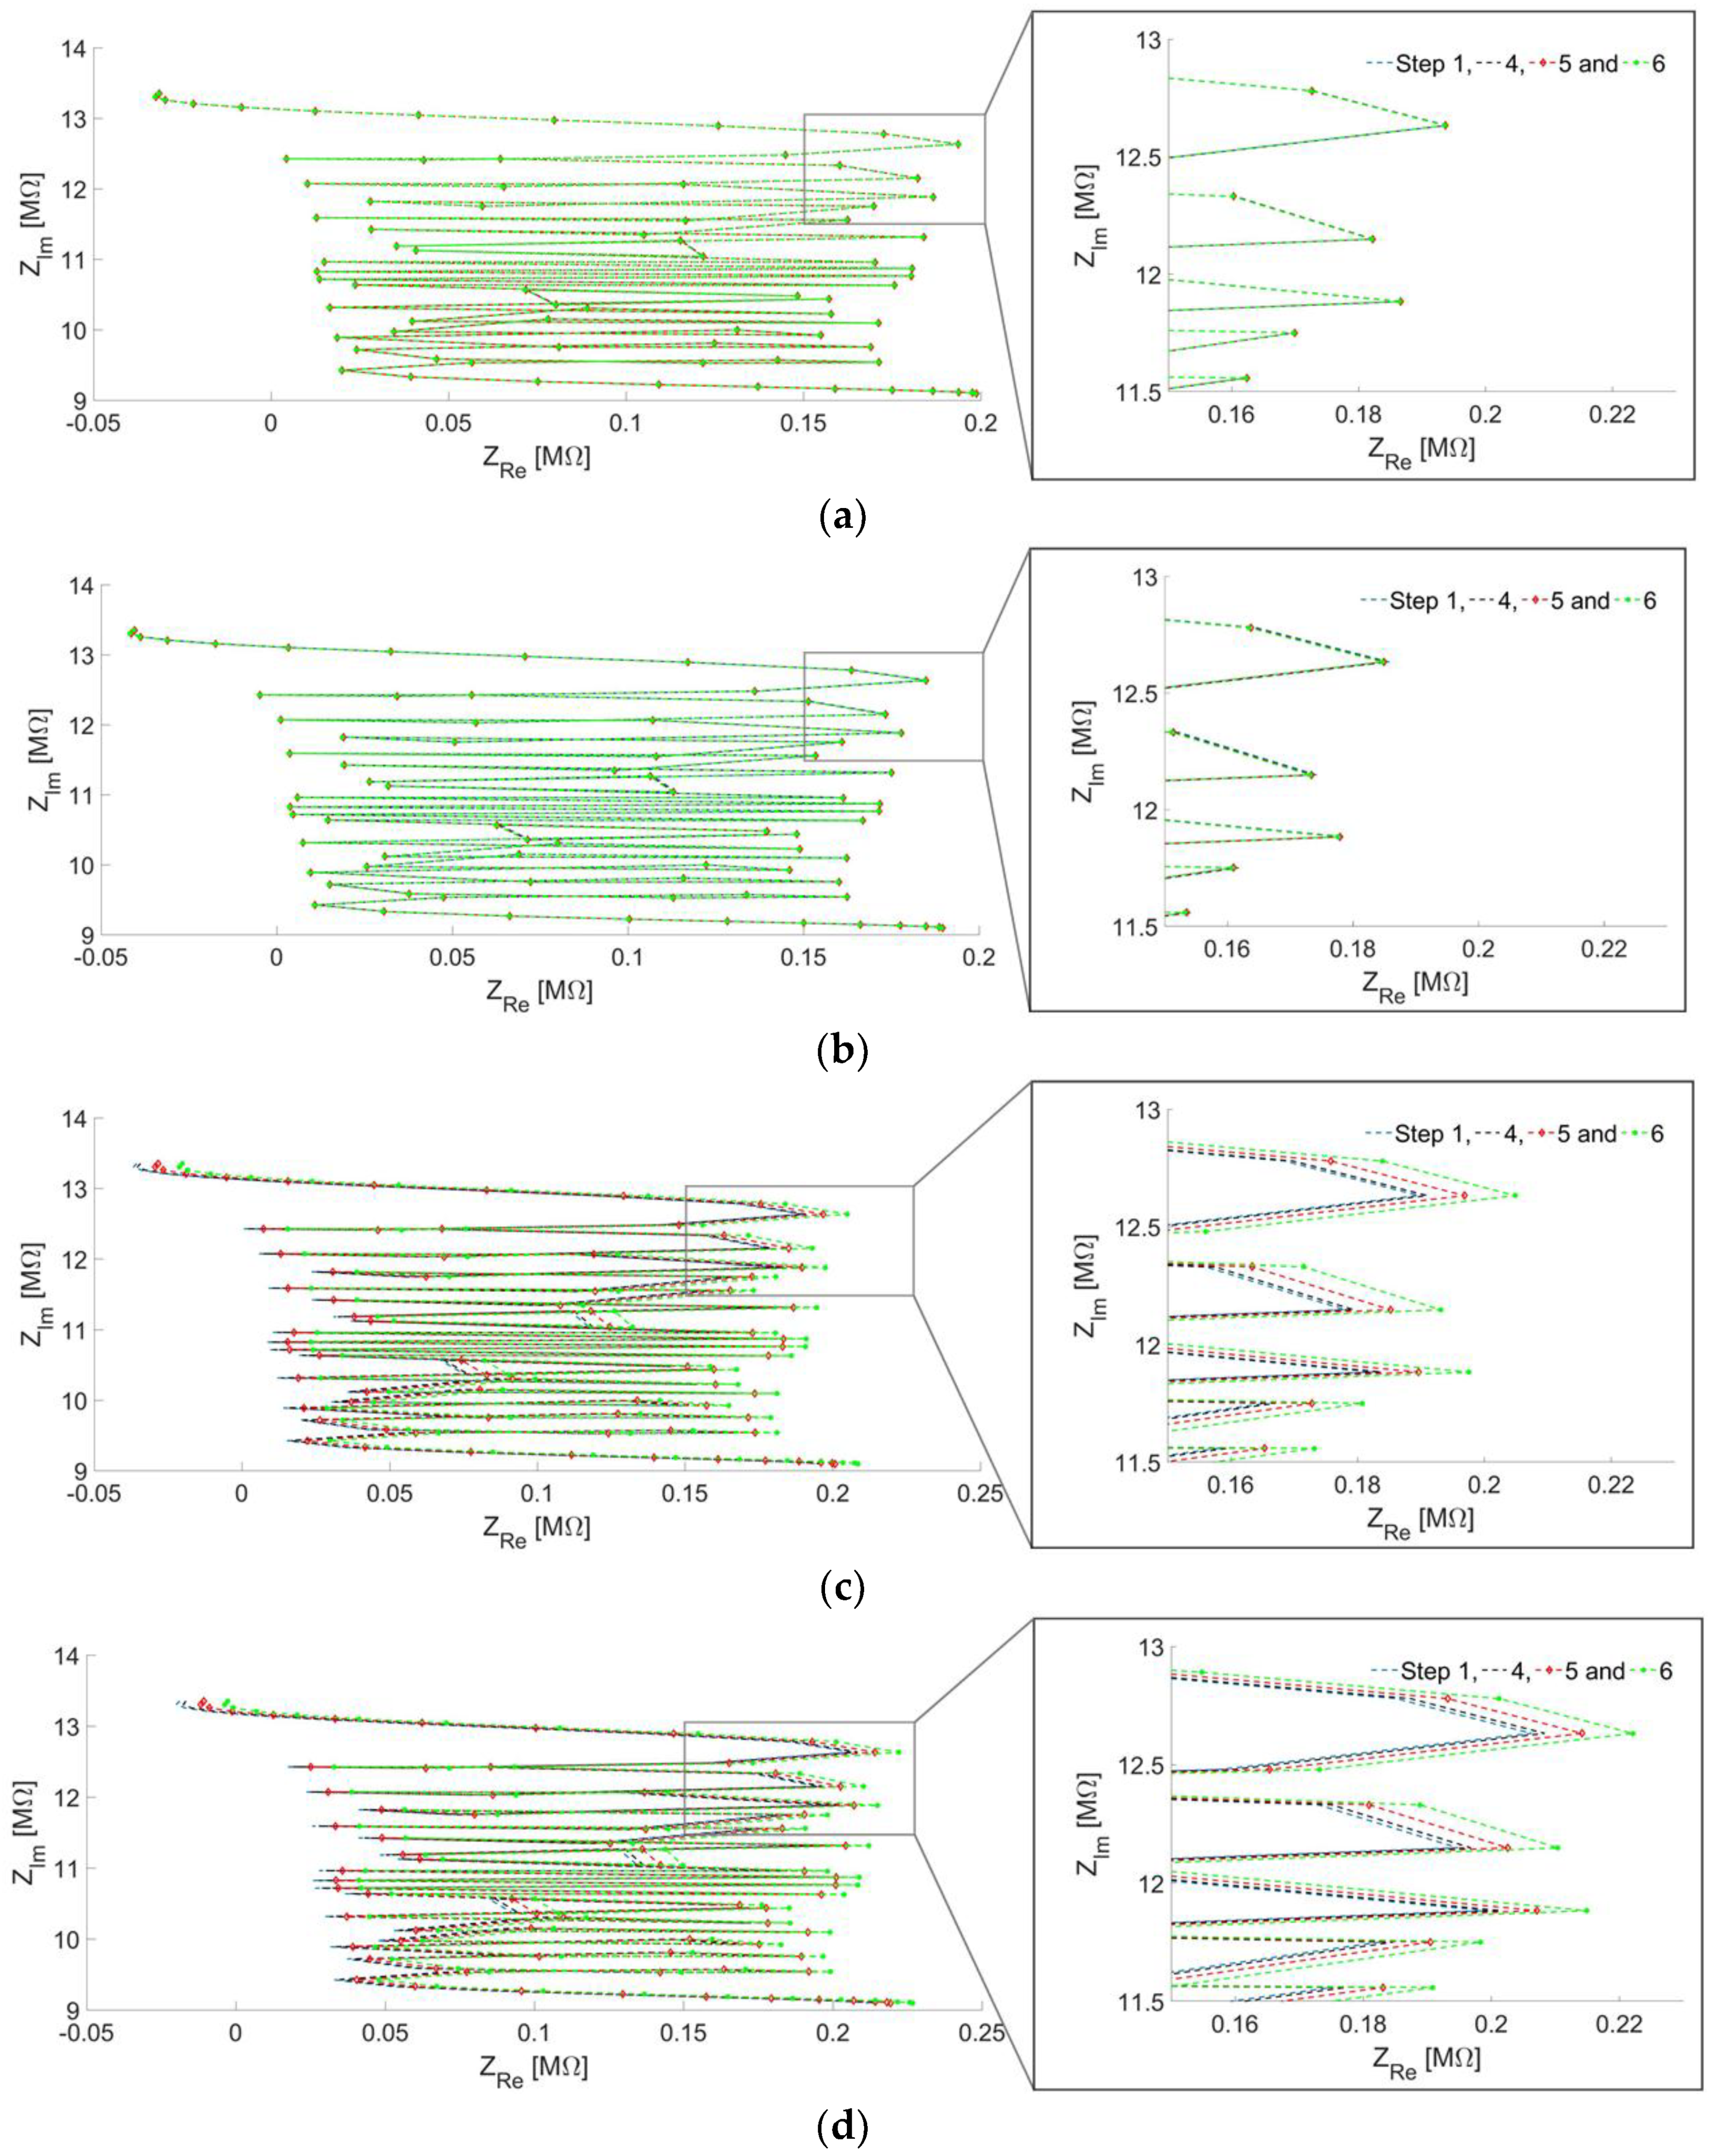
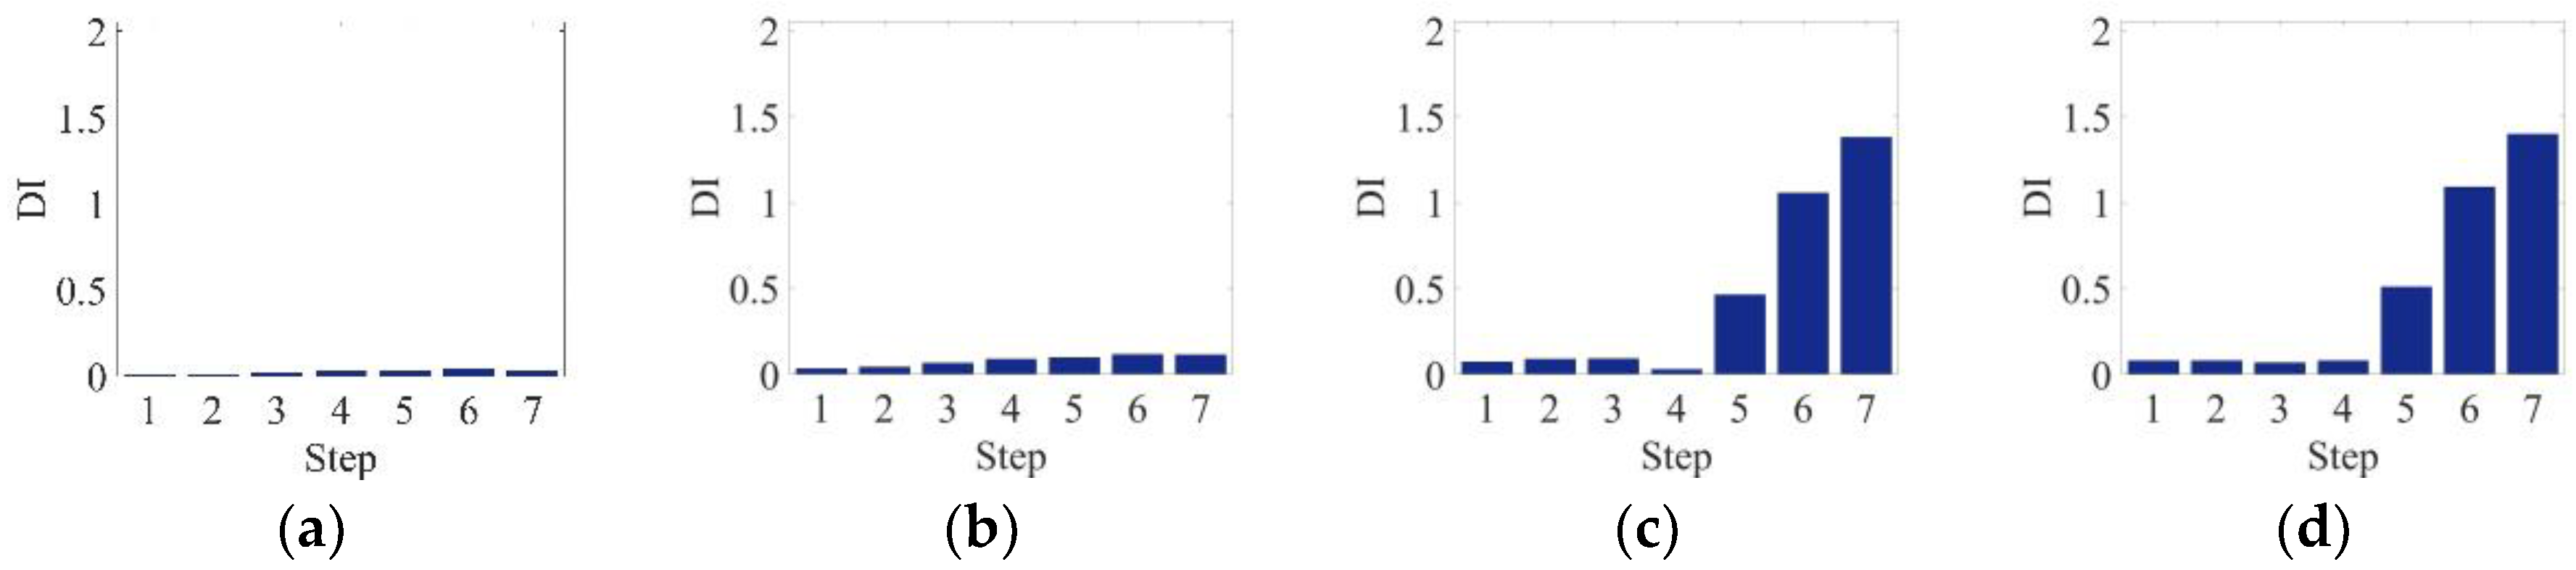
3.2. The Three-Point Bending Load Tests

The three-point bending tests are performed as shown in Figure 6. The universal testing machine (UTM) controller sends to the trigger signal to UTM. Then, the loading step is controlled by displacement using the UTM. After each loading step, the multi-channel electrical impedance acquisition system measures the impedance signals of the FRCCs specimens. The loading steps consist of seven steps, i.e., 0.2 mm (1st step), 0.4 mm (2nd step), 0.6 mm (3rd step), 0.85 mm (4th step), 1 mm (5th step), 1.25 mm (6th step), 1.4 mm (7th step), and no loading data (baseline data set) is also measured. The yielding region of the representative test specimen is observed from the 1st step to the 4th step, and the rupture region is revealed from the 5th step to the 7th step. The corresponding force-displacement curve of the test specimen is shown in Figure 7. Note that the data sets are obtained at 15 °C.
Figure 8 shows the representative crack patterns initiated at the bottom of the specimen according to the loading steps. After applying bending loads up to 0.65 mm displacement, the cracking phenomenon is observed in the bottom view compared with the 1st step (Figure 8a), as shown in Figure 8b. This visible crack occurs in the elastic region, called closed-type crack that can be restored. However, the sequentially created cracks, called open cracks showed in Figure 8c,d, cannot be restored. This is due to the sequentially created crack being in the plastic region.
Figure 9 shows the representative Nyquist plots of each region according to the bending loading steps. For better visibility, Nyquist plots of each region are zoomed as shown in Figure 9. The cracks are located in Regions C and D. Figure 9a,b show that the Nyquist plots are barely changed in the non-cracked regions, i.e., Regions A and B, while there are significant changes in the cracked Regions C and D, as shown in Figure 9c,d.
Based on the DI computation using Equation (2), the crack location can be more clearly observed as shown in Figure 10. As the loading step is increased, DIs’ are remarkably increased at the cracked Regions C and D. The physical meaning is that the steel fibers inside the FRCCs become more separated as the bending deformation progresses.
In order to confirm the consistency of the test results, the similar tests are repeated using other three FRCCs specimens. The cracks similarly occur nearby the center location of the specimens due to three-point bending loads. The second and fourth specimens’ cracks are initiated at Regions B and C, and the third specimens’ cracks are initiated at Regions C and D. Figure 11 shows that remarkable DIs’ are clearly observed at the cracked regions of each specimen. Although the DI value changing times are different depending on the FRCCs specimen, one can easily make the decision of the crack location using Figure 11. It is speculated that it is practically difficult to precisely control the fiber distribution and arrangement inside FRCCs during the manufacturing process. To secure the quantitative crack analysis, it is necessary to establish a standard FRCCs manufacturing process. According to the validation test results, it can be concluded that the proposed technique can measure instantaneously electrical impedance at multiple sensing regions, and crack detection, as well as localization, can be achieved without considering temperature change.

4. Discussion

This paper proposed a crack localization technique of FRCCs by developing a multi-channel electrical impedance acquisition system. The proposed technique was experimentally validated using specially manufactured four FRCCs specimens under temperature change and three-point bending loading conditions. The test results reveal that the electrical impedance signal change was dominant in only cracked regions compared to non-cracked regions, while the signal change induced by temperature variation showed a similar pattern in all sensing regions. It can be concluded that the proposed technique can be effectively used for crack detection and localization even under temperature variation conditions. However, the quantitative crack analysis is difficult, because the electrical impedance signals are significantly affected by the distribution and orientation of conductive fibers inside FRCCs. Although the feasibility of the proposed technique is demonstrated in this paper, the standardization of the FRCCs manufacturing process is necessary before the real field SHM applications. As the follow-up work, the influence of the orientation and distribution of internal conductive fibers inside FRCCs is now being investigated. Also, the detachable electrodes such as copper tapes will be tested instead of embedded electrodes for convenient of real field SHM application. Then, the fiber mixing control technique based on electromagnetic actuators will be developed. Furthermore, the proposed technique will be applied to various real scale structures.

Author Contributions

Y.-K.A., H.Y. and D.K. conceived and designed this study. H.L. and M.-S.K. made test specimens and tested. M.-S.K. and Y.-K.A. performed data analysis and wrote the entire manuscript.

Funding

This research was supported by a grant (18CTAP-C143065-01) from Infrastructure and transportation technology promotion research Program funded by Ministry of Land, Infrastructure and Transport of the Korean government.

Conflicts of Interest

The authors declare that they have no conflict of interest.

References

  1. Lomborg, B. The Skeptical Environmentalist: Measuring the Real State of the World; Cambridge University Press: Cambridge, UK, 1998; p. 138. ISBN 978-0-521-80447-9. [Google Scholar]
  2. Neild, S.A.; Williams, M.S.; Mcfadden, P.D. Development of vibrating wire strain gauge for measuring small strains in concrete bemas. Strain 2005, 41, 3–9. [Google Scholar] [CrossRef]
  3. Kageyama, K.; Murayama, H.; Ohsawa, I.; Kanai, M.; Nagata, K.; Machijima, Y.; Matsumura, F. Acoustic emission monitoring of a reinforced concrete structure by applying new fiber-optic sensors. Smart Mater. Struct. 2005, 14, S52–S59. [Google Scholar] [CrossRef]
  4. Verstrynge, E.; Pfeiffer, H.; Wevers, M. A novel technique for acoustic emission monitoring in civil structures with global fiber optic sensors. Smart Mater. Struct. 2014, 23, 1–9. [Google Scholar] [CrossRef]
  5. Paul, S.C.; Pirskawetz, S.; Zijl, G.P.A.G.; Schmidt, W. Acoustic emission for characterizing the crack propagation in strain-hardening cement-based composites. Cem. Concr. Res. 2015, 69, 19–24. [Google Scholar] [CrossRef]
  6. Pimentel, R.; Guedes, T.; Melo, L.; Ferreira, G.; Goncalves, M. Damage detection assessment in reinforced concrete slabs using impact tests. Procedia Eng. 2017, 199, 1976–1981. [Google Scholar] [CrossRef]
  7. Ribolla, E.L.M.; Hajidehi, M.R.; Rizzo, P.; Scimemi, G.F.; Spada, A.; Giambanco, G. Ultrasonic inspection for the detection of debonding in CFRP-reinforced concrete. Struct. Infrastruct. Eng. 2018, 14, 807–816. [Google Scholar] [CrossRef]
  8. Voutetaki, M.E.; Papadopoulos, N.A.; Angeli, G.M.; Providakis, C.P. Investigation of a new experimental method for damage assessment of RC beams falling in shear using piezoelectric transducers. Eng. Struct. 2016, 114, 226–240. [Google Scholar] [CrossRef]
  9. Yang, Y.; Hu, Y.; Lu, Y. Sensitivity of PZT impedance sensors for damage detection of concrete structures. Sensors 2008, 8, 327–346. [Google Scholar] [CrossRef] [PubMed]
  10. Providakis, C.P.; Stefanaki, K.D.; Voutetaki, M.E.; Tsompanakis, Y.; Stavroulaki, M. Damage detection in concrete structures using a simultaneously activated multi-mode PZT active sensing system: Numerical modelling. Struct. Infrastruct. Eng. 2014, 10, 1451–1468. [Google Scholar] [CrossRef]
  11. Ai, D.; Luo, H.; Wang, C.; Zhu, H. Monitoring of the load-induced RC beam structural tension/compression stress and damage using piezoelectric transducers. Eng. Struct. 2018, 38–51. [Google Scholar] [CrossRef]
  12. Rucka, M.; Wilde, K. Experimental study on ultrasonic monitoring of splitting failure in reinforced concrete. J. Nondestruct. Eval. 2013, 32, 372–383. [Google Scholar] [CrossRef]
  13. Song, F.; Huang, G.L.; Kim, J.H.; Haran, S. On the study of surface wave propagation in concrete structures using a piezoelectric actuator/sensor system. Smart Mater. Struct. 2008, 17, 1–8. [Google Scholar] [CrossRef]
  14. Divsholi, B.S.; Yang, Y. Combined embedded and surface-bonded piezoelectric transducers for monitoring of concrete structures. NDT E Int. 2014, 65, 28–34. [Google Scholar] [CrossRef]
  15. Genenko, Y.A.; Glaum, J.; Hoffmann, M.J.; Albe, K. Mechanisms of aging and fatigue in ferroelectrics. Mater. Sci. Eng. B 2015, 192, 52–82. [Google Scholar] [CrossRef]
  16. An, Y.K.; Lim, H.J.; Kim, M.K.; Yang, J.Y.; Sohn, H.; Lee, C.G. Application of local reference-free damage detection techniques to in situ bridges. J. Struct. Eng. 2014, 140. [Google Scholar] [CrossRef]
  17. An, Y.K.; Park, B.J.; Sohn, H. Complete noncontact laser ultrasonic imaging for automated crack visualization in a plate. Smart Mater. Struct. 2013, 22, 1–10. [Google Scholar] [CrossRef]
  18. Barazzetti, L.; Scaioni, M. Crack measurement: Development, testing and applications of an automatic image-based algorithm. ISPRS J. Photogramm. 2009, 64, 285–296. [Google Scholar] [CrossRef]
  19. Nguyen, H.N.; Kam, T.Y.; Cheng, P.Y. An automatic approach for accurate edge detection of concrete crack utilizing 2D geometric features of crack. J. Signal Process. Syst. 2014, 77, 221–240. [Google Scholar] [CrossRef]
  20. Talab, A.M.A.; Huang, Z.; Xi, F.; Liu, H. Detection crack in image using Otsu method and multiple filtering in image processing techniques. Optik 2016, 127, 1030–1033. [Google Scholar] [CrossRef]
  21. Giri, P.; Kharkovsky, S. Detection of surface crack in concrete using measurement technique with laser displacement sensor. IEEE Trans. Instrum. Meas. 2016, 65, 1951–1953. [Google Scholar] [CrossRef]
  22. Sham, F.C.; Chen, N.; Long, L. Surface crack detection by flash thermography on concrete surface. Insight 2008, 50, 240–243. [Google Scholar] [CrossRef]
  23. Milovanovic, B.; Pecur, I.B. Review of active IR thermography for detection and characterization of defects in reinforced concrete. J. Imaging 2016, 2, 11. [Google Scholar] [CrossRef]
  24. Henriques, M.J.; Roque, D. Unmanned aerial vehicles (UAV) as a support to visual inspections of concrete dams. In Proceedings of the Second International Dam World Conference, Lisbon, Portugal, 21–24 April 2015. [Google Scholar]
  25. Kim, H.J.; Lee, J.H.; Ahn, E.J.; Cho, S.J.; Shin, M.S.; Sim, S.H. Concrete crack identification using a UAV incorporating hybrid image processing. Sensors 2017, 17, 2052. [Google Scholar] [CrossRef] [PubMed]
  26. Pereira, F.C.; Pereira, C.E. Embedded image processing systems for automatic recognition of cracks using UAVs. IFAC-PapersOnLine 2015, 48, 16–21. [Google Scholar] [CrossRef]
  27. Jang, K.Y.; An, Y.K. Multiple crack evaluation on concrete using a line laser thermography scanning system. Smart Struct. Syst. 2018, 22, 201–207. [Google Scholar] [CrossRef]
  28. Jang, K.Y.; Kim, N.G.; An, Y.K. Deep learning-based autonomous concrete crack evaluation through hybrid image scanning. Struct. Health Monit. 2018, (in press). [Google Scholar]
  29. Laskar, A.; Gu, H.; Mo, Y.L.; Song, G. Progressive collapse of a two-story reinforced concrete frame with embedded smart aggregates. Smart Mater. Strut. 2009, 18, 1–10. [Google Scholar] [CrossRef]
  30. Mangat, P.S. Tensile strength of steel fiber reinforced concrete. Cem. Concr. Res. 1976, 6, 245–252. [Google Scholar] [CrossRef]
  31. Song, P.S.; Hwang, S. Mechanical properties of high-strength steel fiber-reinforced concrete. Constr. Build. Mater. 2004, 18, 669–673. [Google Scholar] [CrossRef]
  32. An, Y.K.; Kim, M.K.; Sohn, H. Airplane hot spot monitoring using integrated impedance and guided wave measurements. Struct. Control. Health Monit. 2012, 19, 592–604. [Google Scholar] [CrossRef]
  33. You, I.; Yoo, D.Y.; Kim, S.; Kim, M.J.; Zi, G. Electrical and self-sensing properties of ultra-high-performance fiber-reinforced concrete with carbon nanotubes. Sensors 2017, 17, 2481. [Google Scholar] [CrossRef] [PubMed]
  34. Chung, D.D.L. Carbon materials for structural self-sensing, electromagnetic shielding and thermal interfacing. Carbon 2012, 50, 3342–3353. [Google Scholar] [CrossRef]
  35. Luo, J.L.; Duan, Z.D.; Zhao, T.J.; Li, Q.Y. Self-sensing property of cementitious nanocomposites hybrid with nanophase carbon nanotube and carbon black. Adv. Mater. Res. 2010, 143–144, 644–647. [Google Scholar] [CrossRef]
  36. Vaidya, S.; Allouche, E.N. Experimental evaluation of electrical conductivity of carbon fiber reinforced fly-ash based geopolymer. Smart Struct. Syst. 2011, 7, 27–40. [Google Scholar] [CrossRef]
  37. Park, J.M.; Kwon, D.J.; Wang, Z.J.; Devries, L. Review of self-sensing of damage and interfacial evaluation using electrical resistance measurements in nano/micro carbon materials-reinforced composites. Adv. Compos. Mater. 2015, 24, 197–219. [Google Scholar] [CrossRef]
  38. Qiao, G.; Guo, B.; Li, Z.; Ou, J.; He, Z. Corrosion behavior of a steel bar embedded in a cement-based conductive composite. Constr. Build. Mater. 2017, 134, 388–396. [Google Scholar] [CrossRef]
  39. Han, B.; Ding, S.; Yu, X. Intrinsic self-sensing concrete and structures: A review. Measurement 2015, 59, 110–128. [Google Scholar] [CrossRef]
  40. Hou, T.C.; Lynch, J.P. Electrical impedance tomographic methods for sensing strain fields and crack damage in cementitious structures. J. Intell. Mater. Syst. Struct. 2009, 20, 1363–1379. [Google Scholar] [CrossRef]
  41. Downey, A.; D’Alessandro, A.; Baquera, M.; Garcia-Macias, E.; Rolfes, D.; Ubertini, F.; Laflamme, S.; Castro-Triguero, R. Damage detection, localization and quantification in conductive smart concrete structures using a resistor mesh model. Eng. Struct. 2017, 148, 924–935. [Google Scholar] [CrossRef] [Green Version]
  42. Downey, A.; D’Alessandro, A.; Ubertini, F.; Laflamme, S.; Geiger, R. Biphasic DC measurement approach for enhanced measurement stability and multi-channel sampling of self-sensing multi-functional structural materials doped with carbon-based additives. Smart Mater. Struct. 2017, 26, 1–11. [Google Scholar] [CrossRef]
  43. Zhou, X.; Bhat, P.; Ouyang, H.; Yu, J. Localization of cracks in cementitious materials under uniaxial tension with electrical resistance tomography. Constr. Build. Mater. 2017, 138, 45–55. [Google Scholar] [CrossRef]
  44. Kang, M.S.; An, Y.K.; Kim, D.J. Electrical impedance-based crack detection of SFRC under varying environmental conditions. Smart Struct. Syst. 2018, 22, 1–11. [Google Scholar] [CrossRef]
  45. An, Y.K.; Sohn, H. Integrated impedance and guided wave based damage detection. Mech. Syst. Signal Process. 2012, 28, 50–62. [Google Scholar] [CrossRef]
  46. Nguyen, D.L.; Song, J.; Manathamsombat, C.; Kim, D.J. Comparative electromechanical damage-sensing behaviors of six strain-hardening. Compos. Part B Eng. 2015, 69, 159–168. [Google Scholar] [CrossRef]
Figure 1. Schematic of the instantaneous multi-channel electrical impedance acquisition system: AWG is an arbitrary waveform generator. v o ,   v i   and   v c are the voltages of output, input and FRCCs, respectively. C c   and   C r are the capacitances of FRCCs and the reference capacitor.
Applsci 08 02582 g001
Figure 2. Overall procedure of a crack localization algorithm.
Applsci 08 02582 g002
Figure 3. Test setup for temperature variation effects.
Applsci 08 02582 g003
Figure 4. Temperature variation test results at (a) Region A; (b) Region B; (c) Region C and (d) Region D.
Applsci 08 02582 g004
Figure 5. Damage index of temperature variation test results at (a) Region A; (b) Region B; (c) Region C and (d) Region D.
Applsci 08 02582 g005
Figure 6. Experimental test setup.
Applsci 08 02582 g006
Figure 7. Representative force-displacement curve.
Applsci 08 02582 g007
Figure 8. The bottom view of the representative FRCCs specimen under bending loads: (a) 1st step; (b) 4th step; (c) 5th step and (d) 6th step.
Applsci 08 02582 g008
Figure 9. The Nyquist plots obtained at at (a) Region A; (b) Region B; (c) Region C and (d) Region D.
Applsci 08 02582 g009
Figure 10. Damage index of representative specimen at (a) Region A; (b) Region B; (c) Region C and (d) Region D.
Applsci 08 02582 g010
Figure 11. Damage index of second specimen at (a) Region A; (b) Region B; (c) Region C and (d) Region D. Damage index of third specimen at (e) Region A; (f) Region B; (g) Region C and (h) Region D. Damage index of fourth specimen at (i) Region A; (j) Region B; (k) Region C and (l) Region D.
Applsci 08 02582 g011
Table 1. Mix proportions of FRCCs.
Water (kg/m3)Cement (kg/m3)Sand (kg/m3)Superplasticizer (kg/m3)Steel Fiber
Long (kg/m3)Short (kg/m3)
390867.56941.74108.44108.44

