Article

Lithium Titanate Battery Management System Based on MPPT and Four-Stage Charging Control for Photovoltaic Energy Storage

1
Department of Mechanical and Electrical Engineering, Longyan University, Longyan 364012, China
2
School of Mechanical and Automotive Engineering, South China University of Technology, Guangzhou 510640, China
*
Author to whom correspondence should be addressed.
Appl. Sci. 2018, 8(12), 2520; https://doi.org/10.3390/app8122520
Submission received: 26 October 2018 / Revised: 28 November 2018 / Accepted: 29 November 2018 / Published: 6 December 2018
(This article belongs to the Section Energy Science and Technology)

Abstract

:
To overcome the unstable photovoltaic input and high randomness in the conventional three-stage battery charging method, this paper proposes a charging control strategy based on a combination of maximum power point tracking (MPPT), and an enhanced four-stage charging algorithm for a photovoltaic power generation energy storage system. This control algorithm ensures that the charging process is not affected by fluctuations in the photovoltaic power. The discharge bus waveform, push–pull discharge load switching waveform, push–pull circuit efficiency, and voltage and current regulation accuracies of the system were investigated. The experimental results show that the charging process is consistent with the designed four-stage charging control algorithm, the voltage and current regulation accuracies satisfy the charging requirements, the busbar remained stable during the battery charging and discharging switch, and the battery balancing effect was good.

1. Introduction

With gradual the research and development of new energy sources, renewable energy sources, such as solar energy, wind energy, geothermal energy, and tidal energy, have been substantially developed. Photovoltaic solar energy is considered clean and safe and has secured policy support in many countries. According to the estimation made by the World Photovoltaic Industry Association, photovoltaic power generation will account for 5% of the global electricity production by 2020, and 40% by 2040 [1]. China’s “13th Five-Year Plan” for power development, released in 2016, states that significant effort should be made to develop new energy sources. Among them, the total capacity of photovoltaic generators is expected to reach 110 GW or more, with over 50% accounted for by distributed photovoltaic power generation, reaching more than 60 GW [2]. In distributed photovoltaic power generation, the residential areas of users are directly utilized to construct the photovoltaic power generation system and to perform off-grid or grid-connected power generation. This solves the problem of the large occupied area that characterizes ground photovoltaic power generation systems. However, owing to power fluctuations due to unstable photovoltaic power generation, the continuity and reliability of the power supply cannot be guaranteed. A direct grid connection can lead to a harmonic pollution problem, and can affect the stability of the overall power grid. Therefore, the cost of the grid connection increases substantially, which is one of the reasons for the “photovoltaic power discard” phenomenon [3,4,5]. In off-grid and grid-connected applications, fluctuations in photovoltaic power will lead to reliability and safety issues; thus, solutions to stabilize the fluctuation are necessary. The currently available technologies include energy storage, power reduction, and integration with other energy sources; among these technologies, energy storage is a relatively developed solution [6,7,8]. Employing large-capacity energy storage technology has become mandatory for the grid connection of distributed photovoltaic power generation, and is an important basis for the future construction of smart power grids.
In order to achieve renewable targets, the potential of the energy storage system (ESS) combined with photovoltaic (PV) panels can be applied not only to the electricity sector, but also to electric vehicles, which results in sustainable mobility, as well as being able to heat and power systems [9]. The main revenue of ESS is derived from an increase in self-consumption energy, and self-sufficiency and grid independence provide the necessary drive for people to install ESSs. The net present value (NPV) and levelized cost of electricity (LCOE) are two indicators that address the economics of ESS in residential buildings [10].
The introduction of energy storage technology to distributed photovoltaic power generation systems not only helps to suppress power fluctuations in photovoltaic power systems and to enhance the reliability and stability of the grid connection (thereby improving the power quality of the grid), but it can also help regulate the peak-to-valley balance problem of the power grid, maintain grid load stability, realize the self-sustaining and paid surplus (sent to the grid) of the photovoltaic power system, and increase the income of the user. This can promote the development of distributed photovoltaic power generation, solve the “photovoltaic power discard” problem, ensure local consumption of photovoltaic power, and improve the quality of the photovoltaic energy system [11,12,13]. This paper mainly reports on the charging and discharging control technology of lithium titanate batteries used in photovoltaic energy storage systems.

2. Materials and Methods

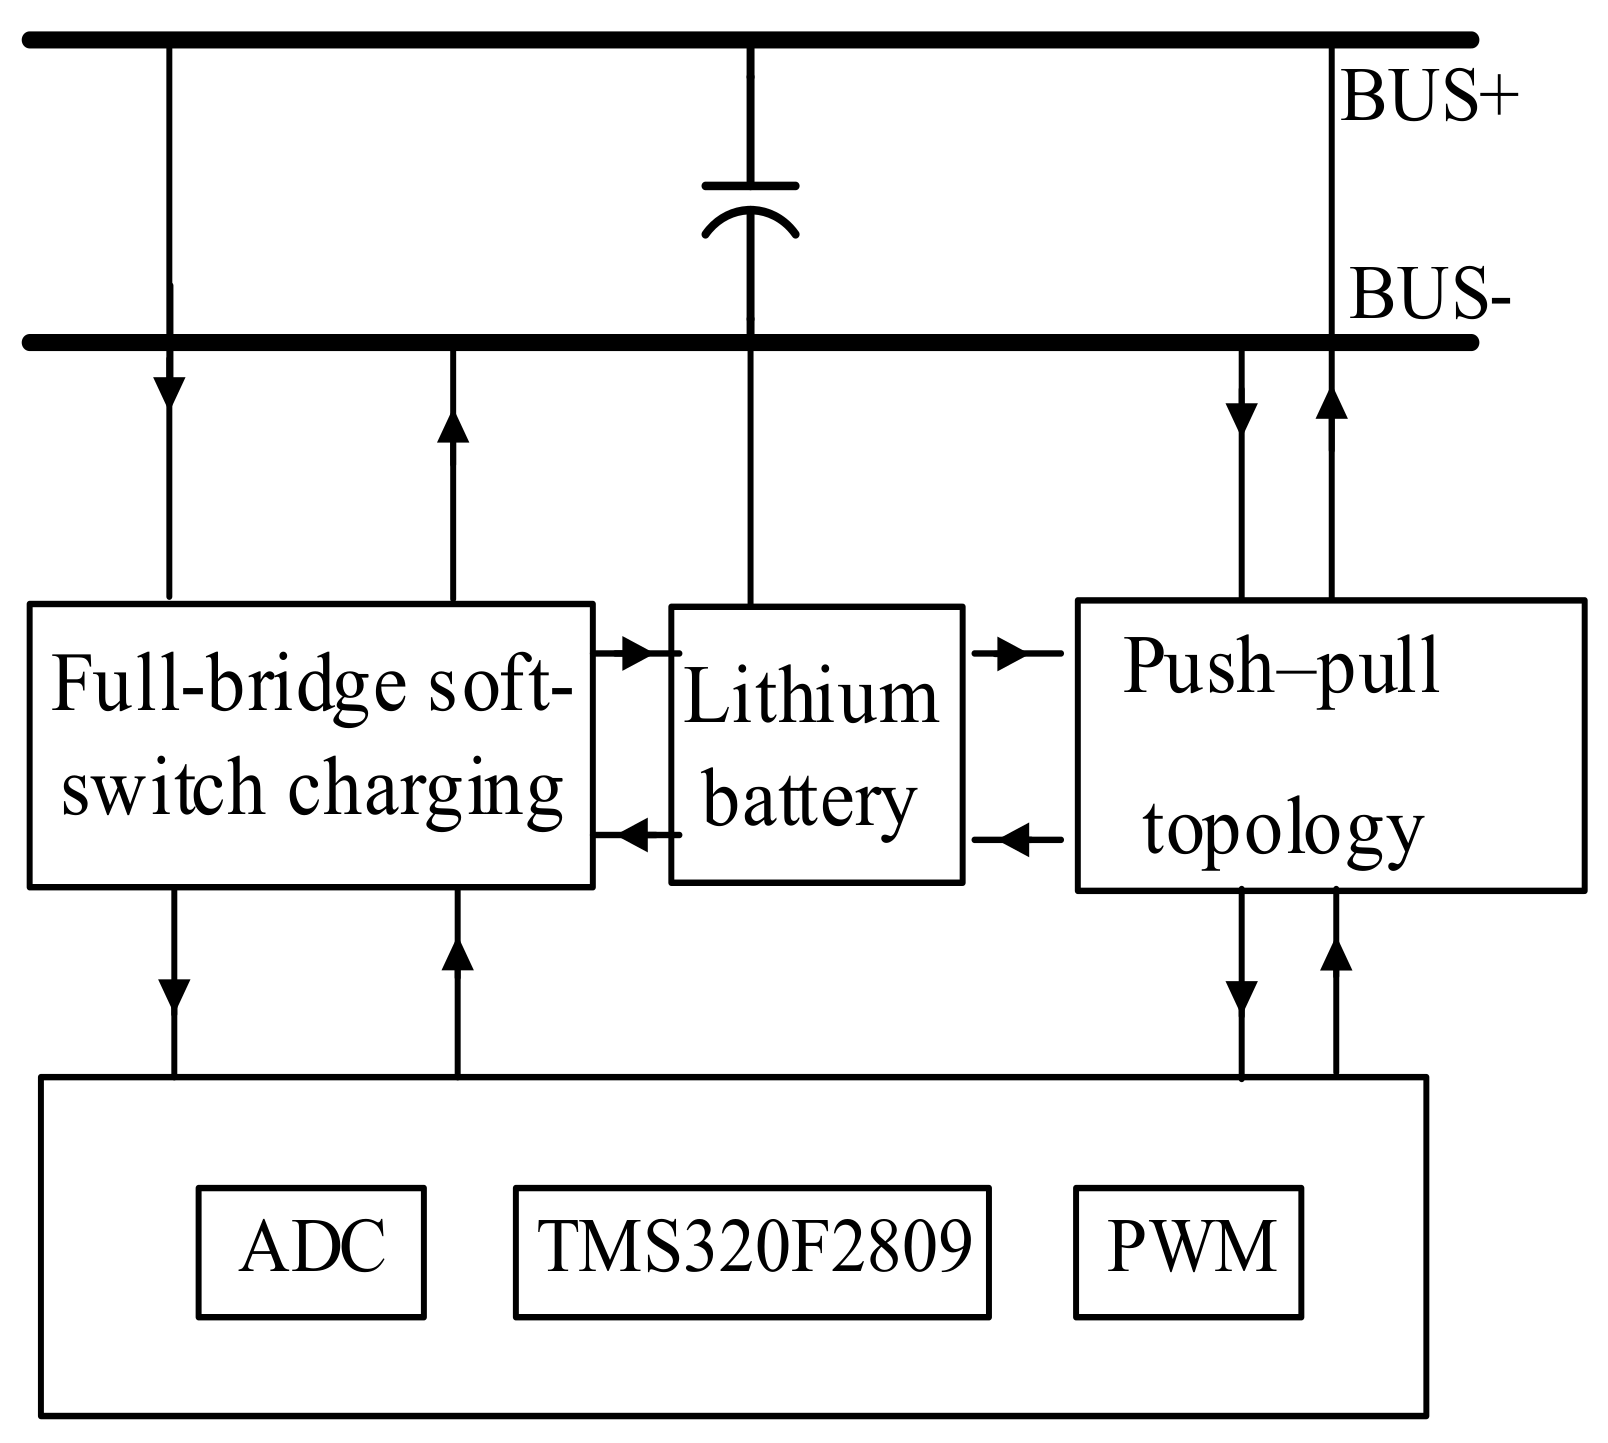
2.1. Hardware System

In a photovoltaic energy storage system, the low voltage of the photovoltaic PV input board is boosted to a bus voltage of 400 V via an interleaved parallel boost circuit, and a large-capacity electrolytic capacitor is connected in parallel to the busbar for power buffering and decoupling [7,8,9]. The 400 V bus voltage then charges the lithium battery through a full-bridge soft-switch circuit for photovoltaic energy storage. External single-phase photovoltaic inverters can be connected to the busbar for post-stage inverter grid connection, or to supply power to the AC load. Alternatively, other DC/DC converters can be connected to supply power to the DC load. When the photovoltaic output is unstable because of weather conditions or during nighttime, the battery starts boosting/discharging the busbar through a push–pull circuit, in order to maintain the bus voltage and to release the stored energy to the post-stage load or the grid. Figure 1 shows a schematic of the charging and discharging system of the lithium titanate battery.
The control unit employs Texas Instruments (TI)’s TMS320F2809 controller [11]. The sampling and regulating circuit of the controller sends an analog signal to the analog-to-digital converter (ADC) module of the digital signal processor (DSP), which then completes the feedback signal processing and outputs the drive signal adjusted by the control algorithm, thereby achieving a digital closed-loop control of the entire system. The controller has a maximum operating frequency of 100 MHz, and various communication interfaces for data transmission.

2.2. Charge and Discharge Control Strategy

The discharging of a battery generally follows a simple constant-current discharge or a constant-voltage discharge process. In this study, the simpler constant-voltage control was employed. In order to maintain its stability, the bus voltage was selected as the feedback voltage to achieve constant-voltage discharge. In this study, we used voltage model SG3525 to complete the constant voltage discharge control of the push–pull boost.
A three-stage charging method is more beneficial to fully protect the battery and to ensure charging efficiency. However, the fixed charging curve does not consider the effects of instability and high randomness in the photovoltaic input on the battery charging process. The supply of unstable power can result in an excessive charging voltage or an insufficient charging current, and can also lead to battery over-discharge when there is continuously no power supply to the battery because of long-term insufficient sunlight [6]. Therefore, this study employed an enhanced four-stage charging method, in which a maximum power point tracking (MPPT) [14,15] was combined with the conventional stage charging method with the addition of a pre-charging stage [13,16,17,18].
The conventional stage charging method can be divided into constant-current charging, constant-voltage charging, and floating charging stages. Considering the particularity of the photovoltaic system, the following conditions should be satisfied:
(1)
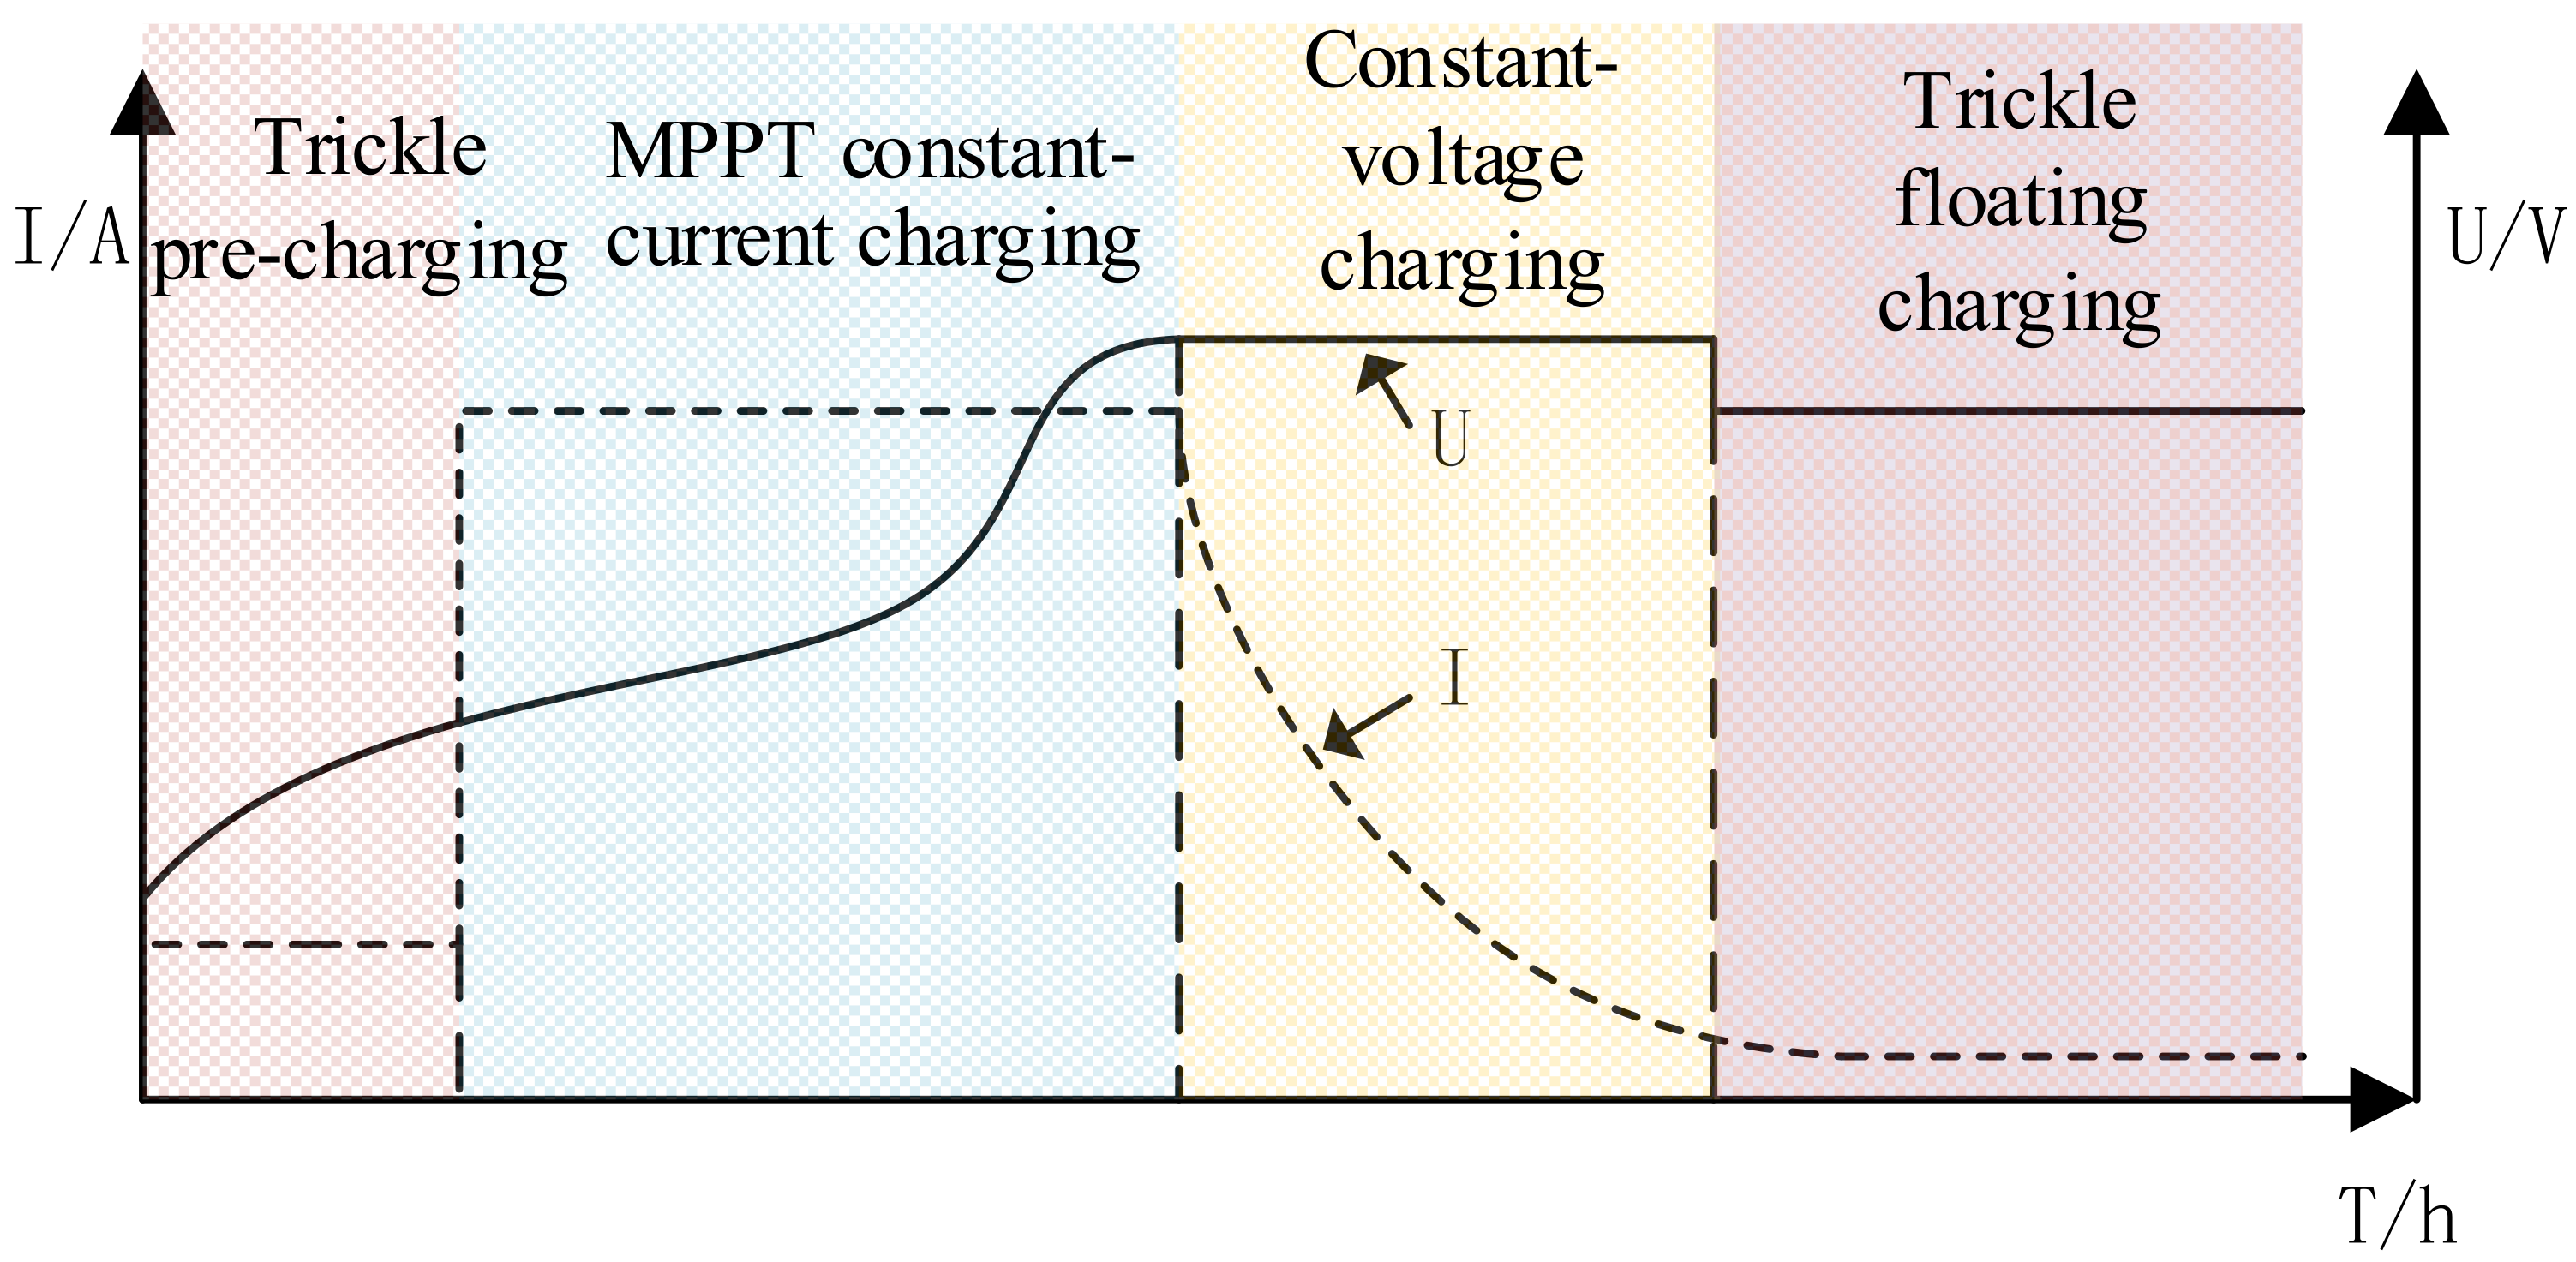
First, determine whether the battery is over-discharged; if this is the case, the battery should be trickle pre-charged with a current of 0.05 C for activation.
(2)
After activation, the battery enters the constant-current charging stage. However, the maximum charging current that the battery can receive is limited; therefore, the charging current should be limited to the maximum charging current Imax (0.2 C) when the photovoltaic output power is greater than the battery receiving power. At this moment, the photovoltaic system does not work in the MPPT state. When the photovoltaic output power is lower than the battery receiving power, the photovoltaic system is maintained in the MPPT state. Although the battery is still in the constant-current charging stage, the charging current is lower than the maximum charging current.
(3)
During the MPPT constant-current charging stage, the battery voltage gradually increases with respect to the charging time. When the battery voltage increases to the maximum charging voltage, Umax, the constant-current charging stage is terminated, and the battery enters the constant-voltage charging stage, in which the charging current slowly decreases.
(4)
When the current decreases to a certain value in the constant-voltage charging stage, that is, Ioff, the battery charging voltage is reduced to perform trickle floating charging.
Figure 2 shows the charging curve described above. Figure 3 shows the flow chart of the charging algorithm.
When the problems of busbar stability and photovoltaic MPPT are not considered, constant-voltage and constant-current charging using voltage and current single loops can meet the requirements. However, from safety and stability viewpoints, the stability of the bus voltage in a photovoltaic charging system should be considered [19,20]. Therefore, a bus voltage loop should be included so as to maintain the stability of the bus voltage.
During the MPPT charging process, the stability of the busbar cannot be achieved by the interleaved parallel boost circuit, because the output controlled by the MPPT is the output power of the photovoltaic battery. At this time, the interleaved parallel boost circuit needs to execute the MPPT algorithm. Instead, the stability of the busbar is controlled by the post-stage phase-shifted full-bridge soft-switch circuit, and the post stage employs a bus voltage outer loop and a current inner loop to realize the control, thereby achieving MPPT constant-current charging.
During the constant-current charging stage, the MPPT does not operate. Therefore, the bus voltage can be controlled by the interleaved parallel boost circuit in order to execute a constant voltage proportional-integral (PI) algorithm. The circuit uses a post-stage full-bridge voltage outer ring as the bus outer ring, combined with a current inner ring, to perform constant-current charging.
During the constant-voltage charging stage, the post-stage full-bridge circuit uses the battery voltage loop as the outer loop. In this case, the bus voltage is clamped by the battery voltage, and the battery voltage loop alone can complete the constant voltage charging operation. The role of the current loop is to limit the current.
The above procedures can not only complete the enhanced stage charging algorithm based on the MPPT described earlier, but can also maintain the stability of the busbar during charging. Figure 4 shows the detailed control block diagram.
In Figure 4, when the system samples the photovoltaic output voltage/current, battery charging voltage/current, and bus voltage, the sampled values are inputted to the DSP to determine the charging mode, as follows:
(1)
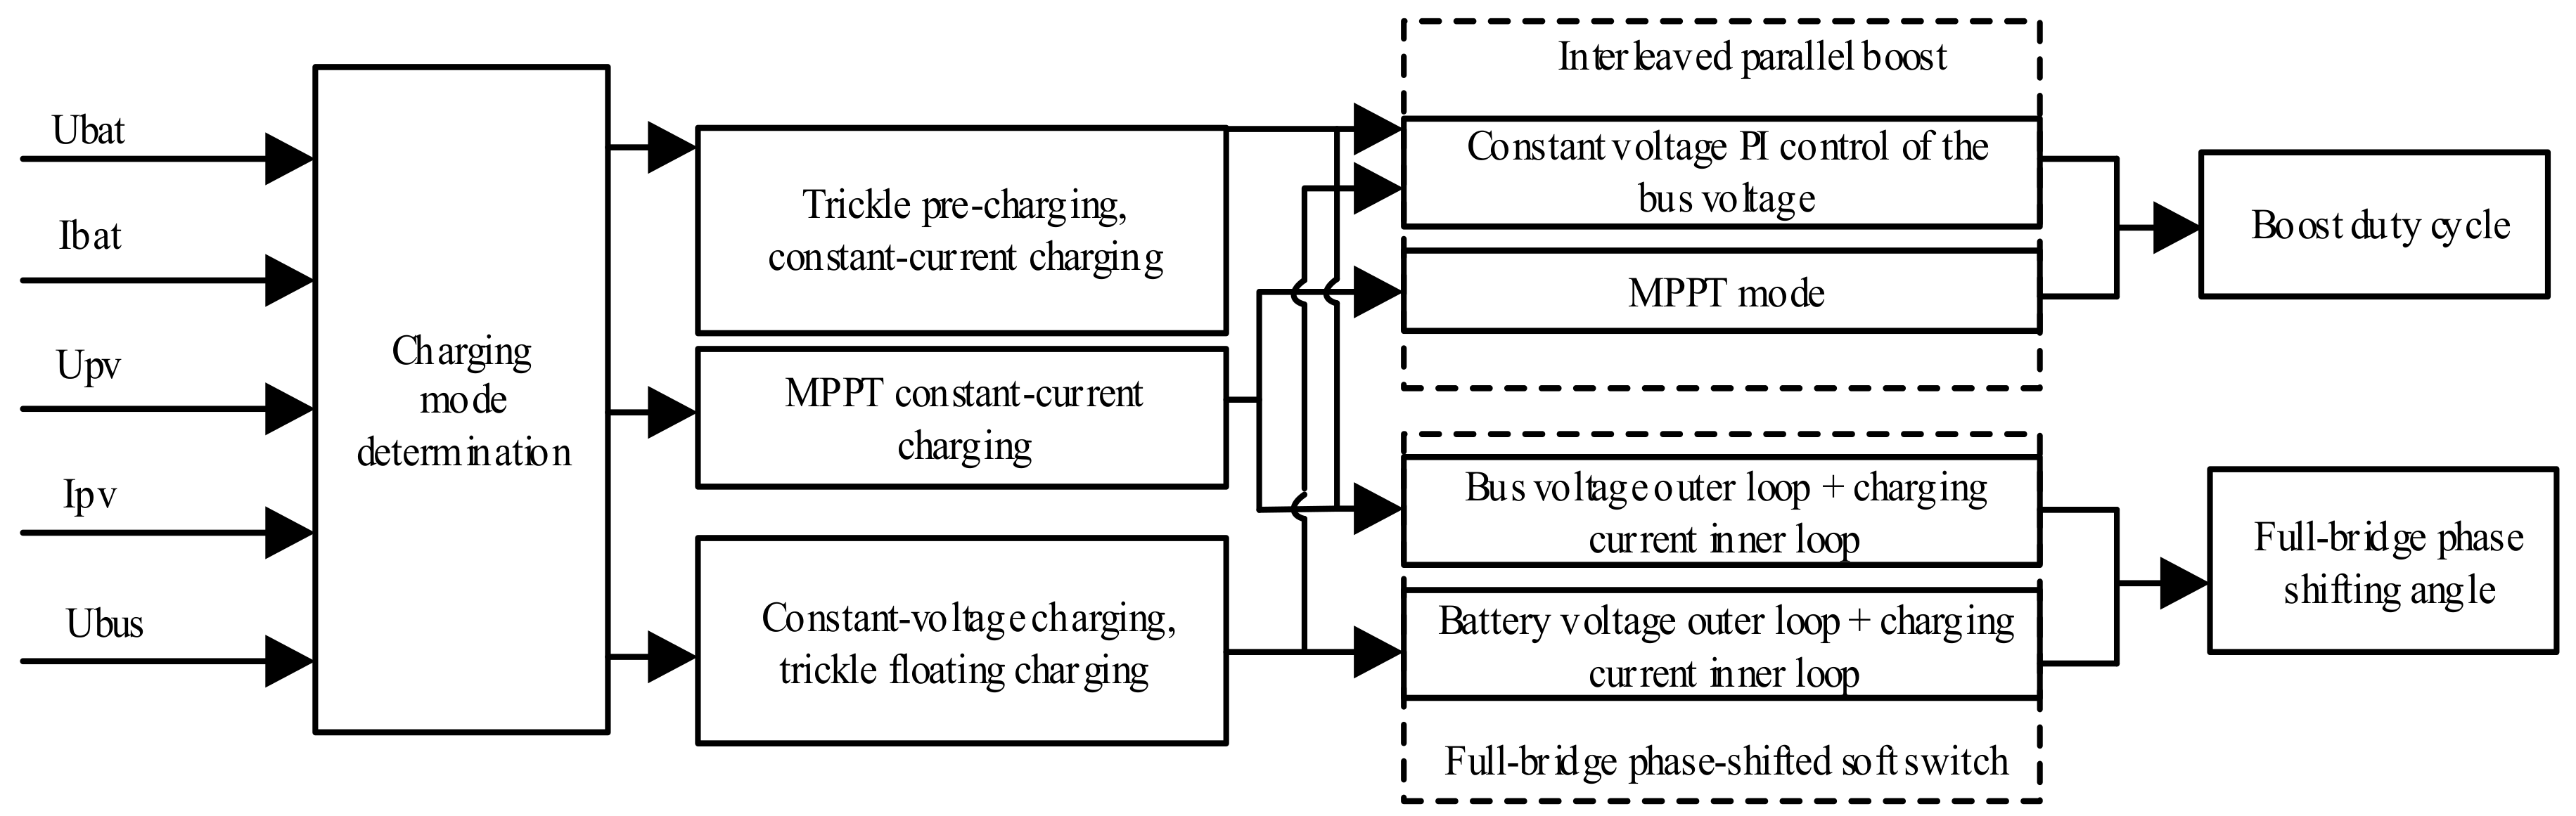
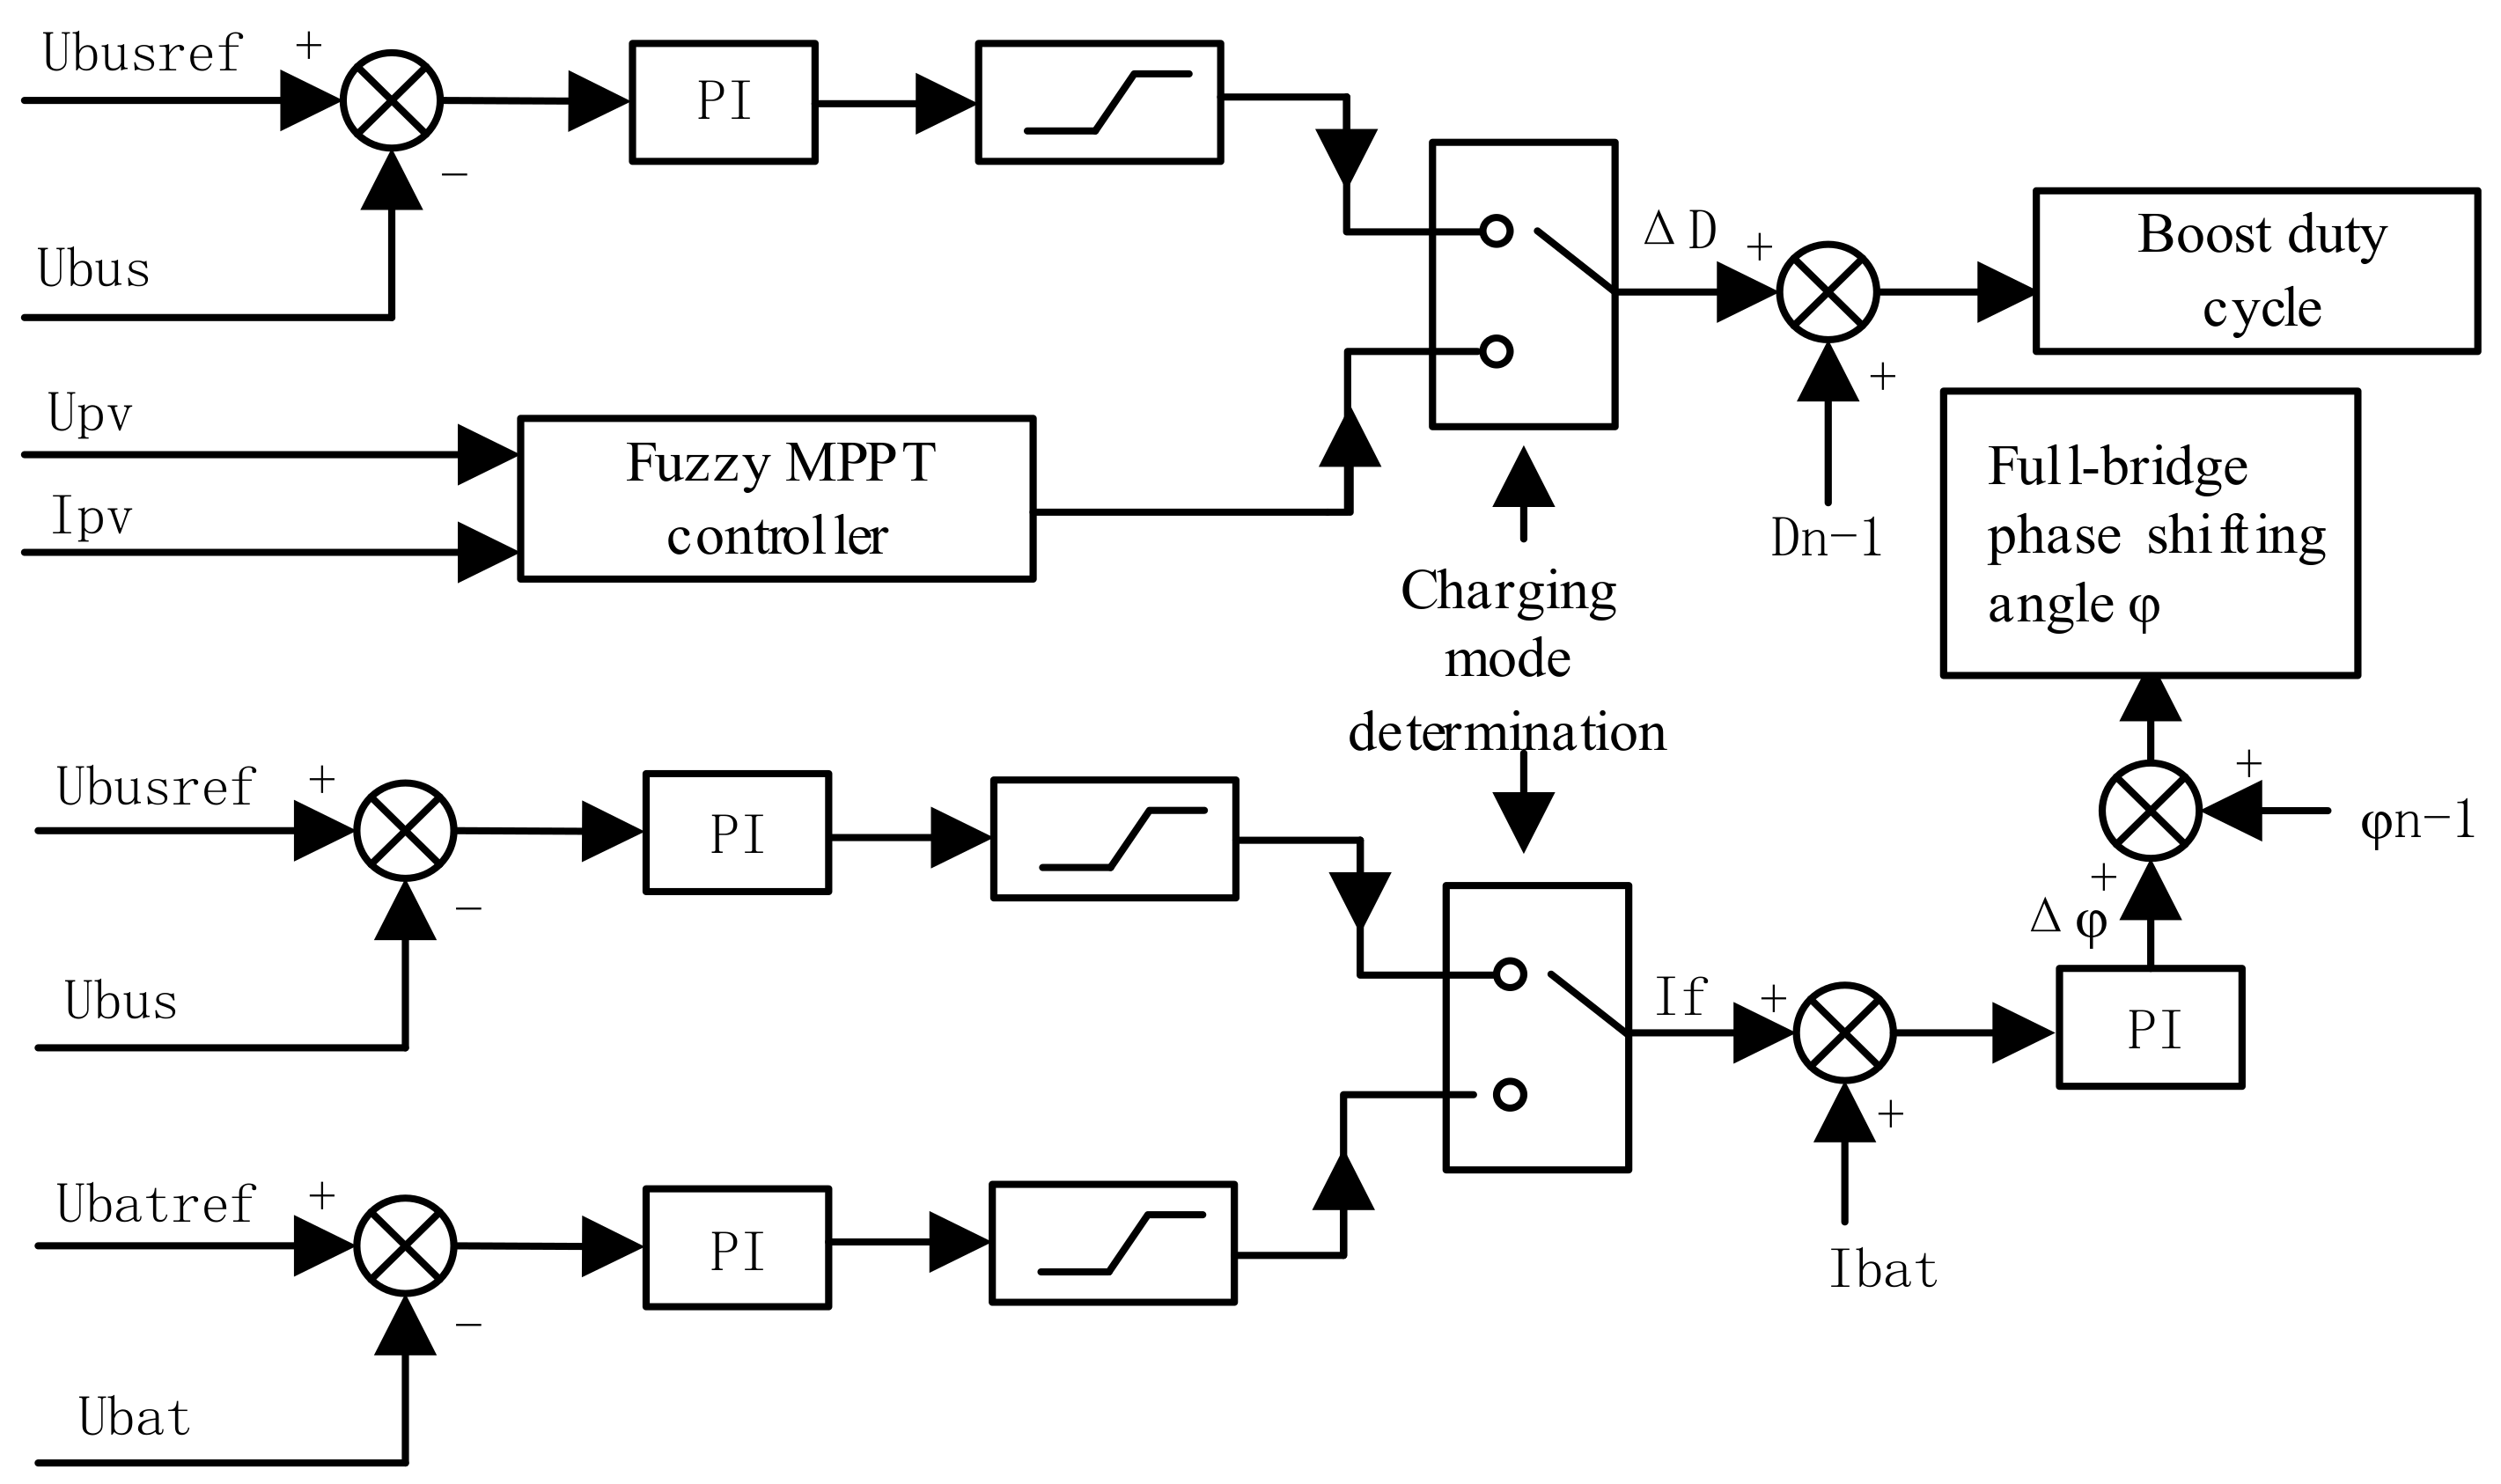
When the system is in the trickle pre-charging or the constant-current charging stage, the photovoltaic battery does not work in the MPPT state. Therefore, the interleaved parallel boost is controlled by the bus voltage loop, and the bus voltage is controlled by the boost. The charging current is controlled by the post-stage full-bridge circuit, which uses a double loop control comprising a current inner loop and a bus outer loop to achieve a constant current.
(2)
When the system is in the MPPT constant-current charging stage, the photovoltaic battery works in the MPPT state, which controls the output power of the photovoltaic battery to the maximum. Therefore, at this stage, the bus voltage cannot be controlled by the boost, instead, it should be controlled by the post-stage full-bridge circuit. Thus, the post-stage full-bridge circuit uses the bus voltage outer ring and the current inter ring to achieve a constant current and stable bus voltage, respectively.
(3)
When the system is in the constant-voltage charging or the trickle floating charging stage, the photovoltaic battery does not work in the MPPT state. Therefore, the busbar should be controlled by the post-stage full-bridge circuit. Moreover, the charging voltage of the battery needs to be controlled at this stage. Thus, at this stage, the battery voltage outer ring is used as the voltage outer ring, and the charging voltage is stabilized at a set value. The busbar can also be clamped to a certain stable value, and the role of the charging inner loop is to limit the current.
After the specific control strategies for the pre-stage interleaved parallel boost circuit and post-stage full-bridge phase-shifted soft-switch circuit are determined, the corresponding PI or MPPT algorithm calculates the pre-stage boost duty cycle and the post-stage full-bridge phase shifting angle. The system then drives the pre-stage and post-stage switching tubes via the corresponding driving circuit so as to complete the charging process.
Figure 5 shows the structure diagram of the specific loop control algorithm.

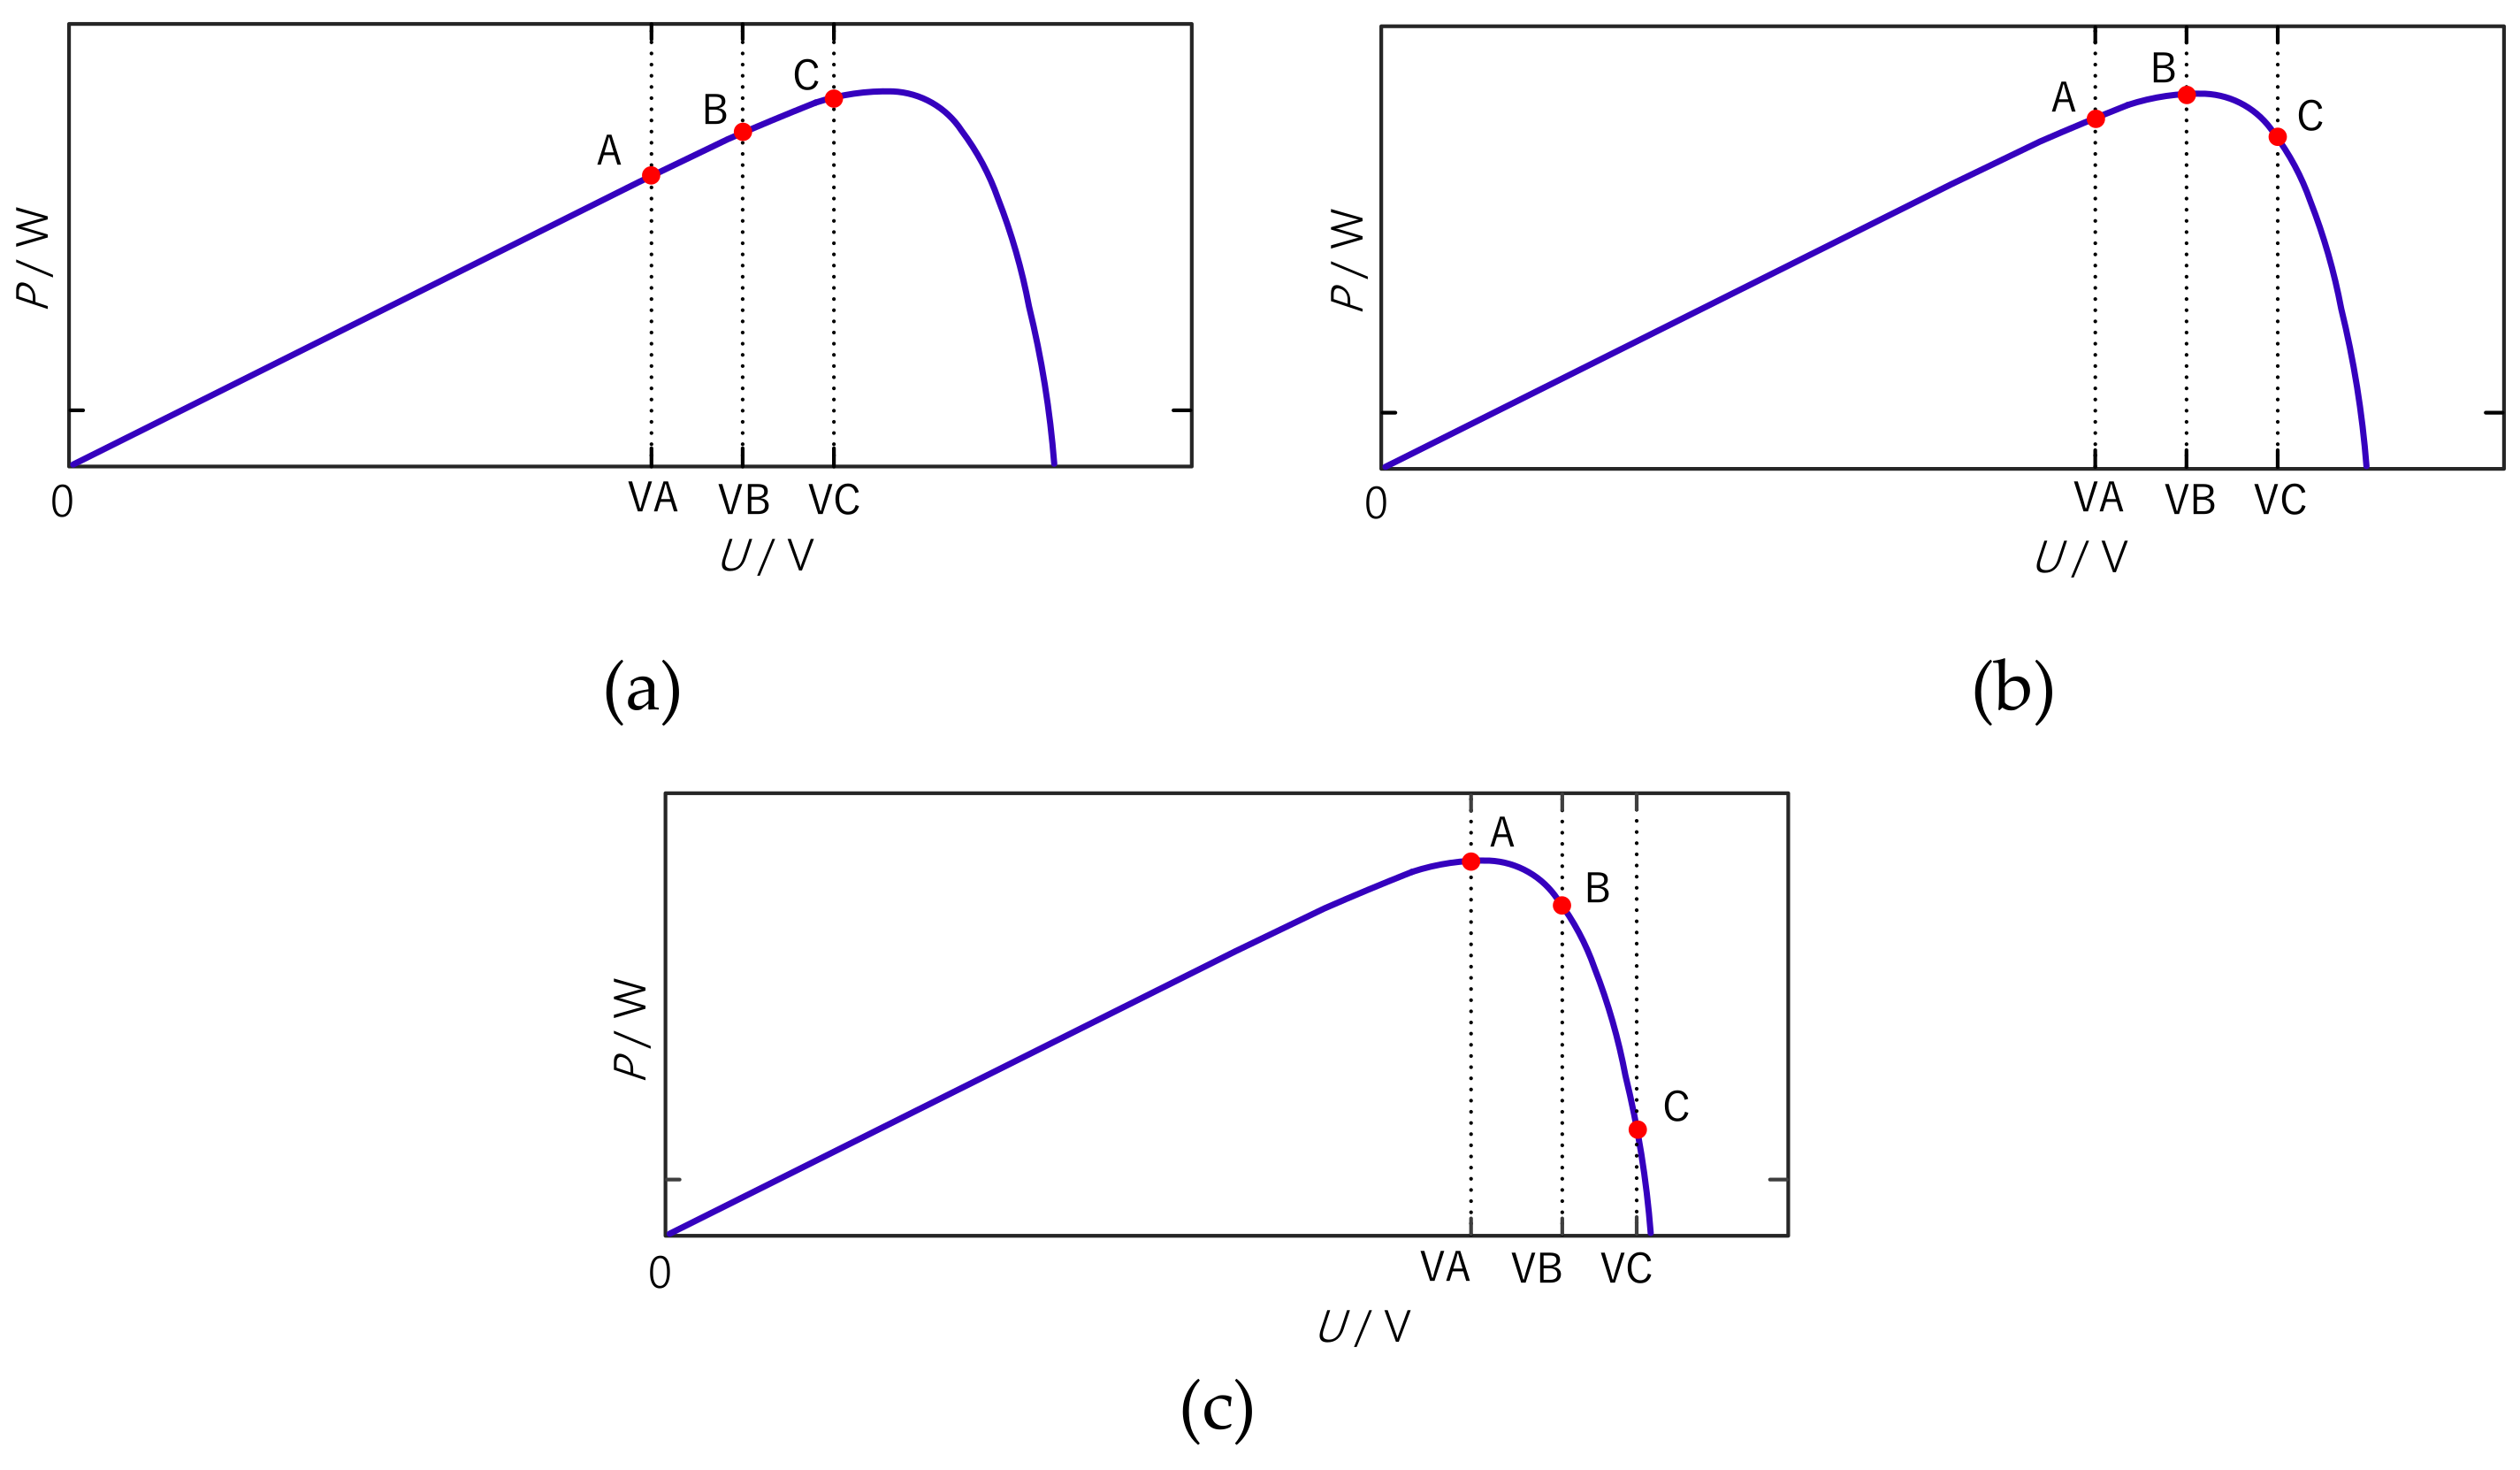
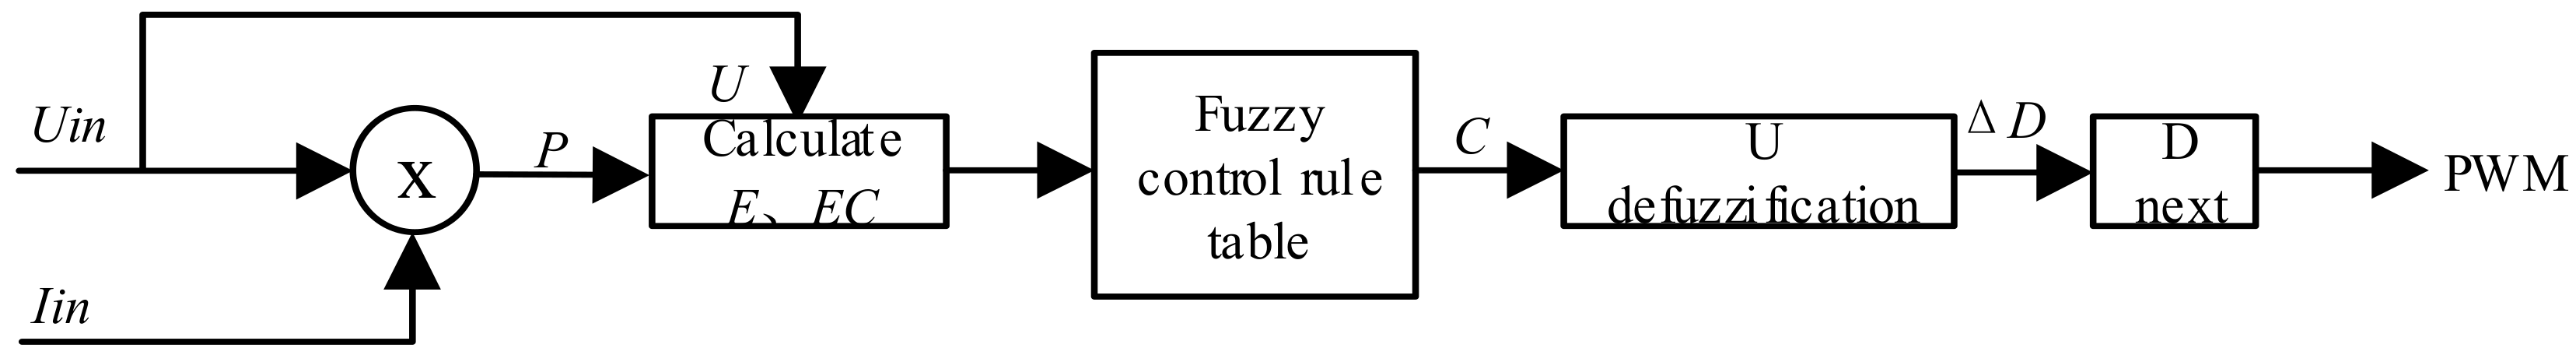
2.3. Three-Point Fuzzy MPPT Algorithm of Variable Step Size

Presently, the commonly used MPPT control algorithms include the fixed voltage method, perturbation and observation method, and incremental conductance method.
Table 1 presents a comparison of the three commonly used MPPT tracking control methods. The following can be deduced from the table:
(1)
The fixed voltage method needs fewer detection parameters and less hardware, but yields a poor control performance, thus, it is usually used in low power cases;
(2)
The disturbance observation method is simple to implement and yields a very good control performance. The disadvantage is that it easily produces oscillation near the maximum power point, and may lose its tracking ability when the light intensity changes abruptly.
(3)
The incremental conductance method yields the best control performance, but the hardware requirement of a photovoltaic power generation system is also higher, which increases the cost of the equipment.
In this study, the perturbation observation method, one of the three traditional tracking algorithms, was improved, and we proposed a new perturbation observation method with the following characteristics. The main approach is to include the constant voltage method to accelerate the tracking speed of the low power section at the initial stage of tracking, and use the three-point method combined with a variable step size disturbance to judge the near maximum power point so as to improve the tracking accuracy and final steady state.
(1)
The constant pressure method was used in the start-up phase of the disturbance observation method.
(2)
Three-point method of perturbation and observation method control.
The principle of the three-point control is as follows: A, B, and C are selected from left to right near the vertex of the PV characteristic curve of the solar cells, and Flag_3 is set as the change mark. Among them, VA, IA, VB, IB, VC, and IC represent the voltage and current of A, B, and C, respectively, and PA, PB, and PC represent the corresponding power of A, B, and C, respectively. Setting the voltage corresponding to the maximum power point of A, B, and C as Vmax, the three-point method judges the working point mode mainly as shown in Figure 6, that is, Vmax = VC, Vmax = VB, or Vmax = VA.
When PBPC, Flag_3P = 1, and when PB > PC, set Flag_3P = −1;
When PA < PB, Flag_3P = 1, and when PAPB, set Flag_3P = −1.
By judging the Flag_3P value twice, we can make a judgment of the direction of the disturbance.
If Flag_3P = 2, PA < PB & PBPC, increase the disturbance quantity;
If Flag_3P = 0, PA < PB & PB > PC, the maximum point is fine-tuned.
If Flag_3P = −2, PAPB & PB > PC, the disturbance will be reduced.
At a rapidly changing sunlight intensity, PAPB and PBPC will also occur. Because Flag_3P = 0 at this time, it can be classified as the situation of reaching the maximum power point, that is, the working point does not change, thus avoiding any misjudgment caused by a rapid change in sunlight intensity. First, according to the data provided by the manufacturer, the initial maximum power point voltage is set at 80% of the open-circuit voltage, and the disturbance reduction value is increased. After collecting and comparing the changed power value, the disturbance direction is determined by the value of Flag_3P.
(3) To increase the threshold of the power amplification of the PV array, we used a variable step size control.
Detecting ΔP between any two points of A, B, and C, if the illumination intensity changes considerably, assuming that the amplitude exceeds ΔPL, ΔP > ΔPL, the working point will not be changed, which not only avoids the mismatch between the front and back output power caused by an excessive change of the front output power, but also ensures the smooth operation of the system without blind oscillations. When the illumination intensity is stable and the ΔP between the two points is large (but not ΔPL), it can be considered that the current working point is far from the maximum power point on both sides of the power curve, and the maximum power point tracking can be carried out with a larger step to speed up the tracking speed. Assuming that the threshold of the power difference exceeds ΔPM, then, ΔPM < ΔP < ΔPL. When the power difference between the two points is small, it is considered that the current working point is near the maximum power point, and is disturbed by a small step disturbance. Assuming that the threshold of the power difference is ΔPS, then, ΔPS < ΔP < ΔPM.
On the basis of the above three-point variable step-size perturbation and observation method to determine the direction of disturbance, the duty cycle D is determined using the fuzzy MPPT control algorithm by comparing the detection power, thus driving the boost switch in order to achieve the efficient and fast tracking of the maximum power point of the solar panel. The control block diagram based on the fuzzy MPPT algorithm is shown in Figure 7.
Figure 8 shows the simulation waveform of the output power of the photovoltaic array. The illumination intensity is 3000 W/m2. It can be observed from the figure that the fuzzy control model can track the maximum power within 0.03 s, and the oscillation at the maximum power point is small. The local magnification of the model is shown in Figure 9. The power fluctuation is 2 W and the fluctuation coefficient is 0.1%. The large oscillation before the maximum power point indicates that a large step tracking is being carried out—the tracking speed is faster. It is obvious that the tracking speed and accuracy of the three-point variable step size fuzzy MPPT control algorithm are very high.
In practice, the illumination was reduced from 3000 to 2000 W/m2 at 0.1 s, and was increased from 2000 to 2500 W/m2 at 0.2 s, to simulate the tracking effect under a change in the illumination intensity. The tracking effect was observed as shown in Figure 10. The results show that the fuzzy MPPT can track the new maximum power point quickly under disturbance.

3. Results and Discussion
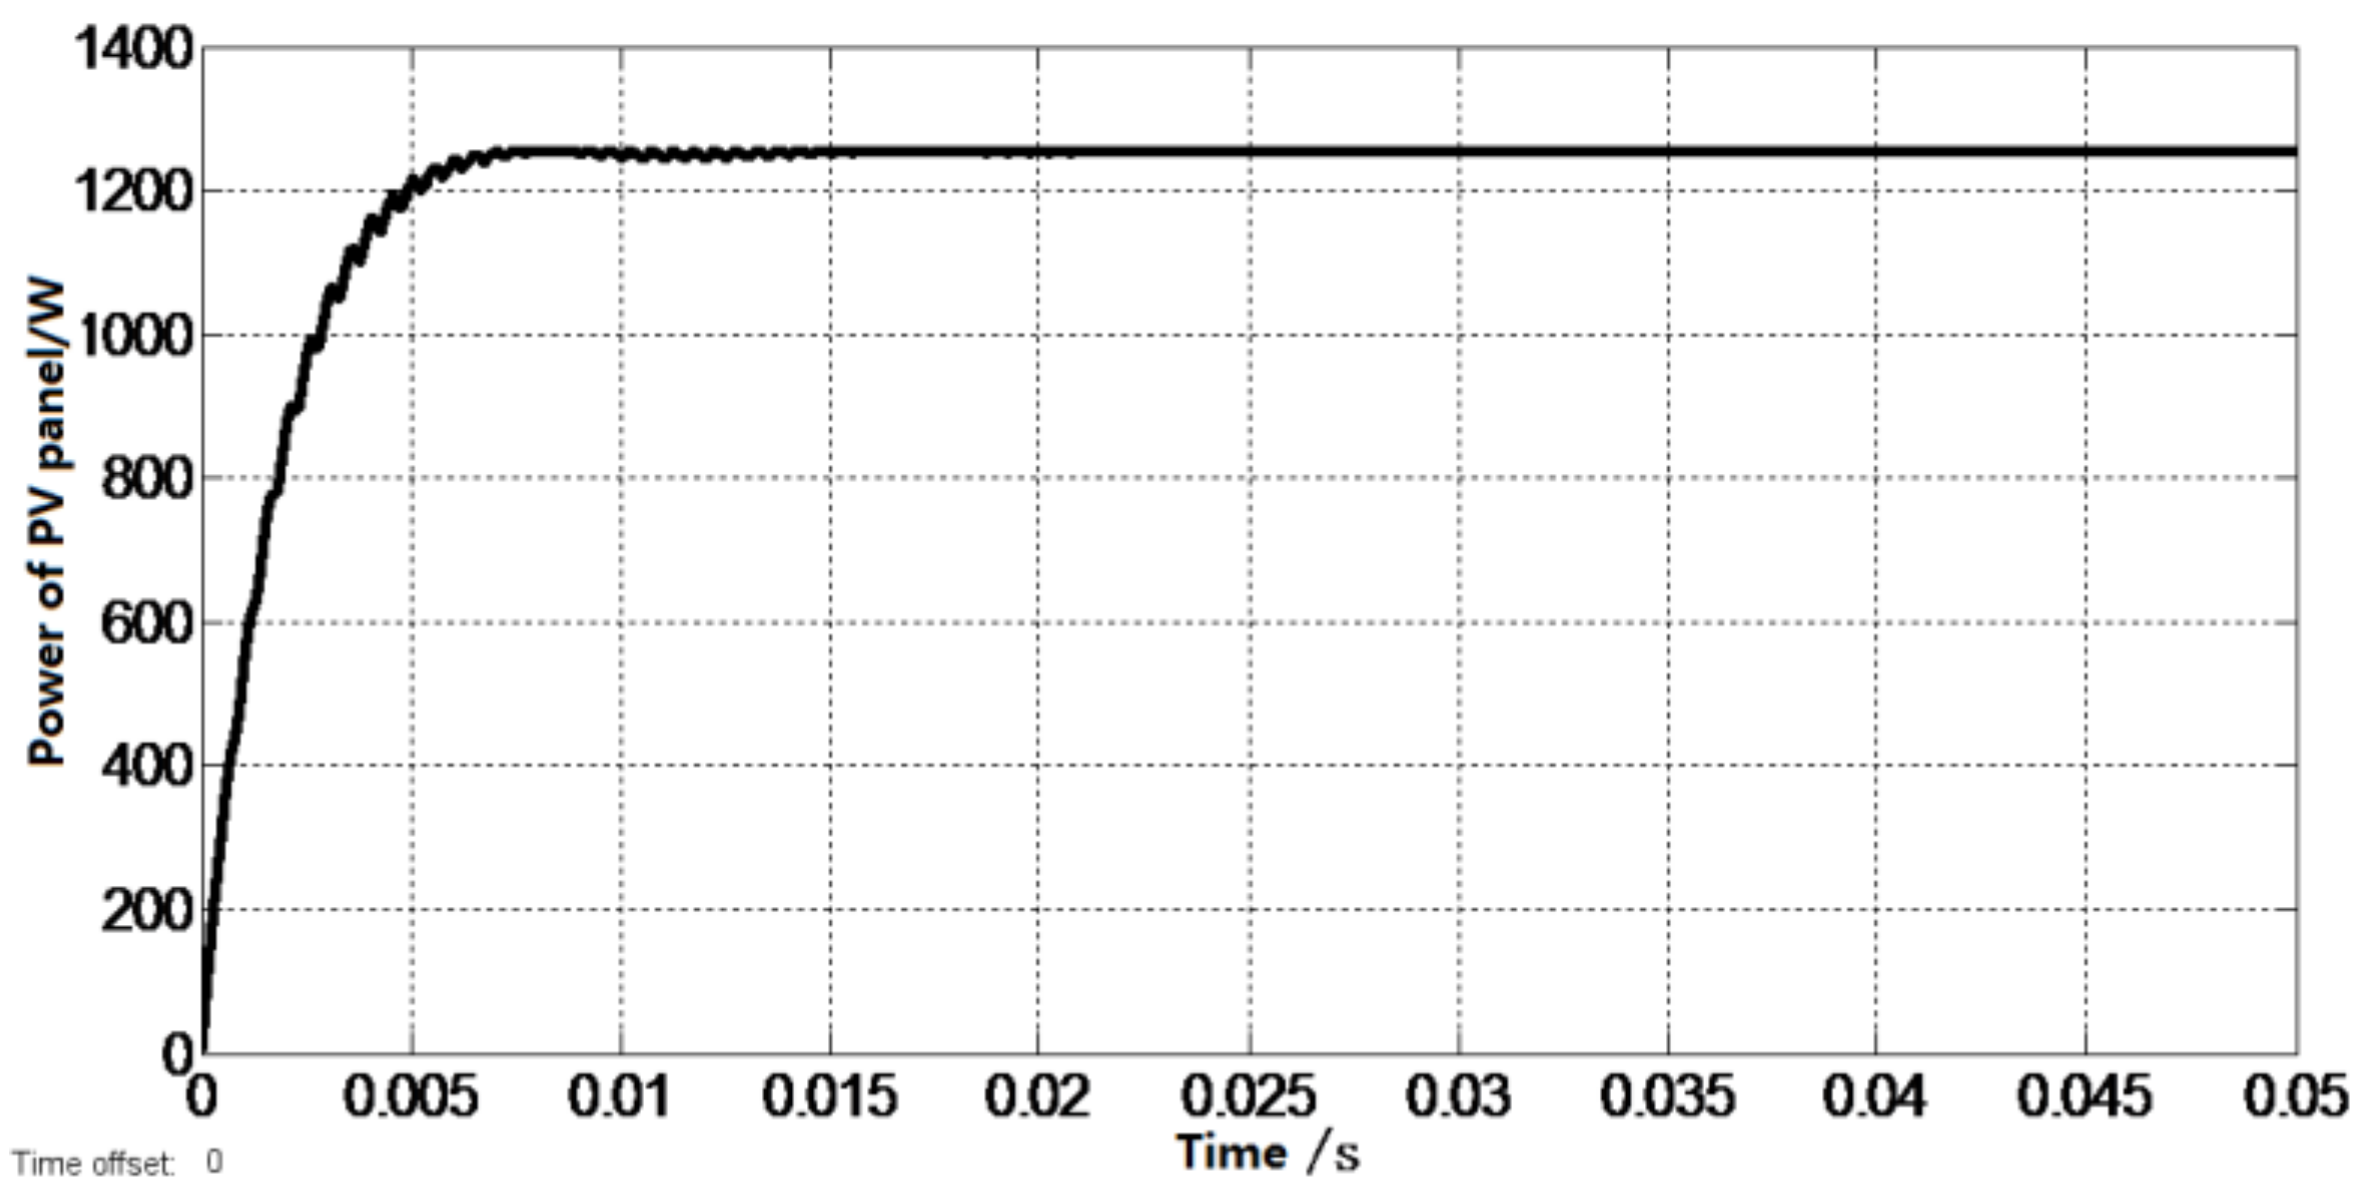
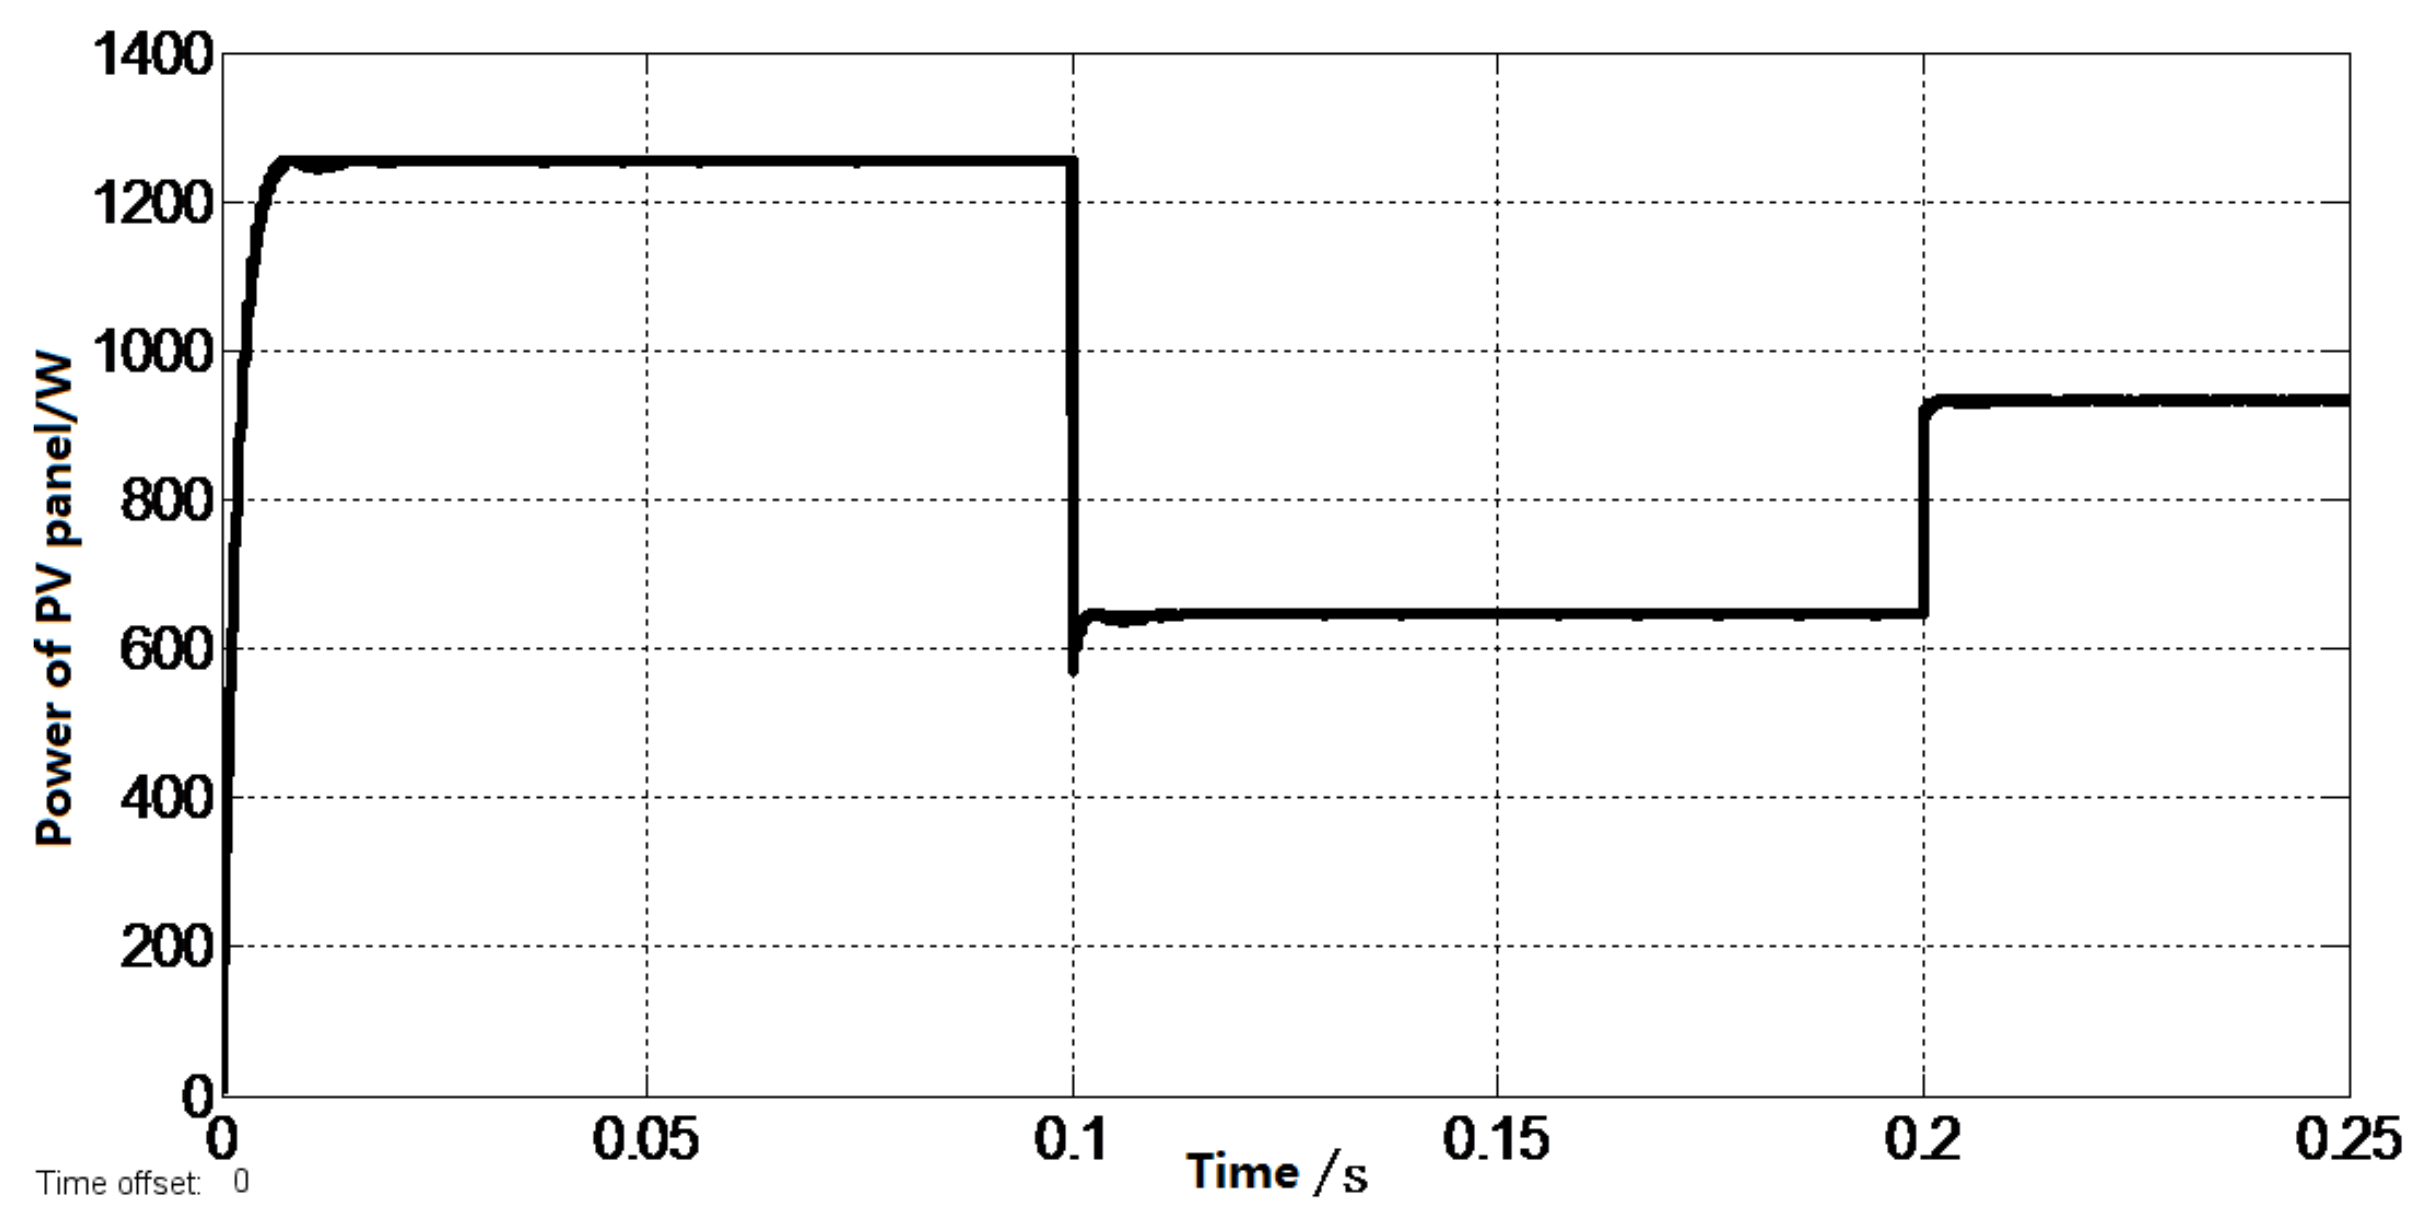
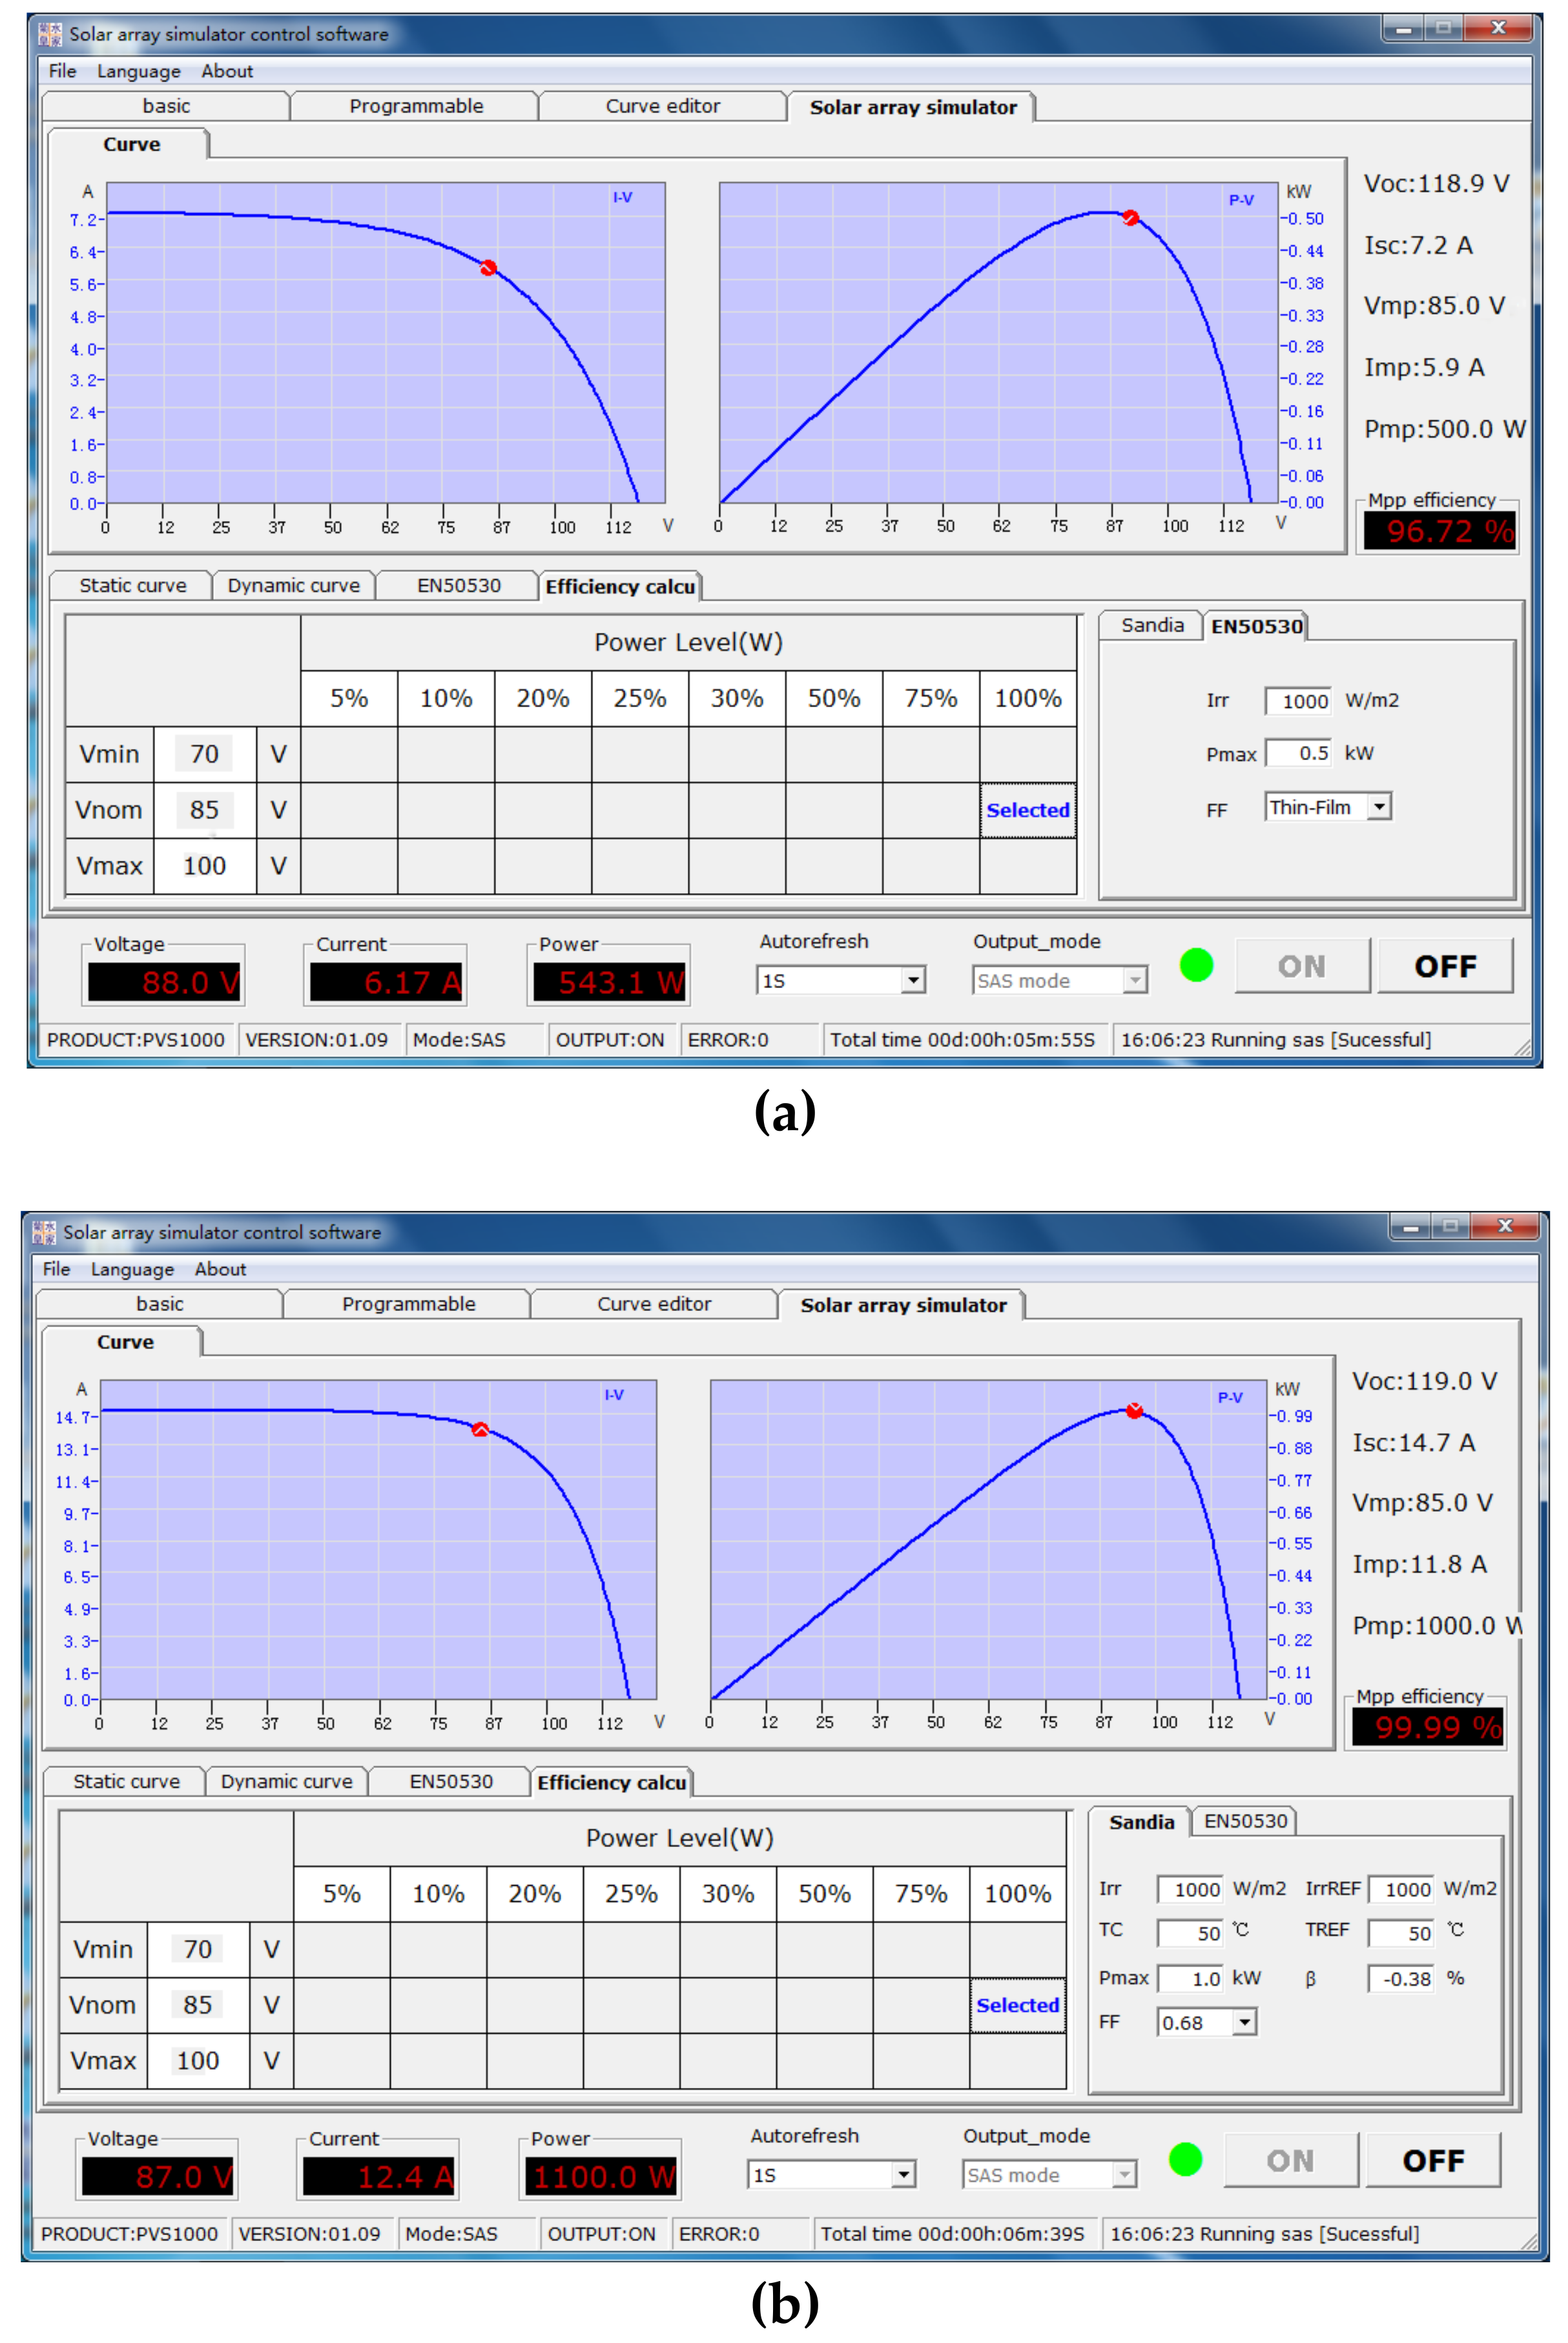
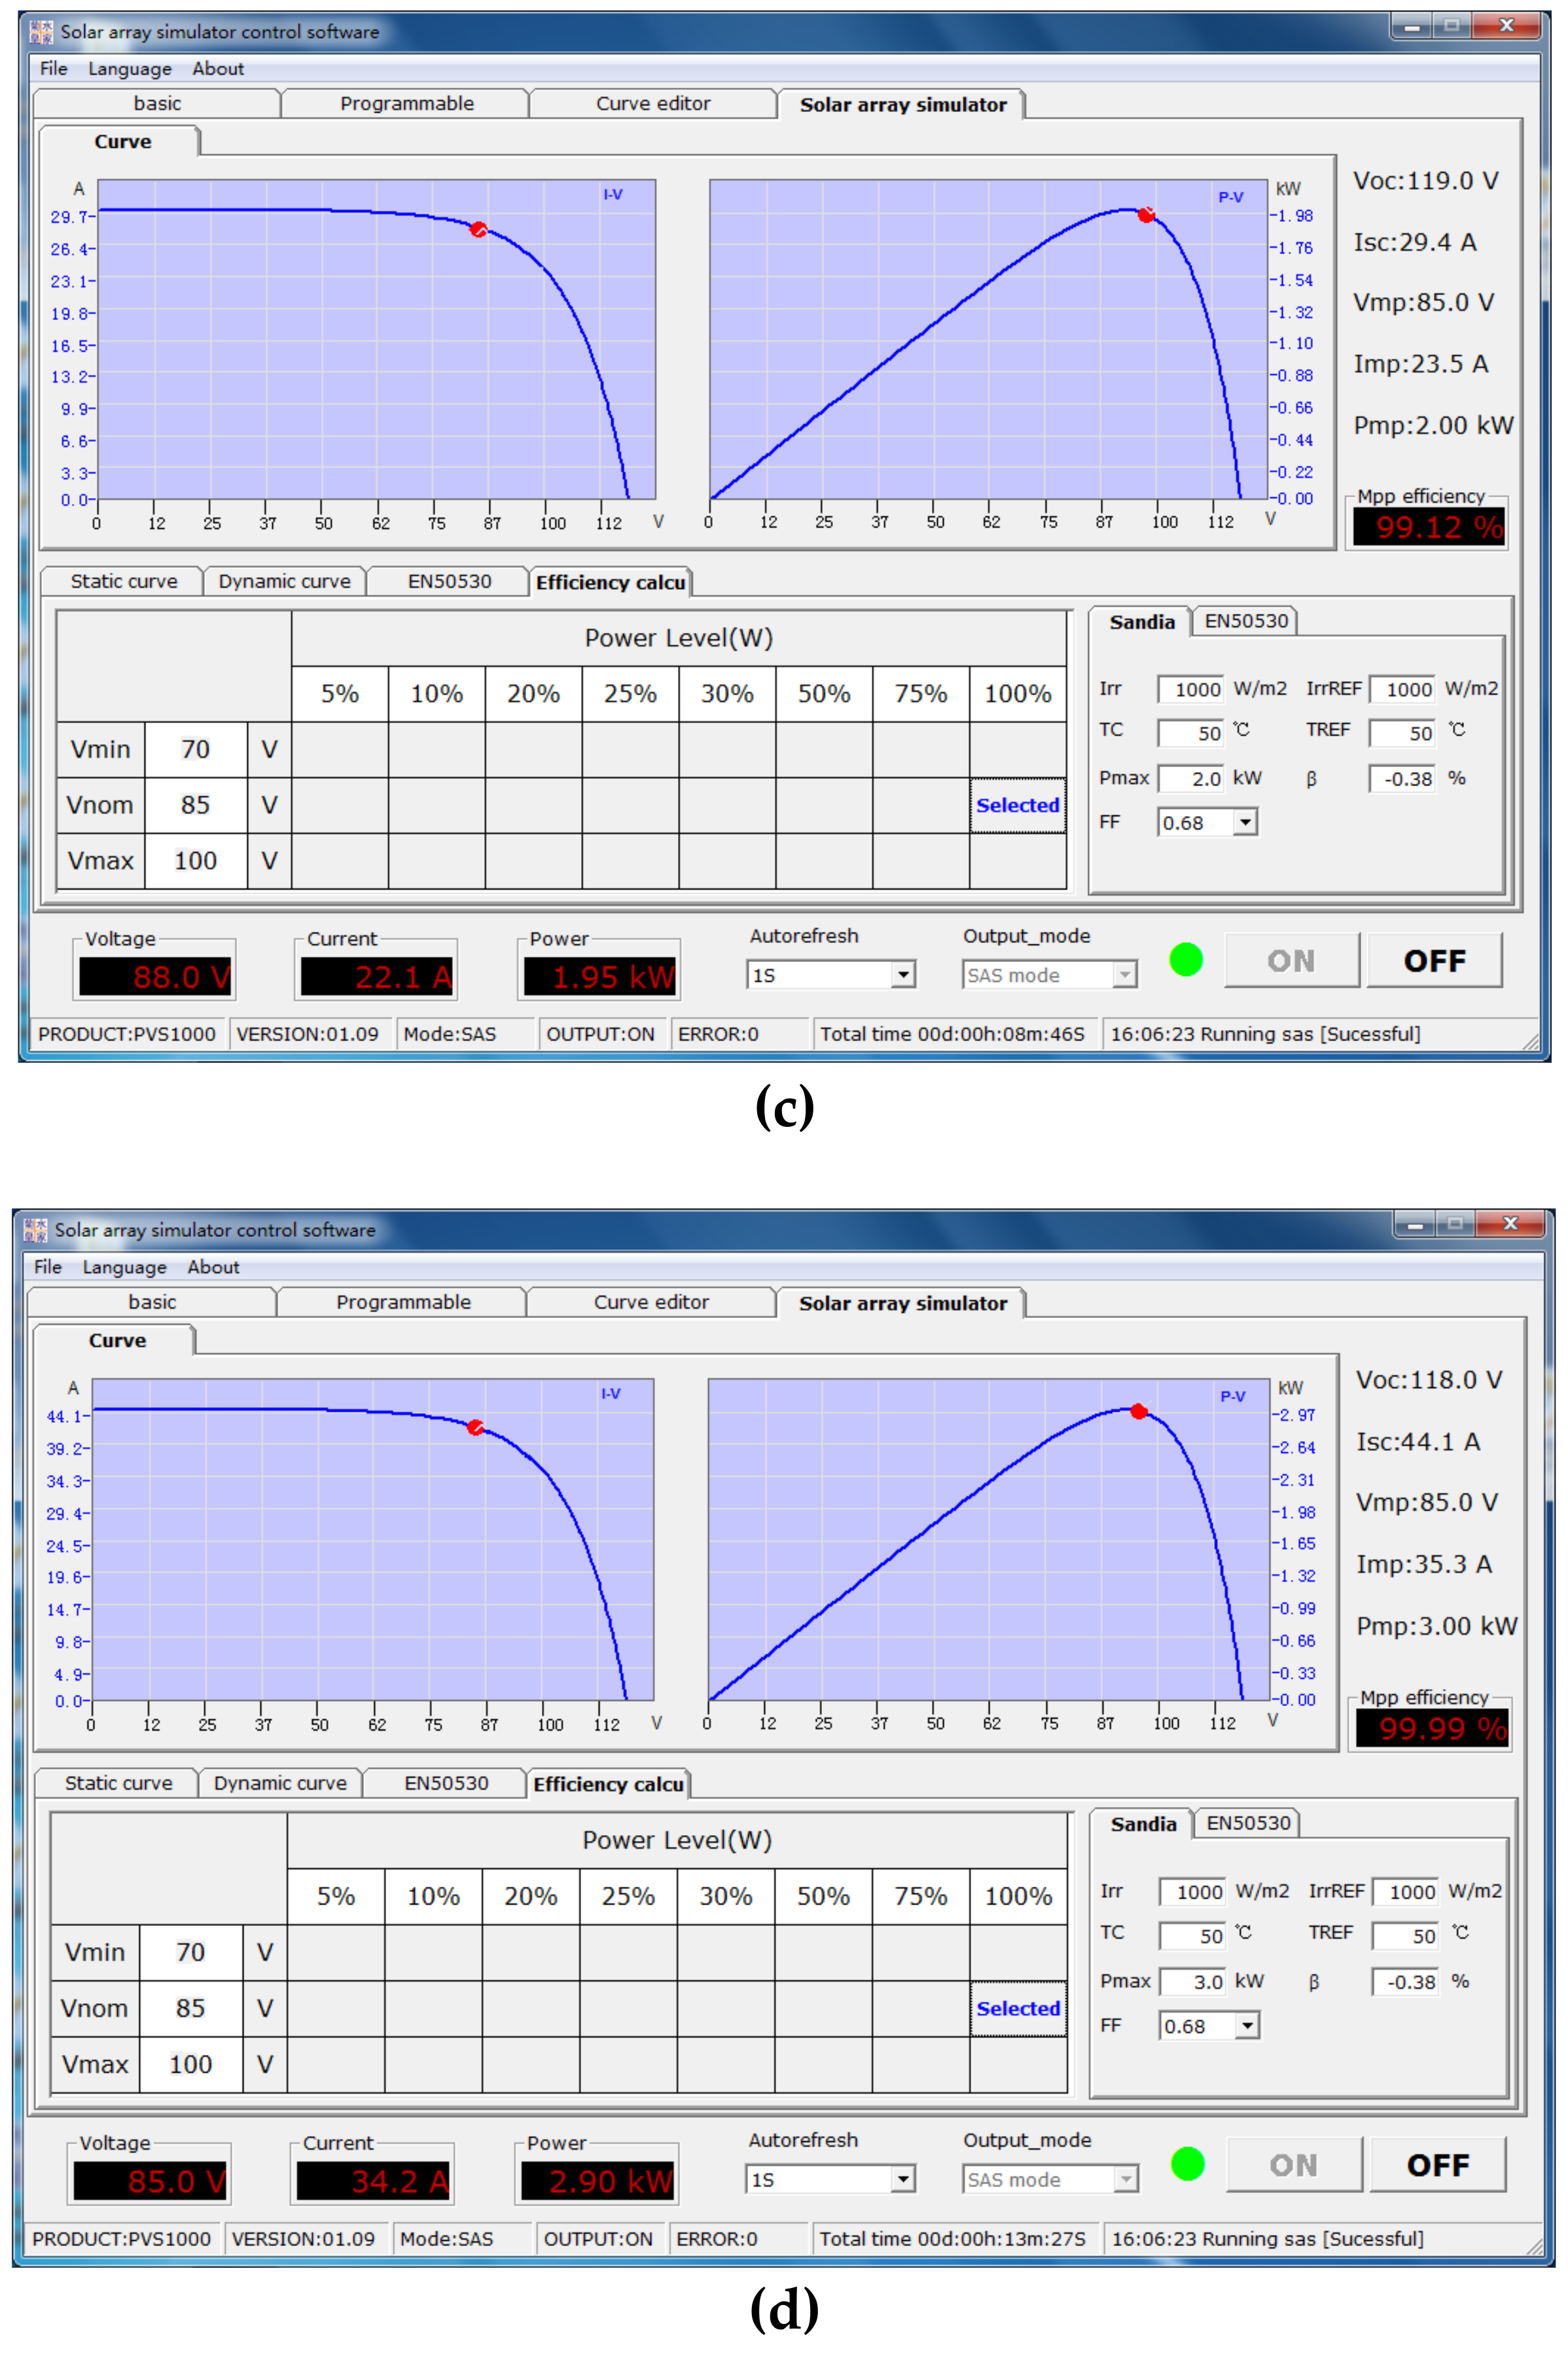
3.1. MPPT Test

A solar photovoltaic simulator and a three-point fuzzy MPPT algorithm with a variable step size were used for the tracking experiments. The power point tracking process can be clearly observed. The corresponding tracking results are shown in Figure 11.
It can be observed from the figure that the maximum power point can be found steadily and quickly at low power and high power. The working voltage and current of the maximum power point are consistent with the actual output characteristics of the photovoltaic panels.

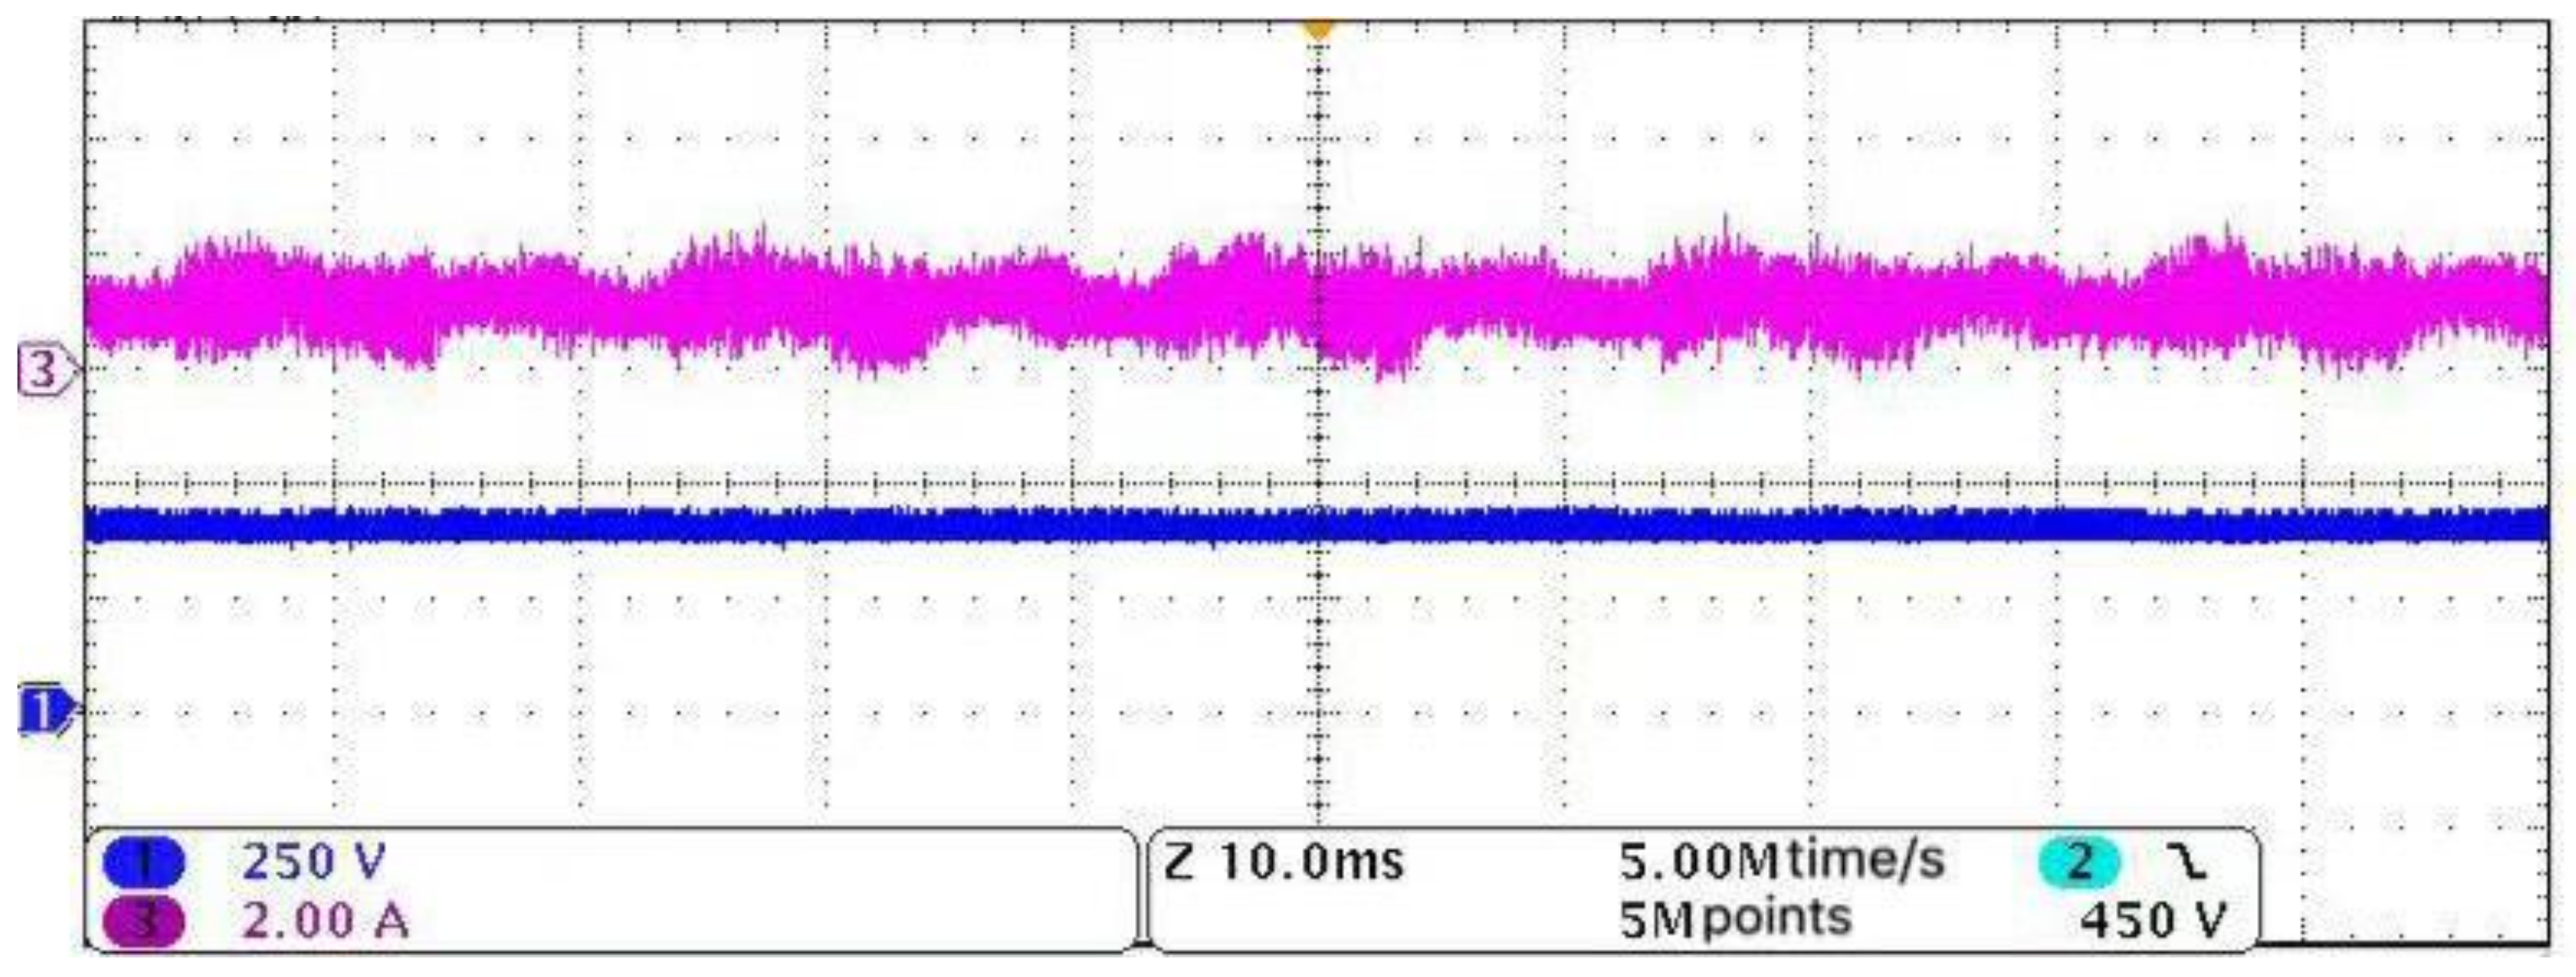
3.2. Discharge Bus Waveform Test

Upon discharging, the output voltage of the push–pull circuit is the bus voltage, and the purpose of the constant-voltage discharge control is to maintain a constant bus voltage. Figure 12 shows the voltage and current waveforms of the loaded push–pull discharge busbar, where the bus voltage is 398 V, which is the same as the set output voltage. Figure 13 shows the ripple voltage of the busbar at this time, where the ripple amplitude is 4.2 V, which is 1% of the bus voltage. The fact that the bus ripple amplitude is low indicates the effectiveness of the designed bus capacitance and constant voltage control.

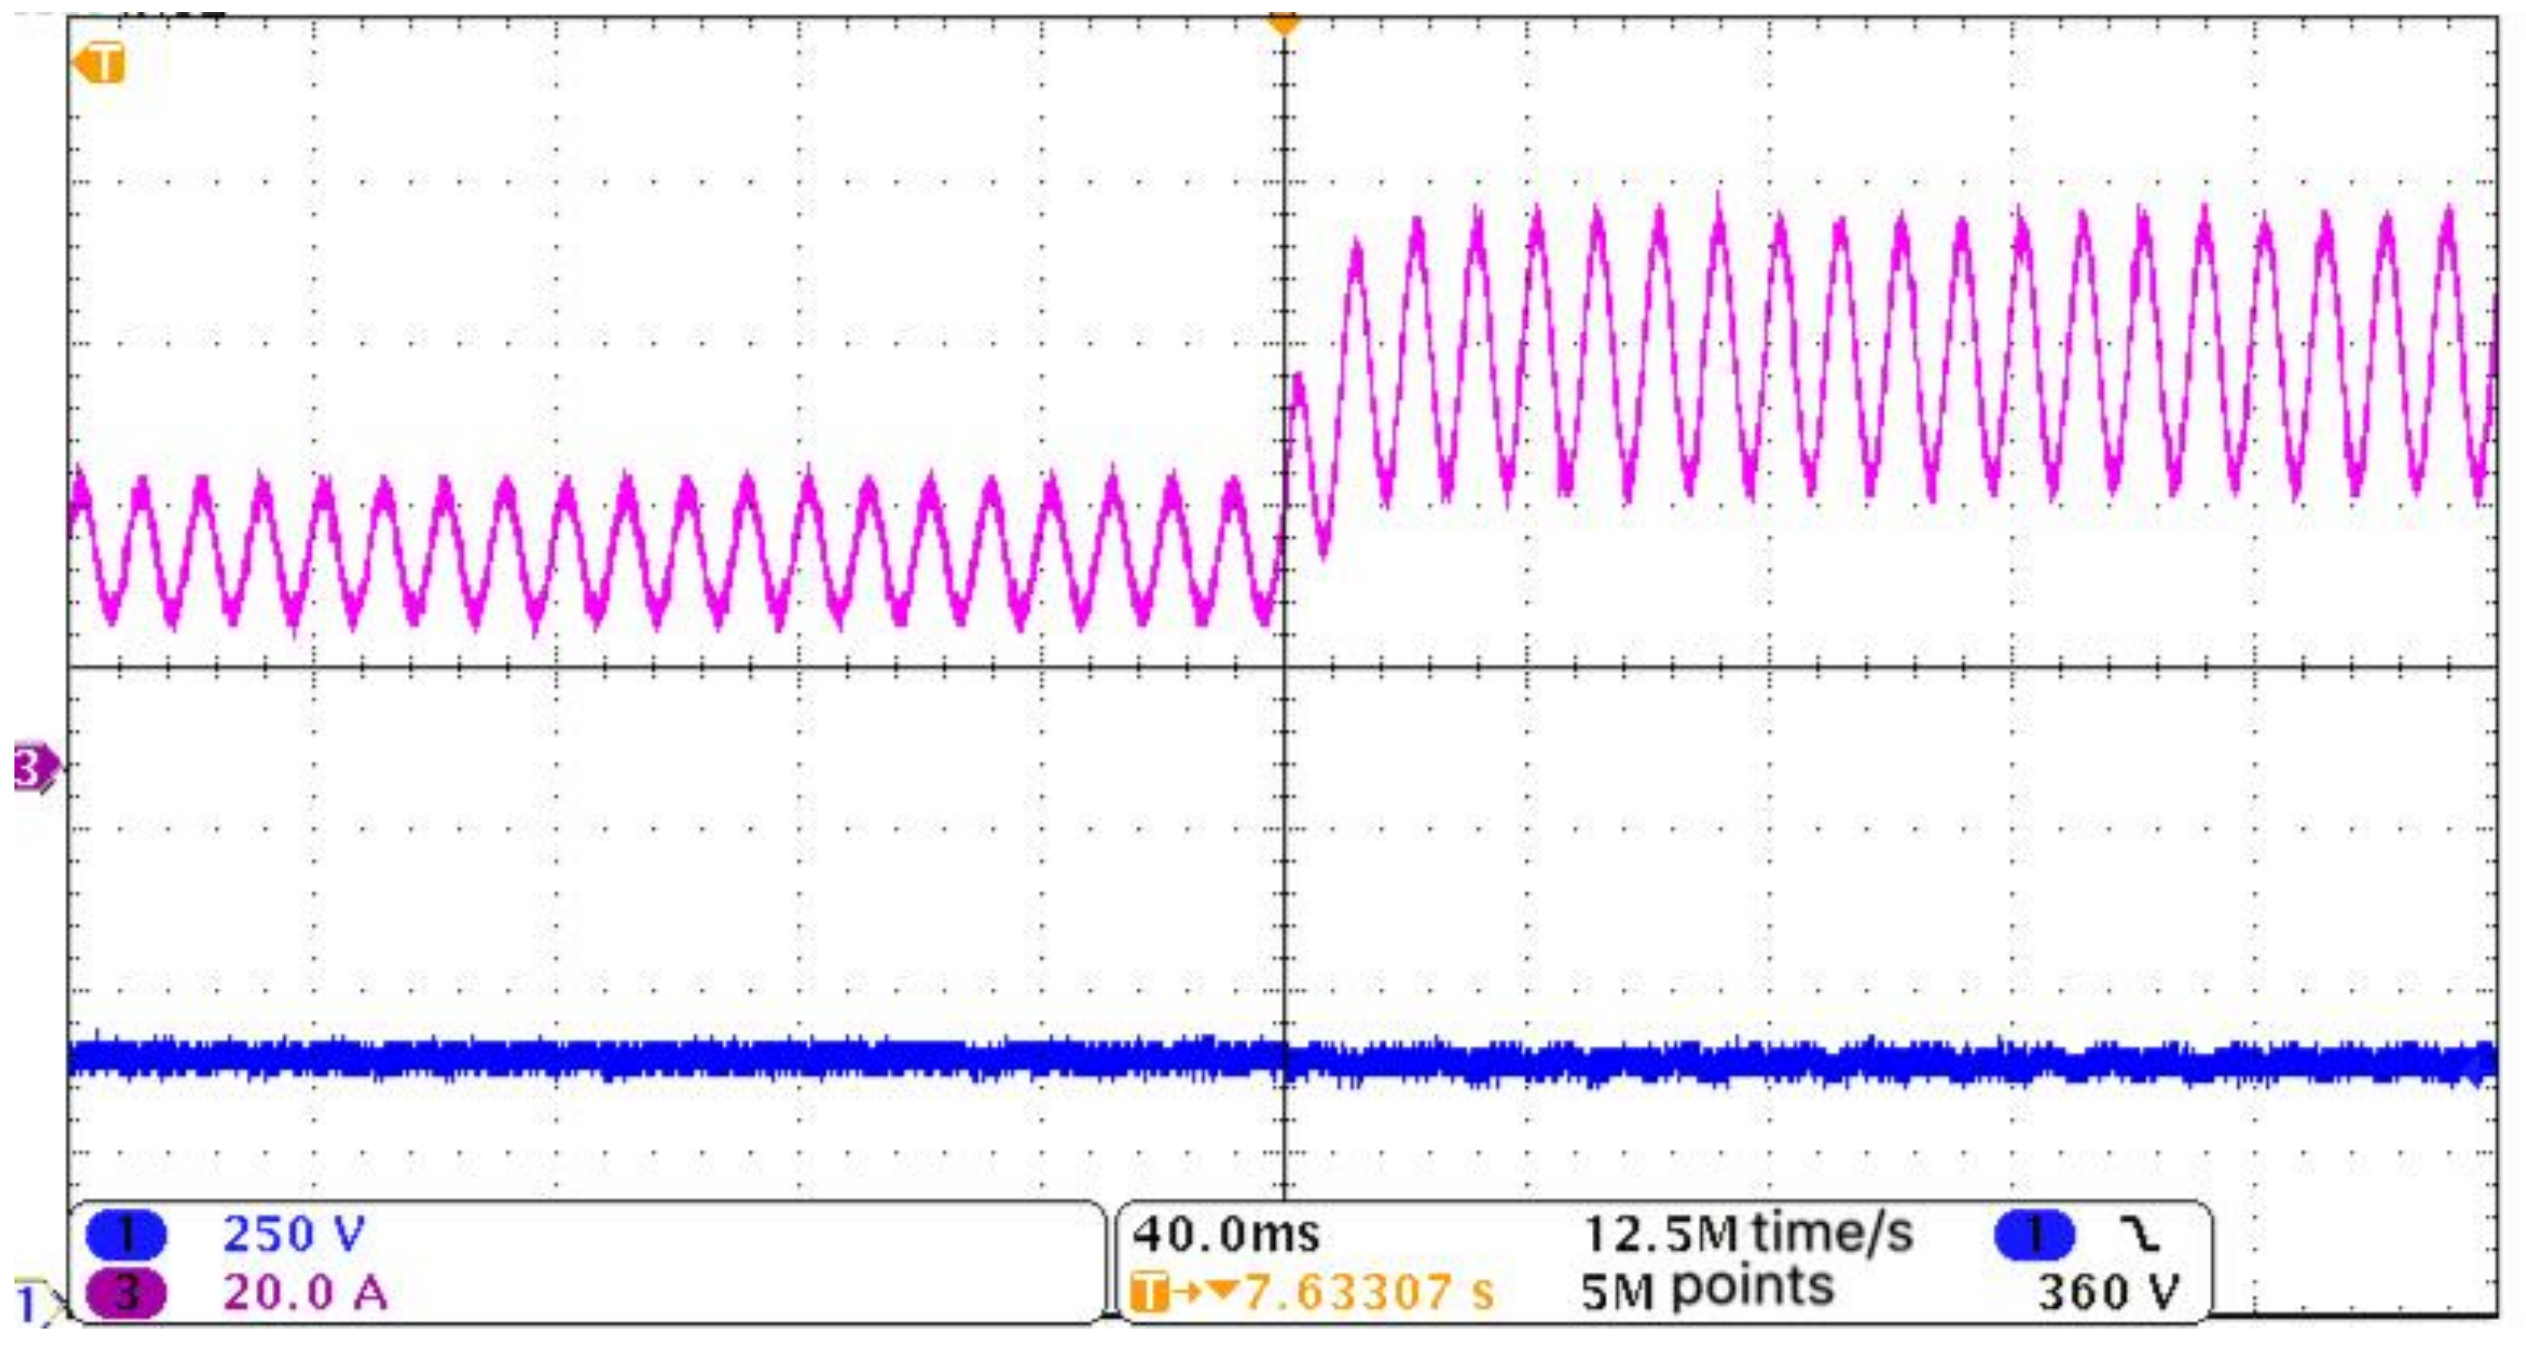
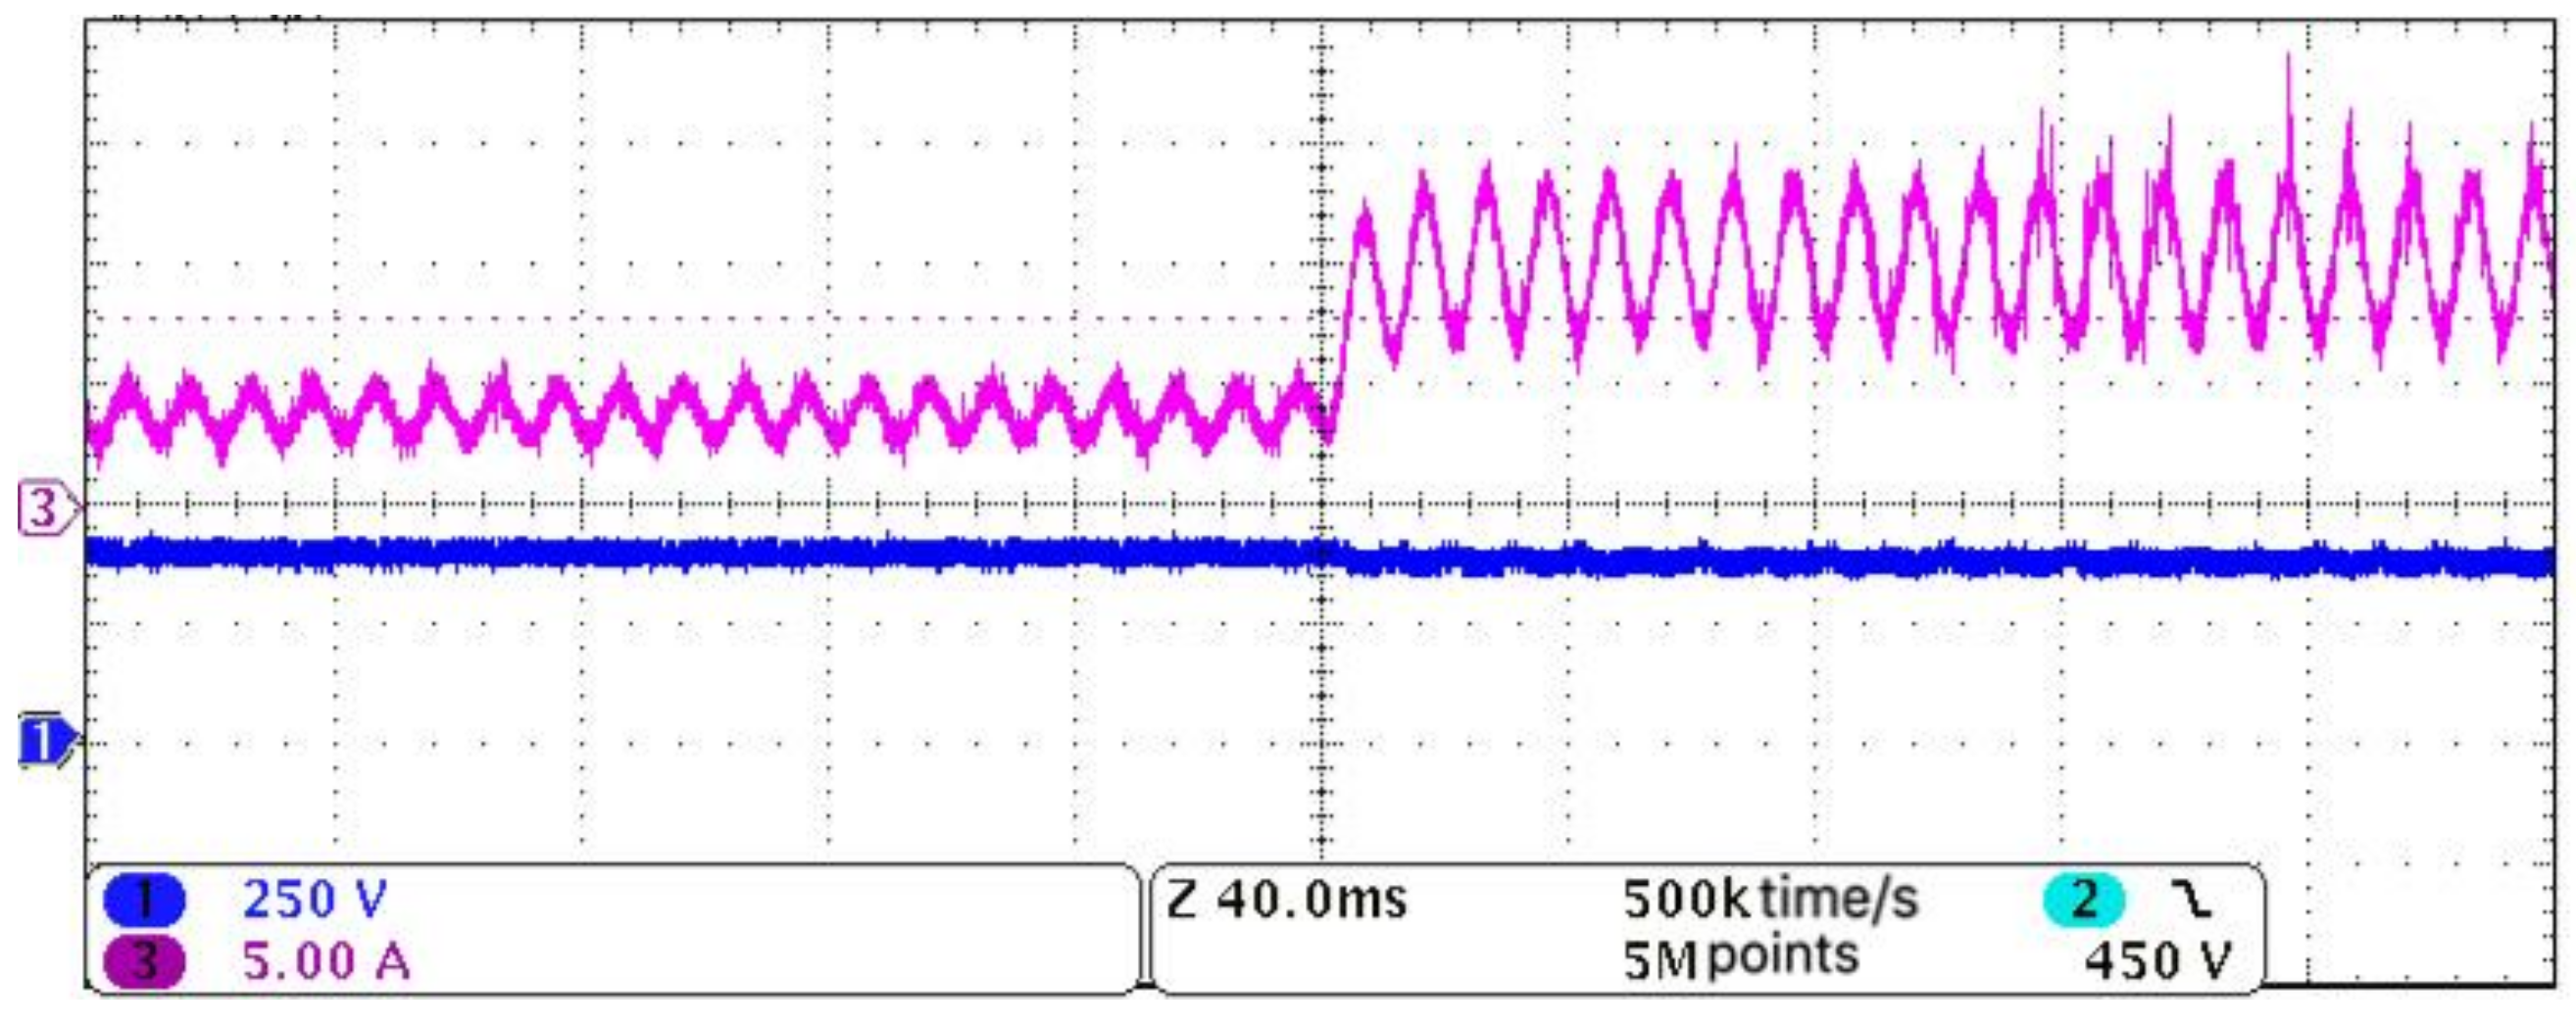
3.3. Push–Pull Discharge Load Switching Test

When a load is connected to the post stage of the busbar and there is little to no output power from the photovoltaic system, the battery starts to discharge. The battery outputs different power values when the load switches. By connecting an AC load to the post-stage inverter and setting the AC output to 50 Hz and the AC load switching sequence to 300 W → 800 W → 1000 W → 2000 W, the bus voltage and battery discharge current switching waveforms can be obtained, as shown in Figure 14. Figure 15 and Figure 16 show the partial enlargement battery discharge and bus current waveforms when the load switches from 1000 to 2000 W. These figures show that the ripple frequency of the bus current is 100 Hz, which is twice the AC load frequency; this is consistent with the theoretical analysis. In addition, it is noted that the switching process is fast and takes approximately 10 ms, and the bus voltage generally remains stable despite a slight drop, indicating that the dynamic response of the system is rapid.

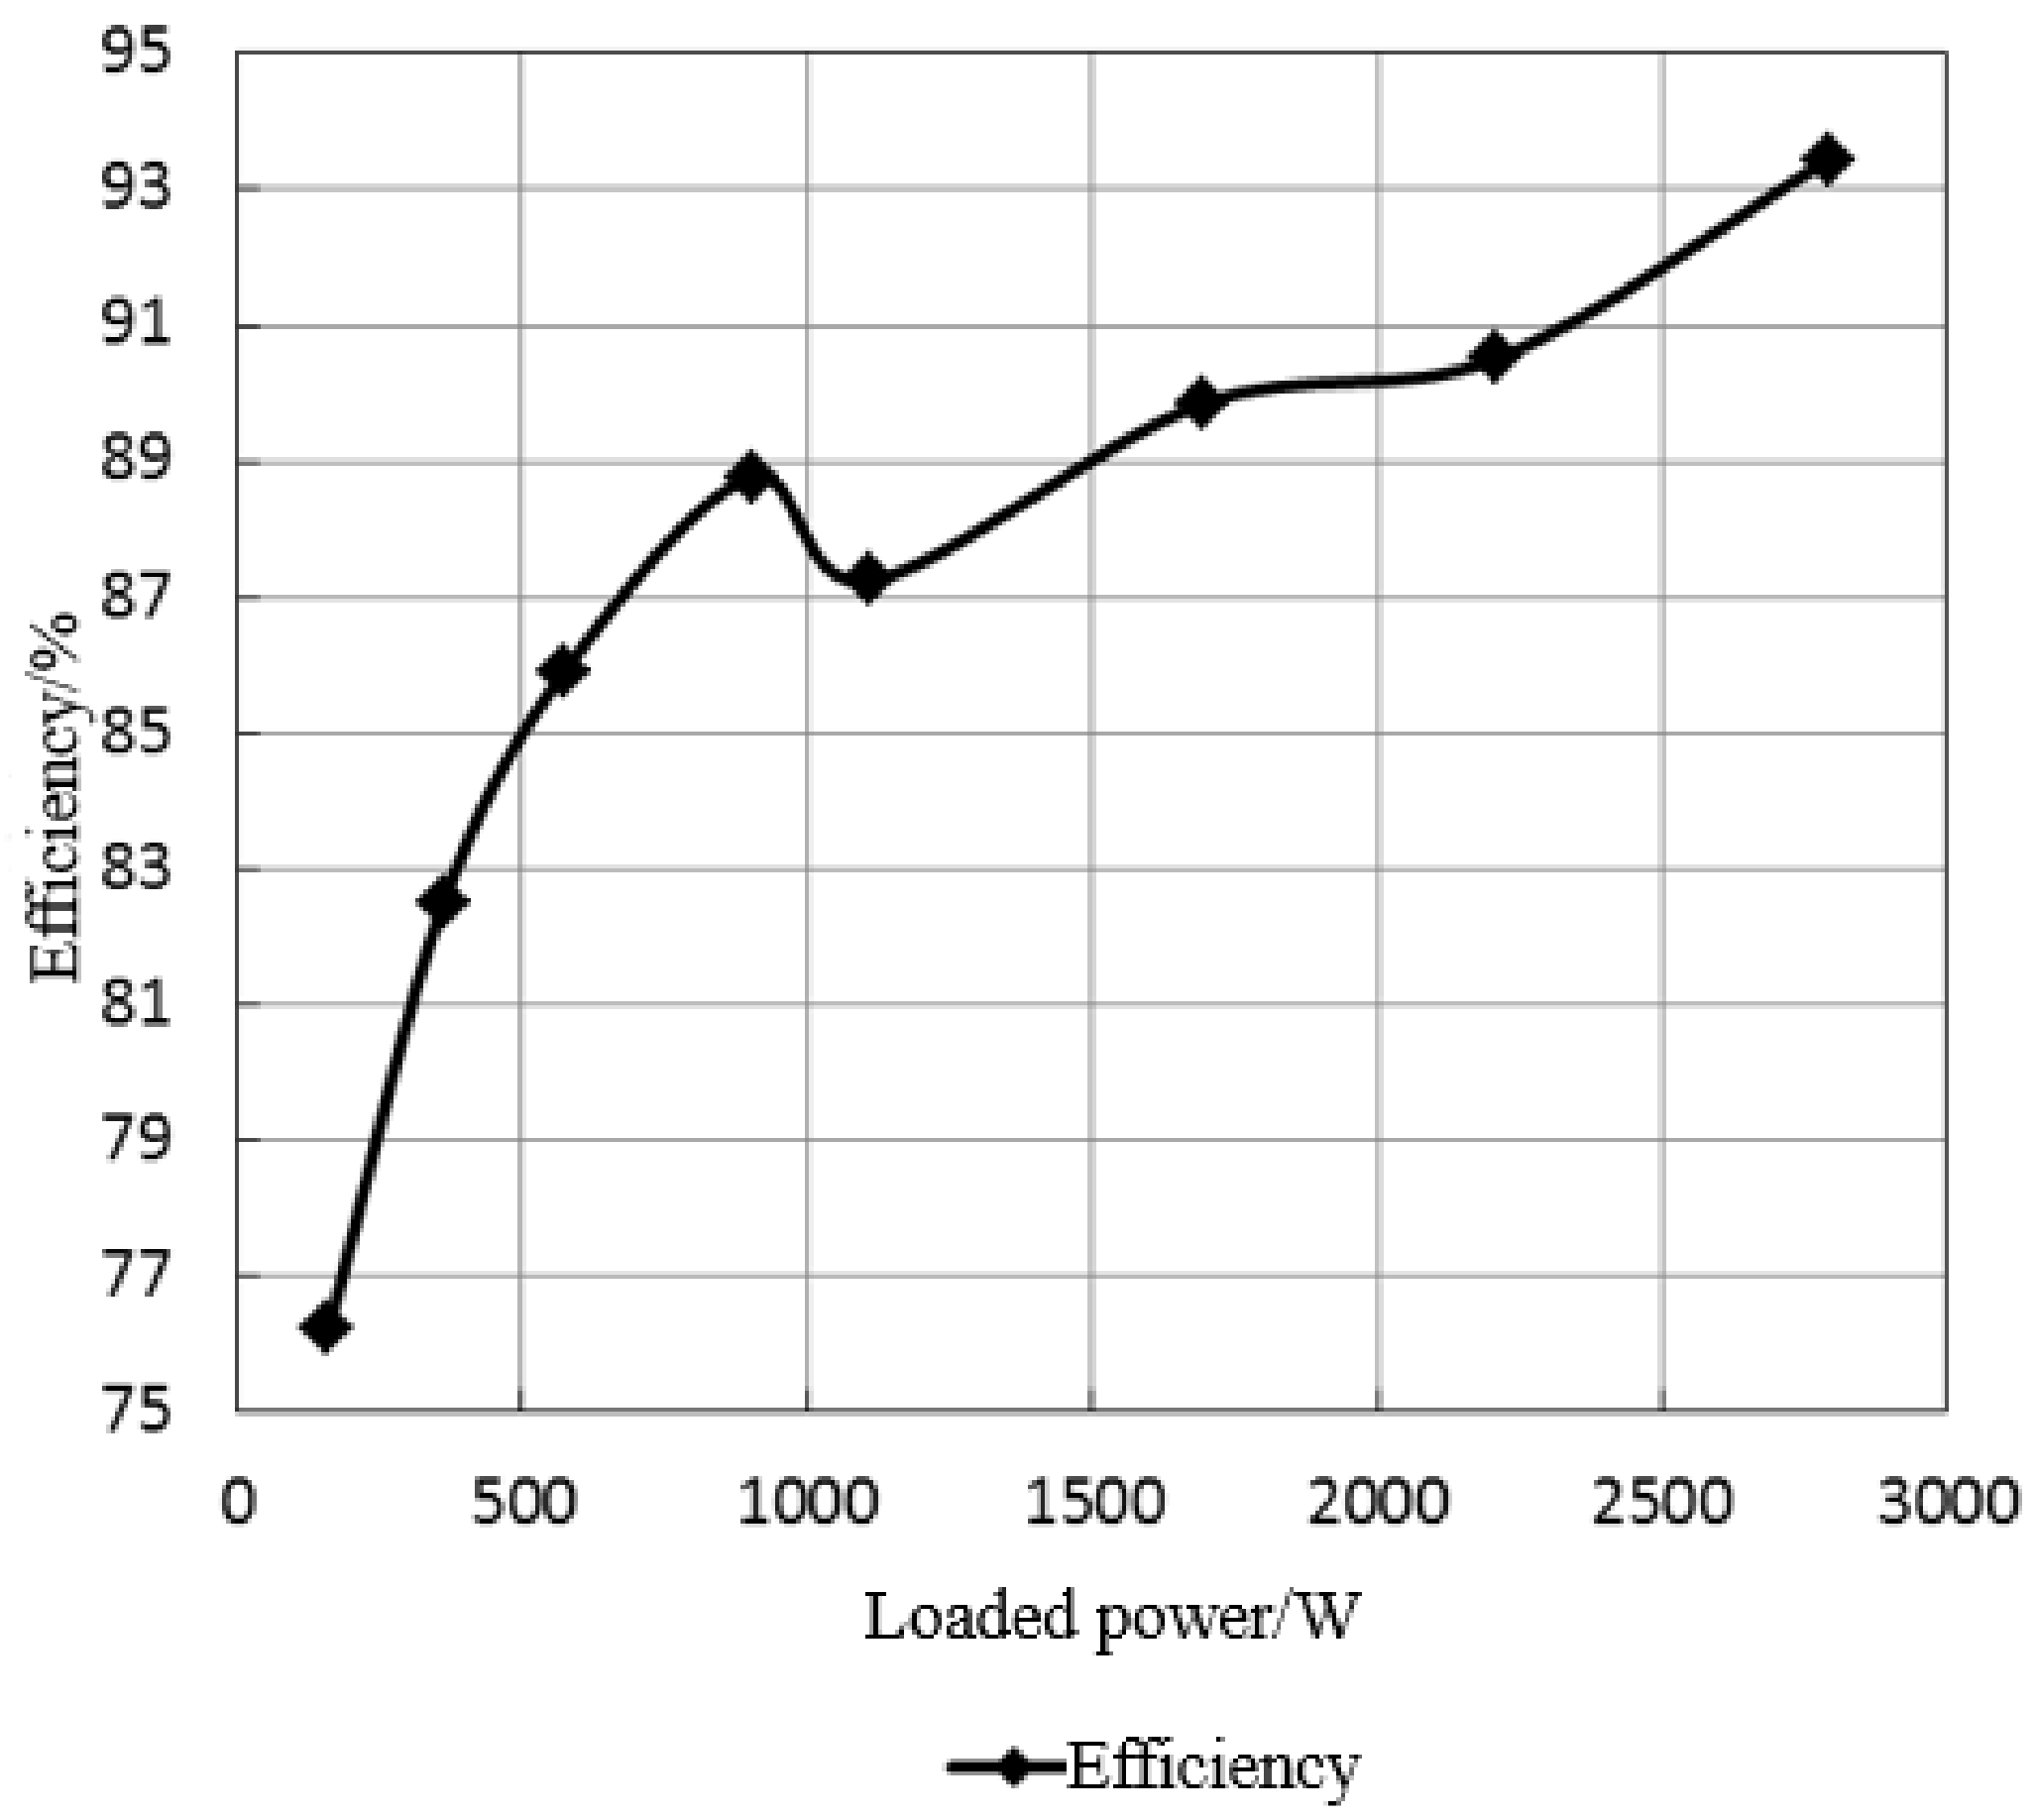
3.4. Push–Pull Circuit Efficiency Test

To test whether the efficiency of the push–pull circuit meets the design requirements, the efficiency at eight power points was measured. With the battery discharging and the load connected to the post-stage inverter, the voltage and current at the busbar end and the battery end were measured. Figure 17 shows the measured efficiency; the efficiency of the push–pull discharge circuit generally increases with an increase in the power. The highest efficiency point appears at the maximum load, which is approximately 93.43%, indicating that the system satisfies the design requirements.

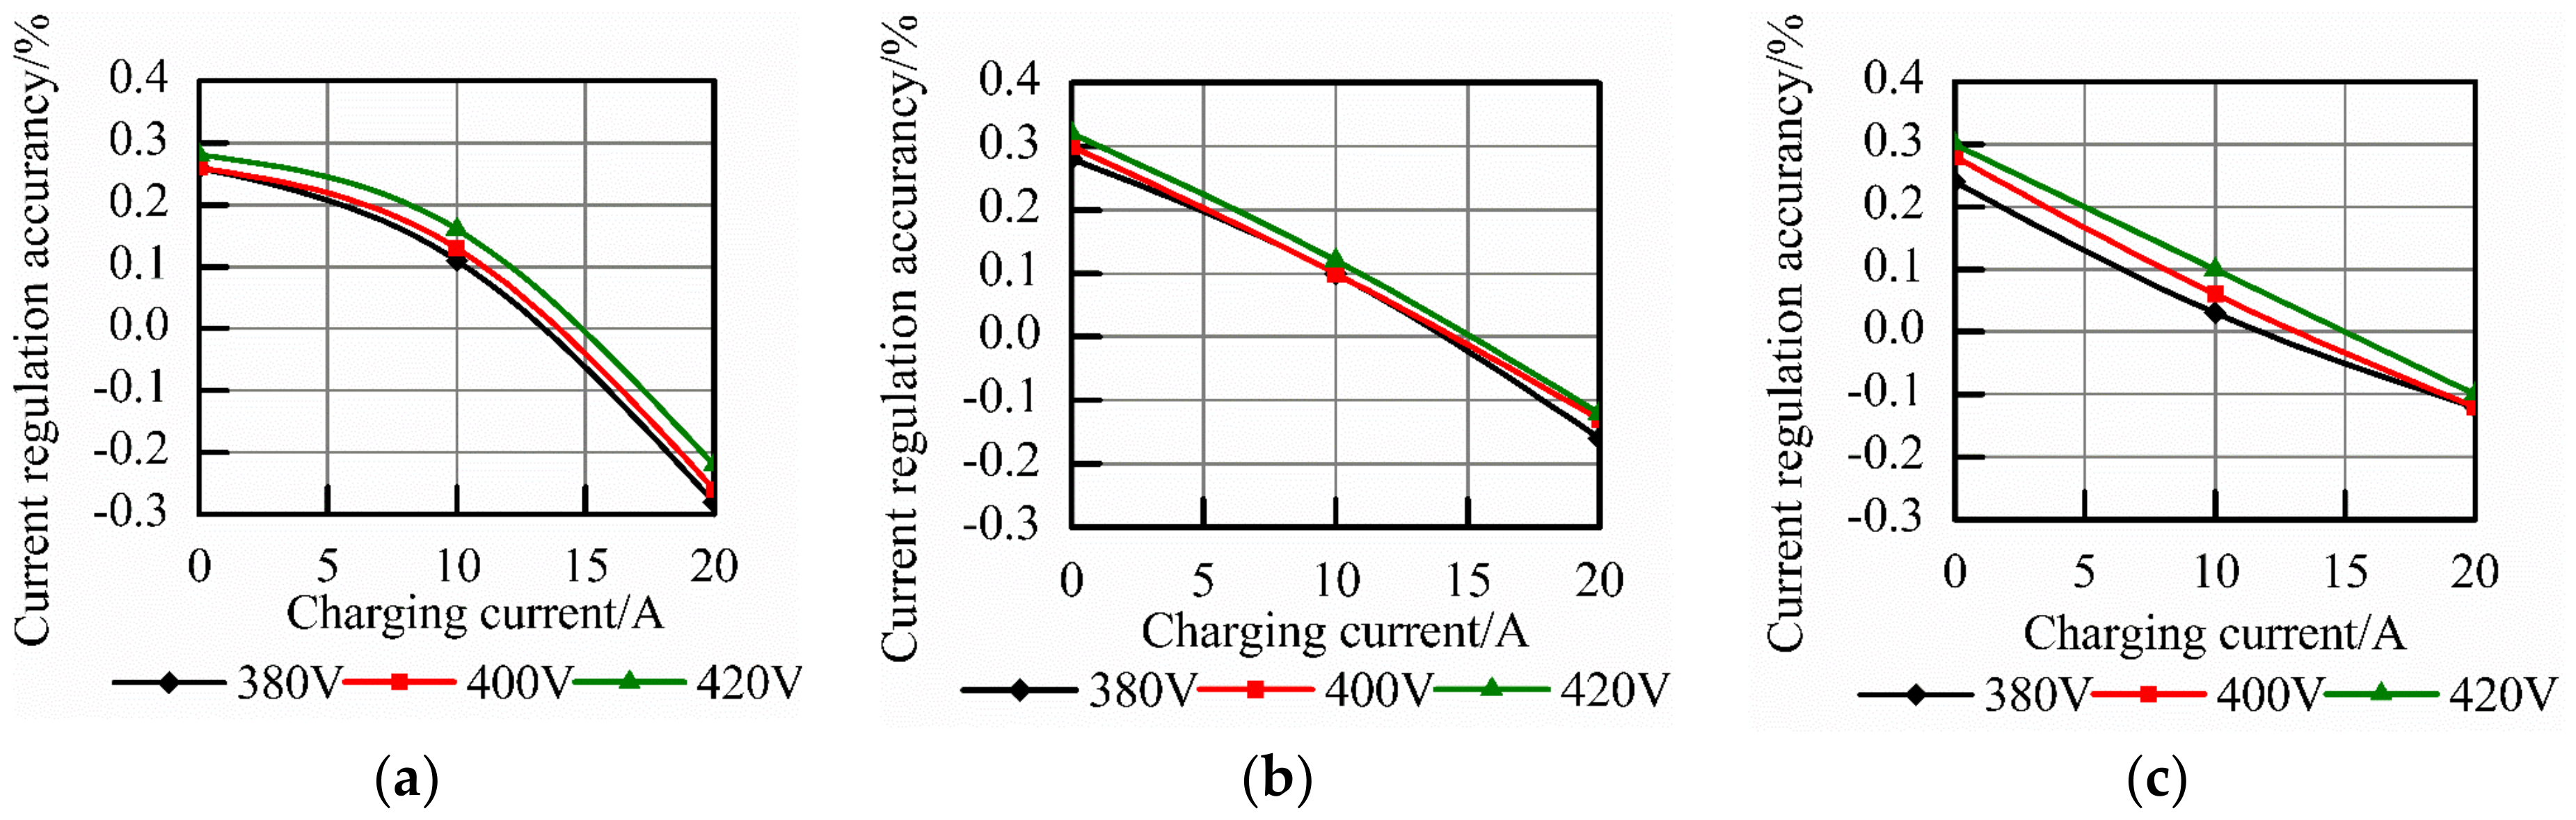
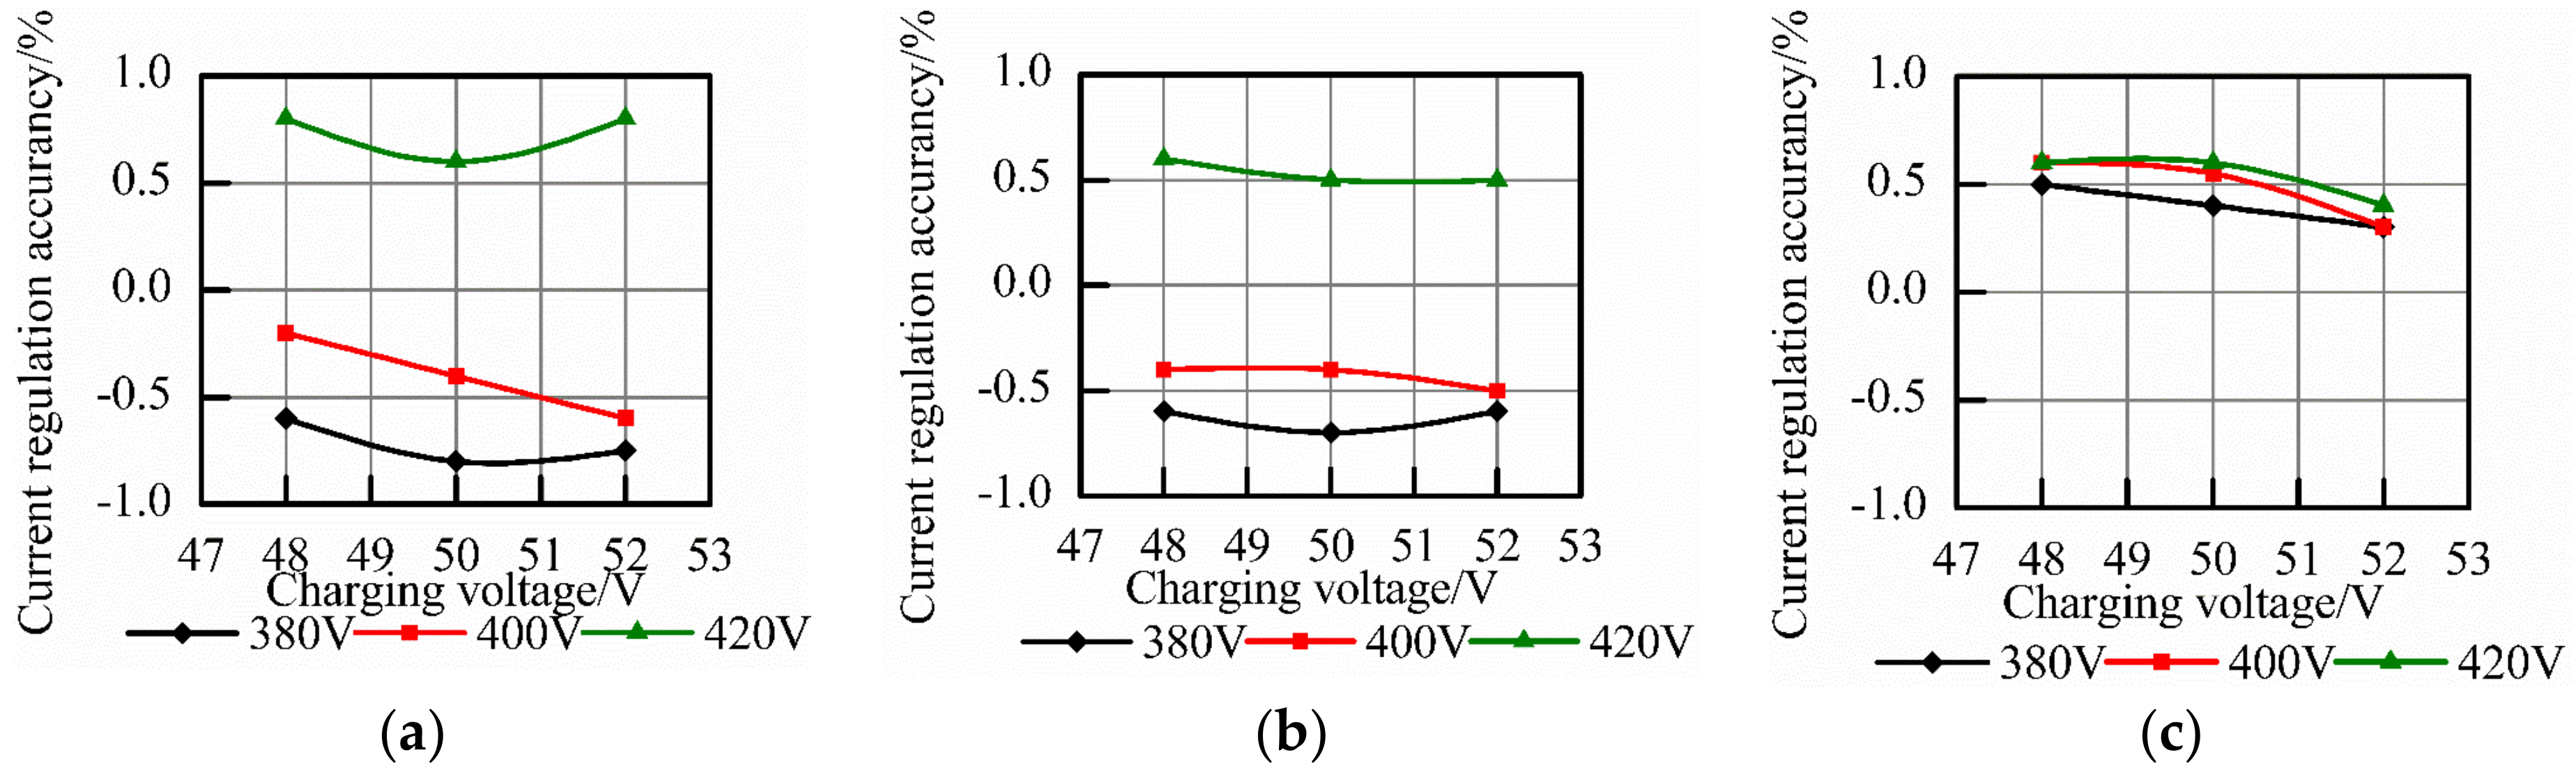
3.5. Voltage Regulation and Current Regulation Accuracy Tests

The most important part of the charging process is to control the charging voltage and charging current. As the stage charging method uses only the PI algorithm to maintain a stable charging voltage or charging current during each stage, voltage regulation and current regulation accuracy tests are required in order to verify whether the employed PI algorithm can satisfy the control requirements. In this study, we used a DC power supply to set the input voltage (bus voltage) to 380, 400, and 420 V, and an electronic load to set the output current (charging current) to 0, 10, and 20 A. Moreover, the charging voltage was set to 48, 50, and 52 V, respectively, to conduct the voltage regulation accuracy test. Figure 18 shows the test results.
Figure 18 shows that at no load, the charging voltage is slightly higher than the set voltage; at a medium load, the charging voltage is closest to the set voltage; and at a high load, the charging voltage is lower than the set voltage. Figure 19 shows the voltage regulation accuracy results with respect to different set voltages.
In Figure 19a, the voltage regulation accuracy at a set voltage of 48 V is between −0.27% and 0.29%. In Figure 19b, the voltage regulation accuracy at a set voltage of 50 V is between −0.18% and 0.32%. In Figure 19c, the voltage regulation accuracy at a set voltage of 52 V is between −0.13% and 0.31%. These results satisfy the design requirement, that is, a voltage regulation accuracy of ±0.5%.
A DC power supply was used to set the input voltage (bus voltage) to 380, 400, and 420 V, and an electronic load was used to set the output current (charging current) to 0, 10, and 20 A. Moreover, the charging voltage was set to 48, 50, and 52 V in order to conduct the current regulation accuracy test. Figure 20 shows the test results.
Figure 21 shows the current regulation accuracies at different set currents. The results show that the higher the set charging current, the more accurate the current regulation. In Figure 21a, the current regulation accuracy at a set current of 5 A is between −0.8% and 0.8%. In Figure 21b, the current regulation accuracy at a set current of 10 A is between −0.7% and 0.6%. In Figure 21c, the current regulation accuracy at a set current of at 20 A is between 0.3% and 0.6%. These results satisfy the design requirement, that is, a current regulation accuracy of ±1%.

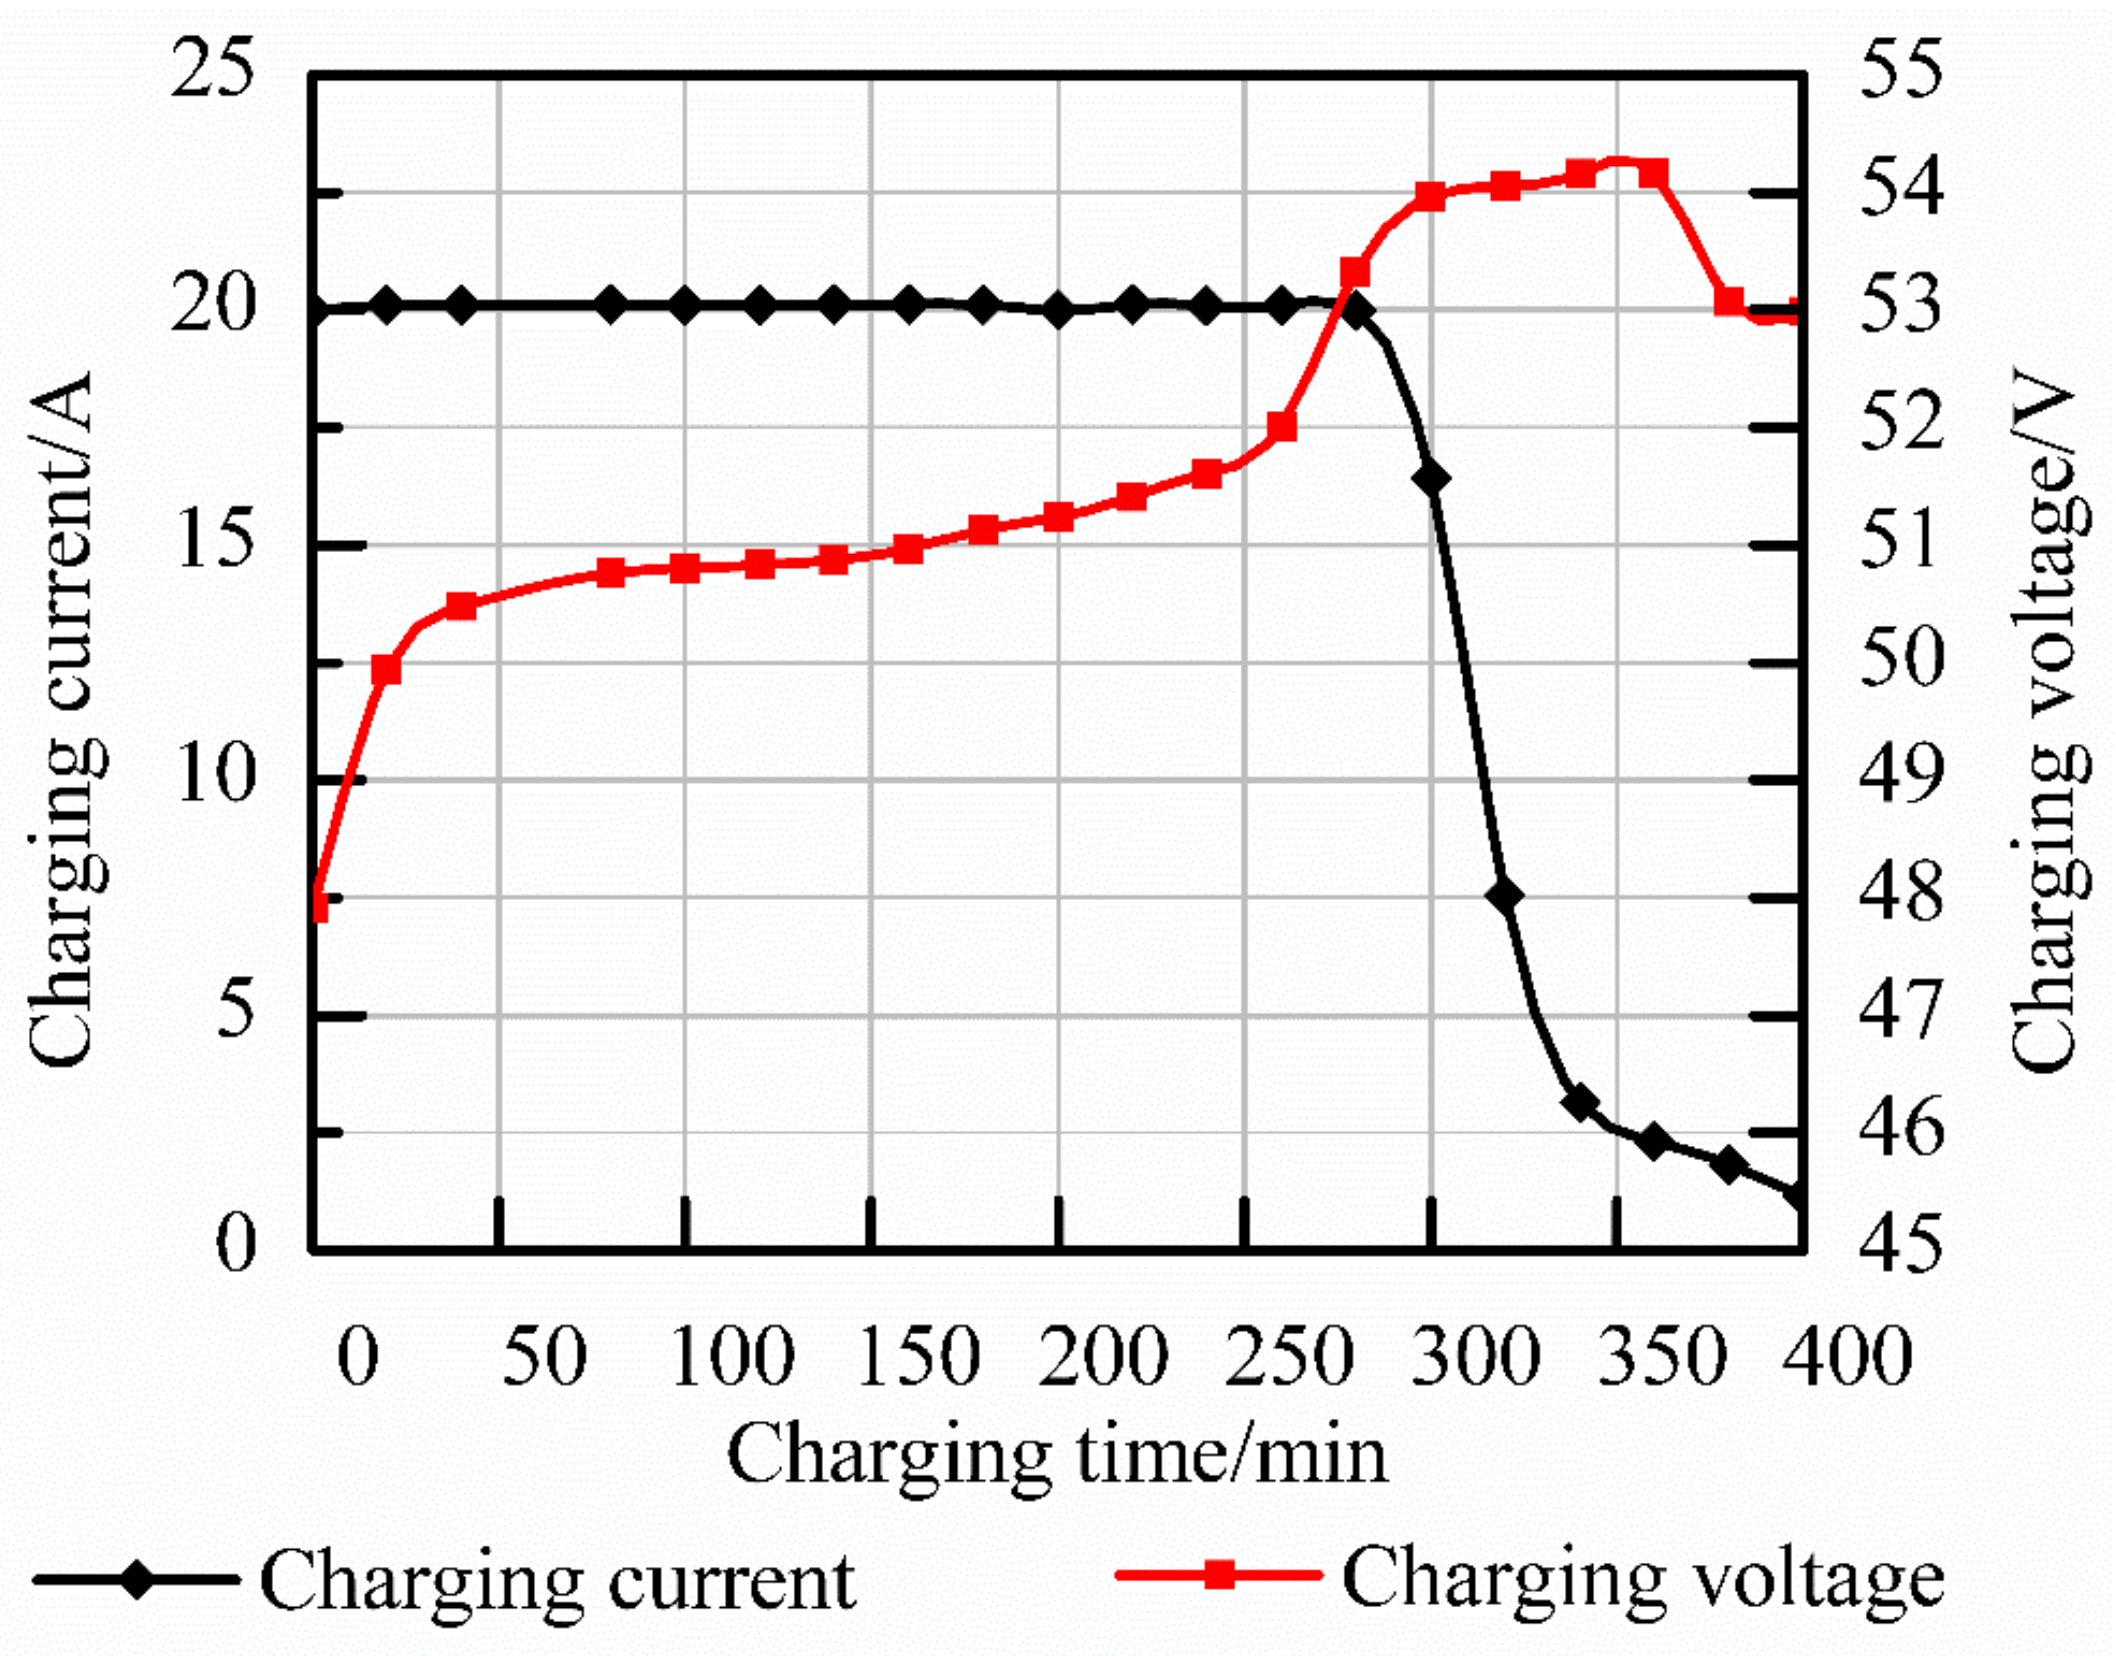
3.6. Charging Experiment Data Collection

A battery charging experiment was conducted to validate the charging algorithm. In this study, we used a 48 V/100 AH lithium titanate battery pack comprising two parallel and 15 serial single 50 AH/3.2 V aluminum-shell battery cells.
Charging was carried out with sufficient photovoltaic power and a lithium titanate battery pack with a rated voltage of 48 V. Therefore, the charging process only underwent the constant-current, constant-voltage, and floating charging stages. The charging voltage and charging current data were recorded every 20 min, with a total charging time of 405 min, and the battery temperature was kept below 30 °C. Table 2 lists the recorded data.
The above data were then curve-fitted using EXCEL; Figure 22 shows the results. The charging process is consistent with the designed four-stage charging algorithm, indicating that this algorithm is effective and feasible.

4. Conclusions

This paper reports on the charging and discharging system of a lithium titanate battery for photovoltaic energy storage. The study employed a phase-shifted full-bridge charge and push–pull discharge plan, and a battery charge management system was proposed using an enhanced four-stage charging method based on MPPT. Moreover, the charging control strategies with and without MPPT were analyzed in detail, and a PI-based closed-loop charging control algorithm that maintains the busbar stability was introduced so as to solve the over-voltage and over-discharge problems observed in the conventional stage charging method used for photovoltaic power generation. The following conclusions are drawn from the study:
(1)
An improved disturbance observation method with a three-point variable step size is proposed based on the traditional perturbation and observation method. Maximum power point tracking was carried out, combined with a fuzzy control. In this study, we systematically analyzed the design process of an improved three-point variable step-size perturbation and observation method, and the principle of a fuzzy control MPPT algorithm. Simulink simulation and experiments were conducted. We also analyzed the hardware and software implementation of the algorithm. The simulation and experimental results show that the proposed fuzzy MPPT algorithm can improve the tracking speed and accuracy.
(2)
Battery charge and discharge tests were then conducted using an experimental platform. The charging voltage and current waveforms, voltage and current regulation accuracies, discharge busbar waveforms when switching load, and a discharge efficiency of 93.43% were obtained. The results satisfy the design requirements. The battery charging data recorded by the system is consistent with the constant-voltage and constant-current charging algorithm designed for the charging process. The experimental results verified the feasibility of the hardware system and software algorithm developed for the charging and discharging system of lithium titanate batteries.

Author Contributions

Conceptualization, Z.F. and Y.F.; methodology, Z.F. and X.C.; experiment, Z.Z. and Z.F.; writing (original draft preparation), Z.F. and K.Z.; project administration, J.X.

Funding

This research was funded by the Fujian Natural Science Foundation (2018J01541 and 2018J01503), the Fujian Provincial Education Hall Science and Technology Class A (JA15486), the 2015 Dongguan City to Introduce the Third Batch of Innovative Scientific Research Team Project (2017360004004), the Guangzhou Nansha District Science and Technology Program (2016CX010), and the Guangdong Provincial Department of Communications Science and Technology Project (Science and Technology-2017-02-041).

Conflicts of Interest

The authors declare no conflict of interest.

References

  1. Dan, C.; Yan, C. A sociological survey of the survival and development of the global photovoltaic industry. J. Law Econ. 2012, 4, 87–88. [Google Scholar]
  2. Mundo-Hernández, J.; de Celis Alonso, B.; Hernández-Álvarez, J.; de Celis-Carrillo, B. An overview of solar photovoltaic energy in Mexico and Germany. Renew. Sustain. Energy Rev. 2014, 31, 639–649. [Google Scholar] [CrossRef]
  3. Aamir, M.; Ahmed Kalwar, K.; Mekhilef, S. Review: Uninterruptible Power Supply (UPS) system. Renew. Sustain. Energy Rev. 2016, 58, 1395–1410. [Google Scholar] [CrossRef]
  4. Song, D.; Jiao, H.; Fan, C.T. Overview of the photovoltaic technology status and perspective in China. Renew. Sustain. Energy Rev. 2015, 48, 848–856. [Google Scholar] [CrossRef]
  5. Bukhari, S.S.H.; Atiq, S.; Lipo, T.A.; Kwon, B.-I. A Cost-Effective, Single-Phase Line-Interactive UPS System that Eliminates Inrush Current Phenomenon for Transformer-Coupled Loads. J. Electr. Eng. Technol. 2016, 11, 675–682. [Google Scholar] [CrossRef] [Green Version]
  6. Fuente, D.V.D.L.; Rodrguez, C.L.T.; Garcer, G.; Figueres, E.; Gonzalez, R.O. Photovoltaic Power System With Battery Backup With Grid-Connection and Islanded Operation Capabilities. IEEE Trans. Ind. Electron. 2012, 60, 1571–1581. [Google Scholar] [CrossRef]
  7. Tolani, S.; Sensarma, P. Extended Bandwidth Instantaneous Current Sharing Scheme for Parallel UPS Systems. IEEE Trans. Power Electron. 2017, 32, 4960–4969. [Google Scholar] [CrossRef]
  8. Wu, T.; Liu, Z.; Liu, J.; Wang, S.; You, Z. A Unified Virtual Power Decoupling Method for Droop-Controlled Parallel Inverters in Microgrids. IEEE Trans. Power Electron. 2016, 31, 5587–5603. [Google Scholar] [CrossRef]
  9. Laurischkat, K.; Jandt, D. Techno-economic analysis of sustainable mobility and energy solutions consisting of electric vehicles, photovoltaic systems and battery storages. J. Clean. Prod. 2018, 179, 642–661. [Google Scholar] [CrossRef]
  10. Cucchiella, F.; D’Adamo, I.; Gastaldi, M.; Stornelli, V.; Rosen, M.A. Solar photovoltaic panels combined with energy storage in a residential building: An economic analysis. Sustainability 2018, 10, 3117. [Google Scholar] [CrossRef]
  11. Zhang, Y.; Ma, H. Analysis of Networked Control Schemes and Data-Processing Method for Parallel Inverters. IEEE Trans. Ind. Electron. 2014, 61, 1834–1844. [Google Scholar] [CrossRef]
  12. Yan, X.W.; Wang, Y.R.; Wang, X.H. Study on power decoupling and robust droop control method of parallel inverter. J. Electr. Power Sci. Technol. 2016, 1, 003. [Google Scholar]
  13. Zhang, Q.; An, L.; Chen, Y.; Peng, C.; Peng, Z. Analysis of Output Impedance for Parallel Inverters and Voltage Control Strategy. Trans. China Electrotech. Soc. 2014, 29, 98–105. [Google Scholar]
  14. Dolara, A.; Grimaccia, F.; Mussetta, M.; Ogliari, E.; Leva, S. An Evolutionary-Based MPPT Algorithm for Photovoltaic Systems under Dynamic Partial Shading. Appl. Sci. 2018, 8, 558. [Google Scholar] [CrossRef]
  15. Atawi, I.; Kassem, A. Optimal Control Based on Maximum Power Point Tracking (MPPT) of an Autonomous Hybrid Photovoltaic/Storage System in Micro Grid Applications. Energies 2017, 10, 643. [Google Scholar] [CrossRef]
  16. Lu, X.; Guerrero, J.M.; Sun, K.; Vasquez, J.C. An Improved Droop Control Method for DC Microgrids Based on Low Bandwidth Communication with DC Bus Voltage Restoration and Enhanced Current Sharing Accuracy. IEEE Trans. Power Electron. 2013, 29, 1800–1812. [Google Scholar] [CrossRef]
  17. Zhong, Q.-C.; Zeng, Y. Universal Droop Control of Inverters with Different Types of Output Impedance. IEEE Access 2016, 4, 702–712. [Google Scholar] [CrossRef]
  18. Jia-Xin, L.; Zhang, Y.C.; Qian, X.S.; Cheng, S.; Zhao, Z.M. Analysis of Virtual Output-impedance for Parallel-connected Inverters with Wireless Load-sharing Control. J. Power Supply 2014, 12, 54–60. [Google Scholar]
  19. Zhao, J.; Liu, H.; Keqing, Q.U.; Fen, L.I. An Improved Droop Control Strategy Based on Virtual Impedance in Inverter Parallel System. J. Shanghai Univ. Electr. Power 2015, 2, 001. [Google Scholar]
  20. Haoran, L.I.; Yang, X.; Feng, C. Control strategy research of output impedance analysis and improved droop control based on multiple-inverters parallel. Power Syst. Prot. Control 2015, 43, 29–35. [Google Scholar]
Figure 1. Schematic of charging and discharging system of lithium titanate battery. ADC: analog-to-digital converter; PWM: pulse-width modulation.
Applsci 08 02520 g001
Figure 2. Enhanced stage charging curve based on maximum power point tracking (MPPT).
Applsci 08 02520 g002
Figure 3. Flow chart of charging algorithm.
Applsci 08 02520 g003
Figure 4. MPPT-mode charging algorithm control block diagram. PI: proportional-integral.
Applsci 08 02520 g004
Figure 5. PI-based closed-loop charging control algorithm.
Applsci 08 02520 g005
Figure 6. Judgment diagram of three point working mode. (a) Pattern 1; (b) Pattern 2; (c) Pattern 3.
Applsci 08 02520 g006
Figure 7. Control block diagram based on fuzzy MPPT algorithm.
Applsci 08 02520 g007
Figure 8. Power output curve of PV panel.
Applsci 08 02520 g008
Figure 9. Partial tracking of MPPT tracking power.
Applsci 08 02520 g009
Figure 10. MPPT tracking effect under the condition of illumination disturbance.
Applsci 08 02520 g010
Figure 11. Tracking results of different powers. (a) 500 W tracking effect; (b) 1 kW tracking effect; (c) 2 kW tracking effect; (d) 3 kW tracking effect.
Applsci 08 02520 g011aApplsci 08 02520 g011b
Figure 12. Voltage and current waveforms of the push–pull discharge busbar.
Applsci 08 02520 g012
Figure 13. Ripples of the push–pull discharge busbar.
Applsci 08 02520 g013
Figure 14. Bus voltage and battery discharge current waveforms when switching load.
Applsci 08 02520 g014
Figure 15. Partial enlargement of the bus voltage and battery current waveforms when switching load.
Applsci 08 02520 g015
Figure 16. Partial enlargement of the bus voltage and bus current waveforms when switching loads.
Applsci 08 02520 g016
Figure 17. Efficiency–load power curve.
Applsci 08 02520 g017
Figure 18. Measured charging voltages with different set voltages. (a) 48 V set voltage; (b) 50 V set voltage; (c) 52 V set voltage.
Applsci 08 02520 g018
Figure 19. Voltage regulation accuracies with different set voltages. (a) 48 V set voltage; (b) 50 V set voltage; (c) 52 V set voltage.
Applsci 08 02520 g019
Figure 20. Measured charging currents with different set currents. (a) 5 A set current; (b) 10 A set current; (c) 20 A set current.
Applsci 08 02520 g020
Figure 21. Current regulation accuracies at different set currents. (a) 5 A set current; (b) 10 A set current; (c) 20 A set current.
Applsci 08 02520 g021
Figure 22. Constant-current and constant-voltage charging voltage and current curves.
Applsci 08 02520 g022
Table 1. Advantages and disadvantages of three maximum power point tracking (MPPT) methods.
TypeFixed Voltage MethodPerturbation and Observation MethodIncremental Conductance Method
92.8%97.1%98.4%
88.2%96.6%98.3%
AdvantagesLess parameters
Simple realization
Better controlBetter control
DisadvantagesPoor controlPower oscillation existsAccuracy of sampling is high and amount of computation is large
Table 2. Constant-current and constant-voltage charging/discharging voltages and currents.
Charging Time (min)Charging Current (A)Charging Voltage (V)Charging Time (min)Charging Current (A)Charging Voltage (V)
019.9947.9122020.1251.41
2020.1249.9424020.0951.61
4020.1250.4826020.0852.01
8020.1150.7628019.9853.32
10020.1150.830016.4153.96
12020.1150.833207.5554.05
14020.1250.873403.1554.15
16020.1250.973602.3254.16
18020.1151.133801.8253.07
20019.9951.234001.1552.98

