Article

Study on the Decomposition Mechanism of Natural Gas Hydrate Particles and Its Microscopic Agglomeration Characteristics

1
Jiangsu Key Laboratory of Oil and Gas Storage & Transportation Technology, School of Petroleum Engineering, Changzhou University, Changzhou 213016, China
2
Technology National Engineering Laboratory for Pipeline Safety, China University of Petroleum, Beijing 102249, China
*
Authors to whom correspondence should be addressed.
Appl. Sci. 2018, 8(12), 2464; https://doi.org/10.3390/app8122464
Submission received: 3 November 2018 / Revised: 29 November 2018 / Accepted: 30 November 2018 / Published: 3 December 2018
(This article belongs to the Section Energy Science and Technology)

Abstract

:
Research on hydrate dissociation mechanisms is critical to solving the issue of hydrate blockage and developing hydrate slurry transportation technology. Thus, in this paper, natural gas hydrate slurry decomposition experiments were investigated on a high-pressure hydrate experimental loop, which was equipped with two on-line particle analyzers: focused beam reflectance measurement (FBRM) and particle video microscope (PVM). First, it was observed from the PVM that different hydrate particles did not dissociate at the same time in the system, which indicated that the probability of hydrate particle dissociation depended on the particle’s shape and size. Meanwhile, data from FBRM presented a periodic oscillating trend of the particle/droplet numbers and chord length during the hydrate slurry dissociation, which further demonstrated these micro hydrate particles/droplets were in a dynamic coupling process of breakage and agglomeration under the action of flow shear during the hydrate slurry dissociation. Then, the influences of flow rate, pressure, water-cut, and additive dosage on the particles chord length distribution during the hydrate decomposition were summarized. Moreover, two kinds of particle chord length treatment methods (the average un-weighted and squared-weighted) were utilized to analyze these data onto hydrate particles’ chord length distribution. Finally, based on the above experimental data analysis, some important conclusions were obtained. The agglomeration of particles/droplets was easier under low flow rate during hydrate slurry dissociation, while high flow rate could restrain agglomeration effectively. The particle/droplet agglomerating trend and plug probability went up with the water-cut in the process of hydrate slurry decomposition. In addition, anti-agglomerates (AA) greatly prohibited those micro-particles/droplets from agglomeration during decomposition, resulting in relatively stable mean and square weighting chord length curves.

1. Introduction

Gas hydrate is polycrystalline, non-stoichiometric, and clathrate solid consisting of water molecules and small gas molecules, wherein water molecules form hydrogen bonds in cages, then gas molecules as guest molecules are wrapped in them [1]. Typical guest molecules include: methane, ethane, propane, and carbon dioxide, etc. Currently, hydrate blockage has become a hot issue in flow-assurance in the petroleum industry [2] since Hammerschmidt [3] discovered hydrate blockage in gas pipelines for the first time. Controlling methods of hydrate blockage include traditional inhibition [4,5,6,7] and risk-control techniques [8,9,10,11,12]. As exploration and production is going into deeper water, the focus of flow-assurance strategies are shifting from traditional methods to risk-control techniques [2]. Hydrate slurry flow has gradually gained the attention of researchers [13,14,15,16,17,18,19,20], who have referred to it as a form of hydrate risk control. However, studies on hydrate slurry are still in the period of experimental investigation with preliminary theoretical development [21]. In addition, the hydrate slurry might take place in decomposition reactions in the pipeline, when it is met with extraordinary operating conditions, resulting in transportation problems or hydrate blockage accidents. Consequently, it is important to investigate the hydrate slurry flow behavior under diverse operating conditions (e.g., particle agglomeration phenomena during the process of hydrate slurry decomposition). In order to eliminate the risk of hydrate blocking and to prevent secondary aggregation of hydrate particles in the decomposition process, we not only had to grasp the mechanism of hydrate formation, but also needed to master the mechanism of hydrate decomposition and its morphological changes of hydrate particles.
Studies on hydrate slurry dissociation morphology can obtain valuable information through observing the state and change of hydrate interfaces [22]. This method supplements structural research (to analyze the hydrate structure and components) and molecular simulation modeling (to explain the formation and dissociation mechanism from the molecular level), with a direct and visualized acquiring and recording process [23].
Studies [24,25,26,27,28,29,30] had have found from dissociation morphology experiments the following: The irregular variation on the dissociating surface of the hydrate particle was controlled by the uniformity of system temperature, and it would not change with guest gas molecules. Hydrate lattice imperfection would lead to an asymmetrical pattern (partial decomposition) during the dissociation process. Guest gas molecules evolved from the cage lattice on the surface, while the produced water adsorbed on the undecomposed part to form a thin aqueous layer. This aqueous layer strengthened the wettability of the particle surface and enlarged the particle’s own stickiness and the probability of agglomeration. The dissociation rate on the surface was inversely proportional to the escape resistance against guest gas out of the hydrate shell, and was proportional to the dissociation driving force.
The hydrate dissociation in a flowing system would be far more complicated, compared to these above morphological studies [24,25,26,27,28,29,30] of a single hydrate particle under static conditions. Both decomposed and original particles coexist in a flowing system, increasing the probability of particle collision, agglomeration, and breakage under the shear effect. This would greatly influence the stability of hydrate slurry and the decomposition kinetics. However, research in the flowing field [9] is still insufficient so that further exploration and experimentation is required.
In this paper, natural gas hydrate slurry decomposition experiments were investigated on a high-pressure hydrate experimental loop. The loop was equipped with the latest on-line particle analyzer focused beam reflectance measurement (FBRM) and particle video microscope (PVM). The FBRM and PVM were used to in situ to observe and record particle chord length and morphology, tracking the change degree of particles/droplets, and measuring the particle chord length, shape, and number during the hydrate decomposition process. These experiments also explored the effects of pressure, flow rate, water-cut, and the polymerization inhibitor on the hydrate decomposition. Moreover, this paper used two kinds of particle chord length treatment methods (the average un-weighted and squared-weighted) to treat the data of hydrate particle chord length distribution (CLD), in order to characterize the overall particle properties and the large-particle chord length trends during hydrate decomposition processes.

2. Experimental Apparatus and Materials

2.1. The High-Pressure Hydrate Experimental Loop

A series of experiments were carried out in the high-pressure hydrate experimental loop for flow assurance studies. The schematic diagram is shown in Figure 1. The 30-m stainless steel test section consisted of two rectilinear horizontal lengths joined together to form a pipe with a 2.54-cm internal diameter, and a 5.08-cm diameter jacket circulating a water–glycol blend surrounding the test section. Process temperature control ranged from −20 to 100 °C. Natural gas and liquid phase was respectively injected by a plunger compressor and a custom-made magnetic pump into the loop. It should be noted that this pump was designed to have a minimal destructive impact on the hydrate. For more details about the loop please referred to our previous work [20].

2.2. The Hydrate Experimental Loop Instrumentation

A focused beam reflectance measurement (FBRM) probe and a particle video microscope (PVM) probe were installed at the inlet of the test section, which allowed monitoring the evolution of objects—droplets, bubbles, and solid particles—carried inside the flow. Both the probe windows cut the streamlines at a 45° angle, beginning at the center of the pipe. The FBRM and PVM probes were used to measure the initial water droplet (Dp) size inside the fluid and to follow the hydrate particles agglomeration with the time. The mean square-weighted chord length could give more weight to the larger particles, so it was particularly adapted to agglomeration phenomena. The mathematical expression of the square-weighted mean chord length was given below, as shown in Equation (1).
C ¯ = i = a b y i M i 2 × M i i = a b y i M i 2
where Mi is the midpoints of the ith interval, μm; and yi is the probability of measuring a chord included in the ith interval.

2.3. Fluids

To better simulate the practical situation, deionized water, civil natural gas (Table 1), and −20# diesel (Table 2) were employed in these tests. The electronic balance was used to weigh the combined anti-agglomerates’ (AA) quality (with a measuring error ±0.01 g). The quality ratio of AA/water phase could be adjusted to 1 wt%, 2 wt%, and 3 wt%, through the high-pressure measurement piston pump. The natural gas hydrate formation curve (Figure 2) was obtained by the Chen–Guo [31] model with a natural gas composition.

2.4. Experimental Procedure

The hydrate slurry had to prepared in order to carry out experiments on the hydrate slurry decomposition. The details of the procedure for hydrate slurry formation were reported previously [20]. The specific procedure for one round of hydrate formation and dissociation experiment was performed as follows:
(1)
Evacuate the entire experimental loop until the vacuum degree reaches 0.09 MPa;
(2)
Load diesel and water (100 vol% liquid loading) with a specific water-cut for each test. Here water-cut is defined as the volume ratio of water to the total liquid. Diesel volume is fixed at 70 L during all these experiments. The gas-supply unit begins to inject gas into the separator at the room temperature (20 °C) to reach the aimed experimental pressure;
(3)
Circulate the water and oil mixture at a constant flow rate to form a homogeneous and stable emulsion with the specific AA dosage for each test. Stability of the water/oil emulsion referred to a relatively stable process (dynamic stability) according to the measured data from FBRM under shearing action. This is to say that the emulsion is regarded as stable when the average chord length of droplets fluctuated in ±0.2 μm within 2 h;
(4)
Decrease the temperature gradually to a specific value under the initial pressure and flow velocity. Open the data acquisition system to collect the temperature, pressure, pressure drop, flow rate, density, and the chord length continuously, during the hydrate formation process;
(5)
When the pressure, temperature, and flow rate of the loop are stable, maintain the stable situation for at least 5 more hours.
(6)
To dissociate the hydrate slurry, the system is heated at constant volume using the bath system. Set the bath temperature at 30 °C and collect all data during the hydrate decomposition process;
(7)
A round of hydrate formation and decomposition experiment is scheduled for completion when all measured data are stable at the end of the hydrate decomposition process.

3. Results and Discussion

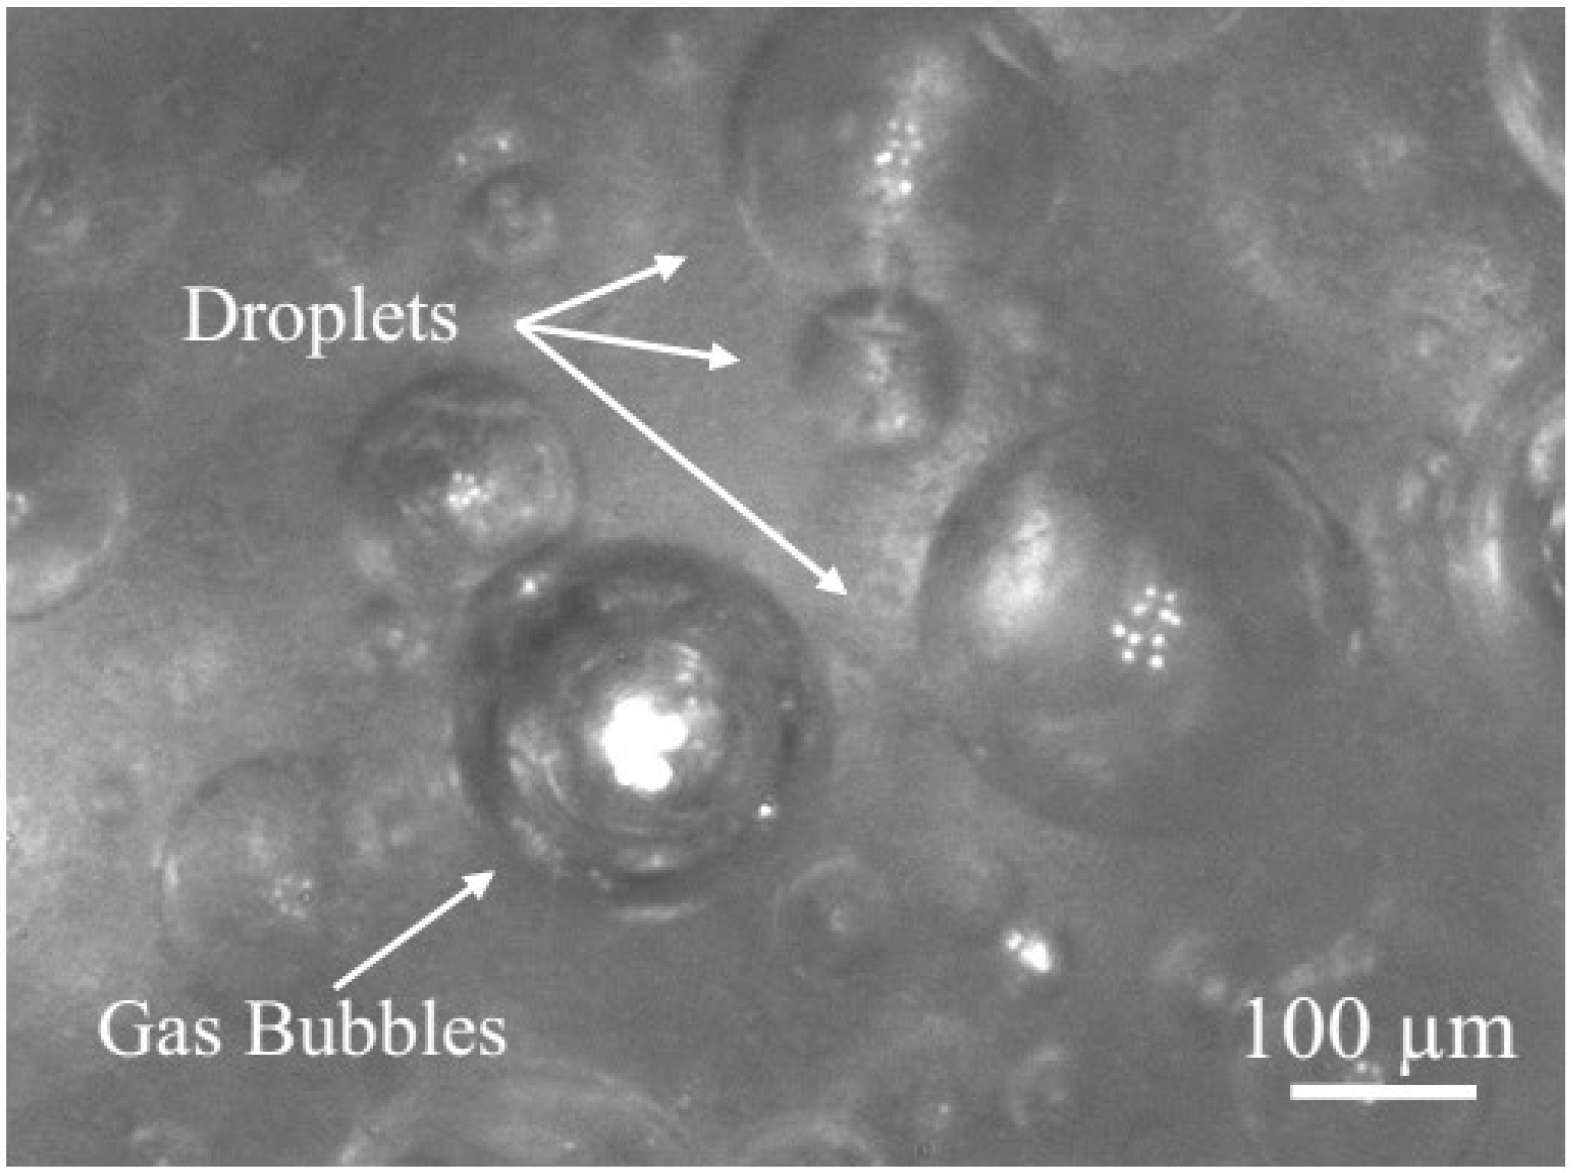
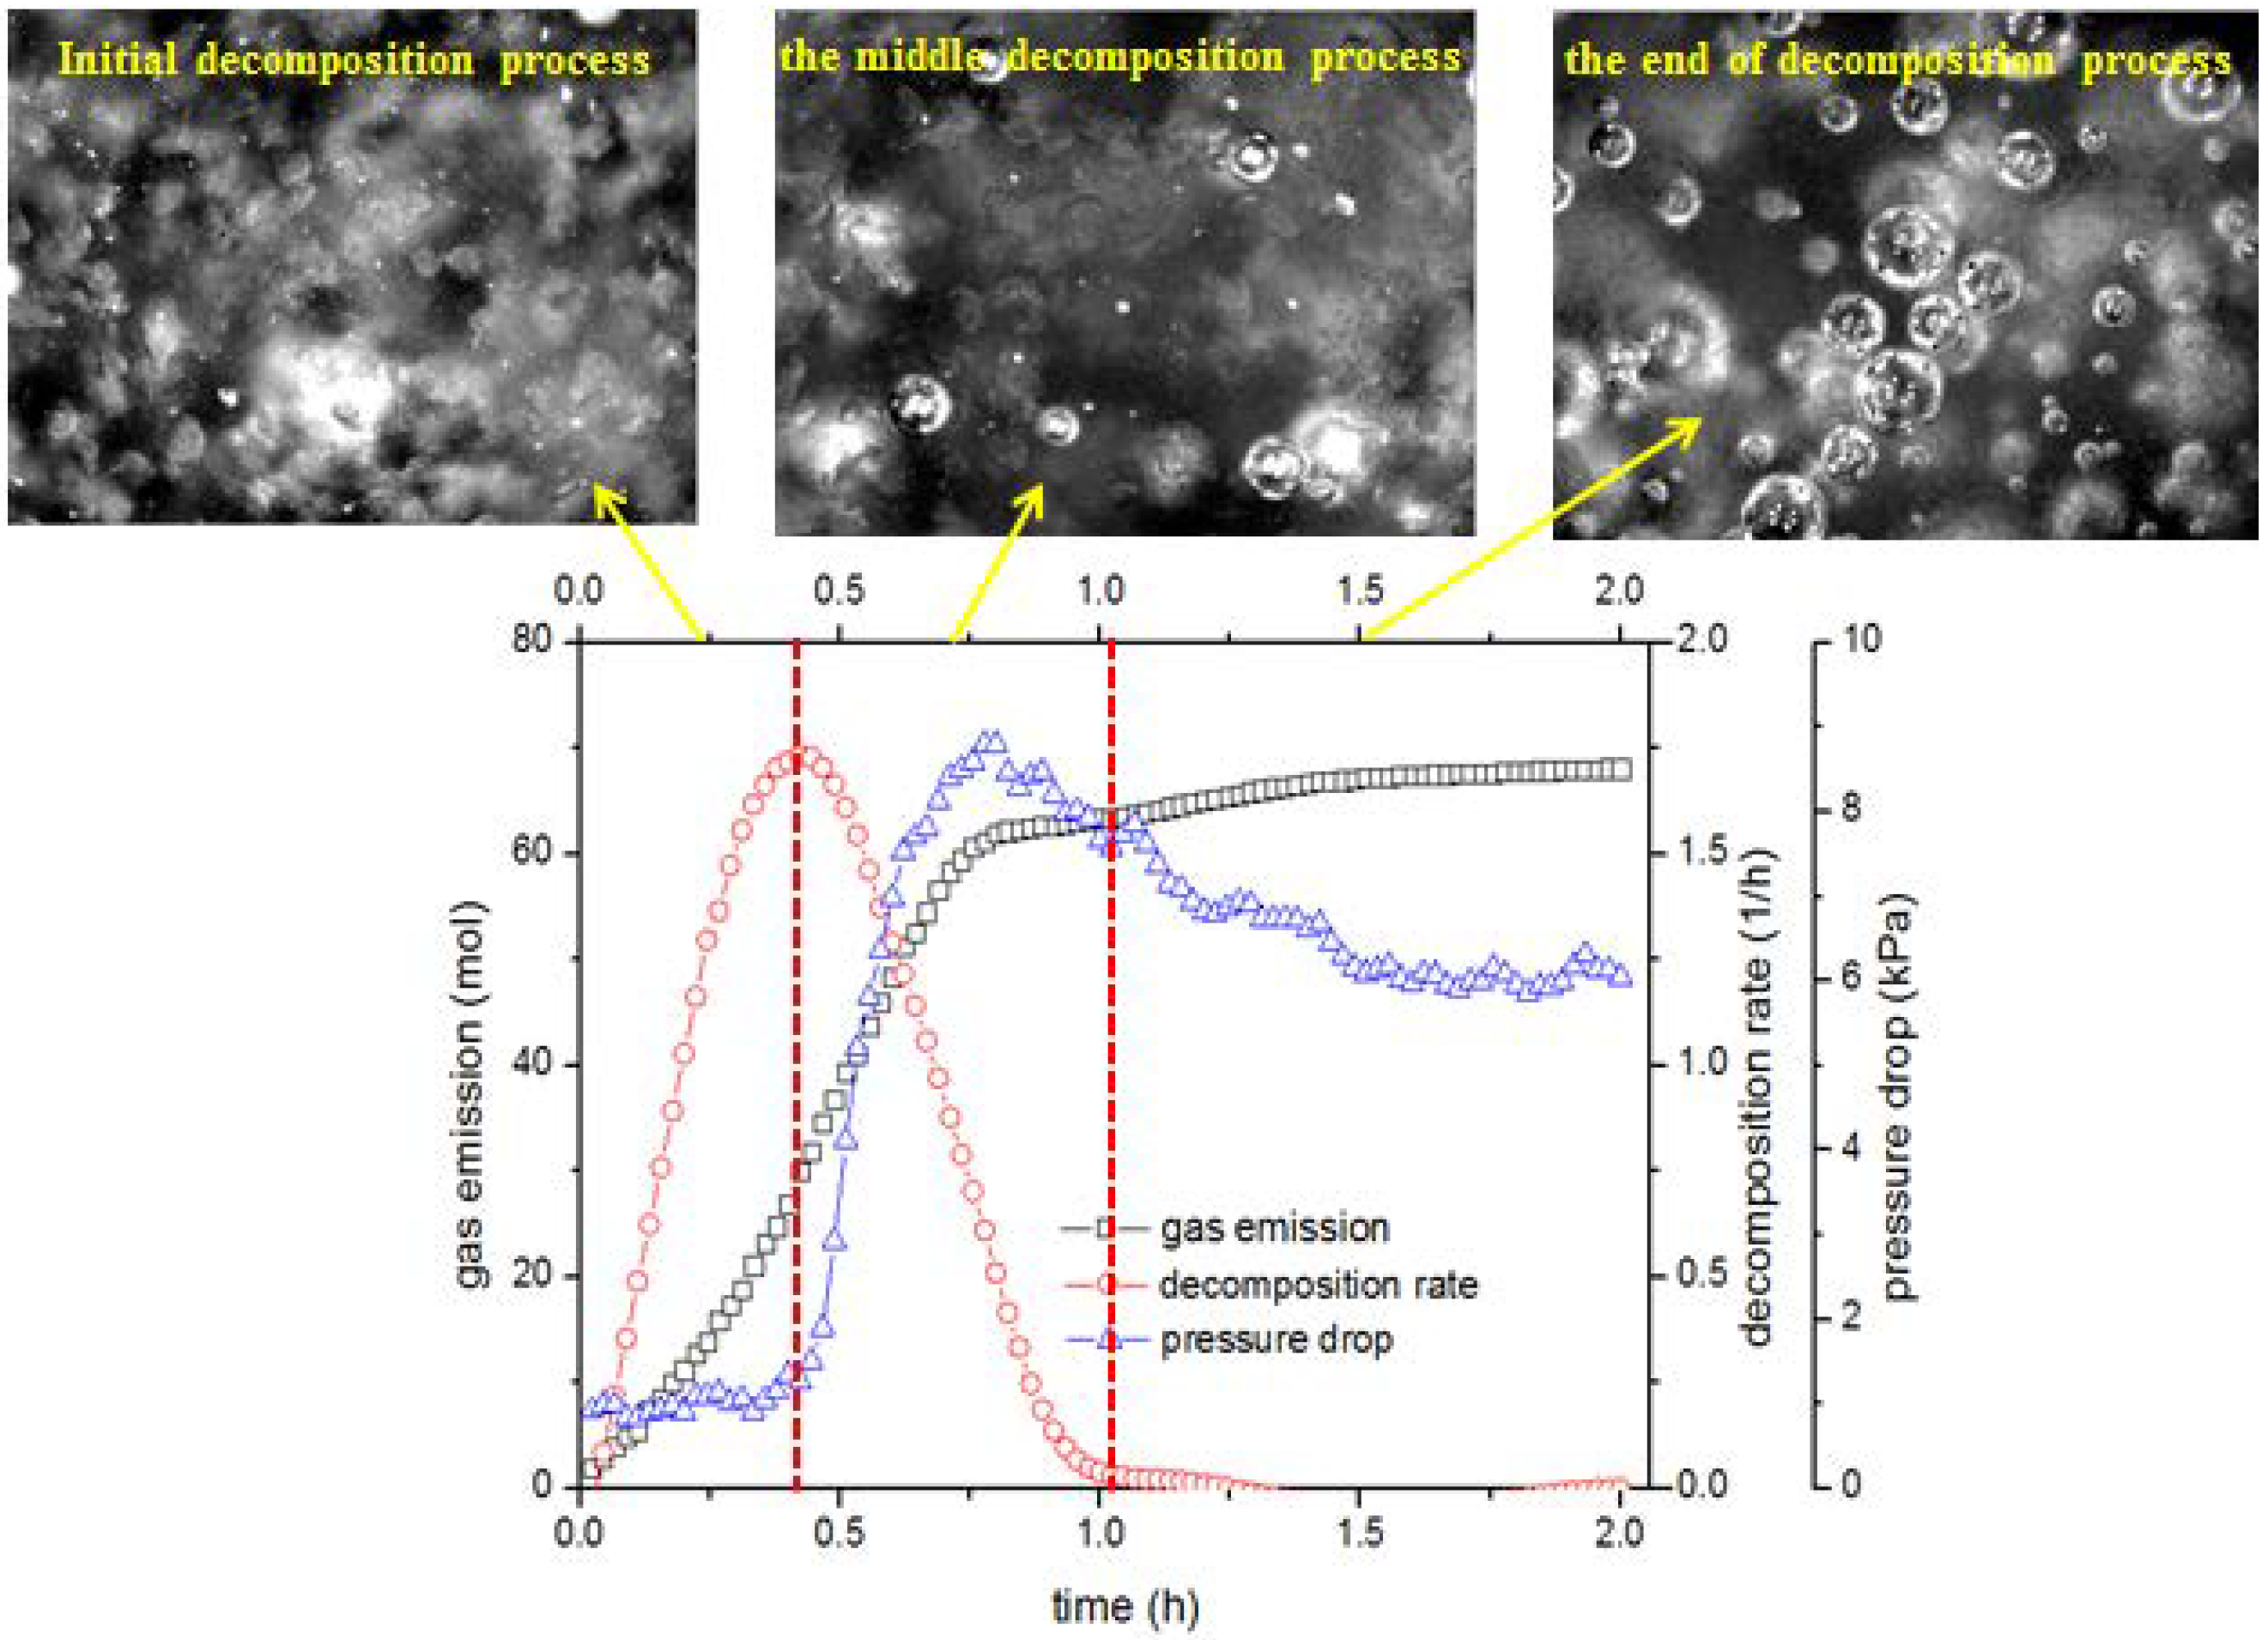
3.1. Study on Hydrate Slurry Dissociation Morphology

Hydrate decomposition in a pipeline system was a micro-level process with lattice deconstruction and guest gas molecules’ desorption. In detail, water molecules firstly were changed from the clathrate structure into a disordered and loose arrangement. Van der Waals forces between host water molecules and guest gas ones were then weakened, so that the gas molecules could escape from deconstruction lattices. Finally, these escaped guest molecules appeared in a dissolved or a free gas form on the surface or around the hydrate particles.
Therefore, it was needed to distinguish the micro particle/droplet figures gathered by PVM, in order to identify bubbles, water droplets and hydrate particles. This was the basis to investigate the particles’ interactions, chord length distribution, and the agglomeration mechanism during the decomposition. Figure 3 was a figure captured by the PVM of the slurry system with a few bubbles and water droplets. It can be seen that light spots (reflections of the laser light from PVM) appeared on the surface of the bubble rather than on that of droplets, due to the different optical properties of bubbles and droplets.
With the aid of PVM, this paper obtained hydrate particles’ definite morphological changes and aggregation characteristic. Figure 4 presents the particles’ morphology and distribution at different time points in the process.
It can be analyzed from the above four figures as follows. In Figure 4a, before the hydrate dissociation, particles were relatively equally distributed in the system with irregular shapes. Hydrate slurry was easy to transport at this time point. In Figure 4b, at the beginning of the dissociation, lattice deconstruction and guest gas molecules’ desorption happened on the surfaces of hydrate particles, leading to bright spots and even droplets on the surfaces. In Figure 4c, during the dissociation, hydrate particles would dissociate more thoroughly, resulting in better water wettability of the particle’s surface, more water droplets, and larger agglomeration trend. In other words, it was easier for the “secondary aggregation” which could seriously impact the safety of hydrate slurry transportation and should be avoided in the transportation technology. In Figure 4d after the complete dissociation, lots of water droplets spread among the system. Yet their size would decrease with longer emulsification time (through the comparison of Figure 4d,e). This again shows that hydrate particles/droplets agglomerated during the decomposition.
In a word, the morphology of hydrate particles or droplets would change with time during the hydrate slurry decomposition. In the dissociation, lattice deconstruction and guest gas molecules’ desorption (captured as the light spots in the figures) did happen on the particles’ surface. Hydrate particles, dissociating particles and water droplets coexisted in the system with further decomposition. This gave rise to various collision forms among them, increasing the aggregation strength (dissociation would cause the slurry destabilization). In the process, probability of hydrate particles to dissociation depended on the particle’s shape and size, that was, different particles did not dissociate at the same time in the system. After the dissociation, the size of water droplets in the system was larger than that of the particle before the decomposition (through the comparison of Figure 4a,e). Meanwhile, water droplet size went down with longer emulsification time, because the droplets were dispersed more evenly in the continuous phase.
Figure 5 shows the curves of gas emissions, decomposition rate, and pressure drop during the hydrate slurry decomposition process. It can be observed in Figure 5, the pressure drop (DP) of the entire loop system was about 2 kPa, while the decomposition rate and gas emission increased in the initial stage of decomposition (within the first 0.5 h). For the time period from 0.5 to 1.0 h (the middle decomposition process), the pressure drop increased since hydrate particles started to aggregate. This particle aggregation also caused a decline of mass/heat transfer efficiency during the decomposition, resulting in a decrease of the hydrate decomposition rate. At the end of the hydrate decomposition process, all hydrate particles dissociated into water droplets, so the decomposition rate dropped to zero, the total gas emissions and pressure drop of the loop kept at stable values.

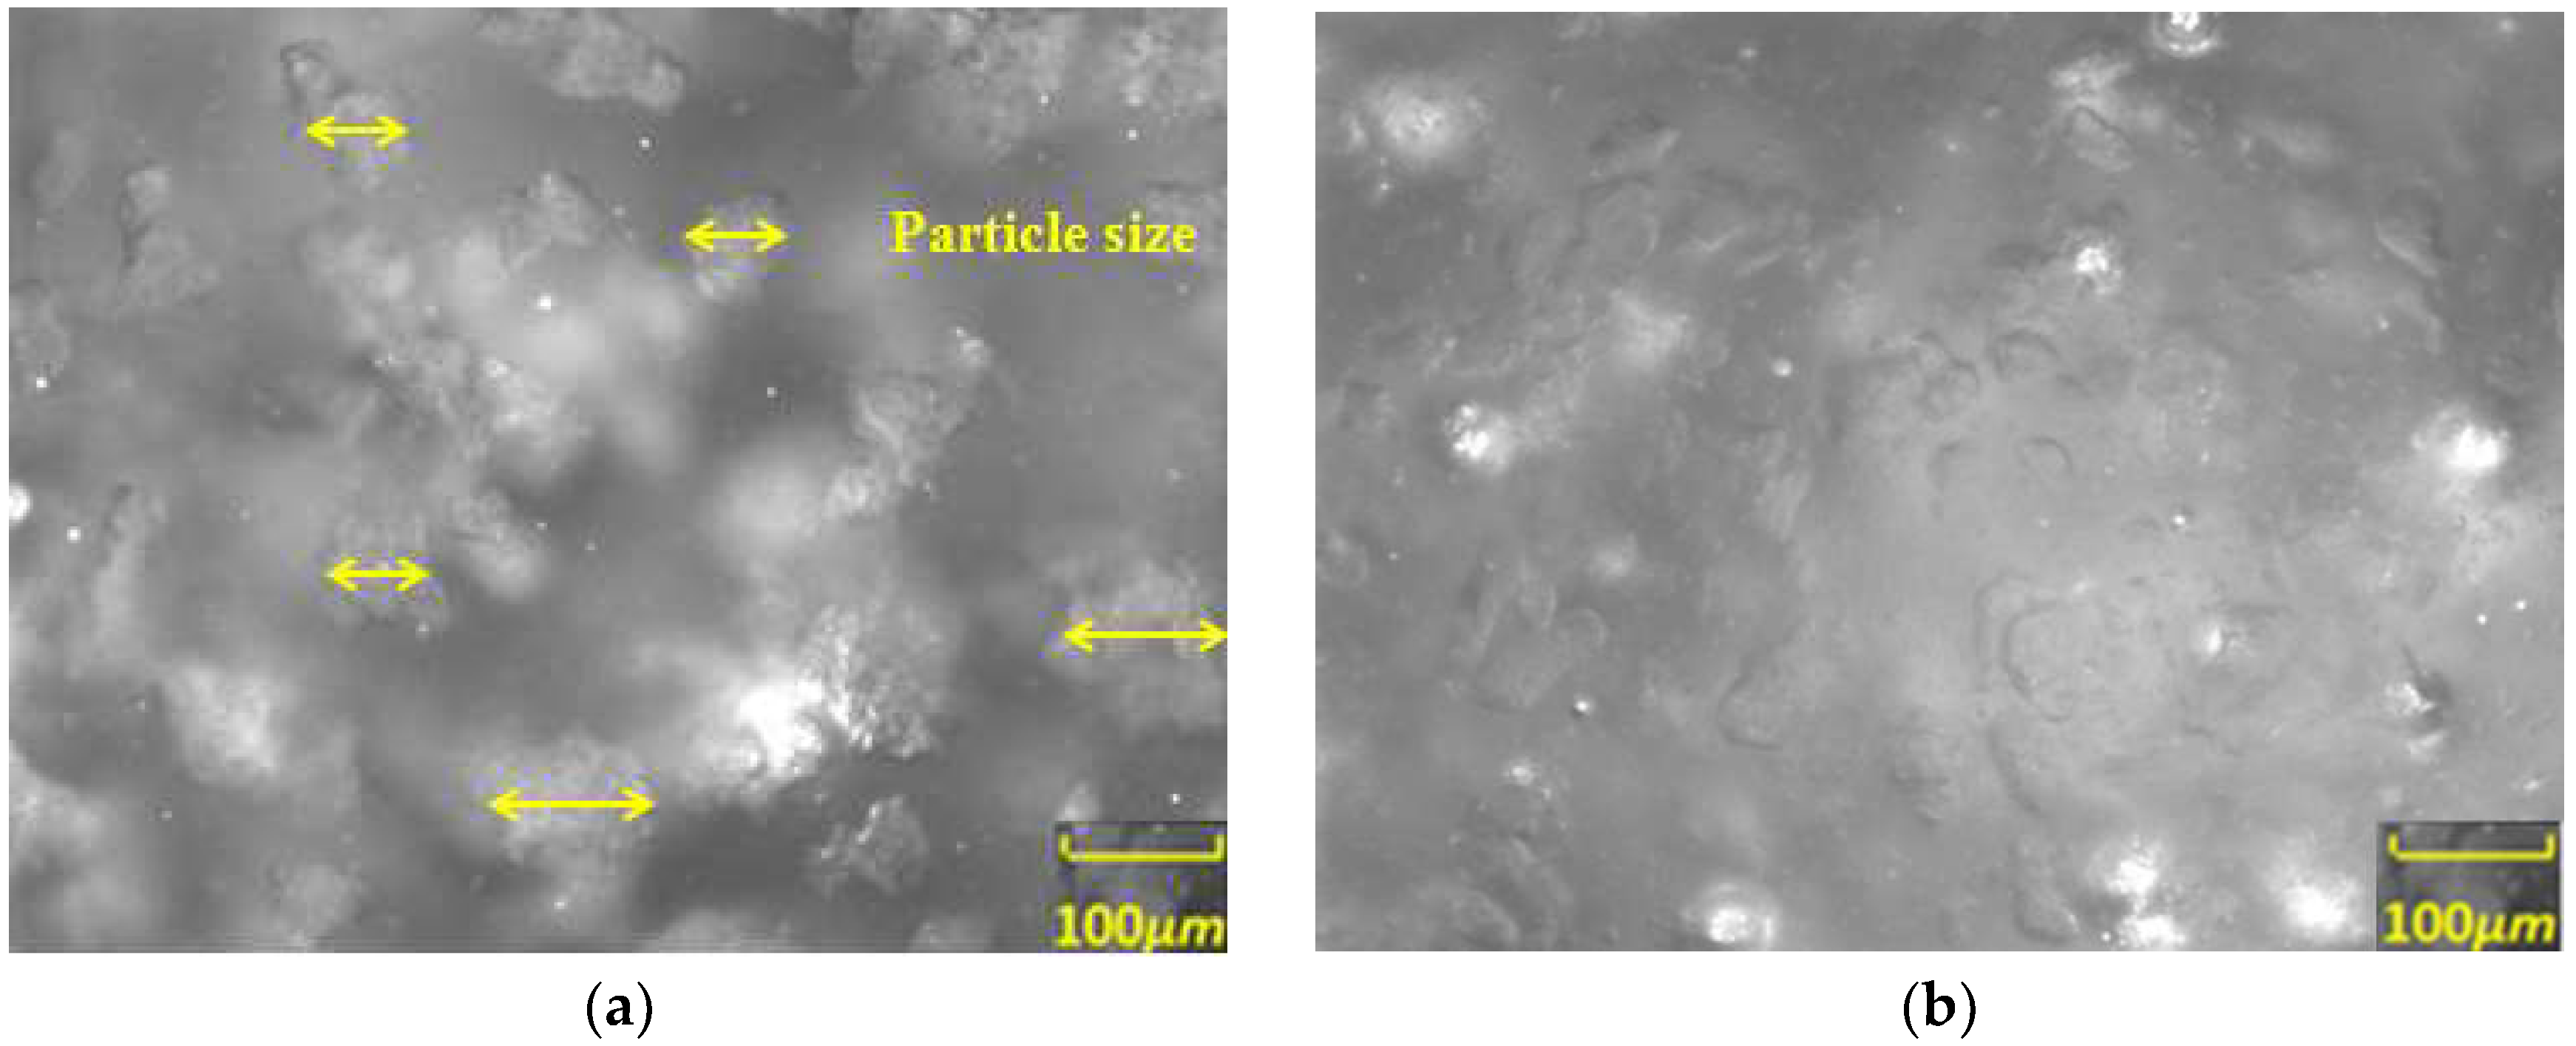
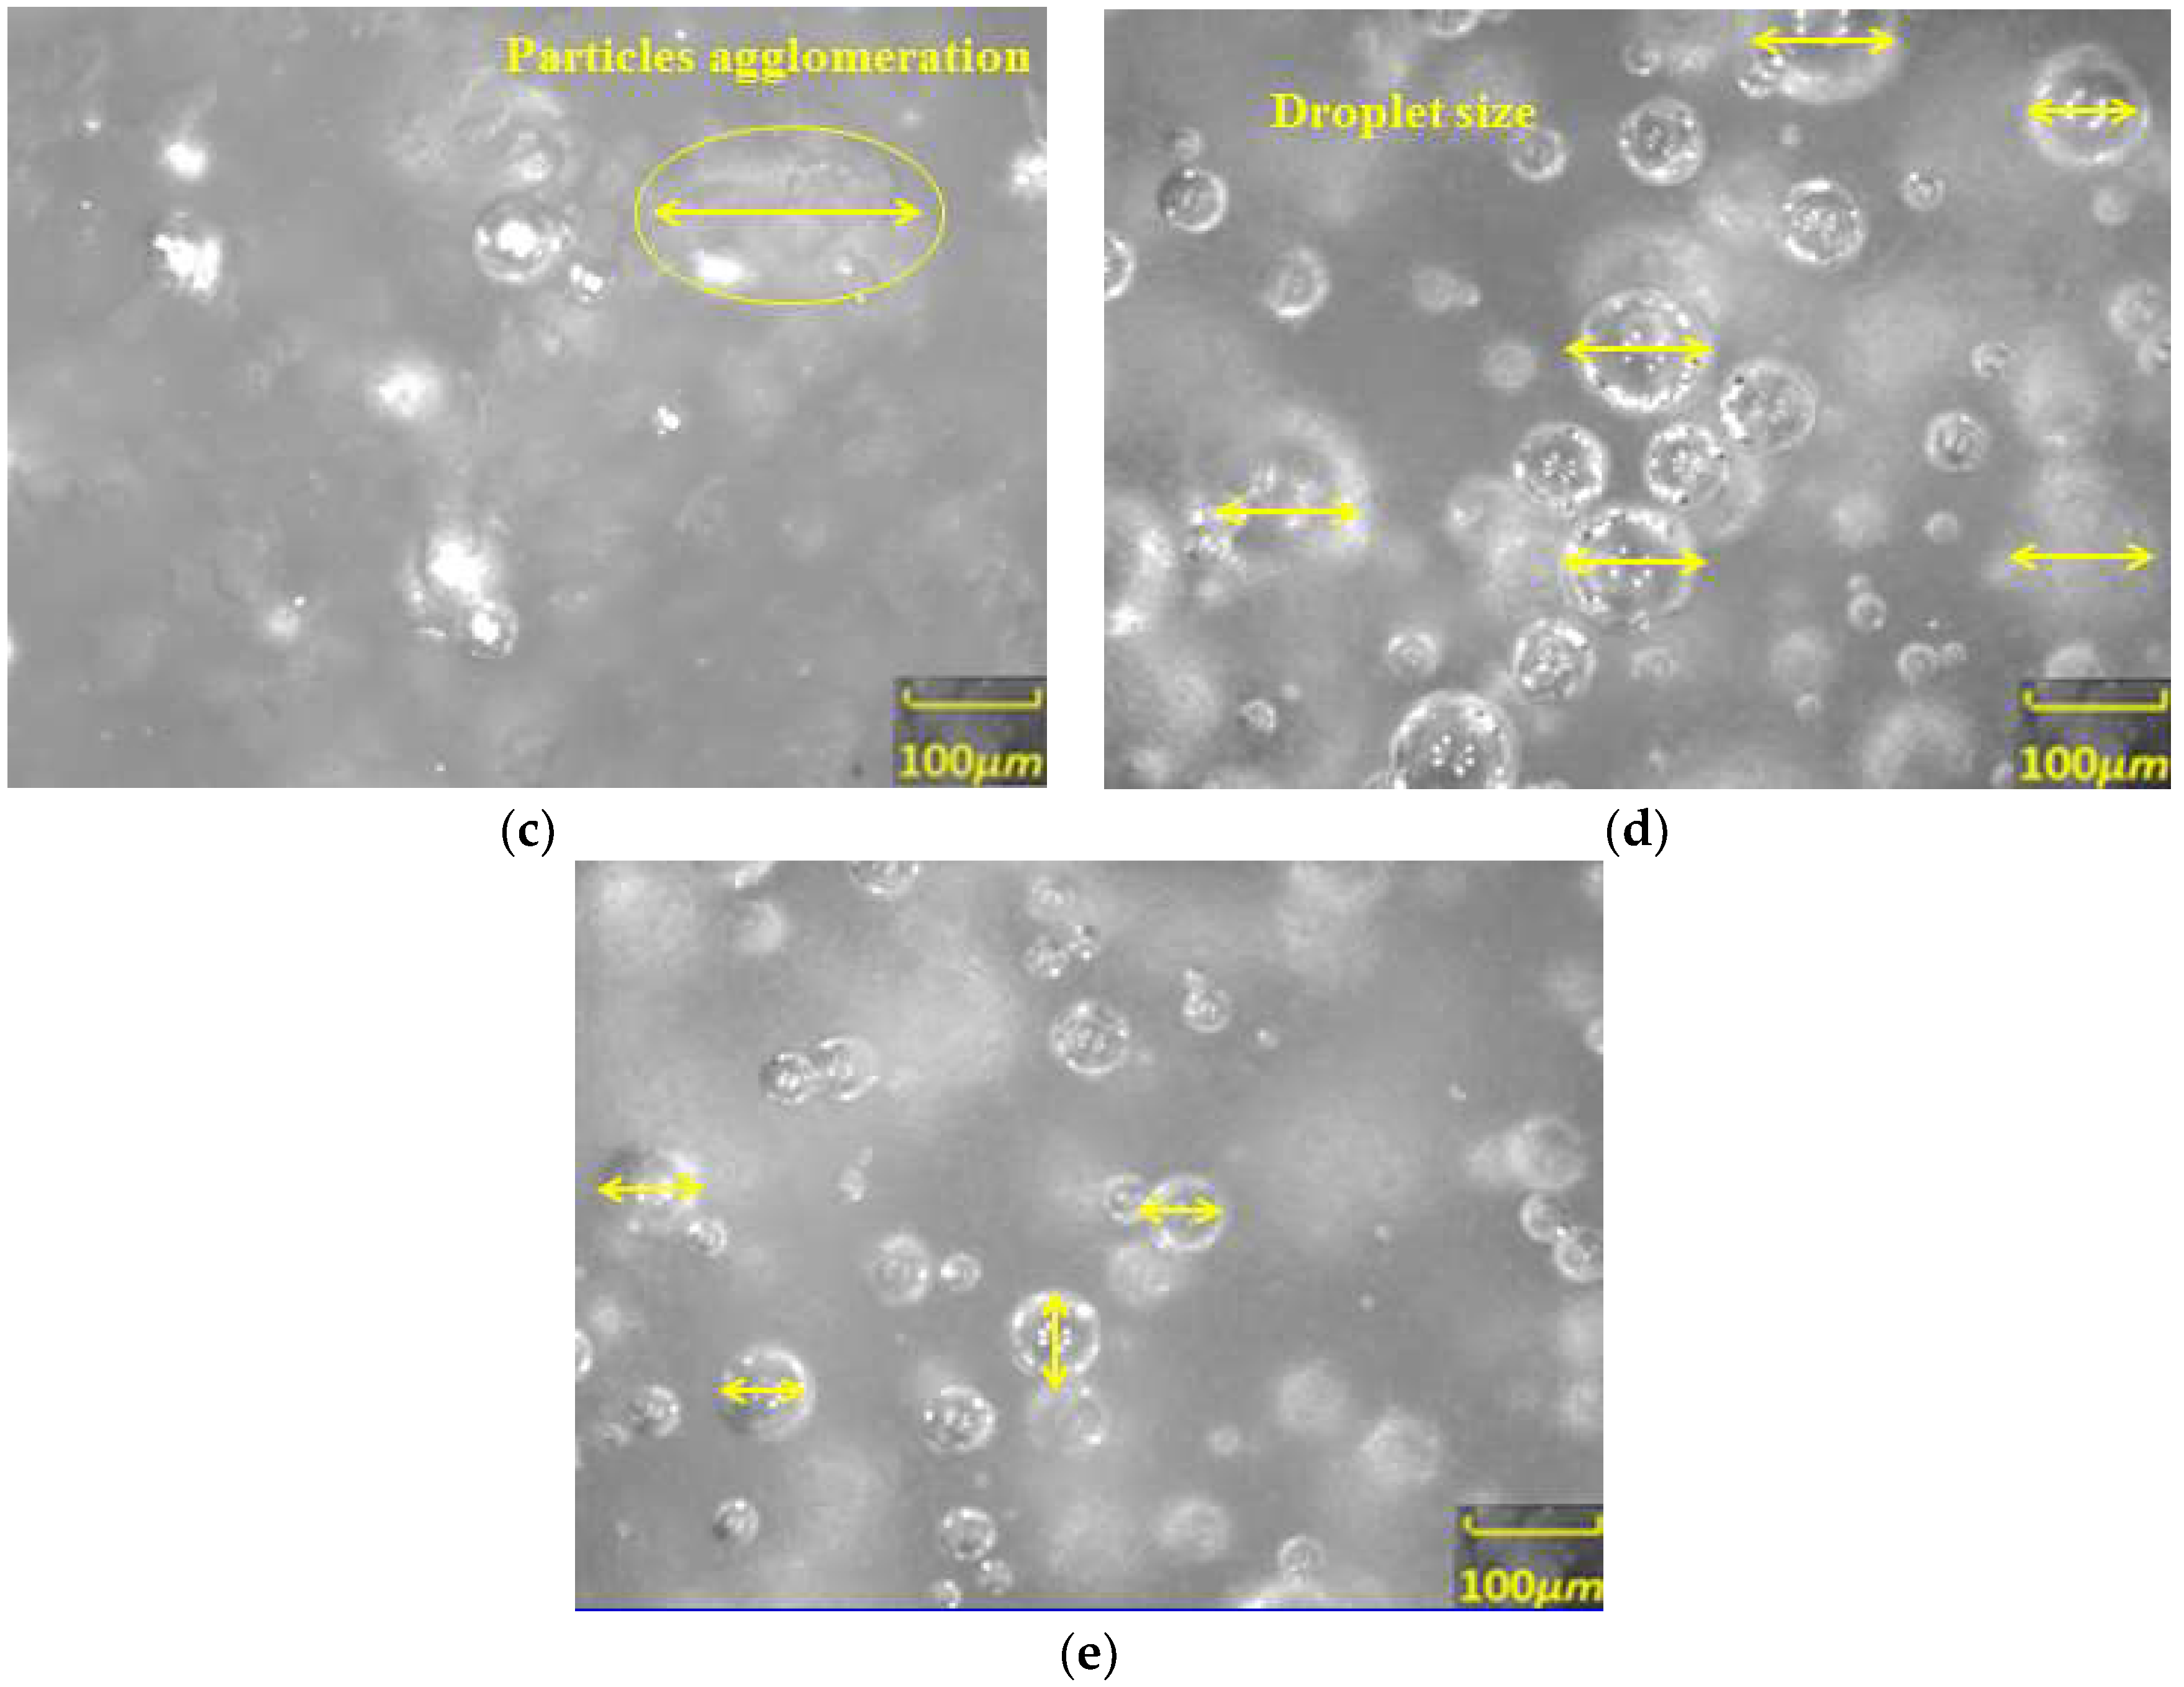
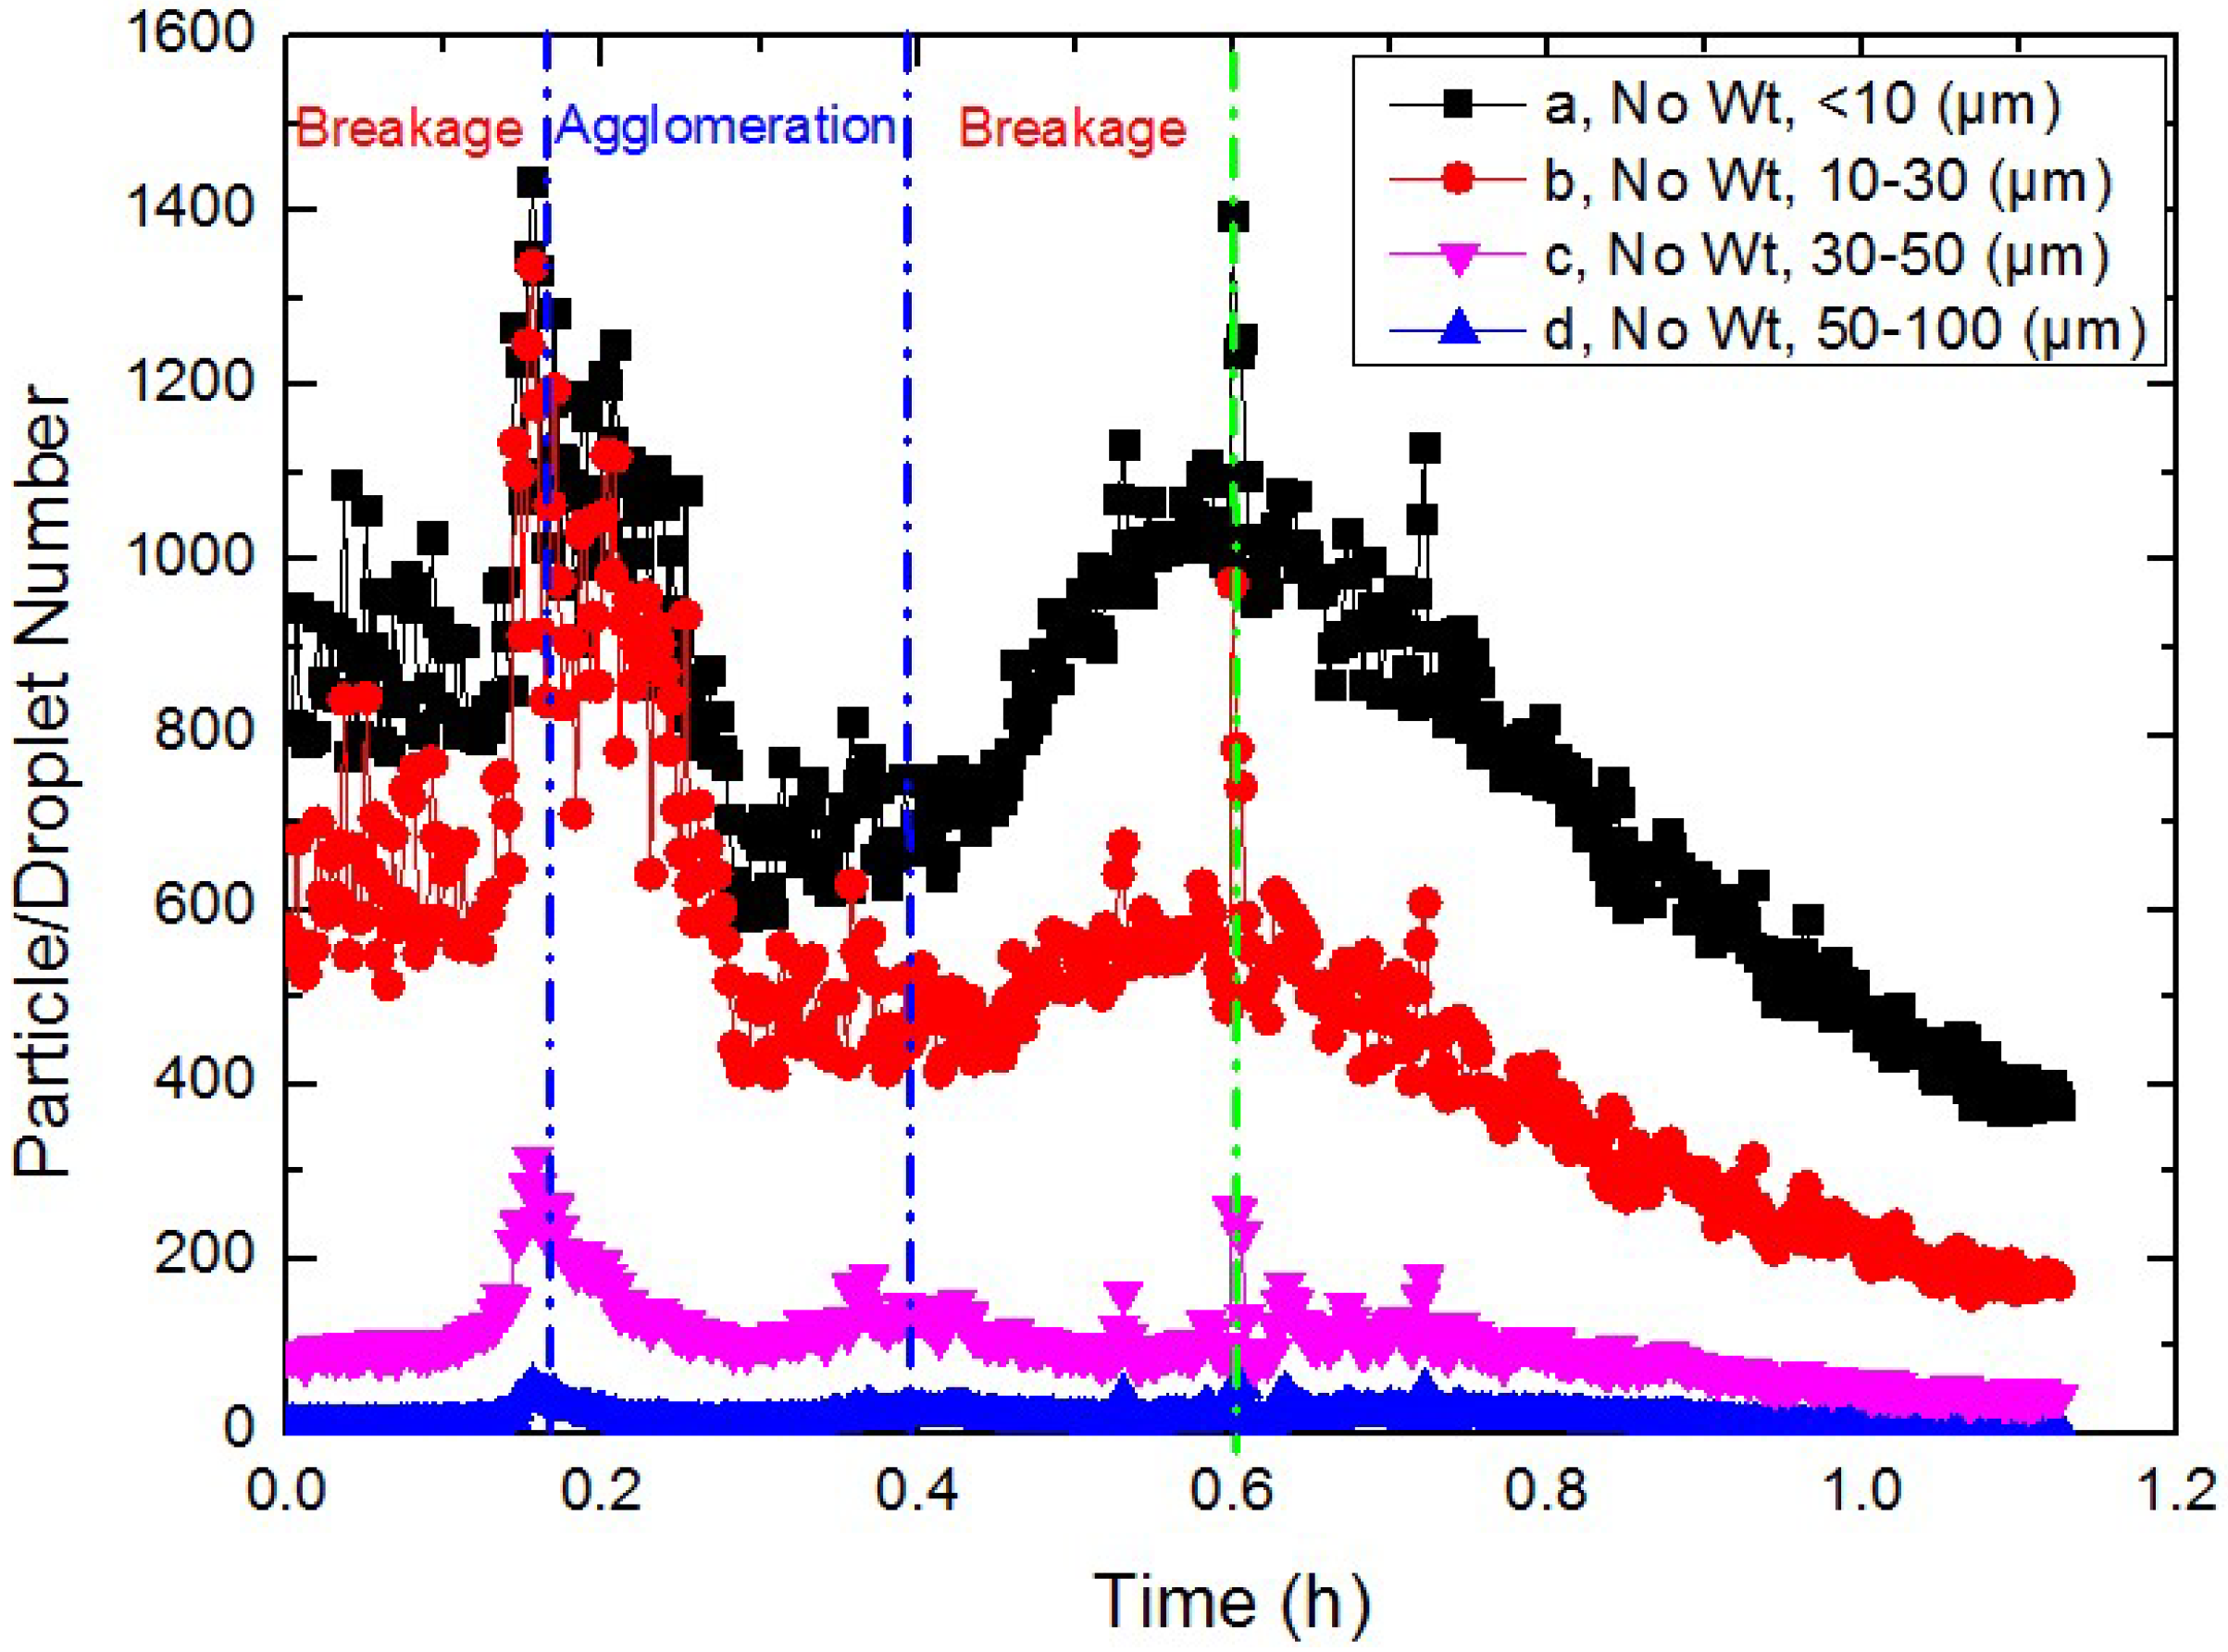
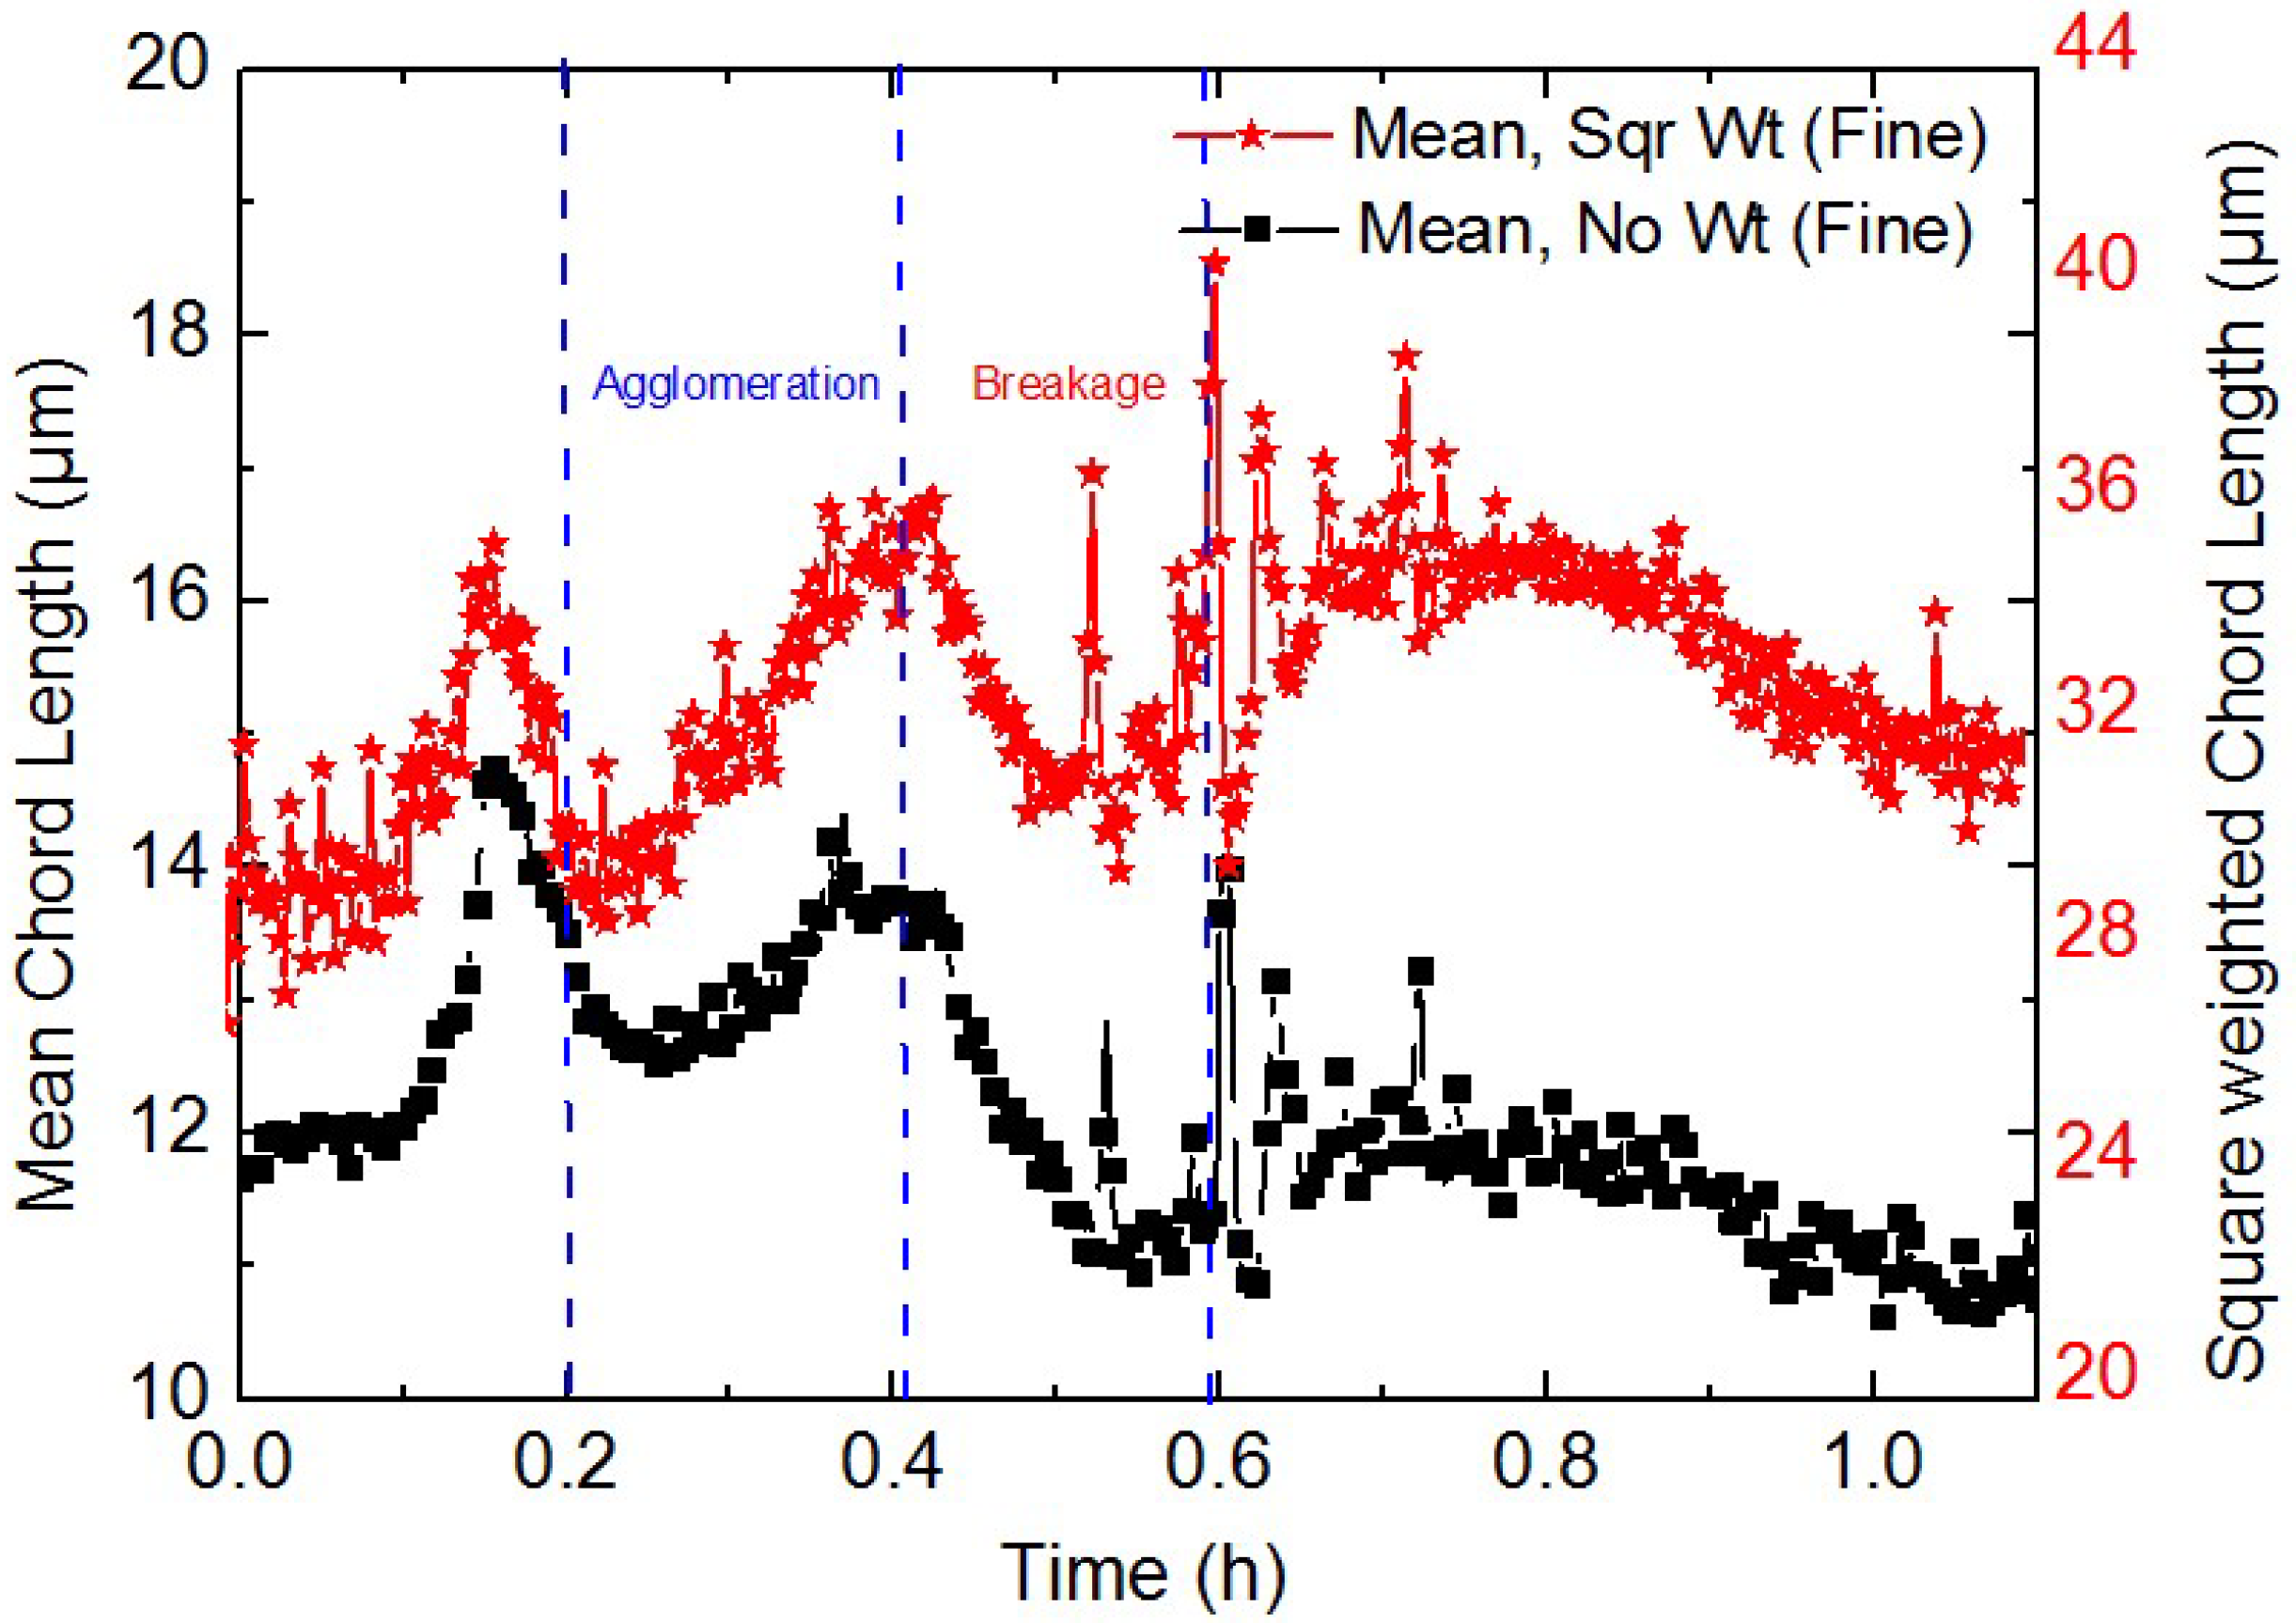
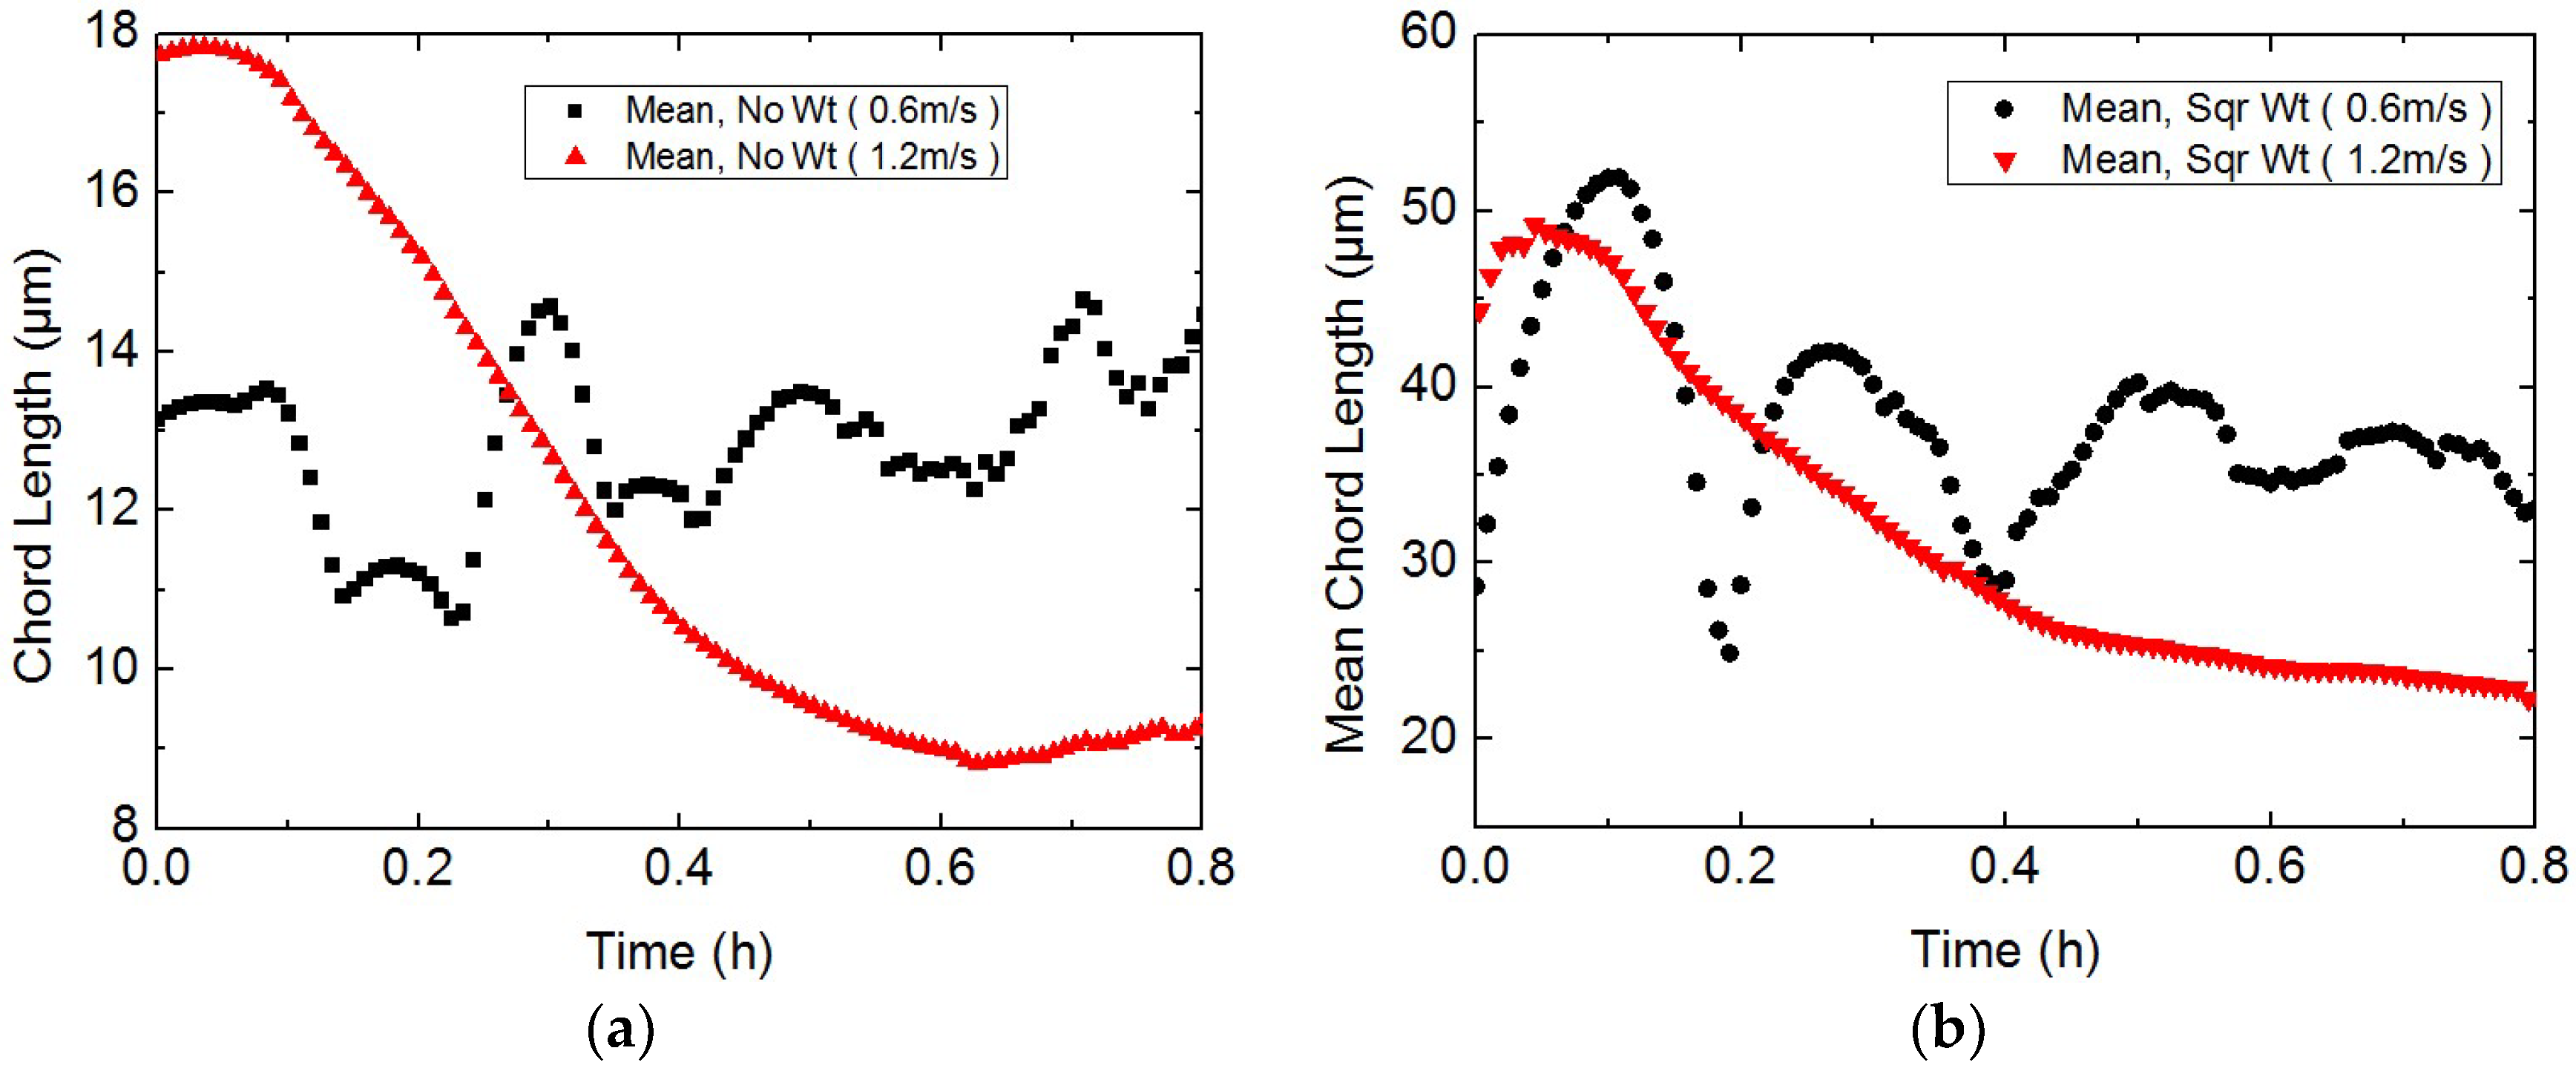
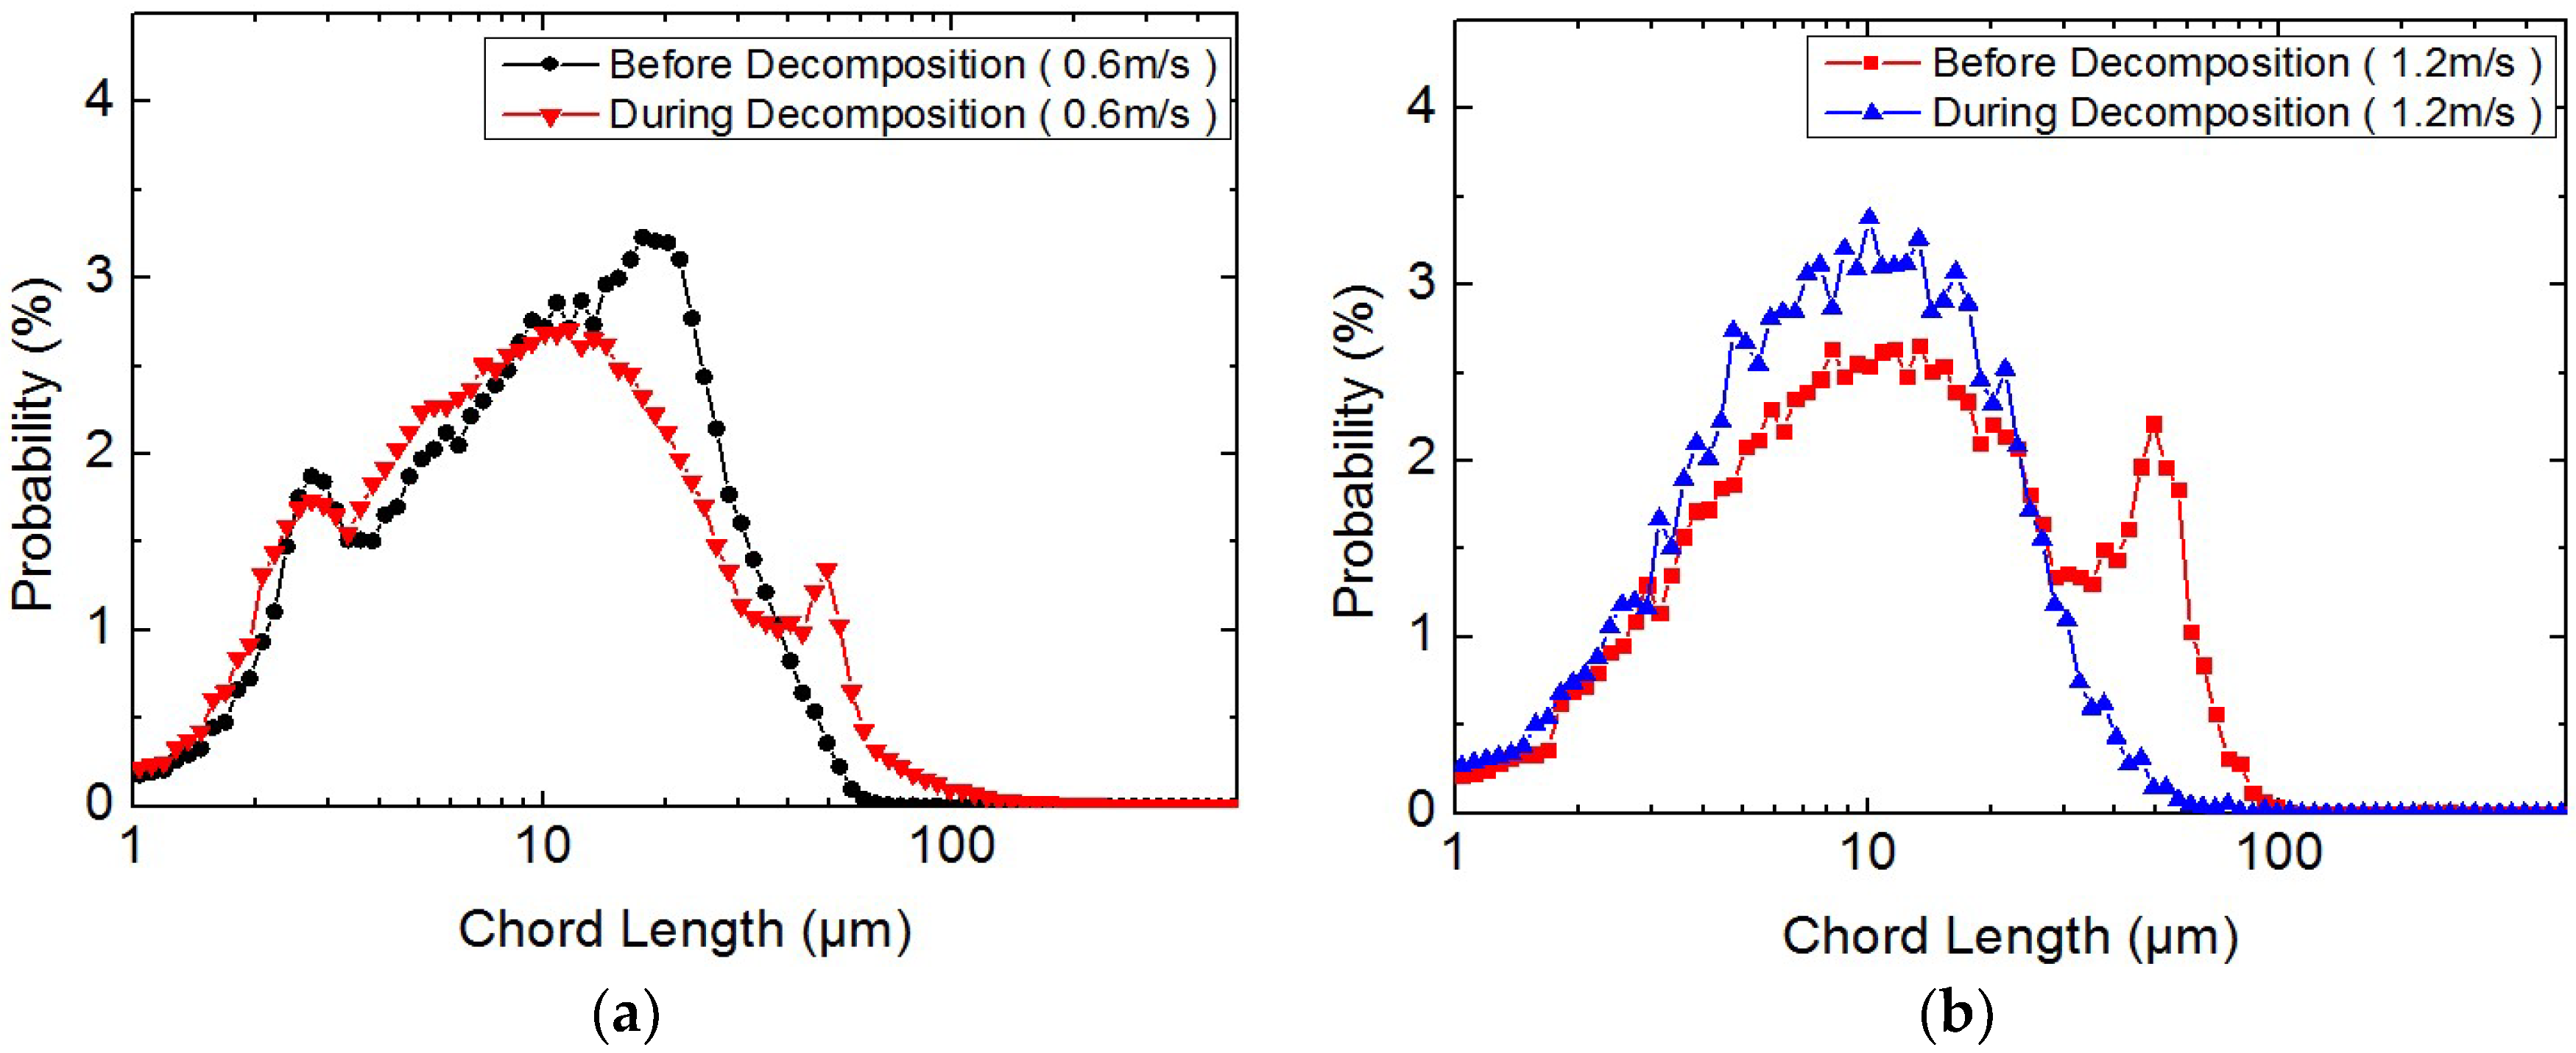
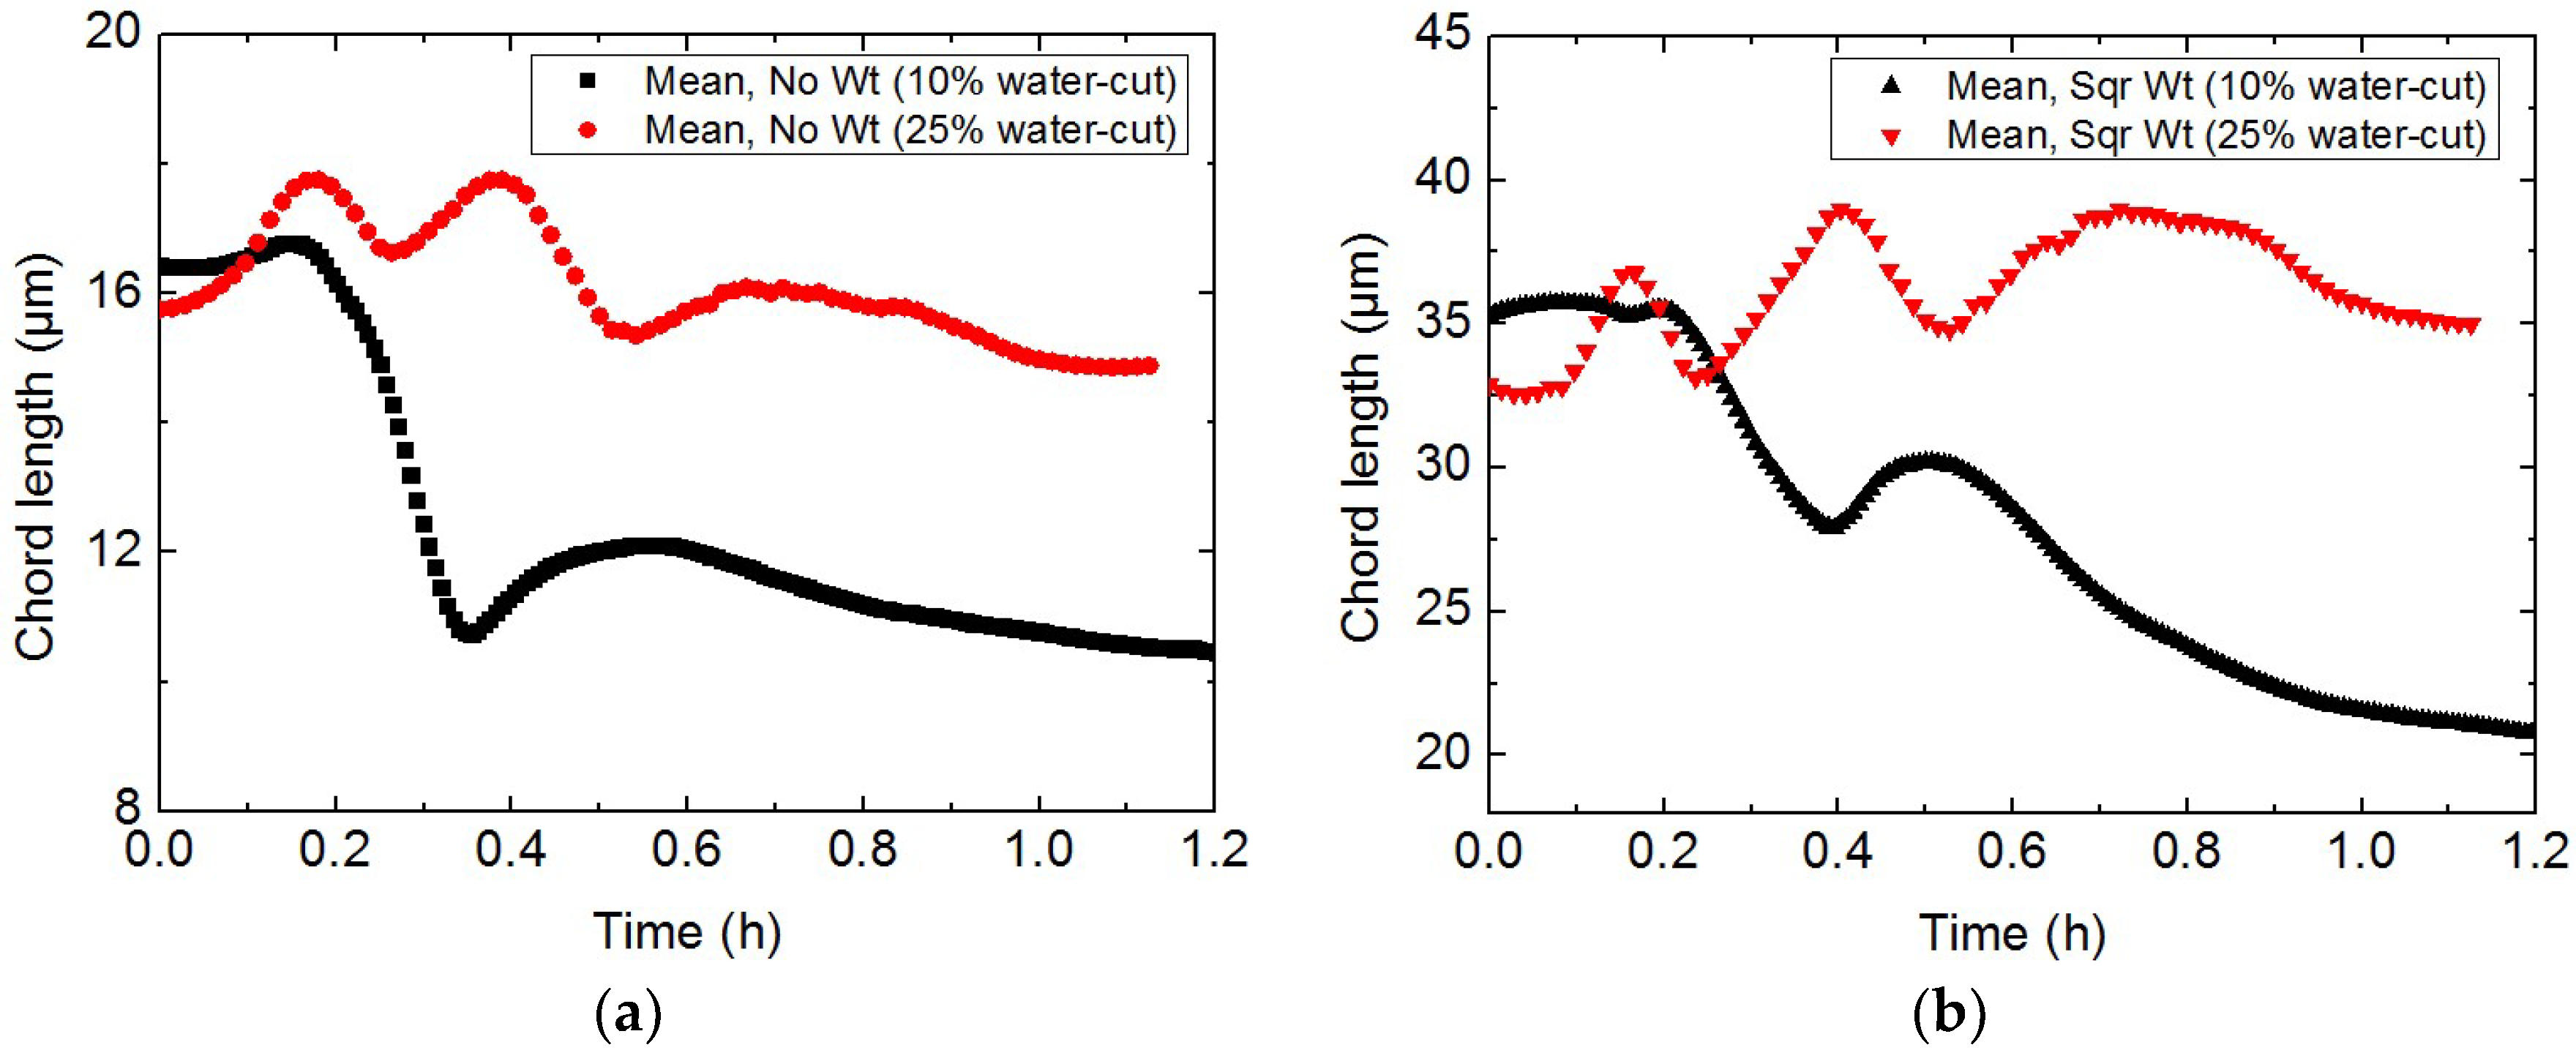
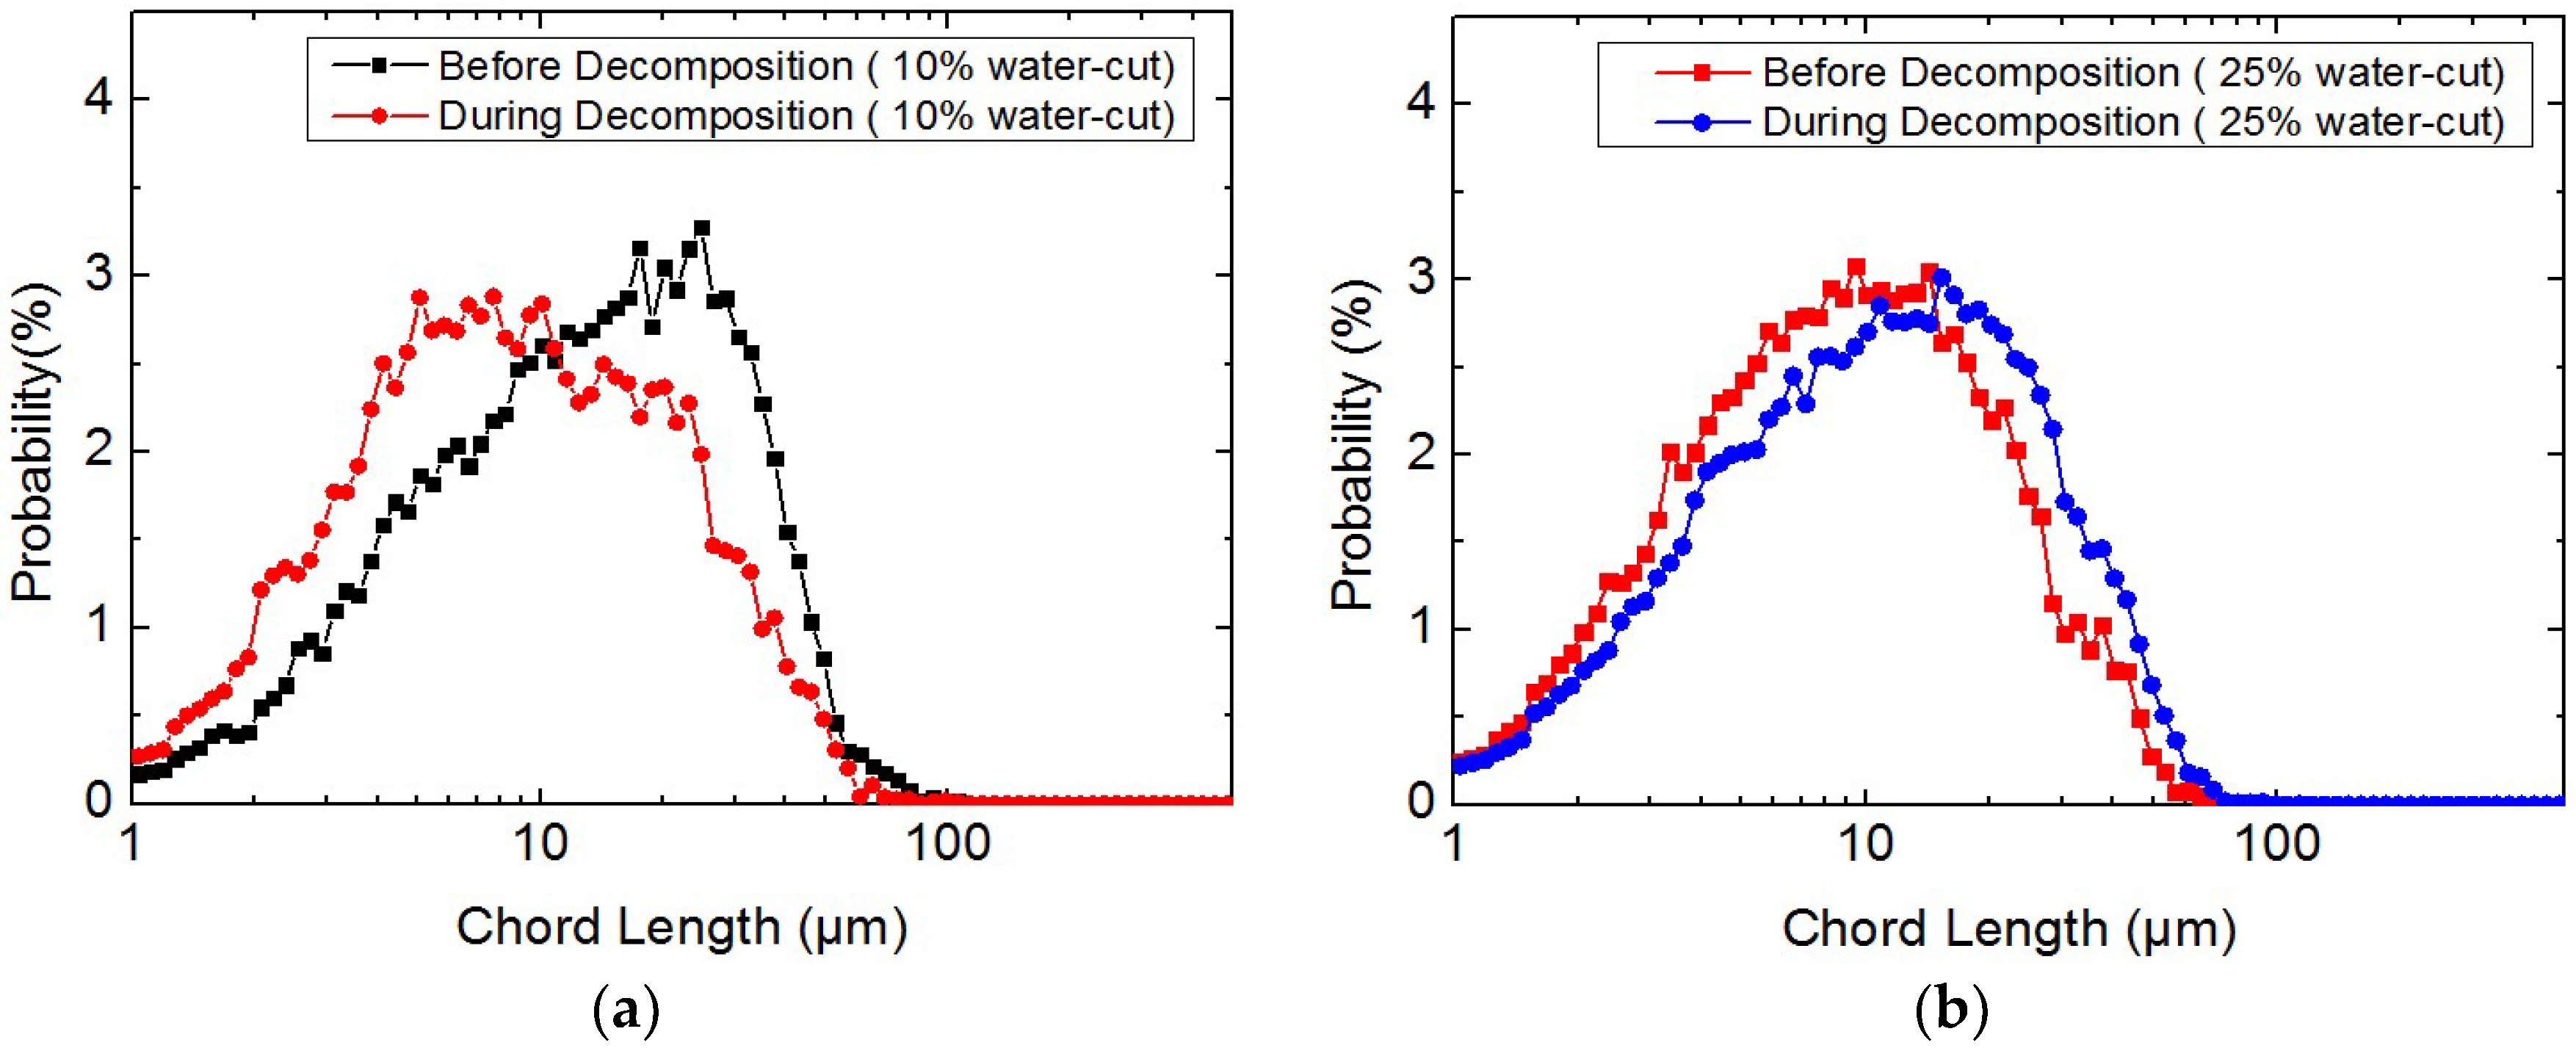
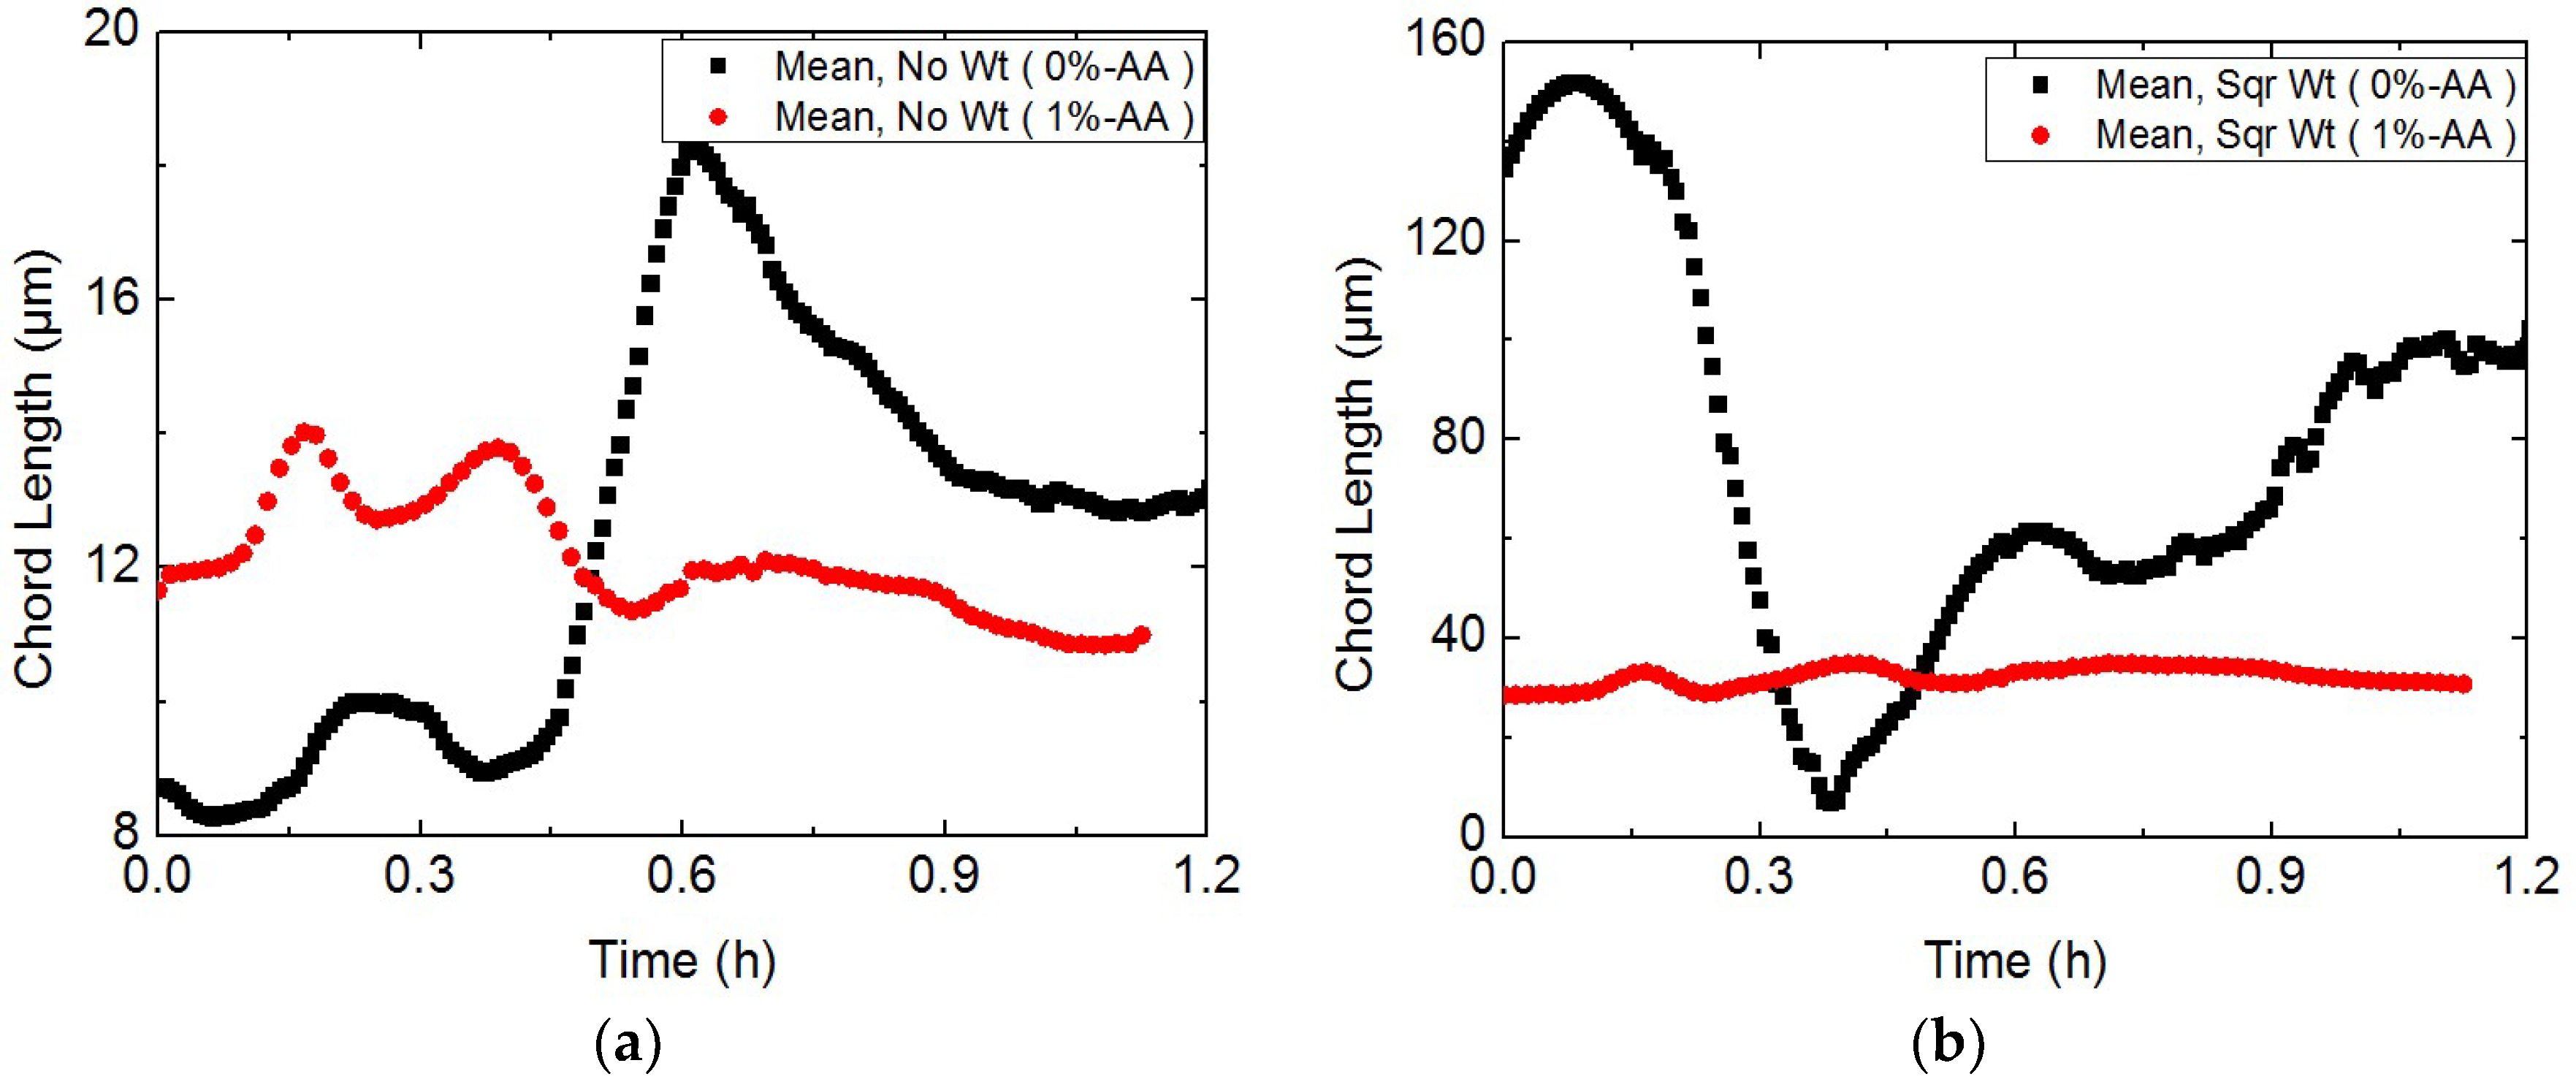
3.2. Study on the Micro-Particle Distribution Characteristics

Based on the study of micro-particle morphology during hydrate slurry dissociation in a pipeline system, this paper researched the particles’ number as well as chord-length distribution characteristics with the aid of an FBRM. It was expected to characterize the dissociation mechanism of hydrate slurry from a micro-perspective. Two micro-particle processing methods—the arithmetic mean and square weighting—were used to characterize the trends of the overall average particle size and the big-particle size, respectively.
Figure 6 presents the variation trend of particle/droplet numbers for different chord-length ranges during the hydrate slurry dissociation (initial system pressure 5 MPa, 25% water-cut). It can be observed in Figure 6 that a first increasing, then decreasing periodic oscillating trend of particle/droplet numbers appear for different chord-length ranges in the system. On one hand, this trend shows strong interactions among particles/droplets. On the other hand, it indicates that hydrate micro-particles/droplets were in a dynamic coupling process of breakage and agglomeration. That is, the increased number of micro-particles/droplets illustrate that particles were broken under the shear effect, while the decreased number proved the agglomeration. In general, the number of micro-particles/droplets in the dissociation could characterize the phenomena of the breakage and agglomeration, which is also in addition to the morphology study from the particle/droplet quantity.
Figure 7 presents the trends of the arithmetic mean chord length and the square weighting chord length under same experimental conditions. It can be observed that both the two-chord length tendencies were similar with the trend of the particle numbers in Figure 6. This proves once again that intense interactions occurred among particles/droplets during hydrate slurry dissociation, indicating the dynamic coupling process of breakage and agglomeration of micro-particles/droplets under the shear effect.
In order to provide the theoretical foundation for the hydrate slurry transportation, this paper investigated the influences of several macro factors (i.e., flow rate, water-cut, AA dosage, etc.) on the particle/droplet chord length and distribution. In detail:
(1). Influence of Flow Rate
A series of experiments was conducted to study the influence of flow rate on fixed 10% water-cut and 8.0 MPa initial system pressure. The specific experimental results are shown in Figure 8 and Figure 9. It was demonstrated in Figure 8a that the particle/droplet mean chord length fluctuated with time during the dissociation, forming a general trend of the first decline then increase. That was consistent with the co-existing process that particles/droplets broke down at first and then agglomerated. When the flow rate rose to 1.2 m/s, the mean chord length went down with time in the dissociation process. It meant that under this flow rate, particles/droplets broke more frequently than they agglomerated in the system. In other words, high flow rate could restrain the particle/droplet agglomeration during hydrate slurry dissociation.
Similarly, it can be seen in Figure 8b that the particle/droplet square-weighted chord length fluctuated with time during the dissociation yet showing a general trend of first up then down. This was due to the big particles/droplets in the system agglomerating at first and then disintegrating under the shear effect. While at 1.2 m/s flow rate, Figure 8b presented an alike trend as in Figure 8a. It also certified that high flow rate could restrain the big particle/droplet agglomeration during hydrate slurry dissociation. Figure 9 was even clearer, showing the influence of flow rate on the particle/droplet chord length distribution. Agglomeration among particles/droplets was easier under low flow rate during hydrate slurry dissociation (in Figure 9a, CLD curve moved to the right side), while high flow rate could restrain agglomeration effectively (in Figure 9b, CLD curve moved to the left side).
(2). Influence of Water-Cut
Figure 10 and Figure 11 show the influence of water-cut on the particle/droplet chord length and distribution during the hydrate slurry dissociation. It can be seen in Figure 10 that the mean chord length as well as the square weighting chord length increased with the water-cut in the system. Yet decreasing ranges of the mean and square weighting chord lengths became smaller in the higher water-cut system. That was caused by higher water-cut facilitating the collision and agglomeration among particles/droplets, leading to easier hydrate plugs in pipelines.
Also, in Figure 11, at 5 MPa system pressure and 1.0 m/s flow rate conditions, a chord length distribution curve of 10% water-cut moved to the left, while that of 25% water-cut moved to the right side during the decomposition. It indicated that particle/droplet agglomeration occurred in a 25% water-cut system rather than a 10% water-cut system. In sum, the particle agglomerating trend and the plug probability went up with the water-cut in hydrate slurry decomposition.
(3). Influence of AA Dosage
Various concentrations of AA were used in hydrate slurry decomposition experiments to investigate the impact of AA dosage on particle/droplet pattern and distributing characteristics. The experimental data were presented in Figure 12 and Figure 13.
It can be seen from Figure 12 that the dosage of AA had remarkable influence on the average chord length and the square weighting chord length of hydrate particles during the hydrate slurry decomposition. Hydrate particles easily start to polymerize without the adding of AA in the initial stage of hydrate decomposition process. It was evident that AA had greatly prohibited these micro-particle/droplet agglomerations during decomposition, resulting in relatively stable mean and square weighting chord length curves in Figure 12. Meanwhile, comparison in Figure 13 demonstrated that the chord length distribution curve went rightwards obviously without AA because of agglomeration, while curves changed little with AA before and after decomposition. In general, AA was so efficient in anti-agglomeration that could be widely applied to assure the hydrate slurry transportation.

4. Conclusions

Experiments on the dissociation of natural gas hydrate slurry in a flowing system were conducted in a high-pressure hydrate experimental flow loop. Important information on the microscopic decomposition of hydrate in the flow system was analyzed. The influences of flow rate, AA dosage, and water-cut on the micro-particle distribution characteristics were explored. Meanwhile, some outstanding conclusions were obtained.
Firstly, hydrate particles, dissociating particles, and water droplets co-existed in a system during the hydrate slurry decomposition. It brought about various forms of collision and agglomeration among particles and droplets and strengthened the particle/droplet agglomeration (decomposition would result in slurry instability).
Secondly, hydrate micro particles’ shape and size influenced its dissociating probability. Different particles did not dissociate at the same time during the hydrate slurry decomposition.
Moreover, a firstly-increased-then-decreased periodic oscillating trend of particle/droplet number and chord length was found during the hydrate slurry dissociation. On one hand, this trend showed the intense interactions among particles/droplets. On the other hand, it indicated that these micro hydrate particles/droplets were in a dynamic coupling process of breakage and agglomeration. Thereinto, the particle/droplet number peak value represented the breakdown of decomposing hydrate particles or coalescing particles/droplets under the action of flow shear, while the peak valley illustrated the reoccurrence of agglomeration of the broken hydrate micro particles under the action of flow (which is one of the main reason for the blockage of pipelines in the process of hydrate slurry decomposition). Meanwhile, the existence of chord length peak values was mainly caused by the agglomeration of decomposing hydrate particles or coalescing particles/droplets under the action of flow shear.
Finally, the trends of mean chord length and square-weighted chord length parameters would change with quantitative macro factors. The higher flow rate could restrain the particle/droplet agglomeration during the dissociation, and vice versa. The hydrate particle agglomerating tendency and plug probability went up with the water-cut. Anti-agglomerates (AA) could greatly prohibit micro-particle/droplet agglomeration during decomposition, resulting in relatively stable mean and square weighting chord length curves.

Author Contributions

Conceptualization, S.Z. and S.W.; Data curation, B.S. and X.S.; Investigation & Writing, X.L. and W.H.

Funding

This research was funded by [National Science Foundation of China], grant number [51804046]; [National Science Foundation of China], grant number [51574045]; [National Science Foundation of China], grant number [51574044]; [PetroChina Innovation Foundation], grant number [2018D-5007-0602]; [Natural Science Research Project of Jiangsu colleges and Universities], grant number [18KJB440001]; [Key Project of Jiangsu Provincial Key Research and Development plan (Industry Foresight and Common Key Technology)], grant number [BE2018065]; and [Enterprise Fund], grant number [KYH17020180].

Conflicts of Interest

The authors declare no conflict of interest.

References

  1. Sloan, E.D.; Koh, C.A. Clathrate Hydrates of Natural Gases, 3rd ed.; CRC Press: New York, NY, USA, 2008. [Google Scholar]
  2. Sloan, E.D.; Koh, C.A.; Sum, A.K.; Ballard, A.L.; Creek, J.; Eaton, M.; Lachance, J.; Mcmullen, N.; Palermo, T.; Shoup, G.; et al. Natural Gas Hydrates in Flow Assurance; Elsevier: Amsterdam, The Netherlands; Boston, MA, USA; Heidelberg, Germany; London, UK; New York, NY, USA; Oxford, UK; Paris, France; San Diego, CA, USA; Singapore; Sydney, Australia; Tokyo, Japan, 2010. [Google Scholar]
  3. Hammerschmidt, T. Formation of Gas Hydrates in Natural Gas Transmission Lines. Ind. Eng. Chem. 1934, 26, 851–855. [Google Scholar] [CrossRef]
  4. Kim, H.; Park, J.; Seo, Y.; Ko, M. Hydrate risk management with aqueous ethylene glycol and electrolyte solutions in thermodynamically under-inhibition condition. Chem. Eng. Sci. 2017, 158, 172–180. [Google Scholar] [CrossRef]
  5. Zanota, M.L.; Dicharry, C.; Graciaa, A. Hydrate Plug Prevention by Quaternary Ammonium Salts. Energy Fuels 2005, 19, 584–590. [Google Scholar] [CrossRef]
  6. Davies, S.R.; Ivanic, J.; Sloan, E.D. Predictions of hydrate plug dissociation with electrical heating. In Proceeding of the Fifth International Conference on Gas Hydrates, Trondhelm, Norway, 13–16 June 2005. [Google Scholar]
  7. Kelkar, S.K.; Selim, M.S.; Sloan, E.D. Hydrate dissociation rates in pipelines. Fluid Phase Equilib. 1998, 150–151, 371–382. [Google Scholar] [CrossRef]
  8. Sohn, Y.; Kim, J.; Shin, K.; Chang, D.; Seo, Y.; Aman, Z.M.; May, E.F. Hydrate plug formation risk with varying water-cut and inhibitor concentrations. Chem. Eng. Sci. 2015, 126, 711–718. [Google Scholar] [CrossRef]
  9. Shi, B.; Song, F.; Lv, X.; Li, W.Q.; Wang, Y.; Ding, L.; Liu, Y.; Yang, J.H.; Wu, H.H.; Wang, W.; et al. Investigation on natural gas hydrate dissociation from a slurry to a water-in-oil emulsion in a high-pressure flow loop. Fuel 2018, 233, 743–758. [Google Scholar] [CrossRef]
  10. Wu, R.; Aman, Z.M.; May, E.F.; Kozielski, K.A.; Hartley, P.G.; Maeda, N.; Sum, A.K. The Effect of a Kinetic Hydrate Inhibitor PVCap on Cyclopentane Hydrate Cohesion Forces and Growth. Energy Fuels 2014, 28, 3632–3637. [Google Scholar] [CrossRef]
  11. Zhaoa, H.; Suna, M.; Firoozabadi, A. Anti-agglomeration of natural gas hydrates in liquid condensate and crude oil at constant pressure conditions. Fuel 2016, 180, 187–193. [Google Scholar] [CrossRef]
  12. Ding, L.; Shi, B.H.; Lv, X.F.; Liu, Y.; Wu, H.; Wang, W.; Gong, J. Investigation of natural gas hydrate slurry flow properties and flow patterns using a high pressure flow loop. Chem. Eng. Sci. 2016, 146, 199–206. [Google Scholar] [CrossRef]
  13. Liu, Y.; Shi, B.; Ding, L.; Yong, Y.; Zhang, Y.; Ma, Q.; Lv, X.; Song, S.; Yang, J.; Wang, W. Investigation of Hydrate Agglomeration and Plugging Mechanism in Low-Wax-Content Water-in-Oil Emulsion Systems. Energy Fuels 2018, 32, 8986–9000. [Google Scholar] [CrossRef]
  14. Joshi, S.V.; Grasso, G.A.; Lafond, P.G.; Rao, I.; Webb, E.; Zerpa, L.E.; Sloan, E.D.; Koh, C.A.; Sum, A.K. Experimental flow loop investigations of gas hydrate formation in high water cut systems. Chem. Eng. Sci. 2013, 97, 198–209. [Google Scholar] [CrossRef]
  15. Yan, K.L.; Sun, C.Y.; Chen, J.; Chen, L.T.; Shen, D.J.; Liu, B.; Jia, M.L.; Niu, M.; Lv, Y.N.; Li, N. Flow characteristics and rheological properties of natural gas hydrate slurry in the presence of anti-agglomerant in a flow loop apparatus. Chem. Eng. Sci. 2014, 106, 99–108. [Google Scholar] [CrossRef]
  16. Majid, A.; Lee, W.; Srivastava, V.; Chen, L.; Warrier, P.; Grasso, G.; Vijayamohan, P.; Chaudhari, P.; Sloan, E.D.; Koh, C.A. Experimental investigation of gas-hydrate formation and particle transportability in fully and partially dispersed multiphase-flow systems using a high-pressure flow loop. SPE J. 2018, 23, 937–951. [Google Scholar] [CrossRef]
  17. Song, G.; Li, Y.; Wang, W.; Liu, S.; Wang, X.; Shi, Z.; Yao, S. Experimental investigation on the microprocess of hydrate particle agglomeration using a high-speed camera. Fuel 2018, 237, 475–485. [Google Scholar] [CrossRef]
  18. Shi, B.H.; Chai, S.; Wang, L.Y.; Lv, X.; Liu, H.S.; Wu, H.H.; Wang, W.; Yu, D.; Gong, J. Viscosity investigation of natural gas hydrate slurries with anti-agglomerants additives. Fuel 2016, 185, 323–338. [Google Scholar] [CrossRef]
  19. Lv, X.F.; Gong, J.; Li, W.Q.; Shi, B.; Yu, D.; Wu, H. Experimental Study on Natural Gas Hydrate Slurry Flow. SPE J. 2014, 19, 206–214. [Google Scholar] [CrossRef]
  20. Lv, X.F.; Shi, B.H.; Wang, Y.; Gong, J. Study on Gas Hydrate Formation and Hydrate Slurry Flow in a Multiphase Transportation System. Energy Fuels 2013, 27, 7294–7302. [Google Scholar] [CrossRef]
  21. Shi, B.H. Study on the Characteristics of Hydrate Growth and Flow in Gas—Condensate Multiphase Pipelines. Ph.D. Dissertation, China University of Petroleum, Beijing, China, 2012. [Google Scholar]
  22. Takeya, S.; Ripmeester, J.A. Dissociation behavior of clathrate hydrates to ice and dependence on guest molecules. Angew. Chem. Int. Ed. 2008, 47, 1276–1279. [Google Scholar] [CrossRef]
  23. Servio, P.; Englezos, P. A morphology study of methane and carbon dioxide gas hydrates formed from water droplets exposed to a gas atmosphere. In Proceedings of the 4th International Conference on Gas Hydrate, Yokohama, Japan, 19–23 May 2002. [Google Scholar]
  24. Gupta, A.; Moridis, G.J.; Kneafsey, T.J.; Sloan, E.D., Jr. Modeling pure methane hydrate dissociation using a numerical simulator from a novel combination of X-ray computed tomography and macroscopic data. Energy Fuels 2009, 23, 5958–5965. [Google Scholar] [CrossRef]
  25. Ilhan, S.; Kahruman, C.; Yusufoglu, I. Characterization of the thermal decomposition products of ammonium phosphomolybdate hydrate. J. Anal. Appl. Pyrolysis 2007, 78, 363–370. [Google Scholar] [CrossRef]
  26. Lee, J.D.; Susilo, R.; Englezos, P. Methane-ethane and methane-propane hydrate formation and decomposition on water droplets. Chem. Eng. Sci. 2005, 60, 4203–4212. [Google Scholar]
  27. Uchida, T.; Ebinuma, T.; Narita, H. Observations of CO2-hydrate decomposition and reformation processes. J. Cryst. Growth 2000, 217, 189–200. [Google Scholar] [CrossRef]
  28. Boxall, J.; Greaves, D.; Mulligan, J. Gas hydrate formation and dissociation from water-in-oil emulsions studied using PVM and FBRM Particle size analysis. In Proceedings of the 6th International Conference on Gas Hydrates, Vancouver, BC, Canada, 6–20 July 2008. [Google Scholar]
  29. Aman, Z.; Koh, C.A. Interfacial Phenomena in Gas Hydrate Systems. Chem. Soc. Rev. 2016, 45, 1678–1690. [Google Scholar] [CrossRef]
  30. Li, S.L.; Sun, C.Y.; Chen, G.J.; Li, Z.Y.; Ma, Q.L.; Yang, L.Y.; Sum, A.K. Measurements of Hydrate Film Fracture under Conditions Simulating the Rise of Hydrated Gas Bubbles in Deep Water. Chem. Eng. Sci. 2014, 116, 109–117. [Google Scholar] [CrossRef]
  31. Chen, G.J.; Guo, T.M. A New Approach to Gas Hydrate Modeling. Chem. Eng. J. 1998, 71, 145–151. [Google Scholar] [CrossRef]
Figure 1. Schematic of the high-pressure hydrate flow loop.
Applsci 08 02464 g001
Figure 2. Hydrate formation curve of the testing natural gas.
Applsci 08 02464 g002
Figure 3. The distinction between gas bubbles and droplets.
Applsci 08 02464 g003
Figure 4. Distribution of particles/droplets in the whole process of hydrate slurry dissociation (ae). (a) Before hydrate slurry dissociation. (b) Beginning of hydrate slurry dissociation. (c) During hydrate slurry dissociation. (d) The complete dissociation. (e) The longer emulsification time after complete dissociation.
Applsci 08 02464 g004aApplsci 08 02464 g004b
Figure 5. Gas emission quantity, decomposition rate, and pressure drop curves during the hydrate decomposition.
Applsci 08 02464 g005
Figure 6. Variation trends of particle/droplet numbers during hydrate slurry dissociation.
Applsci 08 02464 g006
Figure 7. Variation trends of chord length during the hydrate slurry dissociation (5 MPa, 25% water-cut).
Applsci 08 02464 g007
Figure 8. Influence of flow rate on mean chord length during the hydrate dissociation (a,b). (a) Influence of flow rate on mean chord length (8 MPa, 10% water-cut); (b) influence of flow rate on square-weighted chord (8 MPa, 10% water-cut).
Applsci 08 02464 g008
Figure 9. Influence of flow rate on chord length distribution during hydrate dissociation (a,b). (a) Influence of flow rate on chord length distribution (0.6 m/s); (b) influence of flow rate on chord length distribution (1.2 m/s).
Applsci 08 02464 g009
Figure 10. Influence of water-cut on chord length during the hydrate dissociation (a,b). (a) Influence of water-cut on mean chord length (5 MPa, 1.0 m/s); (b) influence of water-cut on square-weighted chord length (5 MPa, 1.0 m/s).
Applsci 08 02464 g010
Figure 11. Influence of water-cut on chord length distribution during hydrate dissociation (a,b). (a) Influence of water-cut on chord length distribution (10% water-cut); (b) Influence of water-cut on chord length distribution (25% water-cut).
Applsci 08 02464 g011
Figure 12. Influence of AA on mean chord length during the hydrate dissociation (a,b). (a) Influence of AA on mean chord length (5 MPa, 1.0 m/s flow rate, 25%water-cut); (b) Influence of AA on square-weighted chord length (5 MPa, 1.0 m/s flow rate, 25%water-cut).
Applsci 08 02464 g012
Figure 13. Influence of AA on chord length distribution during hydrate dissociation (a,b). (a) Influence of 0%-AA on chord length distribution; (b) Influence of 1%-AA on chord length distribution.
Applsci 08 02464 g013
Table 1. The composition of gas samples.
CompositionMol %CompositionMol %
N21.53C33.06
CO2.05iC40.33
CO20.89iC50.04
C189.02nC6+0.01
C23.07
Table 2. The composition of −20# diesel oil.
CompositionMol %CompositionMol %
C110.89C166.83
C123.36C177.99
C135.38C187.46
C146.2C196.38
C156.78C20+48.73

