Article

Inter-Laboratory Correlation Exercise with Portable Emissions Measurement Systems (PEMS) on Chassis Dynamometers

1
Joint Research Centre–European Commission, via E. Fermi 2749, 21027 Ispra, VA, Italy
2
Innovhub-SSI—SSC, via Galileo Galilei 1, 20097 San Donato Milanese, MI, Italy
3
FCA—Powertrain Engineering Cento, via Ferrarese 29, 44042 Cento, FE, Italy
4
FCA—Powertrain Engineering Pomigliano, via ex-Aeroporto, 80038 Pomigliano d’Arco, NA, Italy
5
FCA—Product Engineering Sangone, strada del Drosso 145, 10135 Torino, TO, Italy
6
Ferrari SpA, via Musso 2, 41053 Maranello, MO, Italy
7
Automobili Lamborghini SpA, via Modena 12, 40019 S. Agata Bolognese, BO, Italy
8
Landi Renzo, via Nobel 2, 42025 Cavriago, RE, Italy
9
Horiba, via Giovani Batista Feroggio 30, 10128 Torino, TO, Italy
10
Istituto Motori CNR, Viale Marconi 8, 80125 Napoli, NA, Italy
11
CUNA, Corso Galileo Ferraris 61, 10128 Torino, TO, Italy
*
Author to whom correspondence should be addressed.
Appl. Sci. 2018, 8(11), 2275; https://doi.org/10.3390/app8112275
Submission received: 22 October 2018 / Revised: 12 November 2018 / Accepted: 13 November 2018 / Published: 17 November 2018

Abstract

:

Featured Application

Repeatability and reproducibility of the PEMS measurement method.

Abstract

The recently introduced Real Driving Emissions (RDE) light-duty vehicle emissions regulation requires testing with Portable Emissions Measurement Systems (PEMS) during type approval and in-service conformity. The studies on the accuracy of PEMS today are limited. An inter-laboratory correlation exercise with PEMS took place in Italy in 2017. Eight laboratories measured exhaust emissions from a Golden Euro 6 gasoline vehicle with a Golden PEMS installed in it, along with the individual lab’s own PEMS, following the regulated laboratory method (bags from the dilution tunnel). The data of the exercise were used to estimate the repeatability and reproducibility of the methodology with PEMS. The statistical analysis estimated reproducibility of 2.9% (bags) to 5.5% (lab PEMS) for CO2, 20–25% for CO (all methods), 23–31% for NOx (all methods), and 29% (tunnel, Golden PEMS) to 39% (lab PEMS) for particle number. The mean differences of the PEMS to the regulated method were ±1.5 g/km (or ±1%) for CO2, <16 mg/km (or <5%) for CO, <4 mg/km (or <11%) for NOx and 1 × 10¹¹ particles/km (40%) for particle number. The results of this study confirm the satisfactory performance of PEMS and the permissible tolerances introduced in RDE regulation.

Graphical Abstract

1. Introduction

Vehicle emissions performance has been controlled since the 70’s in laboratories [1]. In current regulations worldwide, light-duty vehicles follow prescribed test cycles on chassis dynamometers and the whole exhaust gas is diluted in a dilution tunnel. A sample of the diluted exhaust gas is collected in bags and analyzed at the end of the test. However, for heavy-duty applications, only the engines with their after-treatment devices are type approved.
The first on-road testing started in the 90’s using Portable Emissions Measurement Systems (PEMS) [2]. PEMS were introduced in regulations for in-use compliance (in United States (US) since 2007) or in-service conformity (in the European Union (EU) since 2014) of heavy-duty vehicles without the need of removing the engine from the vehicle for testing it in the laboratory. Recently, PEMS testing was introduced for type-approval of light-duty vehicles (in EU since 2017) and will be necessary for in-service conformity with the introduction of the 4th RDE (Real-Driving Emissions) package. The measurement uncertainty of PEMS is taken into account in the limits that vehicles have to meet during the on-road testing: In the US with the measurement allowance program [3], in the EU with the measurement uncertainty framework study [4].
Testing with PEMS for market surveillance purposes will begin in 2020 in the EU [5]. For such testing, the instruments will have to fulfil the requirements of an under development standard from the European Committee for Standardization (CEN) (Comité Européen de Normalisation), which will assess the PEMS performance in the laboratory under various boundary conditions (e.g., ambient temperature and pressure, vibrations) [6]. Additionally, the testing laboratories, which are not designated technical services, will have to be accredited according to the ISO (International Organization for Standardization) 17025 [7] and 17020 [8]. ISO 17025 accredited laboratories typically participate in inter-laboratory exercises (or proficiency testing or round robins as they are sometimes called), described in the ISO 17043 [9], to determine whether they are within the repeatability and reproducibility limits of a reference method. The inter-laboratory exercises are also used to assign a certified value to a reference material. They also aim at evaluating the performance of a method through the repeatability and reproducibility criteria. For example, inter-laboratory exercises (round robins) were conducted when the particle number method (e.g., [10,11,12,13]), the particle number PEMS procedure [14], or the new World Harmonized Light-duty Test Procedure (WLTP) [15] were to be introduced in the regulations. Such exercises are also common practice in the automotive industries to assess their uncertainty, however, the publicly available data is limited.
On-road PEMS testing has become a necessary source for emission inventories because they provide the “true” vehicle emissions under a wide range of operating conditions. Laboratory testing has limitations to simulate some real-life cases, for example, large road gradients, strong accelerations, and variations in altitude. In some cases, it was found that laboratory and on-road emissions had differences by a factor of ten. Today PEMS are robust and reliable tools for on the roads; however, the studies addressing their measurement uncertainty are limited.
The main objective of this study is to present the repeatability and reproducibility of the PEMS measurement method and compare these values with the respective values of the regulated laboratory method. The results of this study are a first step in defining (internal) acceptable limits for the participating laboratories. The possibility to run inter-laboratory exercises only with PEMS, without chassis dynamometers testing, will also be discussed.

2. Materials and Methods

CUNA (Commissione Tecnica di Unificazione nell’Autoveicolo) is the Italian Standardization Body for automotive, federated to UNI (Ente Nazionale Italiano di Unificazione), Italian Standardization Body. CUNA, as proficiency testing provider, organizes annually inter-laboratory activity among Italian laboratories. The goal is to determine the repeatability and reproducibility of the regulated methodology over time. Additionally, in 2017, CUNA organized a PEMS inter-laboratory exercise, as it will be described below.

2.1. Test Protocol

Thirteen laboratories conducted three repetitions of the cold start World harmonized Light-duty Test Cycle (WLTC) with pre-defined road-loads and gear-shift strategy, as described in the recently introduced European Union regulation [16]. For all these tests no PEMS were connected to the tailpipe. The emissions were measured, as defined in the regulation, from bags collecting diluted exhaust gas from the dilution tunnel during the test cycle. For particle number emissions, real-time analyzers were measured directly from the dilution tunnel. All laboratories fulfilled the regulated requirements regarding instrumentation and maintenance plans.
After the official tests, eight of the laboratories conducted another three repetitions of the WLTC with a Golden PEMS installed inside the vehicle. During these tests, five of the laboratories used in addition their own PEMS (installed outside of the vehicle) measuring simultaneously with the Golden PEMS. The comparison of PEMS to the bag results is called “validation” test in the regulation and is used to confirm the proper installation and operation of the PEMS. In the regulation permissible tolerances are also given. For example, for CO2 the limits are 10 g/km or 10%, whichever is larger. For Particle Number (PN) the limits are given in the amendment [17] and are 1 × 10¹¹ particle/km or 50%, whichever is larger.
Two of the participating laboratories conducted additionally a pre-defined Real-Driving Emissions (RDE) test cycle in the laboratory using both PEMS. For this test, no bags were taken due to the long duration of the cycle, but real-time measurements from the dilution tunnel that were integrated to simulate the bag measurements. Details of the test protocol can be found in Table 1.

2.2. Golden Vehicle and Laboratories

The Golden vehicle that circulated to the laboratories was a Euro 6b compliant gasoline port-fuel injection 1.4 L passenger car (thus with no applicable PN limit). All laboratories used reference fuel from the same batch, but their own driver. The first laboratory at the end of the round robin repeated the test and confirmed that the emissions remained the same, within experimental uncertainty. The laboratories that measured with PEMS, all located in Italy, in alphabetical order, were:
  • FCA Powertrain Engineering, Pomigliano d’Arco (NA)
  • FCA Powertrain Engineering, Cento (FE)
  • FCA Product Engineering, Sangone, Torino (TO)
  • Ferrari SpA, Maranello (MO)
  • Innovhub SSI-SSC, San Donato Milanese (MI)
  • Joint Research Centre, Ispra (VA)
  • Lamborghini SpA, S. Agata Bolognese (BO)
  • Landi Renzo, Cavriago (RE).

2.3. Instrumentation

The Golden PEMS was the OBS-ONE provided by the manufacturer (Horiba, Kyoto, Japan). It was installed inside the vehicle with a 2-inch-flowmeter connected at the end of the vehicle tailpipe [18,19]. The PEMS measured CO2 and CO with heated NDIR (non-dispersive infrared detection), NOx with heated CLD (Chemiluminescence detection) and particle number with CPC (Condensation Particle Counter) after a hot catalytic stripper [20].
The PEMS from the laboratories were the MOVE from AVL (Graz, Austria) or the Horiba OBS-ONE with 2- or 2.5-inch flowmeters. The AVL MOVE measured CO2 and CO with NDIR, NOx with NDUV (non-dispersive ultraviolet) [21] and particle number with DC (Diffusion Charger) after a hot catalytic stripper [22].
All participating laboratories used the same span concentration levels for the Golden PEMS, but for their own PEMS they used their typical span concentration levels. The zero calibration of the Golden flow meter was conducted with the dilution connected and in operation, while for the laboratory flow meters, the laboratories followed their own procedures.

2.4. Calculations

For the evaluation of the results, the following steps were followed. For each lab, the arithmetic mean values of the emissions were calculated. Then the mean of the means and their standard deviation were used for graphical purposes. For a normal distribution, about 68% of the values are within one standard deviation of the mean. The assessment of repeatability and reproducibility followed ISO 5725 (Appendix A) [23]. The methodology is appropriate for cases where the sample is the same for all participating laboratories, which is not necessary for the circulating vehicle. The vehicle introduces an uncertainty that is difficult to quantify and to separate from the uncertainty of the methodology. Any potential change of emissions over time (which was not the case here) is also difficult to take into account in this methodology. For this reason, in addition, for each test the differences between PEMS and bags were calculated and then their mean and standard deviation were compared with the limits set in the regulation. The limitation of this approach is that the calculated differences, which are assumed to be the uncertainty of the PEMS, include the uncertainty of the reference method (bags).

3. Results

Initially, the absolute emission levels and their variability will be given. Then the absolute and relative differences of PEMS to the regulated method from each test will be averaged.

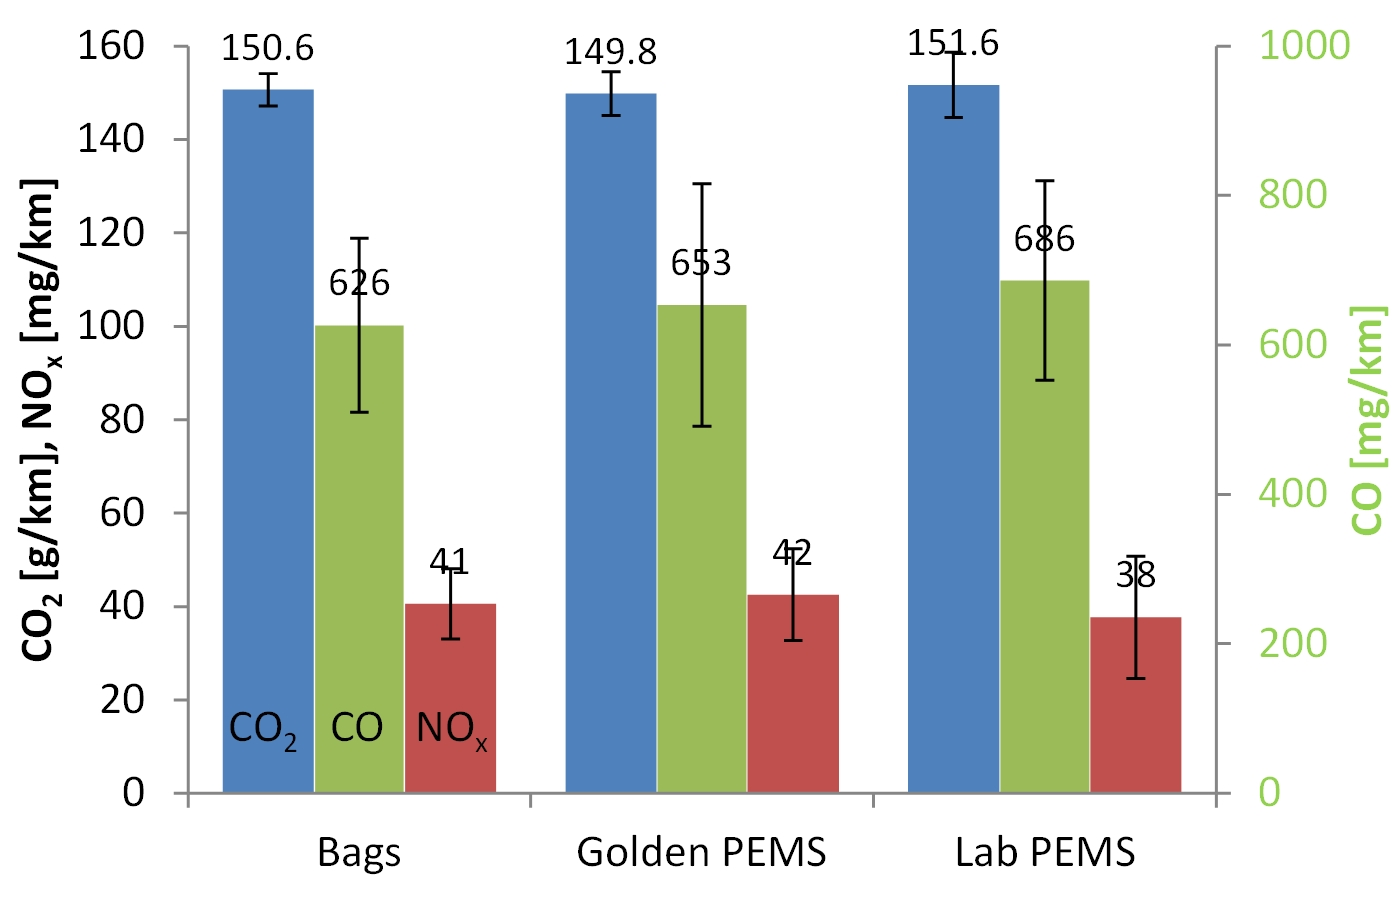
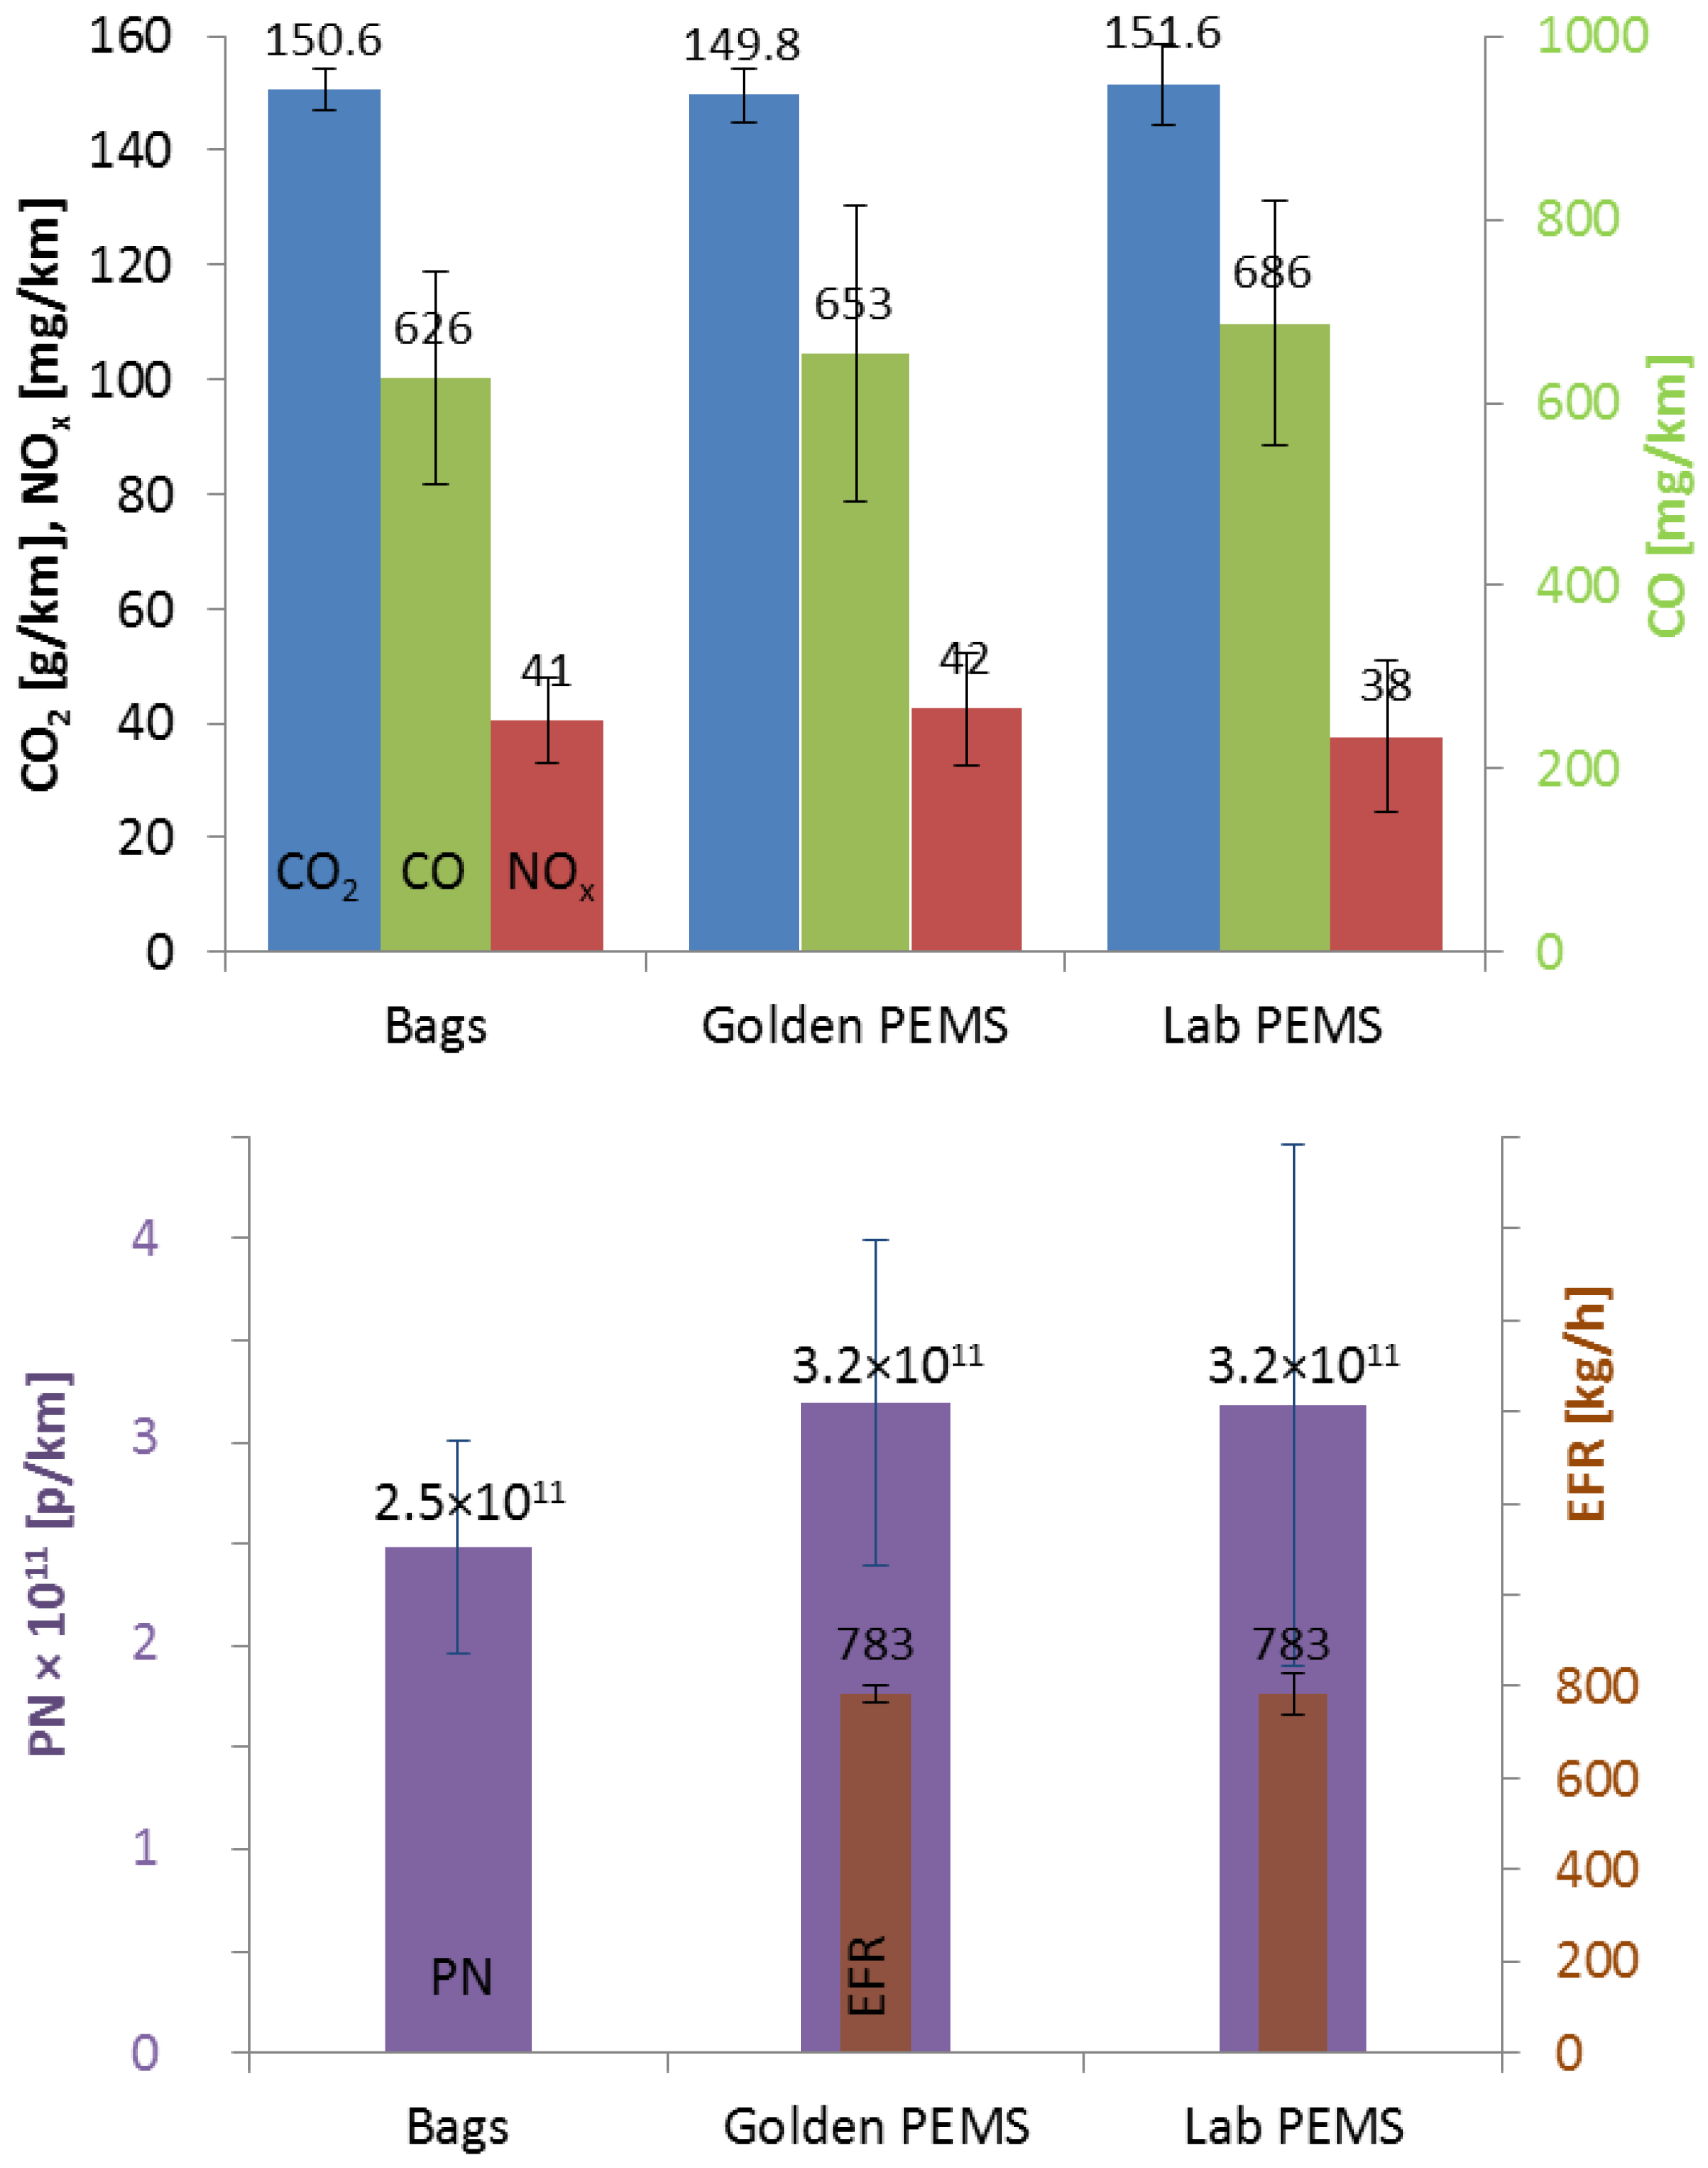
3.1. Absolute Emission Levels

Figure 1 presents the mean emissions of the vehicle from all laboratories as measured with the Golden PEMS, their own PEMS (Lab PEMS) and the laboratory regulated method with bags (or real-time signal from the tunnel for PN). For the gaseous pollutants, the differences are small and insignificant. For PN the tunnel emissions are lower by about 22% compared to the PEMS. The statistical analysis for repeatability and reproducibility can be found in Appendix A. In general, the statistical analysis showed reproducibility of 2.9% (bags) to 5.5% (lab PEMS) for CO2, 20–25% for CO, 23–31% for NOx, and 29% (tunnel, Golden PEMS) to 39% (Lab PEMS) for PN. The variance of Lab PEMS was similar to the laboratory variance for CO and NOx, while for CO2 and PN it was higher. The reasons will be discussed in the “Discussion” section.

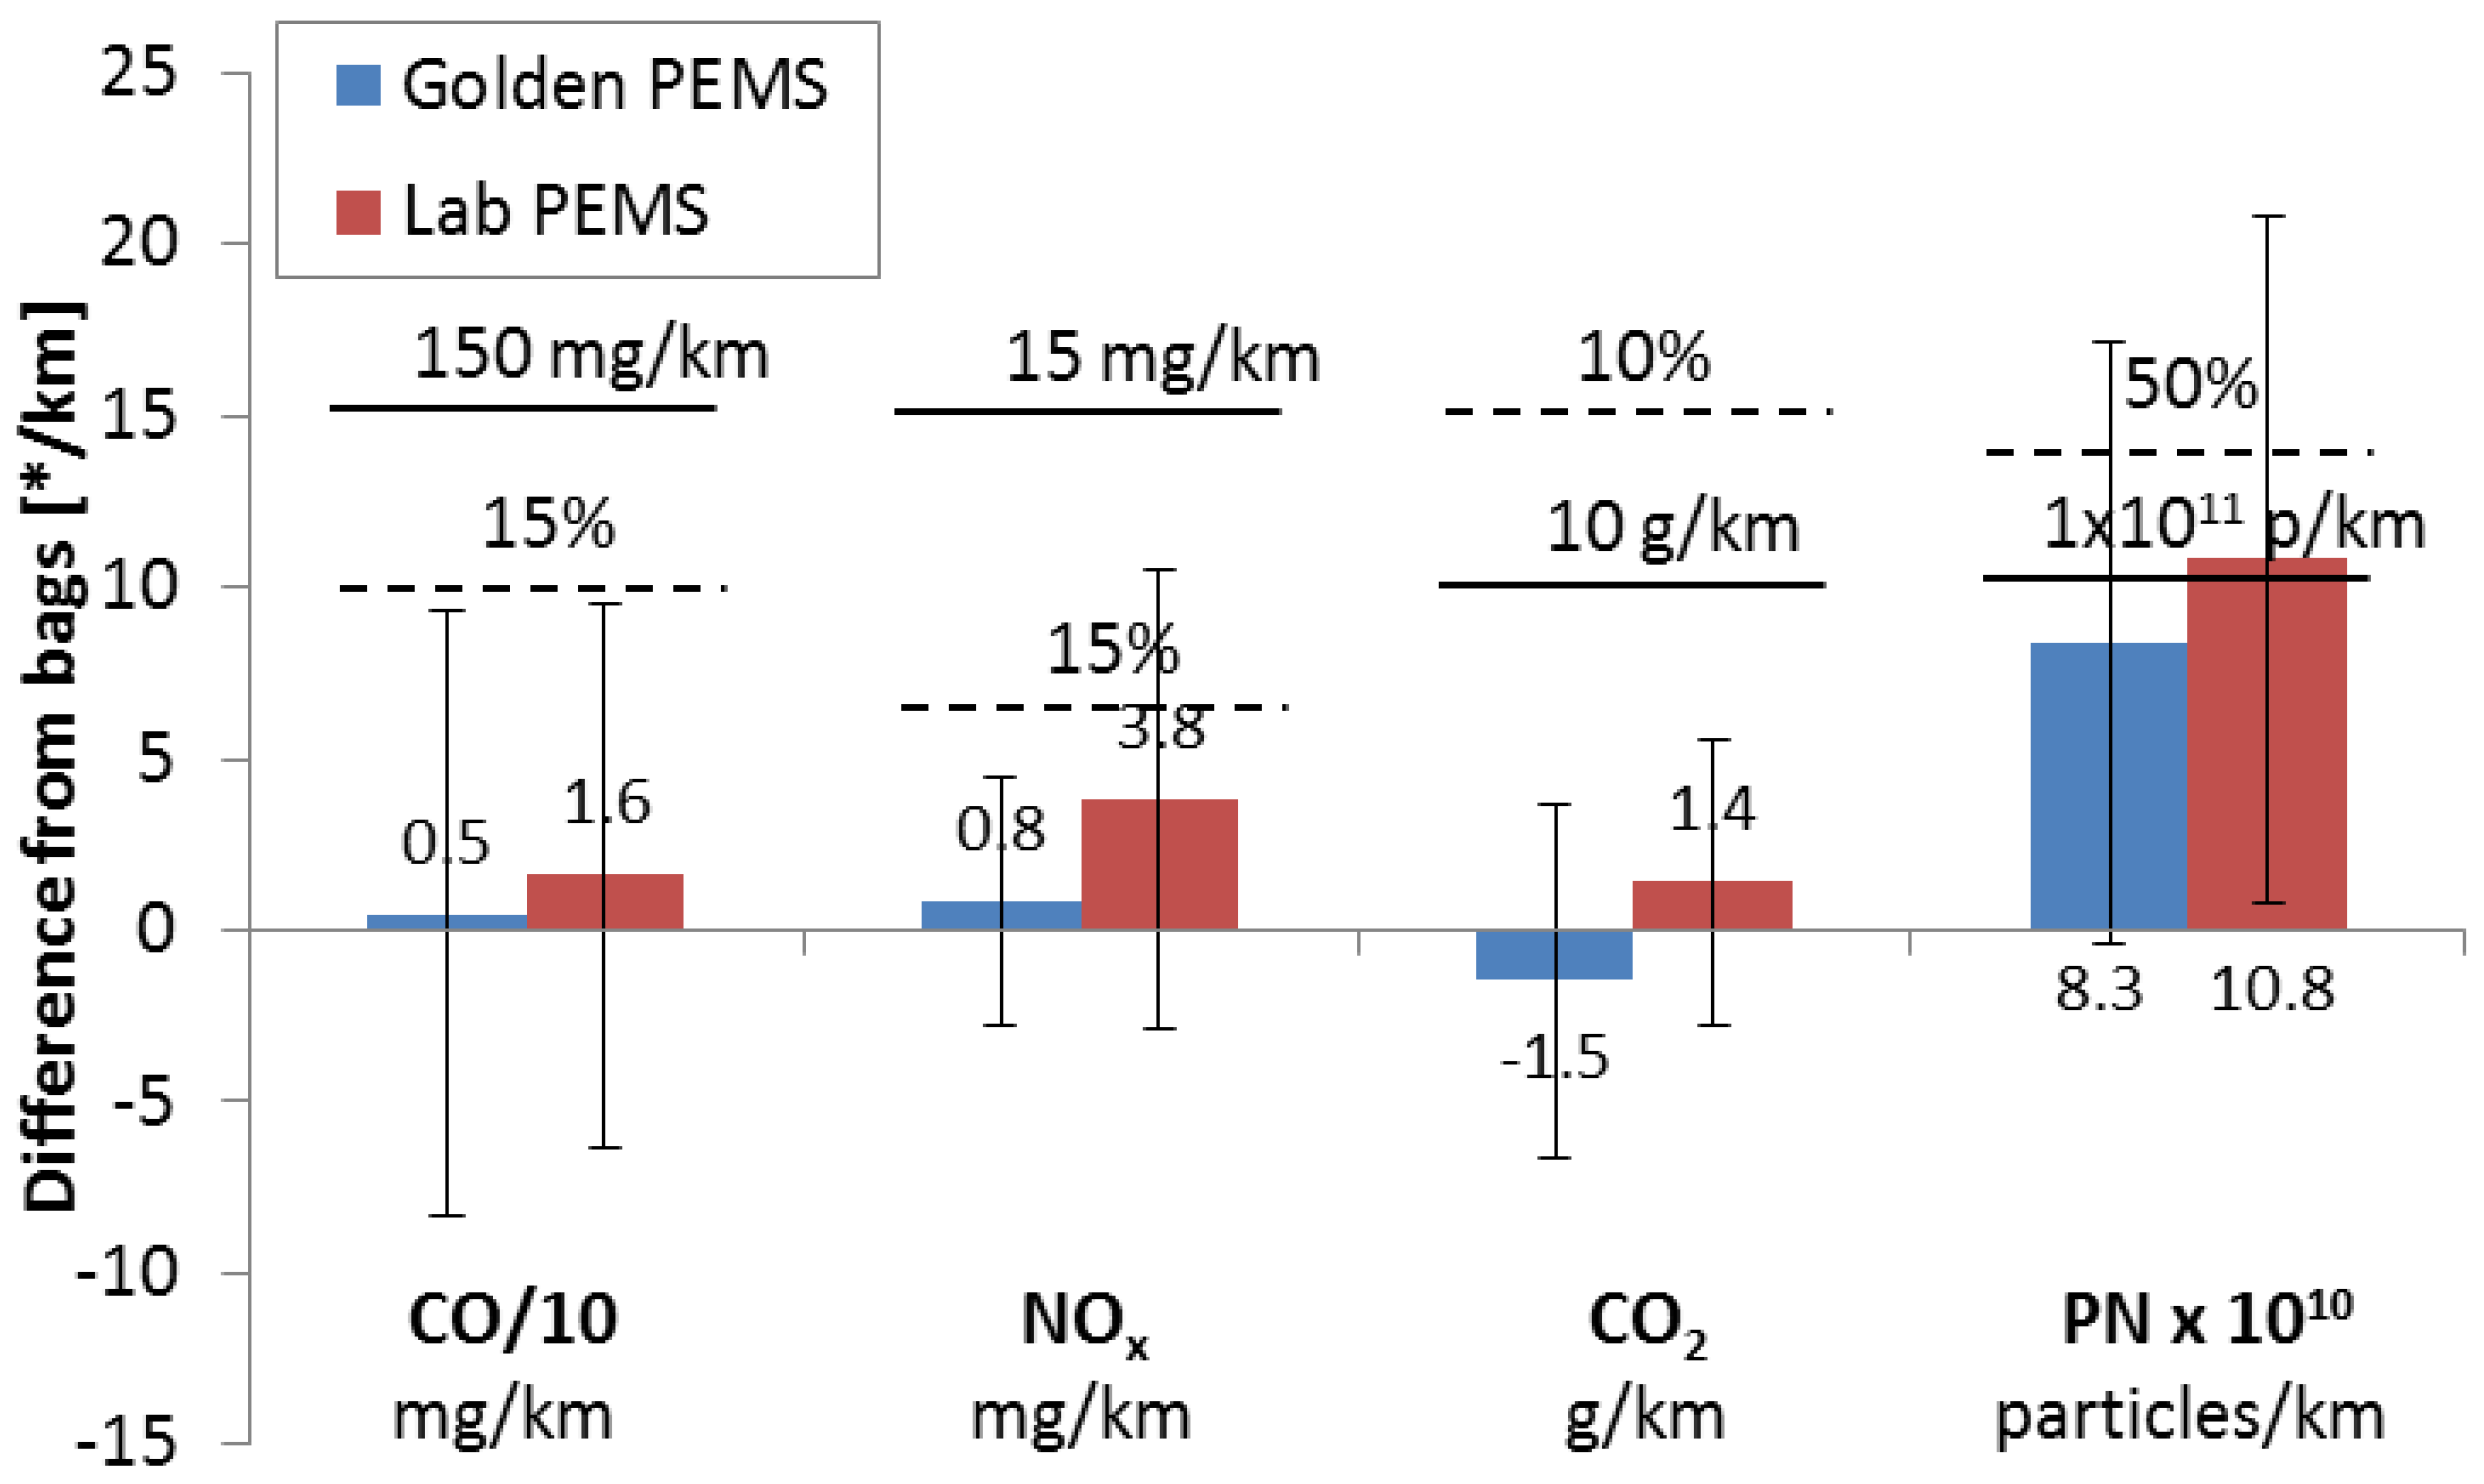
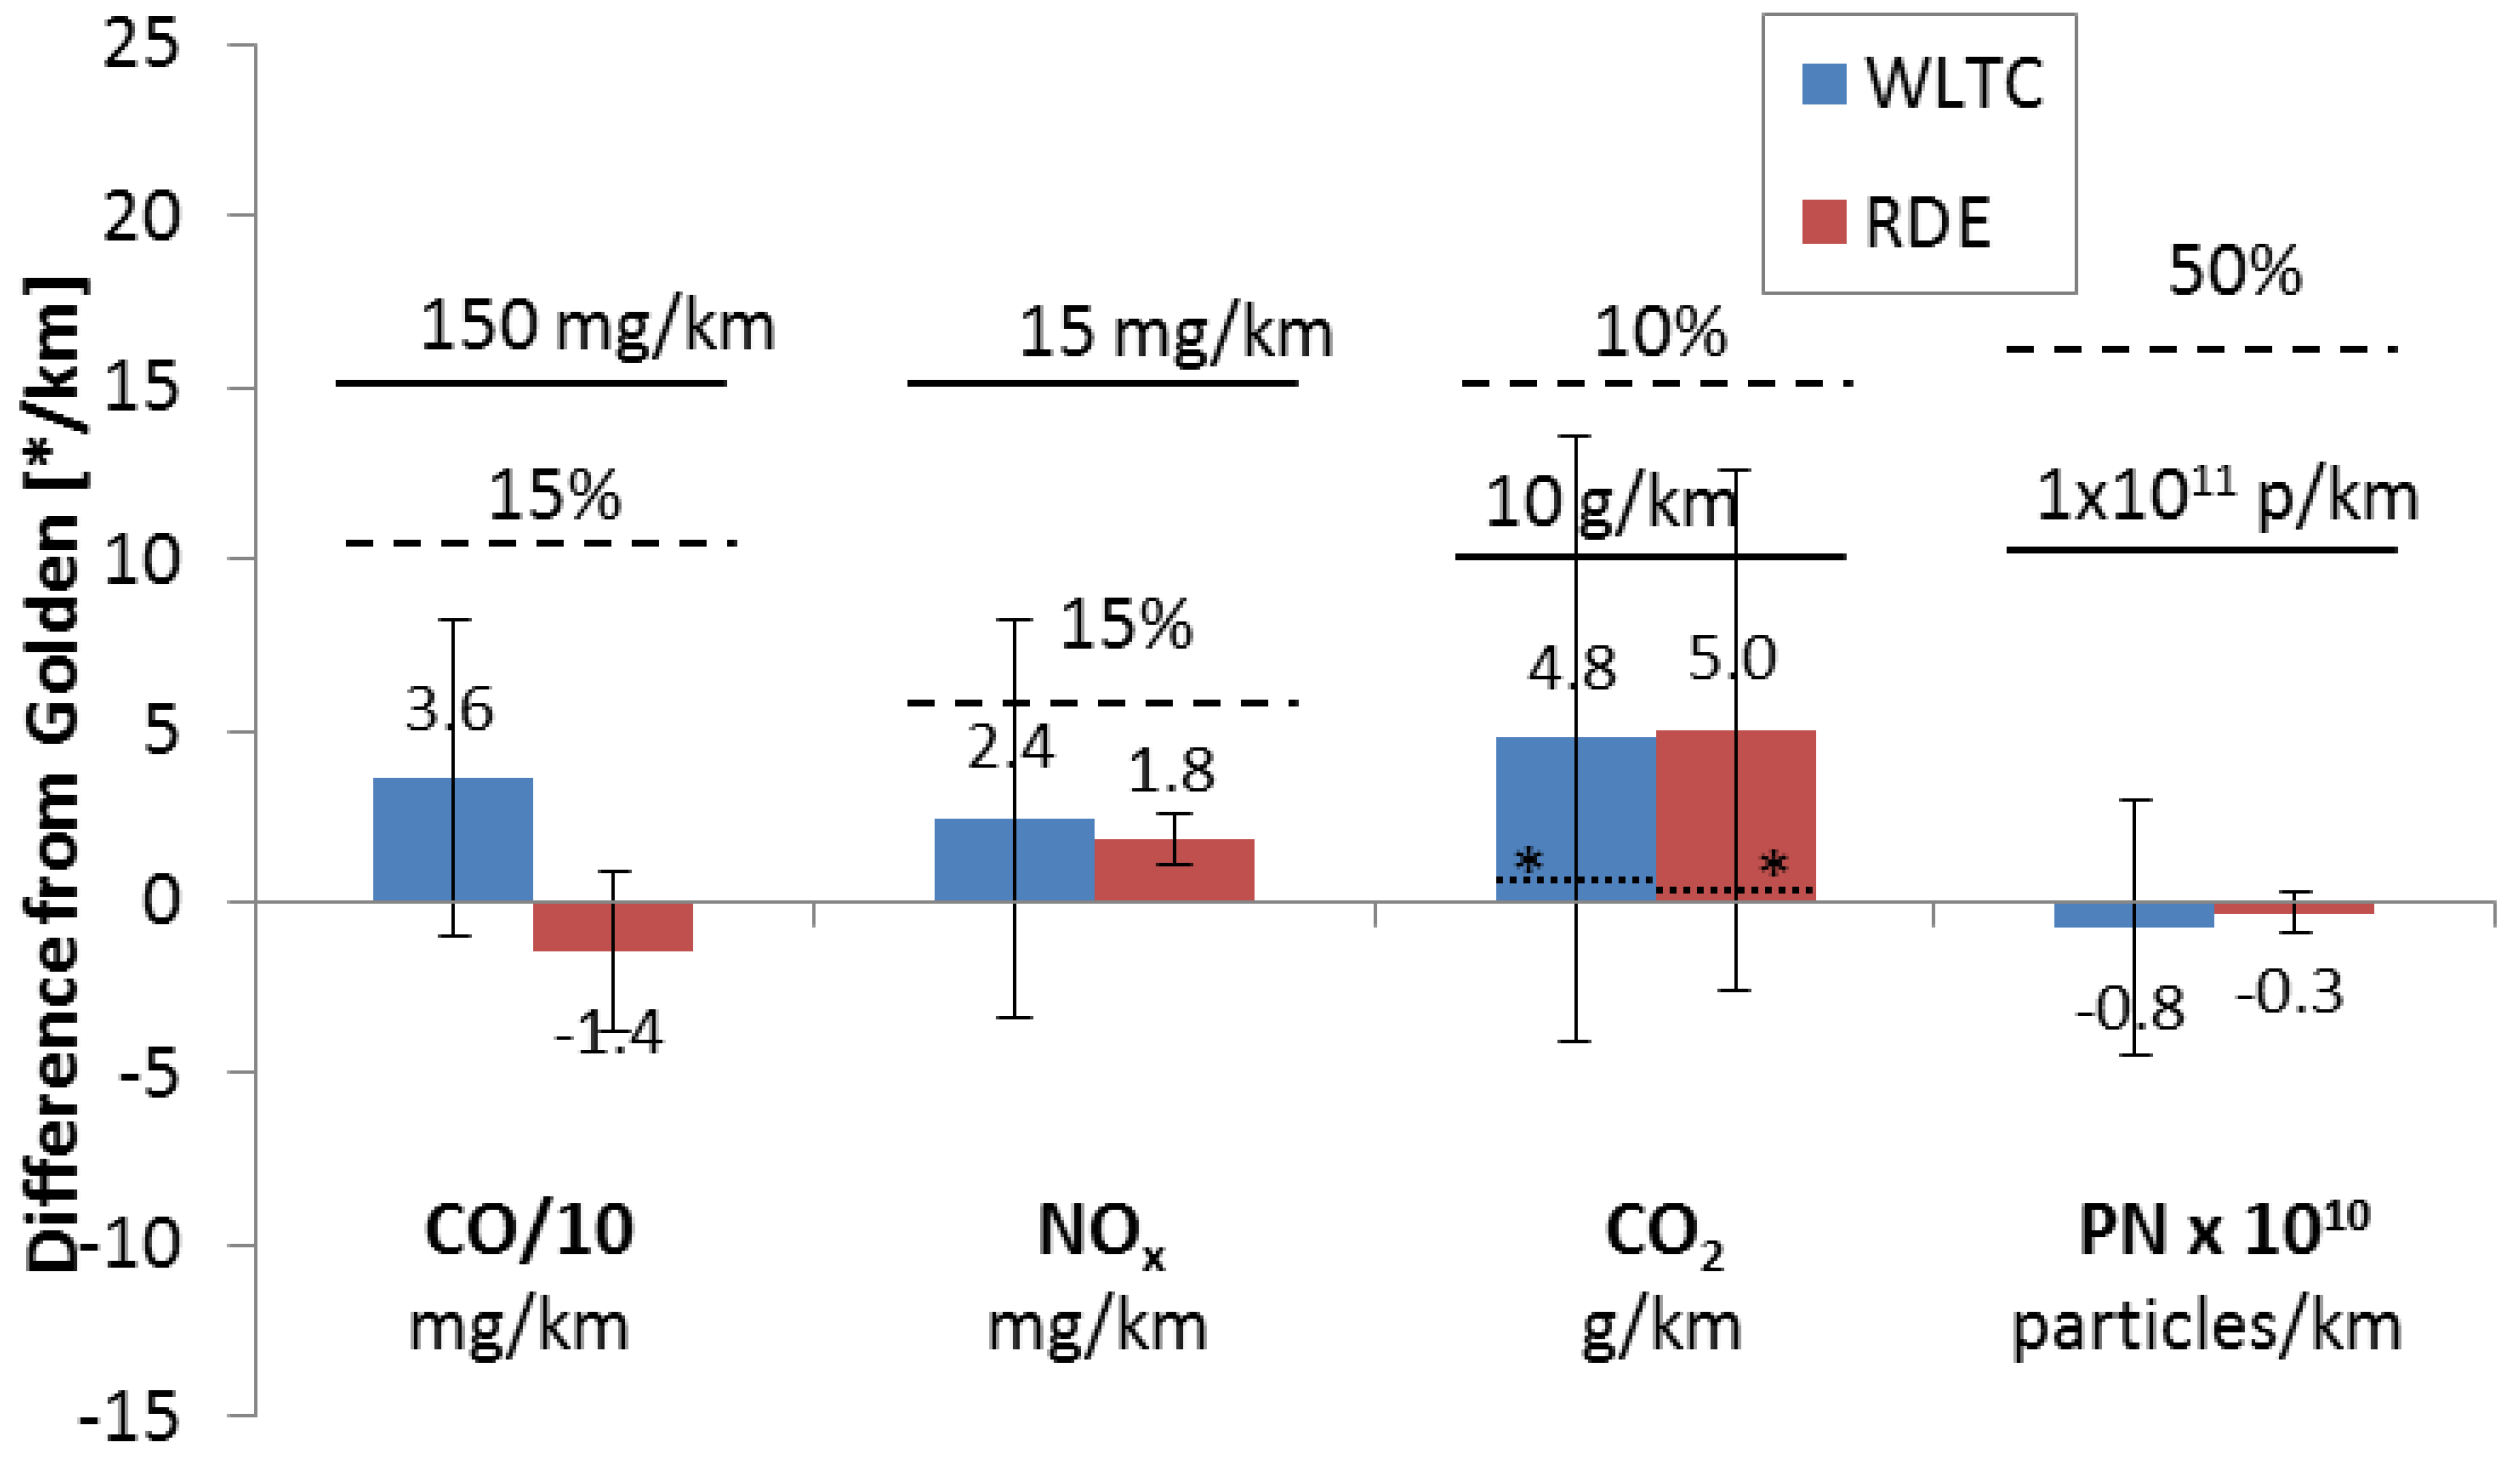
3.2. PEMS Differences

As a second approach for each test, the absolute and relative differences of the Golden and Lab PEMS to the bags were calculated. The means and the standard deviations of the differences for the pollutants are presented in Figure 2. The mean differences of PEMS to the bags were ±1.5 g/km (or ±1%) for CO2, <16 mg/km (or <5%) for CO, <4 mg/km (or <11%) for NOx and 1 × 10¹¹ particles/km (40%) for PN. These differences indicate negligible, if any, bias for the gaseous pollutants. The scatter of the differences lies within the permissible limits for the gaseous pollutants, with CO and NOx reaching the relative permissible limits in some cases. However, for PN, it seems that the PEMS measurements at tailpipe are significantly higher than the measurements at the dilution tunnel. The PN scatter (error bar) is acceptable (30%).

4. Discussion

The pollutant with the lowest variance is CO2. The reproducibility values can slightly vary depending on the laboratories that are considered. As an example, Table 2 gives the bags CO2 emissions of different combinations of laboratories and using (or not) of PEMS. The column of the “13 labs” gives the results of the official inter-laboratory exercise with all 13 participating laboratories, where no PEMS were used. The “eight labs (no PEMS)” column refers to the official results without any PEMS connected of the eight laboratories that repeated later the tests using the Golden PEMS. The “8 labs (with PEMS)” column refers to the eight laboratories results when they used the Golden PEMS. The “five labs” column refers to the official results without any PEMS connected of the 5 laboratories that repeated later the tests using their own PEMS in parallel to the Golden PEMS.
Regarding the mean value, there were up to 1.5 g/km of CO2 difference (149.1 vs. 150.6 g/km). The mean values of the 8 laboratories when using PEMS or when not using PEMS had 1 g/km difference. However, this difference is not due to the addition of PEMS: extracting a flow from the exhaust gas with the PEMS would reduce the final bag result if no correction of the automated systems for the extracted flow would be applied (but an increase was seen). In addition, this extracted flow is very small: around 3 L/min from each PEMS, for exhaust flow rates of 100 L/min (idle) to >2000 L/min (high speed). This means that the difference of 1 g/km is due to the variability of the different set of measurements. The reproducibility values vary from 2.1% to 2.9%, and they are in all cases lower than the reproducibility of the Golden PEMS (3.9%) or the Lab PEMS (5.5%), even when considering an equal number of laboratories (eight for Golden, five for Lab PEMS).
The (laboratory) reproducibility values of this study and others publicly available from inter-laboratory correlation exercises with gasoline cars are given in Table 3. The results are in good agreement and, according to the studies of Table 3, the CO2 reproducibility is around 2–3%, CO is typically 15–25%, NOx and PN between 20% and 40%. The PEMS reproducibility values are on the same order.
Table 4 examines whether the PEMS absolute levels are also in good agreement with the regulated bags methodology. Indeed in most cases, the mean differences to the bags are within the scatter of the measurements (not statistically significant differences). The results confirm that there is no bias from PEMS with the exception of PN (see below). The differences of one (Golden) PEMS to the laboratory results were smaller than from many (laboratory) PEMS.
The previously mentioned results (Appendix A) showed that the PEMS reproducibility is at the same levels (for CO and NOx) or only slightly higher (for CO2 and PN) compared to the laboratory results. A detailed analysis showed that for PN there is a bias, while for CO2 the scatter is higher (Table 4). Although, not in the scope of this paper, the following points should be considered:
  • The installation of the flowmeters is critical. Sudden curves, sharp bends or diameter changes can result in high errors. Additionally, uncertainties at idle and low flow rates can result in over-or underestimation of the CO2 (e.g., Reference [14]).
  • The exhaust flow measurement uncertainty at idle can influence the CO2 results (for the other pollutants the effect is small because cars typically have low emissions at idle and low loads/speeds) [25,26]. The zero calibration should be conducted with the dilution tunnel operating in order to minimize any influence of the under-pressure created by the constant volume sampler (CVS). Investigations with “open” CVS (i.e., the flowmeter is connected to the tubing via a cone that permits ambient air also to enter) would minimize pressure and pulsations from the CVS and should be further investigated in order to evaluate the true performance of the flowmeter on the road.
  • The difference of the PN results can be high: partly due to PEMS uncertainties, but mainly due to lower PN concentrations reaching the dilution tunnel (diffusion losses, thermophoretic losses, coagulation etc.) [22].
As a final check, the consistency of the PEMS was evaluated by comparing the laboratory PEMS measuring simultaneously with the Golden PEMS, using their own flow meters, for both the WLTC and the RDE cycles. The results are plotted in Figure 3. The mean differences are small and similar between the two cycles. The good agreement of the Golden and Lab PEMS for PN, even though they consisted of different counting technologies (CPCs and DCs) indicates that the higher emissions at the tailpipe are true and not a calibration issue. Small differences between PN systems at the same location was expected for CPC based systems, but higher differences for DC-based systems have been seen [27], especially at lower emission levels. Some attention needs to be given to the 5 g/km mean difference of the CO2 results. This difference can be partly explained by the general slight overestimation of Lab PEMS and a slight underestimation of the Golden PEMS (see Figure 2). A closer look at the data revealed that a big part of this difference came from one laboratory. Excluding this laboratory from the analysis, reduced the difference to <1 g/km with scatter (one standard deviation) of 3 g/km. Comparing the mean exhaust flow rates calculated by the PEMS revealed that the reason for the higher results of that laboratory was due to the exhaust flow meter. While the rest laboratories flow meters agreed within ±5% with the Golden flowmeter, that laboratory’s flow meter had 11% mean difference. As mentioned above and in the literature [26] the assessment of the exhaust flowmeters is important in future studies.
The consistent and small differences of the lab PEMS from the Golden PEMS indicates that conducting inter-laboratory exercises with a Golden PEMS but without involving chassis dynamometer testing is feasible because only relative differences have to be compared. This approach eliminates the variability of the vehicle. In addition, such a comparison covers also the environmental conditions, vibrations etc. that cannot be easily simulated in a laboratory. The practicality of such exercise needs to be evaluated though. For example, it would require the installation of the Golden PEMS inside the vehicle and the lab PEMS outside of the vehicle on the tow bar (hook). Fitting two flowmeters for conducting on-road tests is also very challenging. It would also be highly recommended to validate the PEMS at the beginning and at the end of the exercise to confirm that there was no drift. Finally, it has to be ensured that the Golden PEMS will be certified [6] and that the environmental conditions have minimum influence on it, even though the temperature and vibrations variations will be much smaller inside the car compared to outside. Alternatively, it could be installed in a conditioned trolley outside the vehicle.

5. Conclusions

An inter-laboratory exercise with PEMS in eight laboratories in Italy showed that the reproducibility of the PEMS methodology is at the same level (CO 20–25%, NOx 23–31%) or only slightly higher (CO2 5.5% vs. 2.9%, PN 39% vs. 29%) compared to the laboratory legislated method. The reproducibility values of the Golden PEMS were at the same levels as the laboratory method. The higher scatter of the CO2 measurements was attributed to the exhaust flow measurement, while the higher absolute levels of the PN were attributed to particle losses taking place from the vehicle until the dilution tunnel. These results confirm the permissible tolerances of the regulation. Additionally, they open the possibility of conducting inter-laboratory exercises only with PEMS, without the need of chassis dynamometers.

Author Contributions

conceptualization, B.G. and A.D.D.; methodology, B.G., S.C., M.M., M.S., G.M., R.T., M.D., G.C., F.D.T., M.V.P., M.C., and A.D.D.; validation, M.C.; formal analysis, B.G.; data curation, A.D.D.; writing—original draft preparation, B.G.; writing—review and editing, B.G., S.C., M.M., M.S., G.M., R.T., M.D., G.C., F.D.T., M.V.P., M.C., and A.D.D.; supervision, A.D.D.; project administration, A.D.D.

Funding

This research received no external funding.

Acknowledgments

The authors would like to thank the technical personnel for conducting the testing. Special acknowledgments to P. Bonnel for his suggestions at an earlier draft.

Conflicts of Interest

The authors declare no conflict of interest.

Disclaimer

The opinions expressed in this manuscript are those of the authors and should in no way be considered to represent an official opinion of the European Commission and their organizations. Mention of trade names or commercial products does not constitute endorsement or recommendation by the authors.

Appendix A

The statistical analysis determined the (experimental) repeatability (Sr) and reproducibility (SR) of pollutants with various methods based on the standard ISO 5725-2 (ISO, 1994). In order to capture the situation as it is today and due to the limited number of laboratories, no variance (Cochran test) or average (Grubbs test) outliers tests were applied.
For each methodology (Bags, Golden PEMS, Lab PEMS) and pollutant (CO2, CO, NOx, PN), the overall reproducibility variance was calculated using the following formula:
  S R 2 = S r 2 + S L 2  
where SL2 stands for the between-laboratories variance and Sr2 for the overall repeatability variance:
  S r 2 = i = 1 p ( n i 1 ) S i 2 i = 1 p ( n i 1 )  
  S L 2 = [ 1 / ( p 1 ) ] i = 1 p [ n i ( x i x ¯ ) 2 ] S r 2 n ¯  
where ni stands for the number of measurement achieved by laboratory i, Si the standard deviation of laboratory i, p the number of laboratories available (without any outlier removal), x ¯ stands for the average of the means of the non-outlier laboratories, and n ¯ defined as:
  n ¯ = 1 p 1 [ i = 1 p n i i = 1 p n i 2 i = 1 p n i ]  
More details regarding outlier identification as well as the calculation of repeatability and reproducibility of the inter-comparison exercise can be found in the ISO 5725-2 standard. The results are presented in Table A1, Table A2, Table A3 and Table A4.
Table A1. Statistical analysis results for CO2.
CO2BagsGolden PEMSLab PEMS
p875
x ¯ [g/km]150.6149.8151.6
SR2.9%3.9%5.5%
SL2.4%3.2%5.5%
Sr1.6%2.2%0.6%
Table A2. Statistical analysis results for CO.
COBagsGolden PEMSLab PEMS
p775
x ¯ [mg/km]626.3653.3686.0
SR22%25%20%
SL18%21%17%
Sr13%14%11%
Table A3. Statistical analysis results for NOx.
NOxBagsGolden PEMSLab PEMS
p874
x ¯ 40.542.541.7
SR23%25%31%
SL20%23%29%
Sr11%9%9%
Table A4. Statistical analysis results for PN.
PNTunnelGolden PEMSLab PEMS
p464
x ¯ [particles/km]2.5 × 10113.2 × 10113.2 × 1011
SR29%24%39%
SL15%13%30%
Sr25%21%25%

References

  1. Berg, W. Legislation for the reduction of exhaust gas emissions. In The Handbook of Environmental Chemistry; 3(Part T); Springer: Berlin/Heidelberg, 2003; pp. 175–253. [Google Scholar]
  2. He, H.; Jin, L. A Historical Review of the U.S. Vehicle Emission Compliance Program and Emission Recall Cases; White paper; International Council on Clean Transportation: Washington, DC, USA, April 2017. [Google Scholar]
  3. Feist, M.; Sharp, C.; Spears, M. Determination of PEMS measurement allowances for gaseous emissions regulated under the heavy-duty diesel engine in-use testing program. Part 1—Project overview and PEMS evaluation procedures. SAE Int. J. Fuels Lubr. 2009, 2, 435–454. [Google Scholar] [CrossRef]
  4. Giechaskiel, B.; Clairotte, M.; Valverde-Morales, V.; Bonnel, P.; Kregar, Z.; Franco, V.; Dilara, P. Framework for the assessment of PEMS (portable emissions measurement systems) uncertainty. Environ. Res. 2018, 166, 251–260. [Google Scholar] [CrossRef] [PubMed]
  5. RDE4 2018. Commission Regulation (EU) (Voted 3rd of May 2018) Amending Directive 2007/46/EC, Commission Regulation (EC) No 692/2008 and Commission Regulation (EU) 2017/1151 for the Purpose of Improving the Emission Type Approval Tests and Procedures for Light Passenger and Commercial Vehicles, Including Those for In-Service Conformity and Real-Driving Emissions and Introducing Devices for Monitoring the Consumption of Fuel and Electric Energy; Ares (2018)1297632; European Commission: Brussels, Belgium, 2018. [Google Scholar]
  6. CEN/TC 301:2018. Road Vehicles. Portable Emission Measuring Systems (PEMS) Performance Assessment; Proposal for European Standard; European Committee for Standardization: Brussels, Belgium, 2018. [Google Scholar]
  7. ISO/IEC 17025:2017. General Requirements for the Competence of Testing and Calibration Laboratories; International Organization for Standardization: Geneva, Switzerland, 2017; Available online: https://www.iso.org/standard/66912.html (accessed on 16 November 2018).
  8. ISO/IEC 17020:2012. Conformity Assessment—Requirements for the Operation of Various Types of Bodies Performing Inspection; International Organization for Standardization: Geneva, Switzerland, 2012; Available online: https://www.iso.org/standard/52994.html (accessed on 16 November 2018).
  9. ISO/IEC 17043:2010. Conformity Assessment—General Requirements for Proficiency Testing; International Organization for Standardization: Geneva, Switzerland, 2010; Available online: https://www.iso.org/standard/29366.html (accessed on 16 November 2018).
  10. Mamakos, A.; Ntziachristos, L.; Samaras, Z. Comparability of particle emission measurements between vehicle testing laboratories: A long way to go. Meas. Sci. Technol. 2004, 15, 1855–1866. [Google Scholar] [CrossRef]
  11. Zervas, E.; Dorlhene, P.; Forti, L.; Perrin, C.; Momique, J.; Monier, R.; Ing, H.; Lopez, B. Inter-laboratory test of exhaust PM using ELPI. Aerosol Sci. Technol. 2005, 39, 333–346. [Google Scholar] [CrossRef]
  12. Zervas, E.; Dorlhene, P.; Forti, L.; Perrin, C.; Momique, J.; Monier, R.; Ing, H.; Lopez, B. Inter-laboratory study of the exhaust gas particle number measurements using the condensation particle counter (CPC). Energy Fuels 2006, 20, 2426–2431. [Google Scholar] [CrossRef]
  13. Giechaskiel, B.; Dilara, P.; Andersson, J. Particle measurement programme (PMP) light-duty inter-laboratory exercise: Repeatability and reproducibility of the particle number method. Aerosol Sci. Technol. 2008, 42, 528–543. [Google Scholar] [CrossRef]
  14. Riccobono, F.; Giechaskiel, B.; Mendoza, P. Particle Number PEMS Inter-Laboratory Comparison Exercise: Performance of PN-PEMS for the Extension of the RDE Test Procedure to PN; JRC report EUR 28136 EN; Publication Office for the European Union: Luxembourg, 2016. [Google Scholar]
  15. Haniu, T.; Vallaude, C. Asian and European WLTP RRT. In Proceedings of the WLTP 19th Meeting, Geneva, Switzerland, 6 June 2017. [Google Scholar]
  16. Commission Regulation (EU). Commission Regulation (EU) 2017/1151 of 1 June 2017 supplementing Regulation (EC) No 715/2007 of the European Parliament and of the Council on type approval of motor vehicles with respect to emissions from light passenger and commercial vehicles (Euro 5 and Euro 6) and on access to vehicle repair and maintenance information, amending Directive 2007/46/EC of the European Parliament and of the Council, Commission Regulation (EC) No 692/2008 and Commission Regulation (EU) No 1230/2012 and repealing Commission Regulation (EC) No 692/2008. Off. J. Eur. Un. 2017, L175/1, 639. [Google Scholar]
  17. Commission Regulation (EU). Commission Regulation (EU) 2017/1154 of 7 June 2017 amending Regulation (EU) 2017/1151 supplementing Regulation (EC) No 715/2007 of the European Parliament and of the Council on type-approval of motor vehicles with respect to emissions from light passenger and commercial vehicles (Euro 5 and Euro 6) and on access to vehicle repair and maintenance information, amending Directive 2007/46/EC of the European Parliament and of the Council, Commission Regulation (EC) No 692/2008 and Commission Regulation (EU) No 1230/2012 and repealing Regulation (EC) No 692/2008 and Directive 2007/46/EC of the European Parliament and of the Council as regards real-driving emissions from light passenger and commercial vehicles (Euro 6). Off. J. Eur. Un. 2017, L175, 708–732. [Google Scholar]
  18. Nakamura, H.; Kihara, N.; Adachi, M.; Ishida, K. Development of a Wet-Based NDIR and Its Application to On-Board Emission Measurement System; SAE technical paper, Paper 2002-01-0612; Society of Automotive Engineers, Inc.: Detroit, MI, USA, 2002. [Google Scholar]
  19. Nakamura, H.; Akard, M.; Porter, S.; Kihara, N.; Adachi, M.; Khalek, I. Performance Test Results of a New On-Board Emission Measurement System Conformed with CFR Part 1065; SAE Technical Paper, 2007-01-1326; Society of Automotive Engineers, Inc.: Detroit, MI, USA, 2007. [Google Scholar]
  20. Kim, S.; Kondo, K.; Otsuki, Y.; Haruta, K. A New On-Board PN Analyzer for Monitoring the Real-Driving Condition; SAE Technical Paper, 2017-01-1001; Society of Automotive Engineers, Inc.: Detroit, MI, USA, 2007. [Google Scholar]
  21. Cao, T.; Durbin, T.; Cocker, D., III; Wanker, R.; Schimpl, T.; Pointner, V.; Oberguggenberger, K.; Johnson, K. A comprehensive evaluation of a gaseous portable emissions measurement system with a mobile laboratory. Emiss. Control Sci. Technol. 2016, 2, 173–180. [Google Scholar] [CrossRef]
  22. Giechaskiel, B.; Riccobono, F.; Bonnel, P. Feasibility Study on the Extension of the Real Driving Emissions (RDE) Procedure to Particle Number (PN): Experimental Evaluation of Portable Emission Measurement Systems (PEMS) with Diffusion Chargers (DCs) to Measure Particle Number (PN) Concentration Chassis Dynamometer Evaluation of Portable Emission Measurement Systems (PEMS) to Measure Particle Number (PN) Concentration: Phase II; JRC report EUR 27451 EN; Publication Office for the European Union: Luxembourg, 2015. [Google Scholar]
  23. ISO 5725–2:1994. Accuracy (Trueness and Precision) of Measurement Methods and Results—Part 2: Basic Method for the Determination of Repeatability and Reproducibility of a Standard Measurement Method; International Organization for Standardization: Geneva, Switzerland, 1994. [Google Scholar]
  24. Joumard, R.; Laurikko, J.; Han, T.; Geivanidis, S.; Samaras, Z.; Merétei, T.; Devaux, P.; André, J.; Cornelis, E.; Lacour, S.; et al. Accuracy of exhaust emission factor measurements on chassis dynamometer. J. Air Waste Manag. Assoc. 2009, 59, 695–703. [Google Scholar] [CrossRef] [PubMed]
  25. Cappiello, A.; Chabini, I.; Nam, E.; Luè, A.; Abou Zeid, M. A statistical model of vehicle emissions and fuel consumption. In Proceedings of the IEEE 5th International Conference on Intelligent Transportation Systems, Singapore, 3–6 September 2002; pp. 801–809. [Google Scholar] [CrossRef]
  26. Varella, R.; Giechaskiel, B.; Sousa, L.; Duarte, G. Comparison of portable emissions measurement systems (PEMS) with laboratory grade equipment. Appl. Sci. 2018, 8, 1633. [Google Scholar] [CrossRef]
  27. Giechaskiel, B.; Schwelberger, M.; Delacroix, C.; Marchetti, M.; Feijen, M.; Prieger, K.; Andersson, S.; Karlsson, H. Experimental assessment of solid particle number portable emissions measurement systems (PEMS) for heavy-duty vehicles applications. J. Aerosol Sci. 2018, 123, 161–170. [Google Scholar] [CrossRef]
Figure 1. Mean emissions from all laboratories with different equipment: Bags (eight laboratories), Golden Portable Emissions Measurement Systems (PEMS) (seven laboratories, one instrument), Lab PEMS (five laboratories, five instruments). Upper panel shows gaseous pollutants. The lower panel shows particle number and mean exhaust flow rate (EFR). Error bars show one standard deviation.
Applsci 08 02275 g001
Figure 2. Mean differences of PEMS (Golden PEMS: one instrument, Lab PEMS: five instruments) from bag (tunnel) results for the World harmonized Light-duty Test Cycle (WLTC). Dashed lines show relative permissible tolerances. Solid lines show absolute permissible tolerances [16,17]. Error bars show one standard deviation.
Applsci 08 02275 g002
Figure 3. Mean differences of lab PEMS from Golden PEMS for the WLTC (five labs) and RDE cycle (two labs). Although not applicable, dashed lines show relative permissible tolerances and solid lines show absolute permissible tolerances [16,17]. Error bars show one standard deviation. Dotted lines with asterisk (*) show CO2 differences excluding one laboratory.
Applsci 08 02275 g003
Table 1. Test protocol in chronological order. Golden Portable Emissions Measurement Systems (PEMS) is the OBS-ONE (2 inches) (Horiba, Kyoto, Japan). The number in brackets indicates the exhaust flow meter diameter. All laboratories repeated 3 times the World harmonized Light-duty Test Cycle (WLTC), except E (2 repetitions). RDE means that a Real-Driving Emissions cycle was additionally conducted in the laboratory. MOVE is the PEMS from AVL (Graz, Austria).
LaboratoryGolden PEMSLaboratory PEMSComment
AYesAVL MOVE (2 inches)RDE
BNoAVL MOVE (2 inches)
CYesHoriba OBS-ONE (2 inches)RDE
DYesNo
EYesAVL MOVE (2.5 inches)
FYesNo
GYesNo
HYesAVL MOVE (2.5 inches)
8 Labs7 Labs5 Labs2 Labs
Table 2. Bag CO2 [g/km] mean emissions, repeatability and reproducibility of the inter-laboratory exercise for different combinations of laboratories.
13 Labs
(No PEMS)
8 Labs
(No PEMS)
8 Labs
(with PEMS)
5 Labs
(No PEMS)
Laboratories13885
Mean value [g/km]149.2149.6150.6149.1
Reproducibility2.3%2.1%2.9%2.1%
Repeatability1.7%0.8%1.6%1.1%
Table 3. Reproducibility levels (%) from inter-laboratory exercises with gasoline vehicles. In italics values based on PEMS.
Emission LevelCO2CONOxPNComments
Euro 3 11.8724304 labs, NEDC [11]
Euro 4 1,22.0518444 labs, NEDC [12]
Euro 35.04040-9 labs, many cycles [24]
Euro 61.61529911 EU labs, WLTC [15]
Euro 6 eq.1.31224-16 Asian labs, WLTC [15]
Euro 5 32.1-37227 labs, WLTC [14]
2.4-36207 labs, 1 Golden PEMS
Euro 62.92223298 labs, WLTC, this study
3.92525247 labs, 1 Golden PEMS
5.52031395 labs, 5 Lab PEMS
1 Results of original studies divided by the coverage factor 1.96 to make them comparable with the rest studies of this table. 2 Estimated from graphs. 3 Based on standard deviation and not proper statistical analysis.
Table 4. Mean differences of PEMS from bags from inter-laboratory exercises with gasoline vehicles. In brackets the relative standard error (Coefficient of Variation), i.e., the standard deviation of the differences divided to the mean difference.
Emission LevelCO2CONOxPNComments
Euro 5+7.1% (3.6%)-+1.5% (15%)+6% (20%)1 Golden PEMS [14]
Euro 6−1.0% (4.0%)−0.7 (14%)+2.0% (9%)+36% (32%)1 Golden PEMS
+0.9% (3.4%)+1.5% (13%)+11.3% (18%)+41% (33%)5 Lab PEMS

