Article

Internal Mechanism and Improvement Criteria for the Runaway Oscillation Stability of a Pump-Turbine

1
Chongqing Southwest Water Transport Engineering Research Institute, Chongqing Jiaotong University, Chongqing 400016, China
2
China Ship Development and Design Center, Wuhan 430064, China
3
State Key Laboratory of Water Resources and Hydropower Engineering Science, Wuhan University, Wuhan 430072, China
*
Author to whom correspondence should be addressed.
Appl. Sci. 2018, 8(11), 2193; https://doi.org/10.3390/app8112193
Submission received: 3 October 2018 / Revised: 31 October 2018 / Accepted: 5 November 2018 / Published: 8 November 2018
(This article belongs to the Special Issue Pumped-Storage Hydropower Plants)

Abstract

:
The runaway oscillation process of the pump-turbine in a high head pumped-storage power plant is usually unstable. The root cause of its instability is still unclear. In this paper, its internal mechanism and the improvement method were studied in depth. First, the flow characteristics in a model pump-turbine during the runaway process at four guide-vane openings (GVOs) were investigated by 3D transient numerical simulations. Then, the energy dissipation characteristics of different types of backflow vortex structures (BFVSs) occurring at the runner inlet and their impacts on the runaway stability were investigated by the entropy production theory. The results show that the location change of BFVSs between the hub side and the mid-span of the runner inlet around the no-load point leads to the sharp change in the energy dissipation rate, which makes the slope of dynamic trajectory positive and the runaway oscillation self-excited. If the occurrence of BFVSs at the hub side is suspended, the runaway process will be damped. Finally, the pump-turbine runner was improved to obtain a wider stable operating range.

1. Introduction

In recent decades, energy consumption has been increasing dramatically worldwide, while the excess use of fossil energy sources (especially oil, coal, and gas) leads to serious problems of climate change [1]. The human energy structure should be urgently improved, and the renewable energy must be more widely implemented to help maintain sustainable growth [2]. Over the last few decades, renewable energy sources from hydro, solar, wind, wave, tidal, and biomass have shown greater interest worldwide due to their availability, eco-friendliness, and ease in harnessing to fulfill the need of mankind [3]. Usually, the renewable energy sources such as wind, solar, wave, tidal, and biomass are intermittent in nature and hence lack in producing continuous and name plate capacities. The unpredictability of their power generation has an adverse effect on the power production, which will lead load and frequency fluctuations of power grids [4]. Hence, suitable energy storages in bulk are required. Until now, pumped hydroelectric energy storage is the only proven large-scale energy storage scheme for power system operation. Pumped-storage power plants (PSPPs) can store energy and generate power according to the load fluctuations flexibly [1].
Pump-turbine is the heart of any PSPP, and it is the part responsible for the plant overall efficiency and its operational characteristics. The penetration of large amounts of intermittent energy to the power grid makes the pump-turbine frequently undergo transient operations, which has caused a series of severe stability problems [5]. In general, when the grid parameters fluctuate beyond a manageable limit, the generator of pump-turbine automatically disconnects from the power grids, resulting in load rejections [6]. If the servomotor fails to close the guide vane momentarily, the units set into runaway processes. However, the S-shaped characteristics of pump-turbine often lead to self-excited oscillations in the runaway process [7]. As a result, the fluctuations of operating parameters, such as pressure, torque, and rotational speed, cannot be converged to constants like normal Francis turbines and will lead to drastic increases in vibrations, a reduction of runner life, and even breakdown of the rotor [8,9,10]. Therefore, the unstable oscillation problem of pump-turbine during the runaway process needs to be solved.
Generally, the oscillation stability of a pump-turbine during runaway processes is associated with many parameters of the hydraulic system, such as rotational inertia, water elasticity, and friction loss in the pipe system; however, the slope of the characteristic curve at the runaway point is the most important influence factor [11]. Various one-dimensional mathematical models based on the static characteristic curves of model pump-turbines have been developed to study the dynamic stability mechanism and the influences of different factors [12,13,14,15]. Some methods, such as partly closing the main inlet valve [16] and misaligning guide-vane openings [17,18], have been proposed to stabilize runaway processes. However, these methods are not solutions to the source of the unstable problem. Gentner [19] thought the formation of a fully developed vortex structure at the runner inlet should be avoided for a stable characteristic and found that the shape of the runner leading edge influences the formation of the fully developed vortex structure. Zeng [20] reported that two pump-turbines (BQ and XJ) share the same specific speed and nearly have the same parameters of turbines except the shape of the runner leading edge (see Figure 1), but they have distinctive differences in the runaway oscillation process. The oscillation process for the BQ pump-turbine is self-excited, while that for the XJ pump-turbine is damped. It can be reasoned that the characteristics of transient flows within the two pump-turbines may be different, and the evolution of transient flows in XJ pump-turbine is conducive to the stability of runaway oscillation. In addition, the shape of the runner blade leading edge has a significant influence on their evolution, which cannot be explained by the aforementioned one-dimensional models. Many studies have shown that various flow patterns, such as flow separations, backflows, rotating stall, and vortex ropes, will be formed and developed in the flow passages when the pump-turbine operates at the runaway process [21,22,23,24,25]. Nevertheless, finding the key flow patterns responsible for the runaway oscillation stability and revealing their influence mechanism on the stability are the prerequisites for solving the problem at its source.
The purpose of this paper is to study the influence mechanism of transient flow patterns on the runaway oscillation stability of pump-turbines. First, 3D numerical simulations were performed to investigate the characteristics of transient flow patterns in a model pump-turbine during the runaway process for four different GVOs. The influence mechanism of different types of flow patterns on the runaway stability is clarified. The runner was improved to obtain a more stable runaway process, and a design criteria to extend the stable operating range of runaway process is proposed.

2. Numerical Models and Schemes

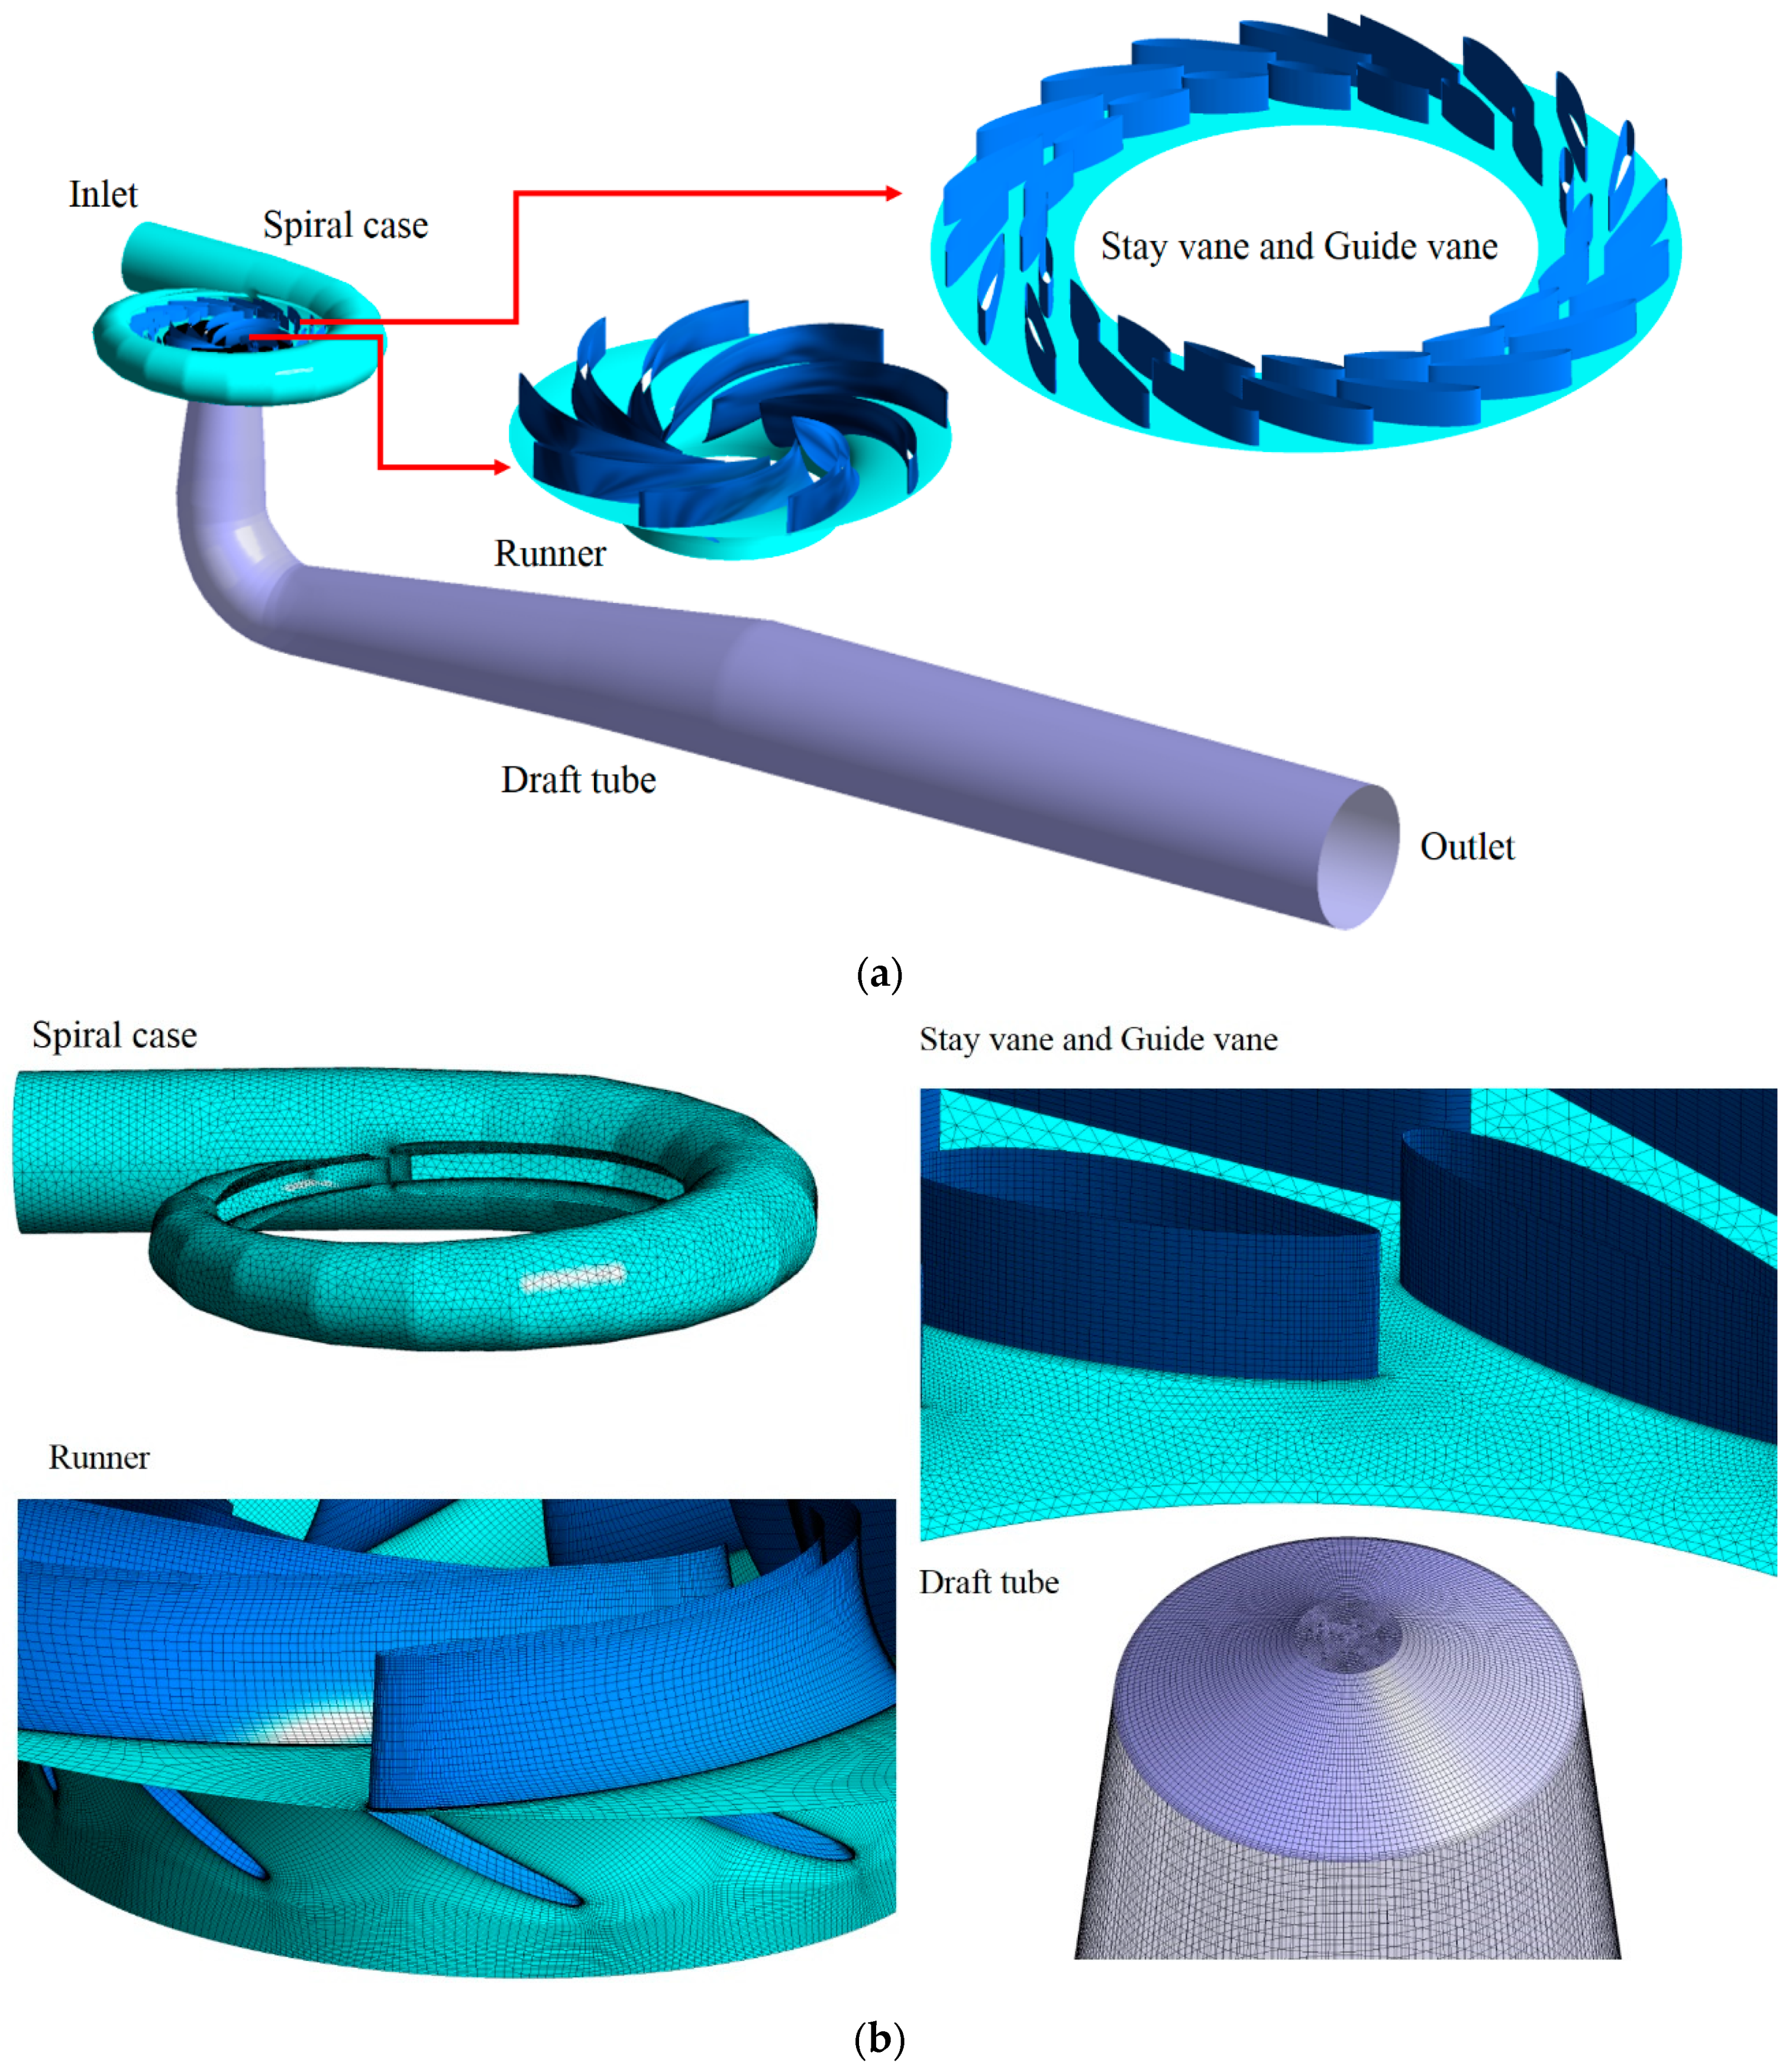
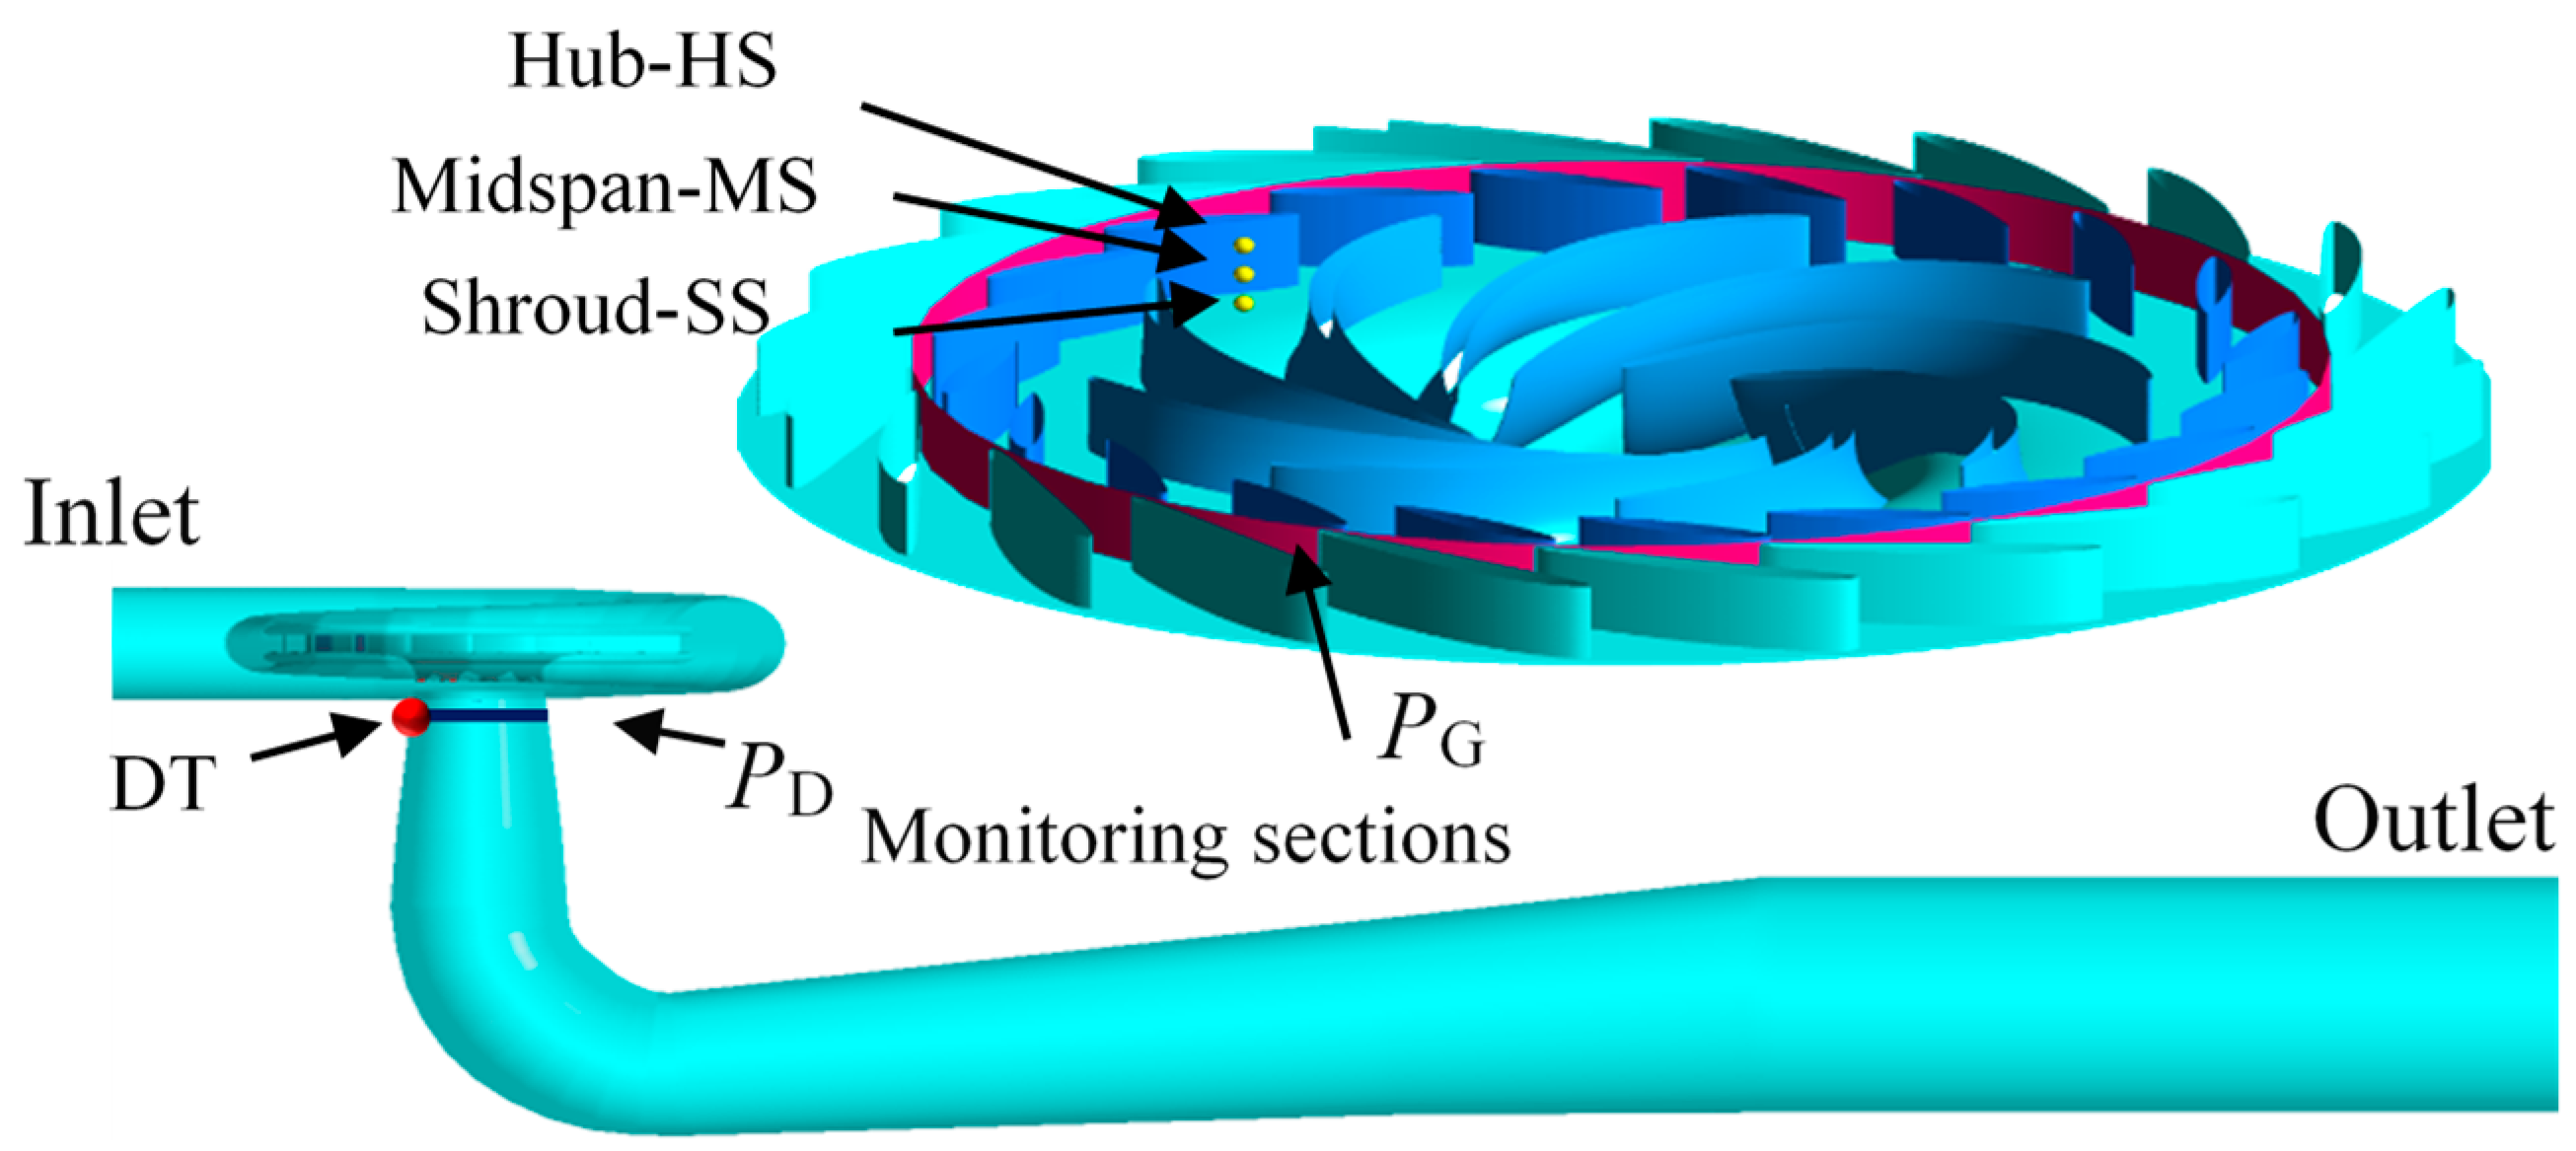
2.1. Pump-Turbine Model

A low-specific-speed model pump-turbine was investigated. Table 1 reports the main geometrical data of the considered pump-turbine. Martin [26,27] has deduced the runaway stability criterion of pump-turbines at constant guide-vane openings and proved that the runaway stability depends on the slopes of the characteristic curves at the no-load point and the time scales of the hydraulic system. However, the length of the pipeline is a minor factor. To reduce the impacts of the hydraulic system and highlight the influence of transient flow in the pump-turbine on the runaway oscillation stability, the computational domains only include the flow passages from the spiral-case to the extension part of draft-tube (Figure 2a), which is like a short tube model.
Hybrid meshes were constructed for different domains by the ANSYS ICEM 14.0 software. Tetrahedral meshes were used in the spiral-case; wedge meshes were employed in the guide-vanes; structured hexahedral meshes were applied in the runner and draft-tube (Figure 2b). Mesh independence checks for different GVO conditions have been conducted in our previous works [23,24]. When the number of gird elements is more than 4.0 million, the relative error of macro parameters among each mesh generation was less than 0.3%, indicating that the numerical simulation results are reasonable. Considering the numerical accuracy and time cost, the total number of mesh elements was capped at 9.0 million. Finally, the total numbers of mesh elements for the four GVO conditions are 7.86 million, 7.78 million, 8.22 million, and 7.75 million. The simulated static performance curves in S-shaped region were compared with the results of a model test, and a good agreement was obtained [23]. The final mesh specifications are summarized in Table 2.

2.2. Turbulence Model and Boundary Conditions

The change in flow structures in the pump-turbine during runaway process is very complicated, and strong shear flows will occur at the blade-surface boundary layer by the large attack angle. The SAS-SST (Scale Adaptive Simulation-Shear Stress Transport) model was adopted to resolve various vortices on a different scale. It is a hybrid turbulence model, and it introduces the von Karman length-scale in the transport equation of the turbulence eddy frequency. The information provided by the von Karman length-scale allows the SAS-SST model to dynamically adjust to the resolved structures in the unsteady Reynolds Averaged Navier-Stokes (URANS) simulation. Therefore, the SAS-SST turbulence model could provide better solutions for the off-design condition due to involving various scale vortices [28,29].
The boundary conditions were defined as follows: constant total pressure was defined at the spiral-case inlet; constant static pressure 0 Pa was applied at the outlet of draft-tube extension part; no-slip wall condition was used for all the walls. The total pressure at the spiral-case inlet is different for the four operating conditions. The smaller the value of the GVOs, the larger the total pressure at the spiral-case inlet. The pressure setting in the CFD simulation is only to obtain a better initial flow fields at each GVO.

2.3. Control Method of Varying Angular Speed

During the runaway process, the rotational speed of the pump-turbine runner fluctuates for acceleration and deceleration. The change in rotational speed is obtained by the hydraulic force coupling method and uses the angular momentum equation to relate rotational speed variation with the torque exerted on the turbine runner. The process can be described as
d n d t = 30 π T J
where J is the total rotational inertia of rotating systems, T is the hydraulic torque acting on the runner, and t is the time.
Using an Euler approximation, the runner rotational speed can be calculated as follows:
n i + 1 = n i + 30 π T J ( t i + 1 t i ) .
During transient simulations, the torque on the runner blades were extracted from the CFD solver by a user defined function (UDF) at every time-step. Given the results at the ith time step, the rotation speed at the (i + 1)th time step n i + 1 can be obtained from Equation (2). Thus, the rotational speed was updated at every time-step, and the corresponding flow fields were calculated.

2.4. Time Step and Numerical Scheme

Unsteady numerical simulations were conducted by commercial software ANSYS FLUENT 14.0. During the numerical simulations, the results of steady RANS simulations were used as the initial flow field for the transient simulations. In the steady RANS simulations, the multiple reference frame approach was used for the runner zone; in the transient simulations, a sliding mesh approach was used. The time-step was set to 0.0002 s, corresponding to 1.2° of the runner rotating at initial steady condition. Even at the maximum speed during the runaway process, the rotation angle at every time-step is less than 1.6°. It is small enough to simulate the influence of the rotor stator interaction. The maximum number of iterations per time-step was set to 40, and the residual convergence criterion at each time-step was 1.0 × 10⁻⁵. The SIMPLEC algorithm was chosen to achieve the coupling solution for the velocity and pressure equations. The second order discretization schemes in time and space were used.

3. Results and Analysis

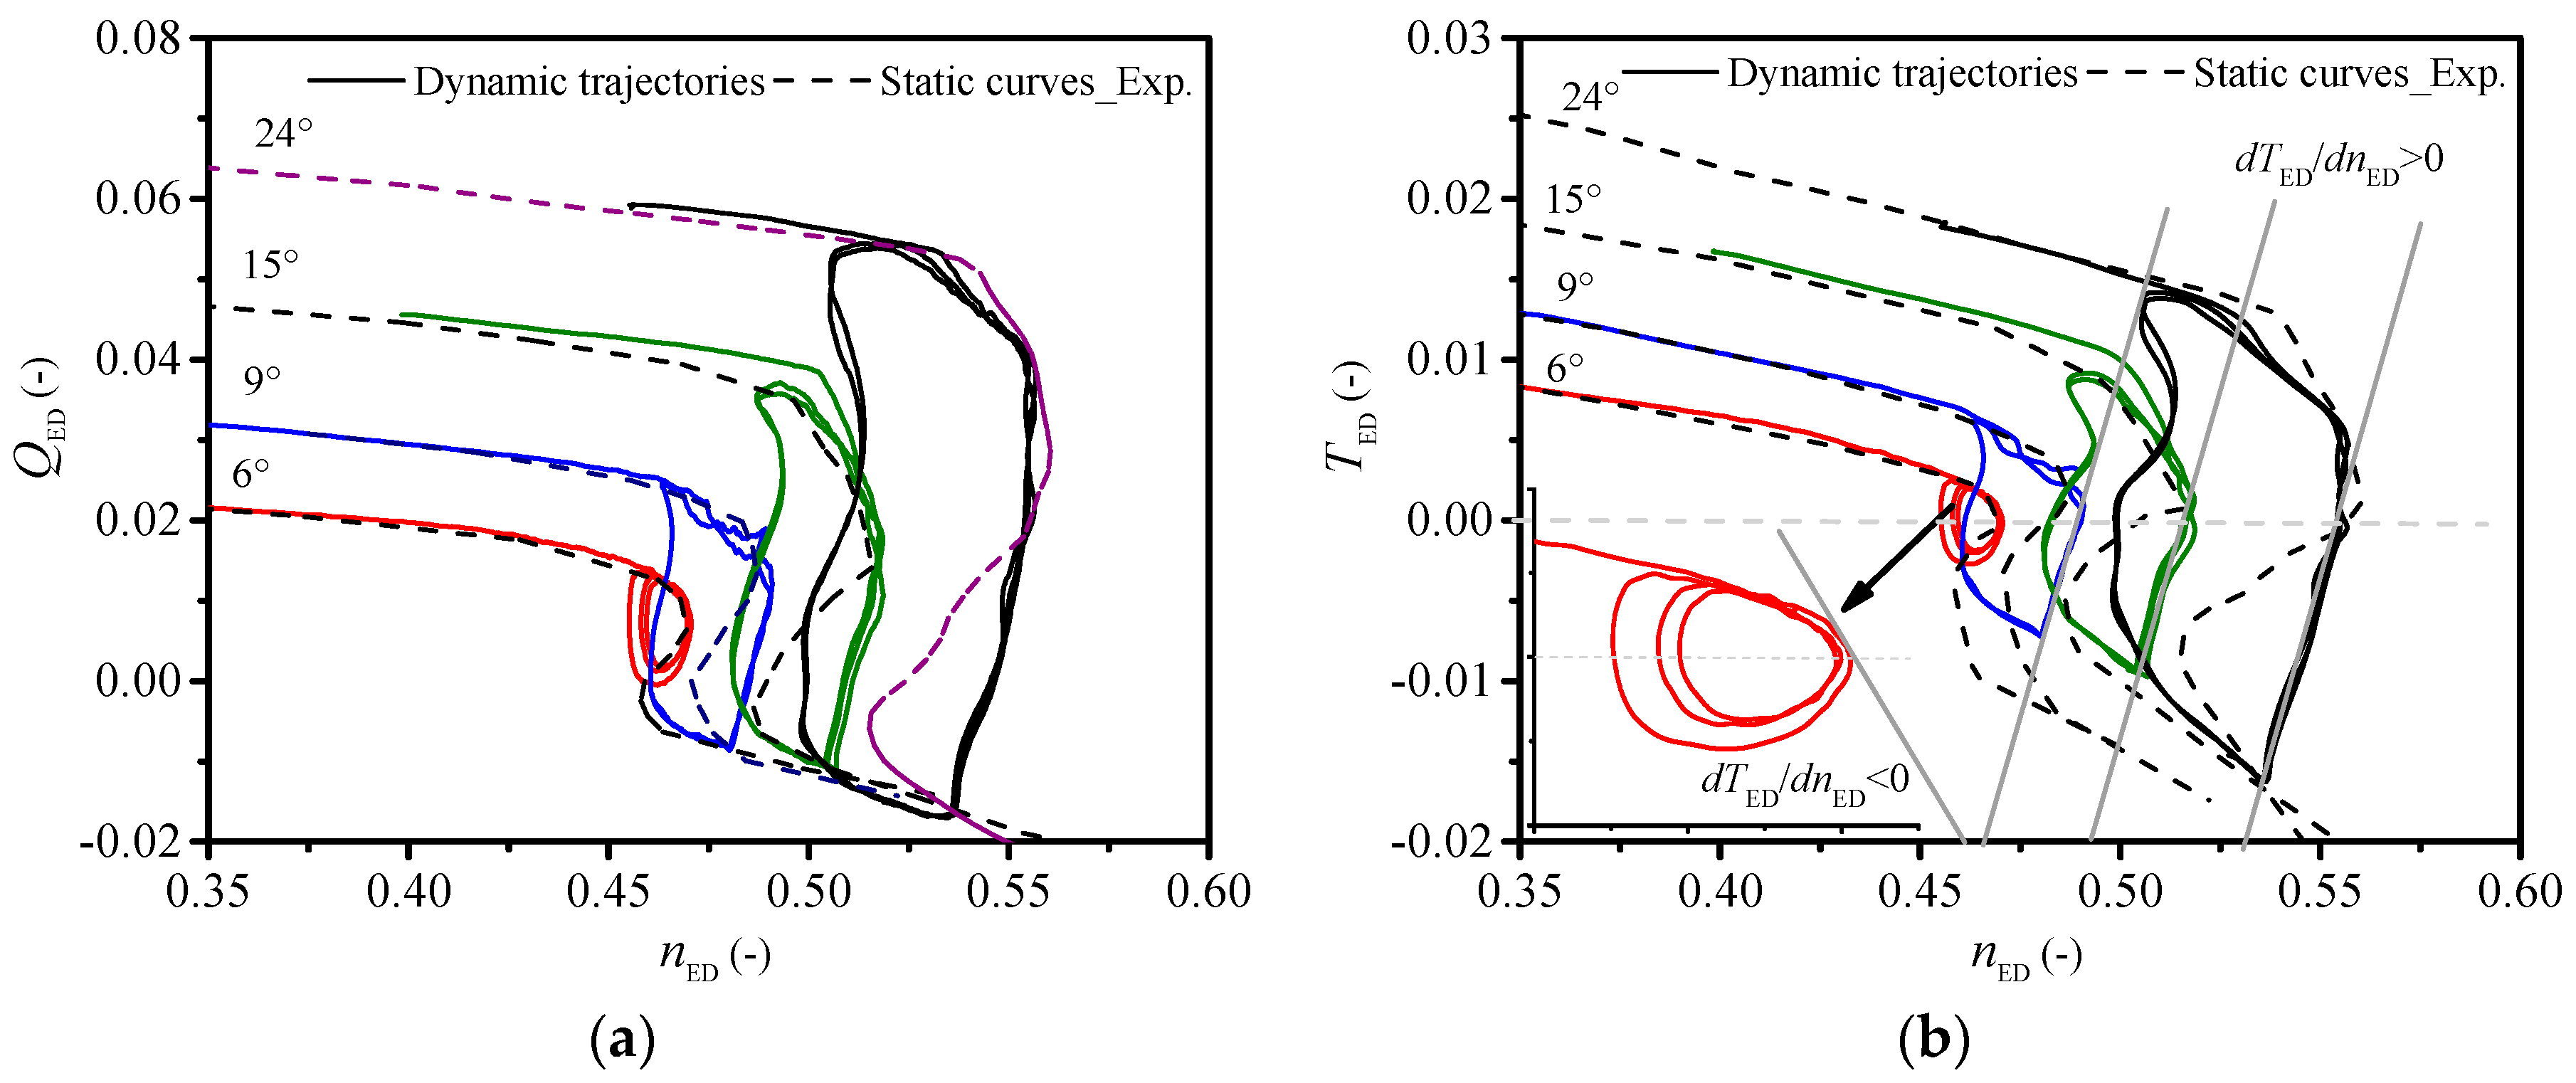
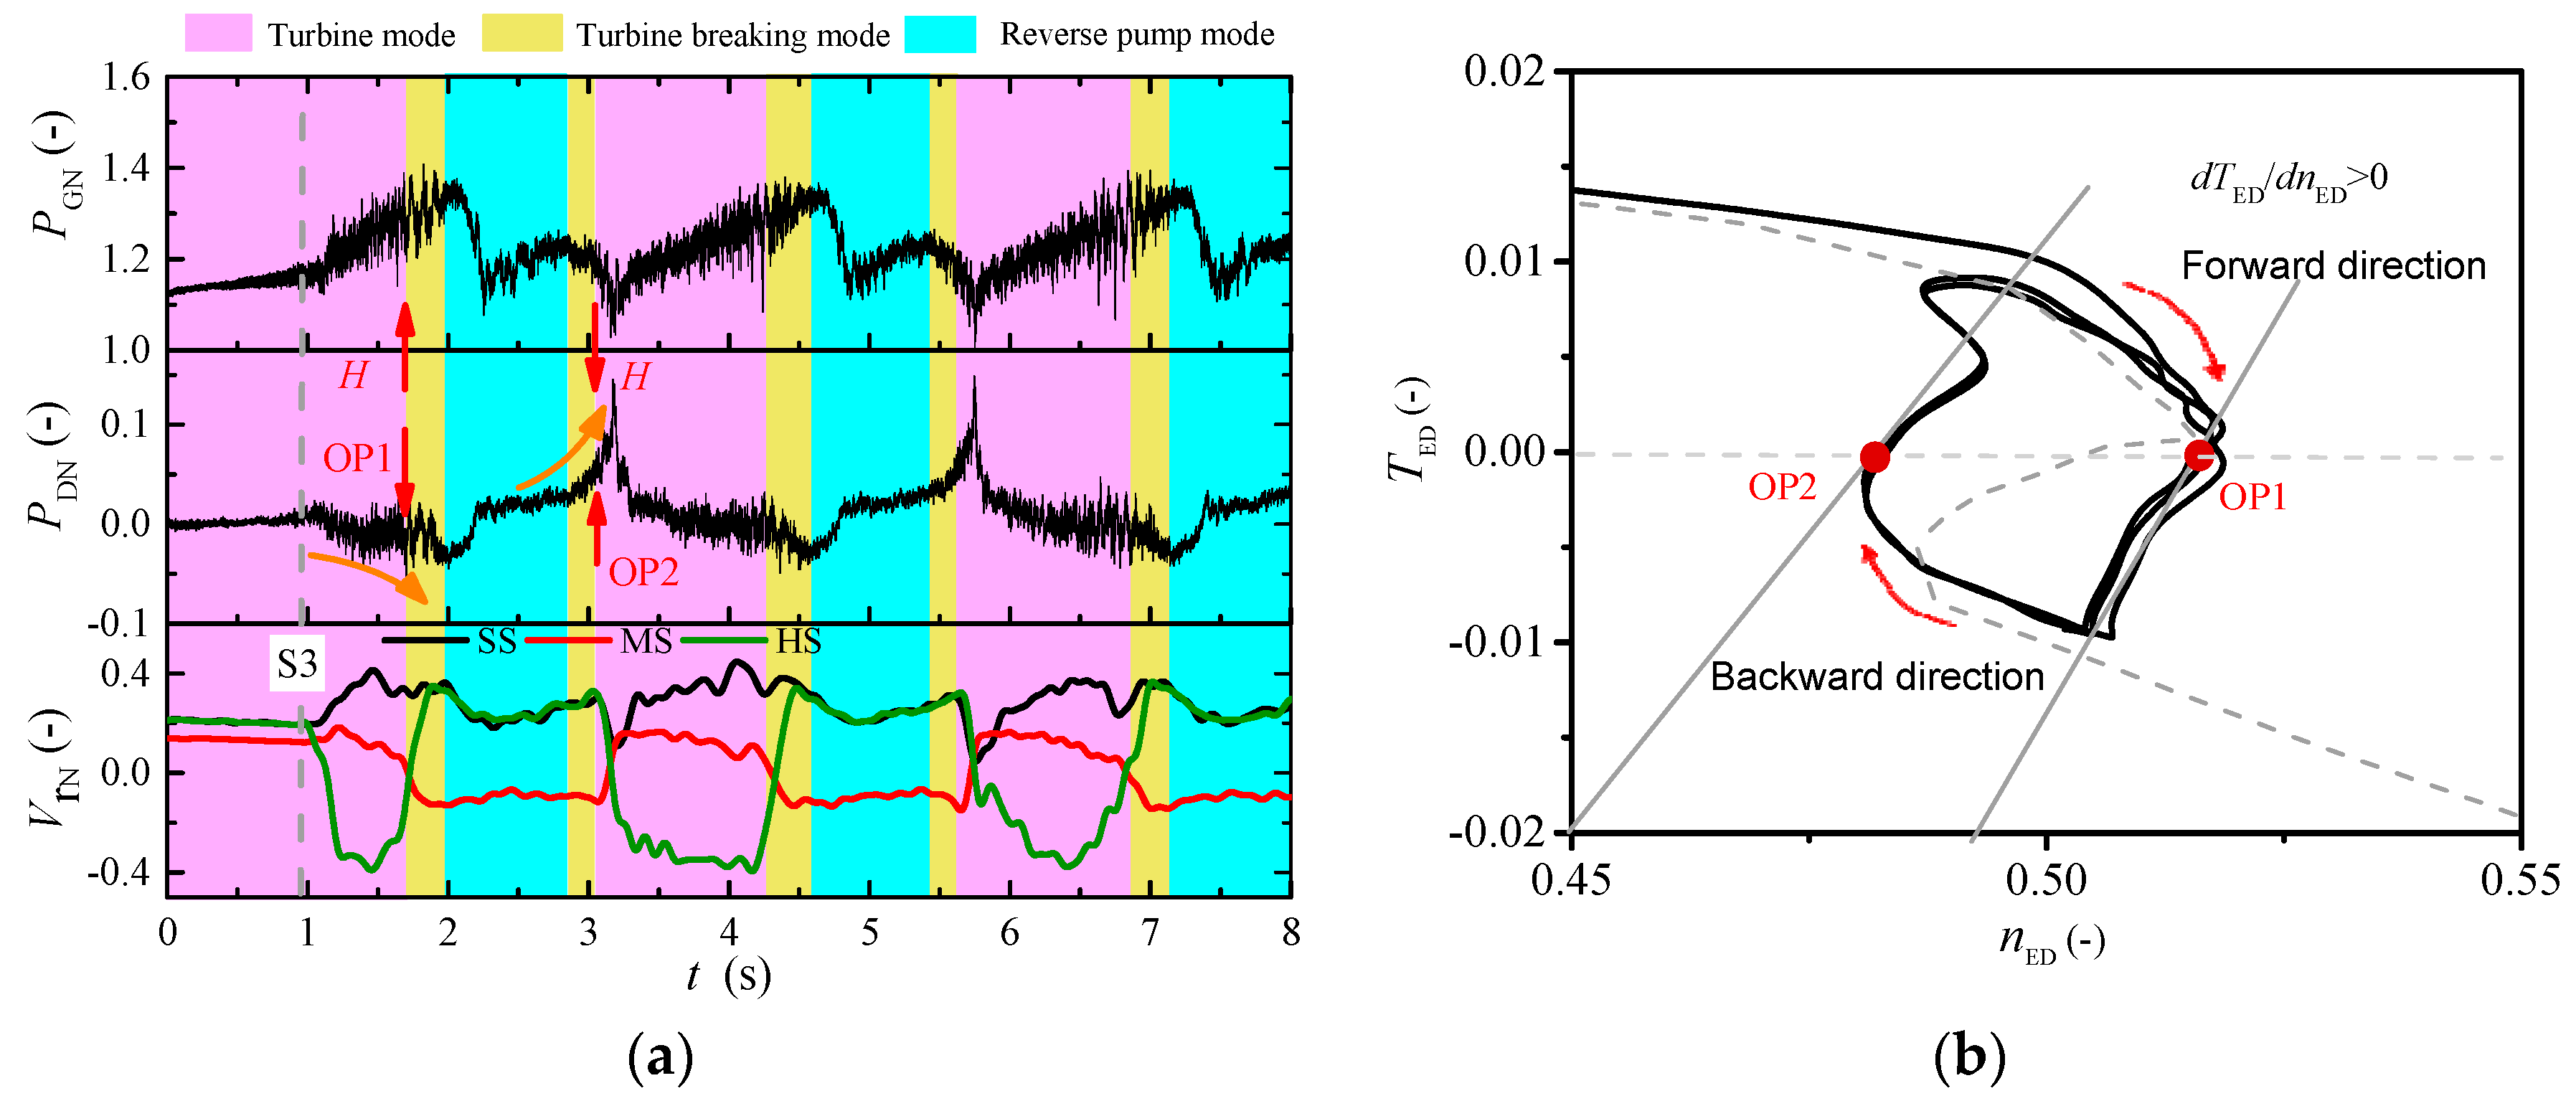
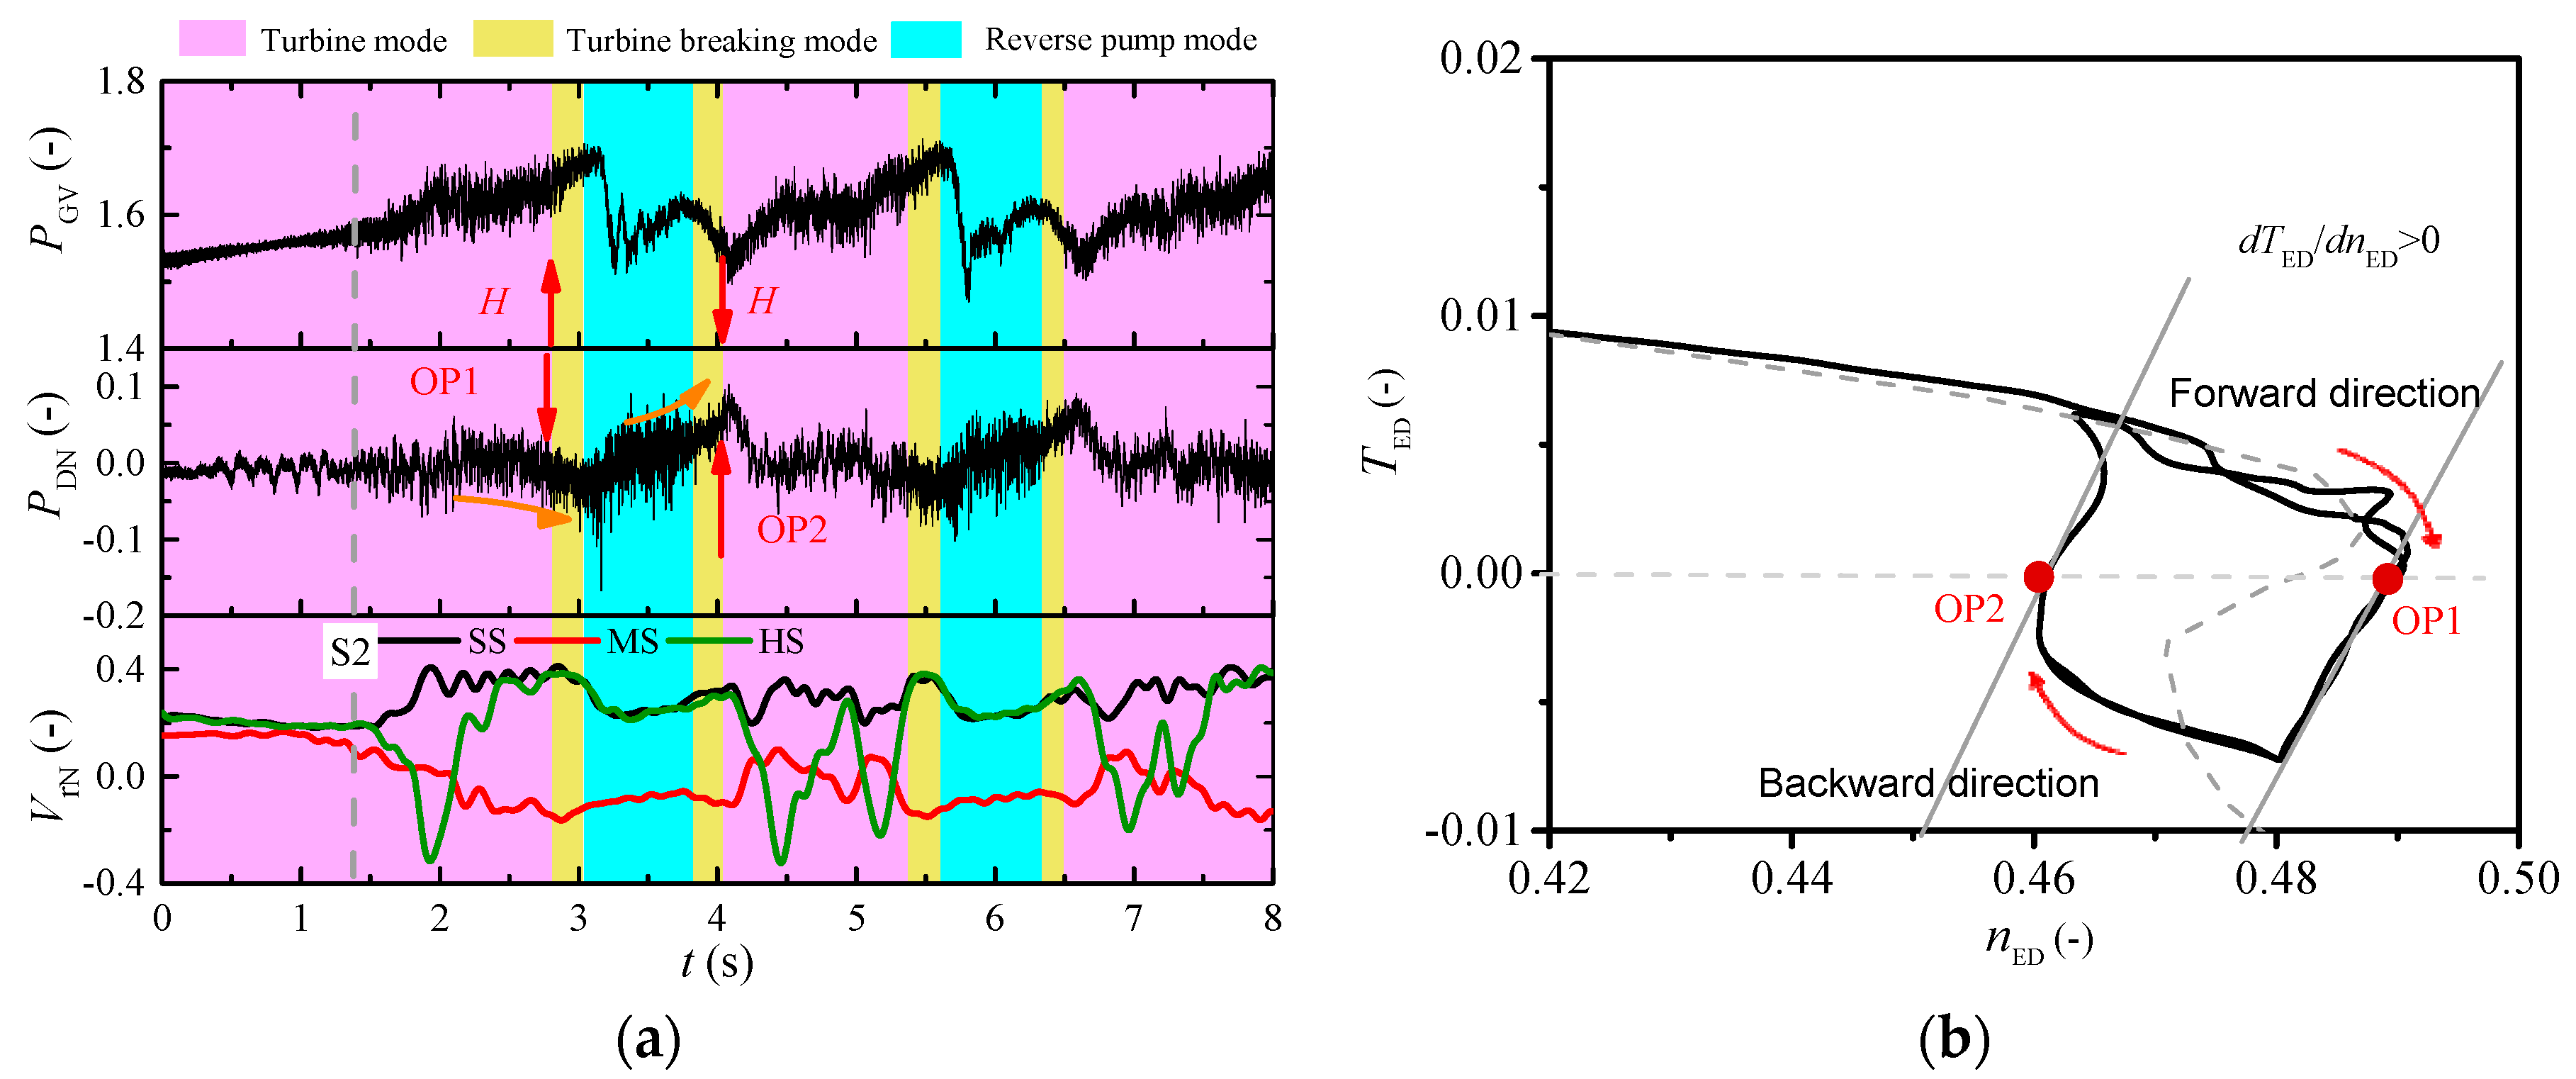
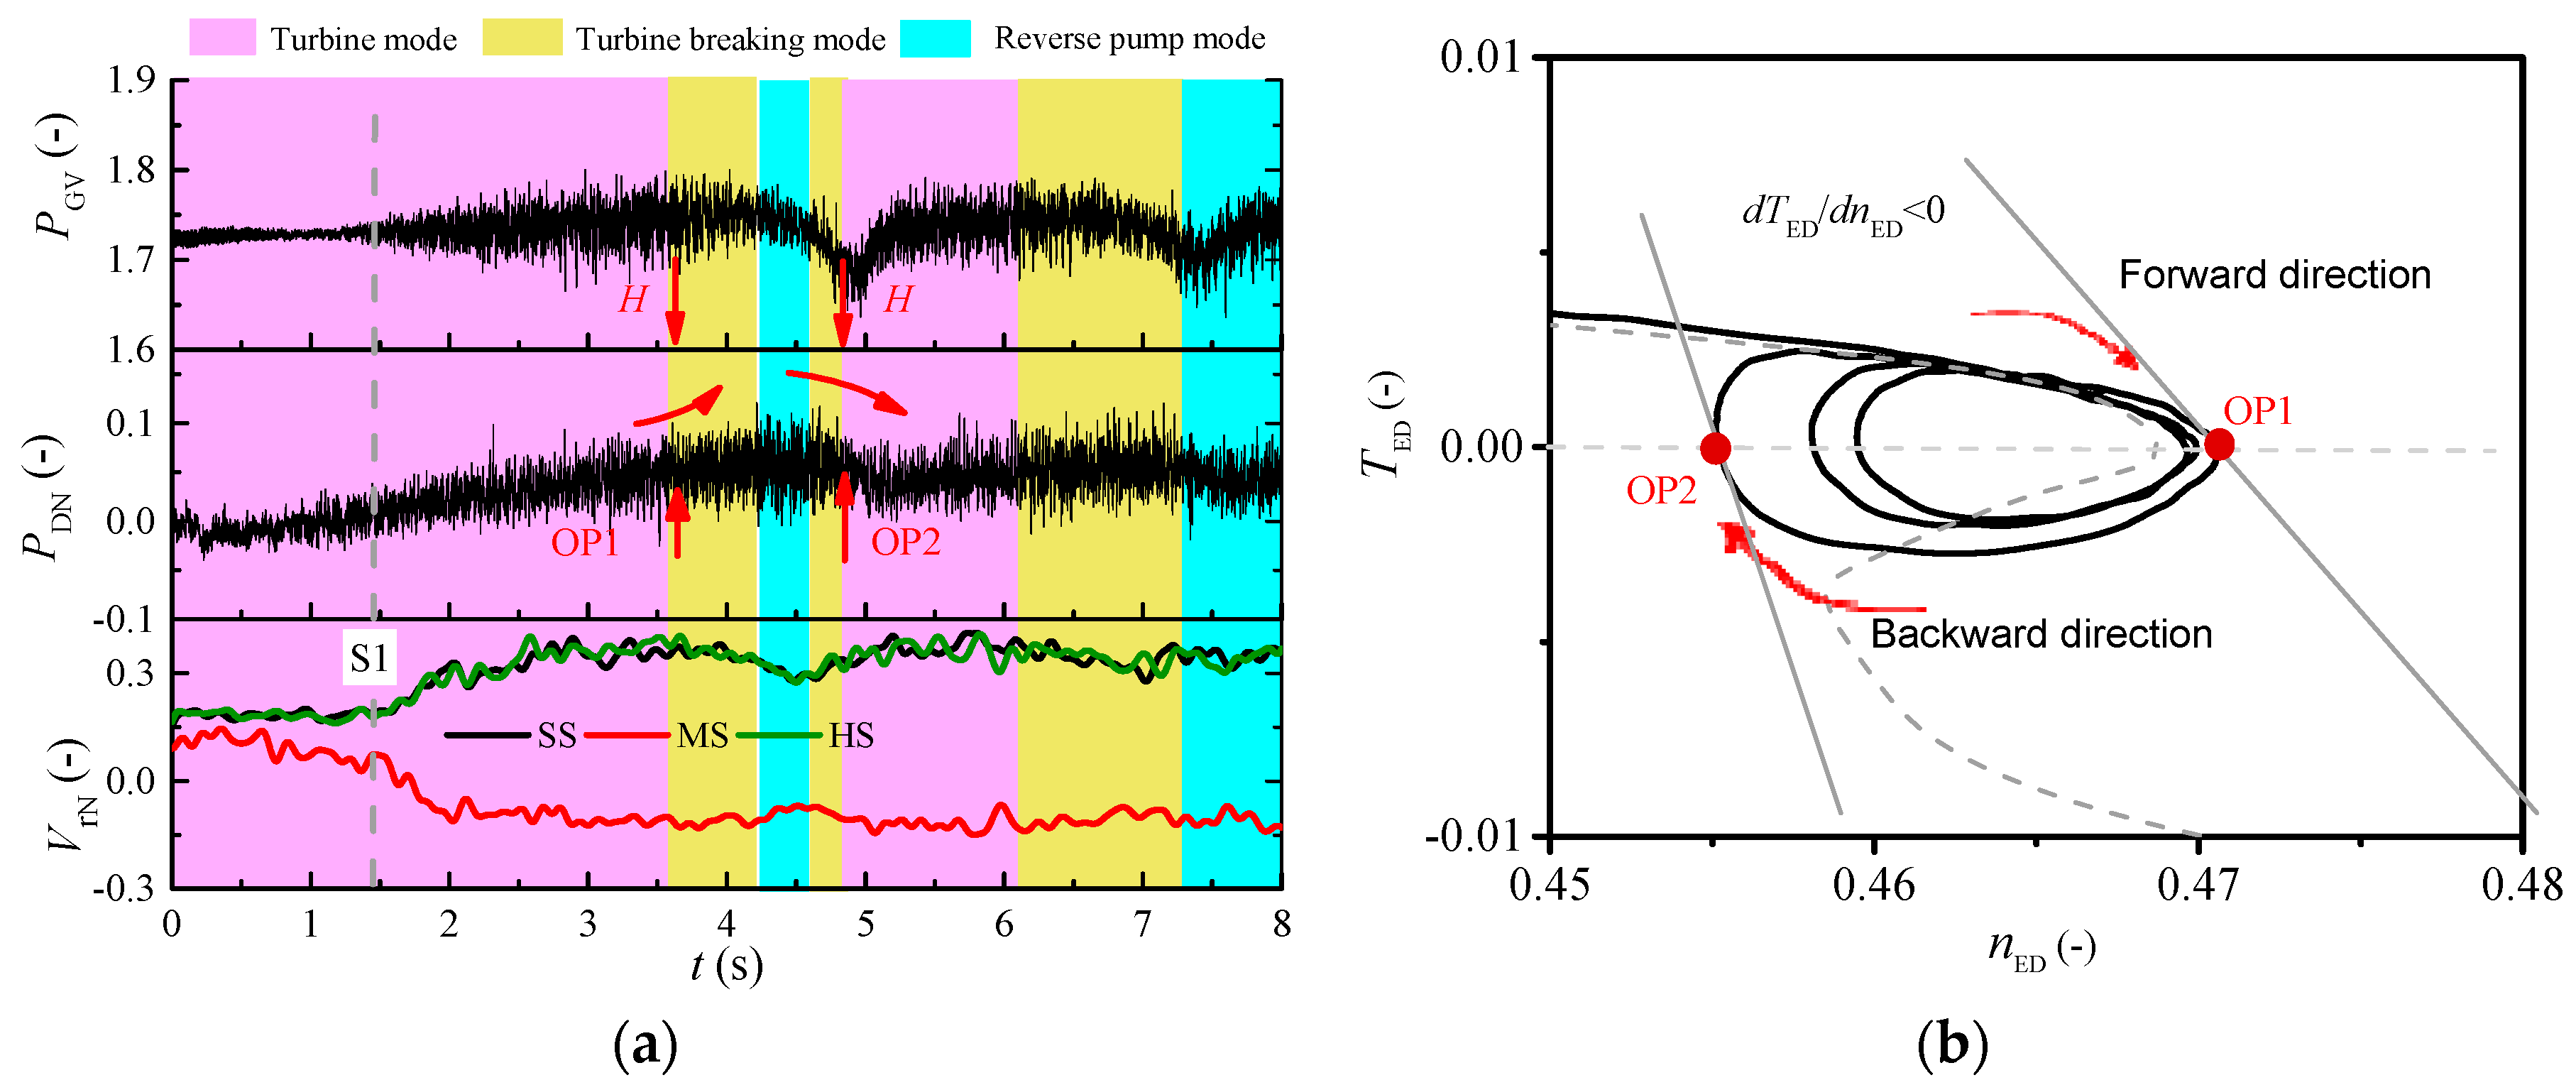
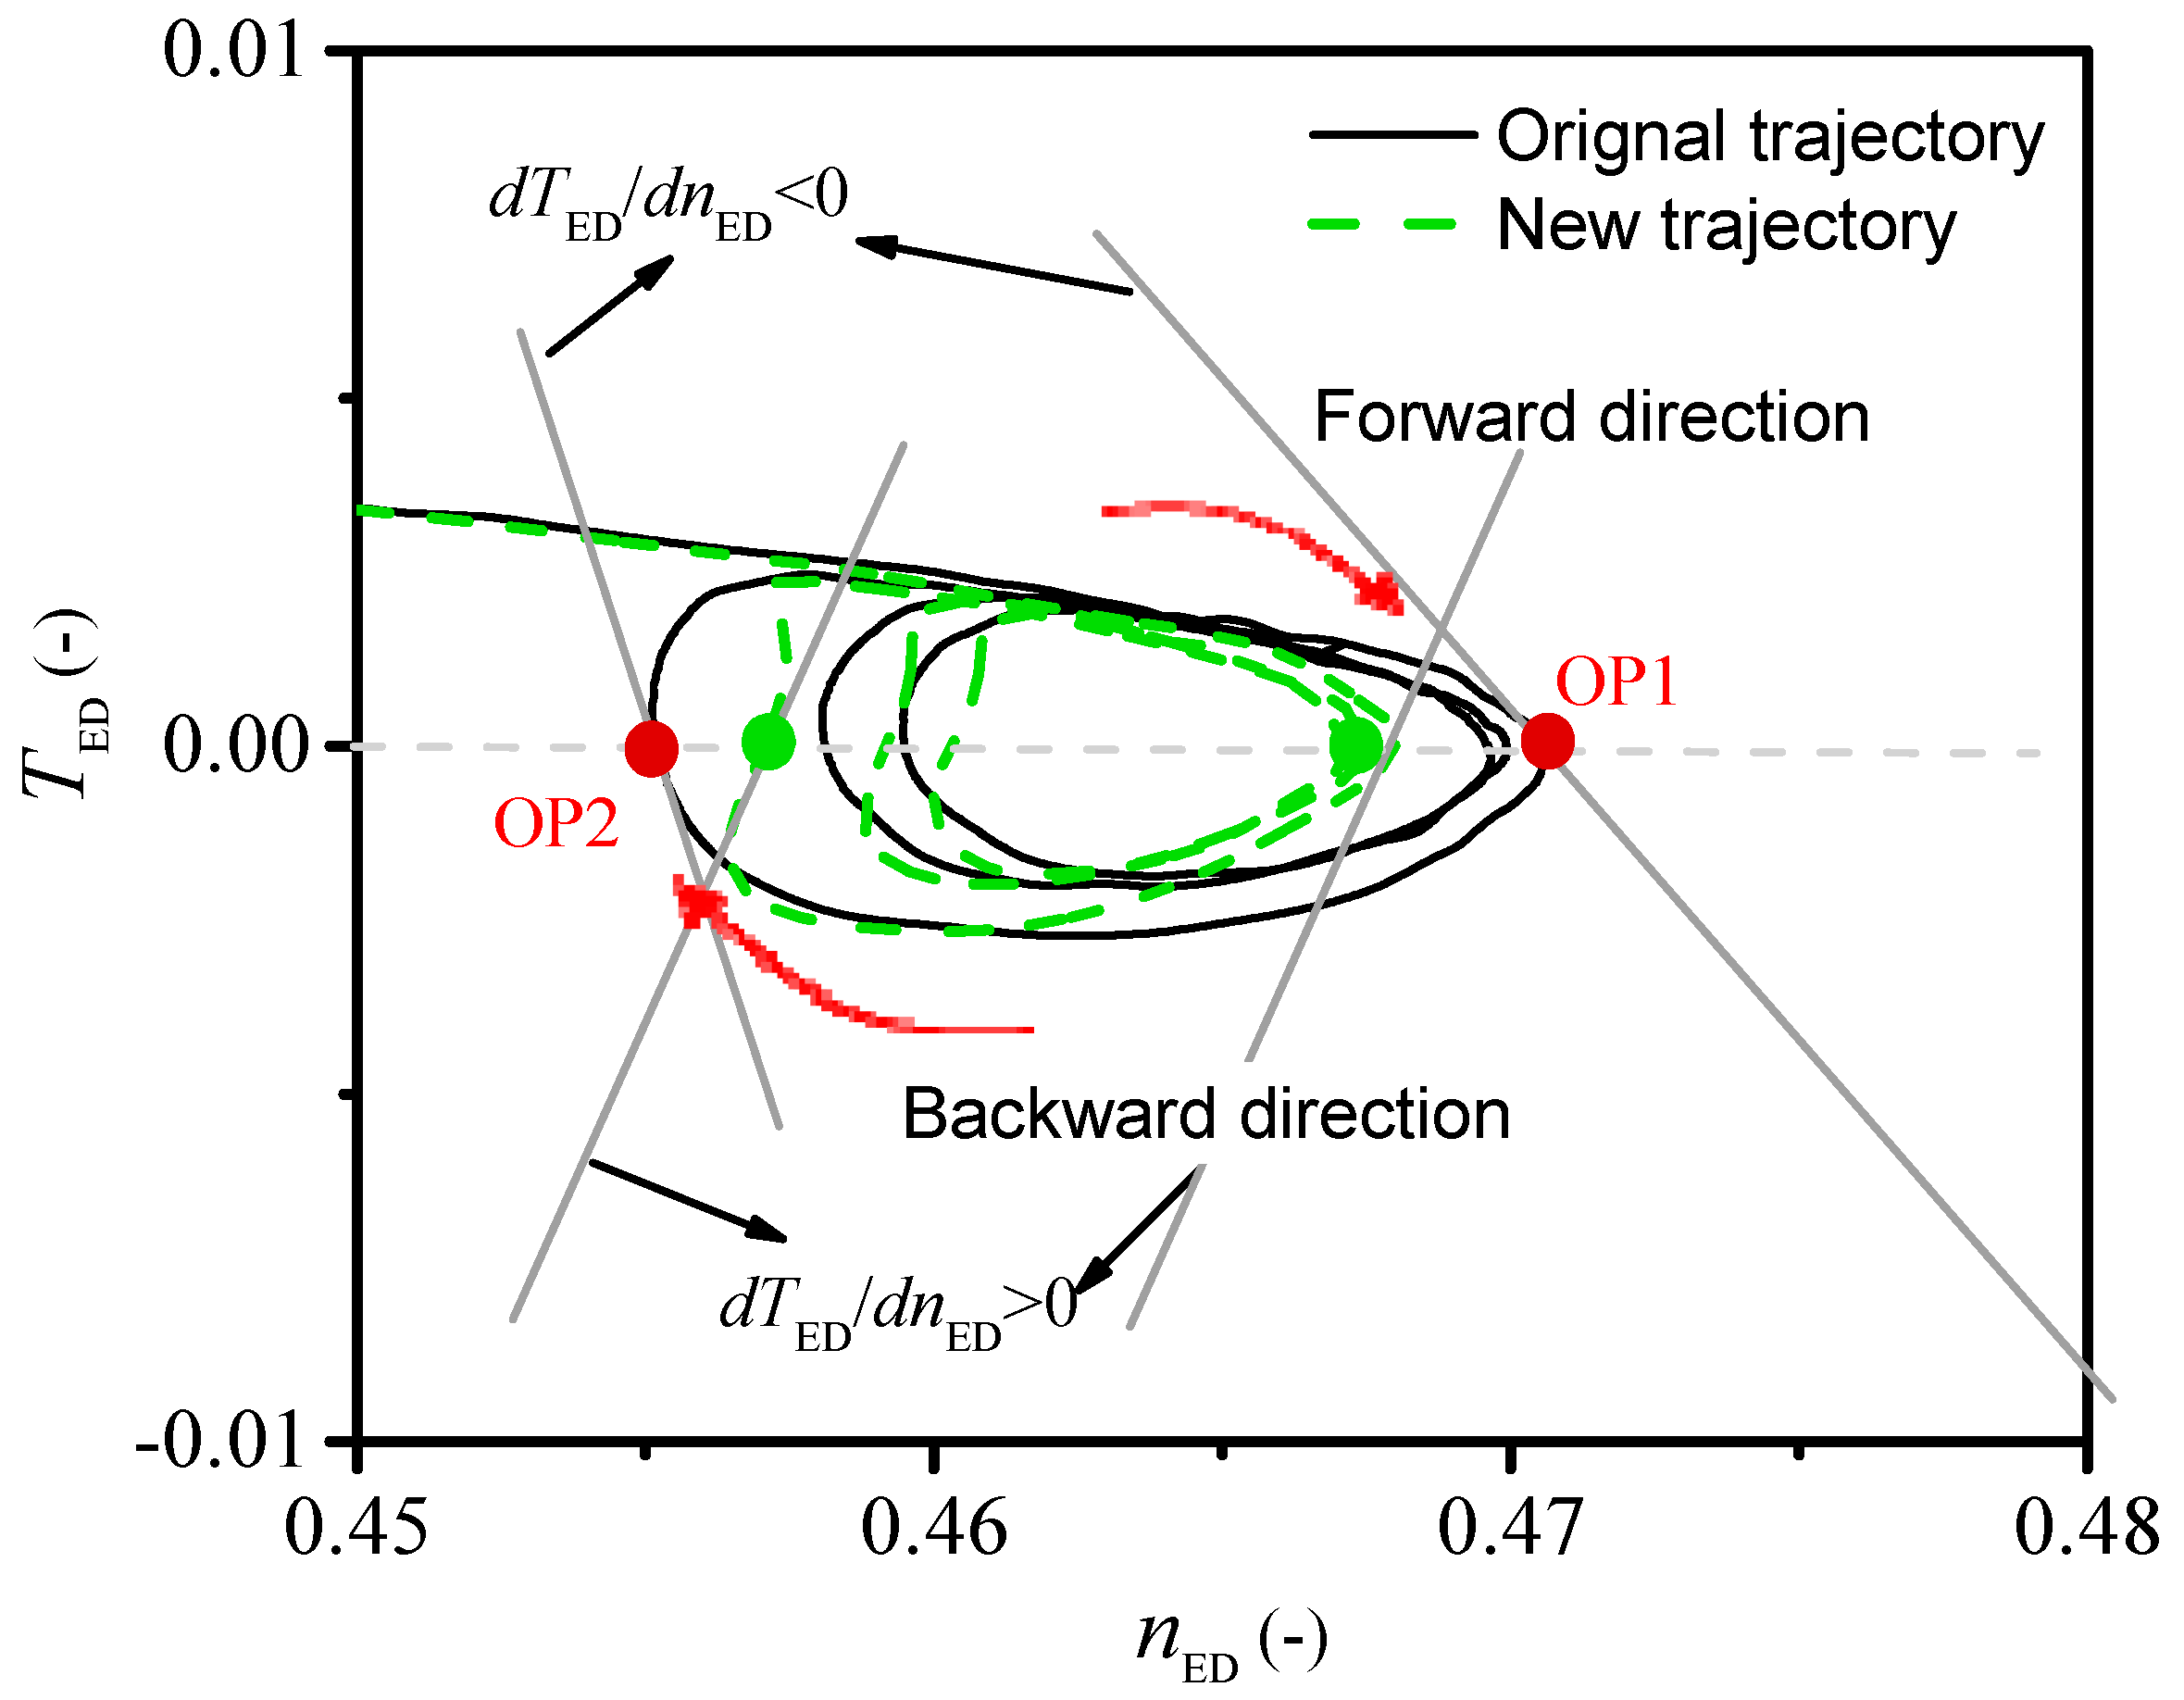
3.1. Dynamic Trajectories at Different GVOs

The runaway processes after load rejections with servo motor failure at four different GVOs of a model pump-turbine were simulated. Figure 3 shows the dynamic trajectories and the static characteristic curves. The speed factor nED, discharge factor QED, and torque factor TED are defined as follows:
n ED = n D 1 / ( 60 g H )
Q ED = Q / ( D 1 2 g H )
T ED = T / ( ρ D 1 3 g H )
where n, Q, T, ρ, g, and H represent the rotating speed, flow rate, torque, water density, gravitational acceleration, and water head, respectively. Here, the water head was defined as the pressure between the spiral case inlet and draft tube inlet.
As can be seen in Figure 3, during the runaway processes, the dynamic trajectories of operating point form loops in the S-shaped region. At the primary stage, the dynamic trajectories of operating parameters are nearly consistent with the measured static characteristic curves, which indicates that the scheme of numerical simulation has certain reliability. The variation tendencies of four loops are different. The pump-turbine experiences a damped oscillation for GVO at 6°, while it undergoes a self-excited oscillation for GVO at 9°, 15°, and 24°. Martin [26,27] has proved that the runaway instability of this simple rigid hydraulic system depends on the slopes of torque factor dTED/dnED at no-load point. For GVO at 6°, the slopes dTED/dnED of dynamic trajectories are negative at the no-load point, while for GVO at larger values (9°, 15°, and 24°), the slopes dTED/dnED are positive at the no-load points, which satisfy and dissatisfy the runaway stability criterion, respectively.
In fact, the slope of the dynamic trajectories near the no-load point relates to the energy transfer between the hydraulic energy and the mechanical energy. If the exciting energy transferred from the unstable flows to the runner is larger than the dissipated energy, the oscillation will be un-damped. Therefore, the difference in slopes on dynamic trajectories may be attributed to the differences of flow evolutions within the pump-turbine during runaway processes between 6° GVO and other larger GVOs.

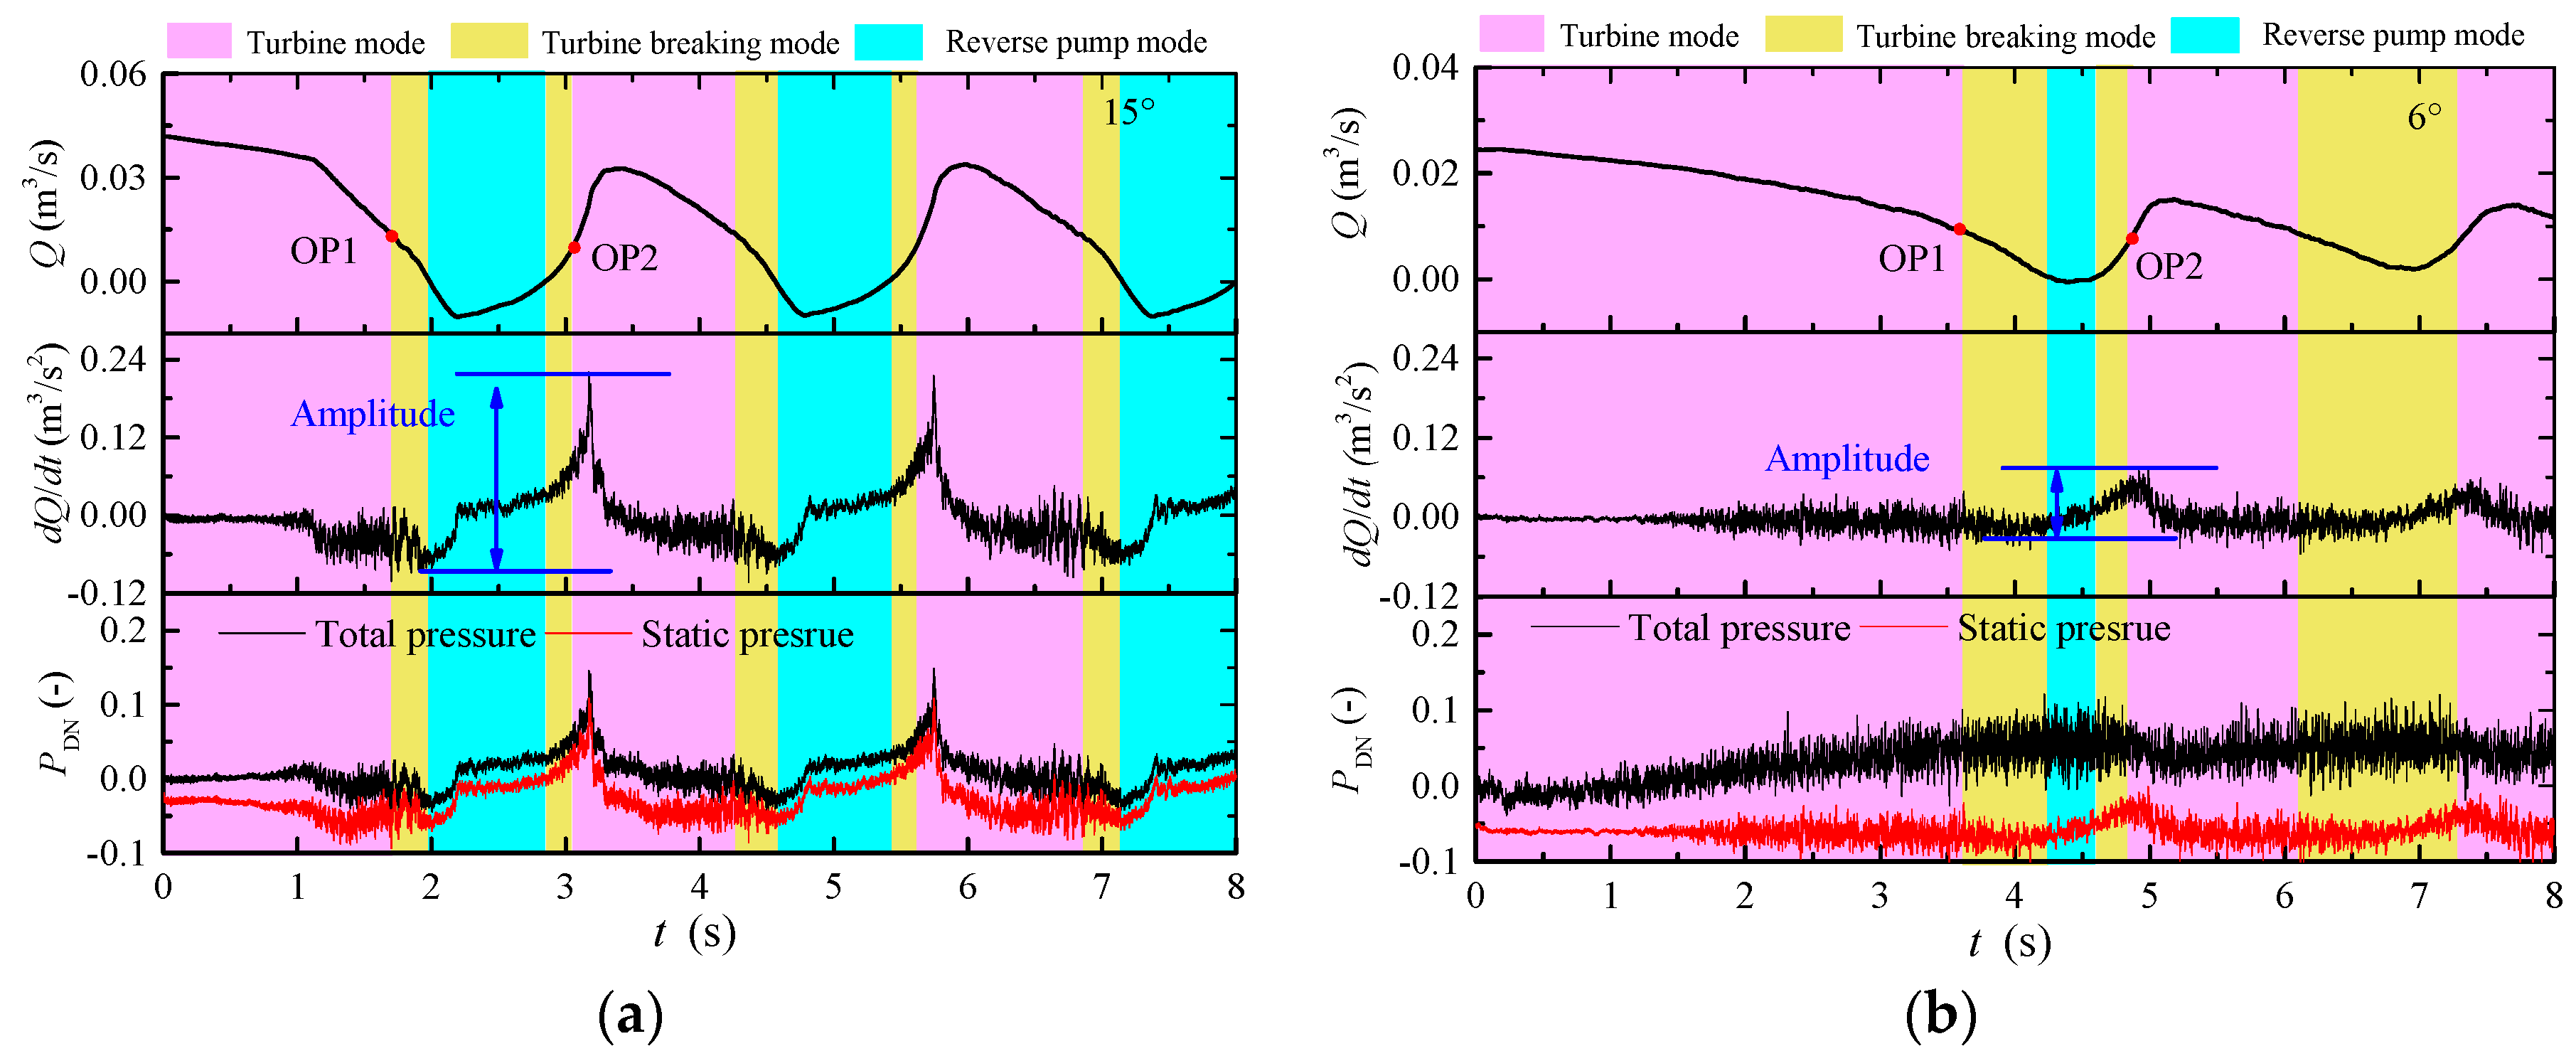
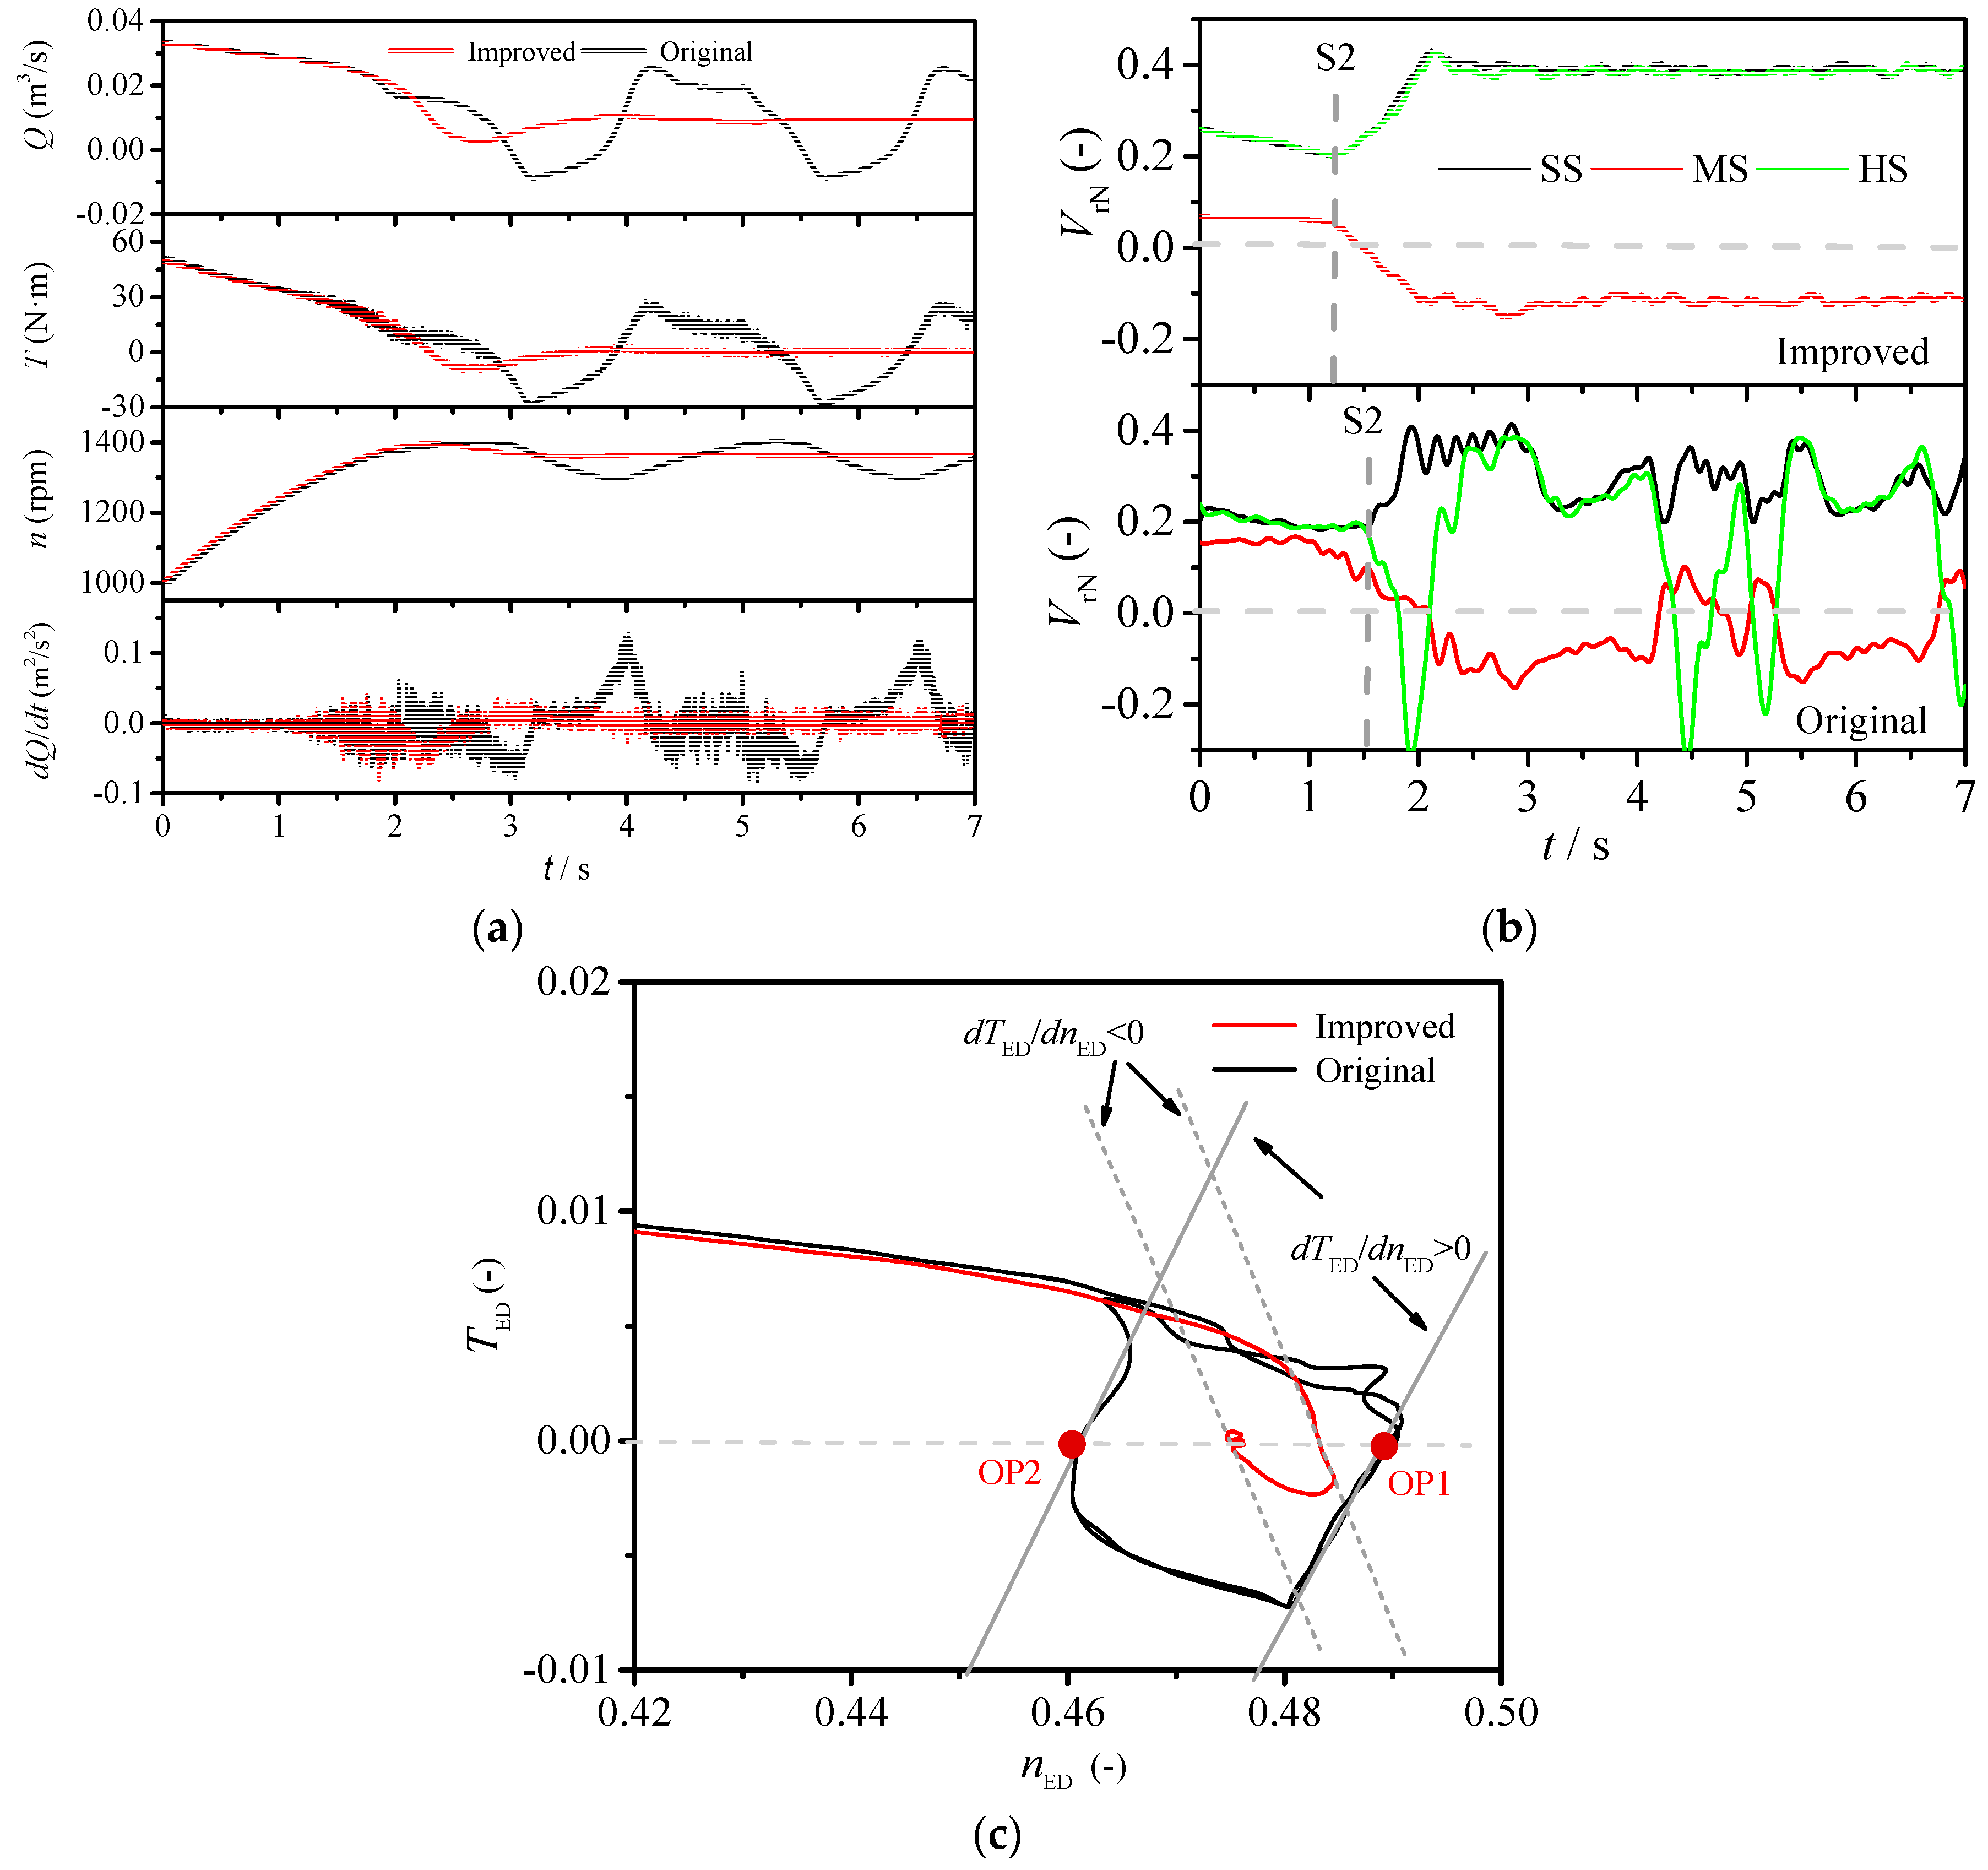
3.2. Influence of Pressure Fluctuations and Flow Changes on Dynamic Trajectories

To investigate the influence of flow evolutions on the runaway stability, the variations of total pressure coefficient PGN at the guide vane inlet, the total pressure coefficient PDN at the draft tube inlet, and the normalized radial velocity VrN in vaneless space for GVOs at 15°, 9°, and 6° are shown in Figure 4, Figure 5 and Figure 6, respectively. The layout of monitoring points is illustrated in Figure 7. Here, the variations of radial velocity are the low frequency filtered signals of velocity fluctuations. The total pressure PT is composed of static pressure Ps and kinetic pressure Pk = ∫ρv2ds/2s, where ρ is the fluid density, v is the fluid velocity, and s is the area of flow section. The pressure was normalized by the reference pressure 0.5ρn0D1/60)2, and the radial velocity was normalized by the reference velocity πn0D1/60, as expressed in Equations (6) and (7).
P N = P T 0.5 ρ ( π n 0 D 1 / 60 ) 2
V r N = V r π n 0 D 1 / 30 .
During the runaway processes, the operating points will move from the turbine mode to the reverse pump mode in the forward direction and then back from the reverse pump mode to the turbine mode in the backward direction. As shown in Figure 4, Figure 5 and Figure 6, the transient variations of pressure and velocity in the two directions are different. For the GVOs at 15° and 9°, the total pressure at the section of draft tube inlet first decreases with decreased discharge in the forward direction and then increases with increased discharge in the backward direction (Figure 4 and Figure 5). Meanwhile, the pressure PDN at no-load point OP1 is smaller than the pressure at initial time, whereas PDN at no-load point OP2 is larger than the pressure at initial time. As a result, the slopes dTED/dnED of the dynamic trajectories at the no-load points (OP1 and OP2) both become positive, so the runaway processes are self-excited. On the contrary, for the GVO at 6°, the pressure PDN first increases with decreased discharge in the forward direction and then decreases with increased discharge in the backward direction (Figure 6a). Simultaneously, the values of total pressure PDN at the no-load points (OP1 and OP2) are both larger than the value at initial time. Therefore, the slopes dTED/dnED of dynamic trajectories at the no-load points (OP1 and OP2) both become negative (Figure 6b), which dampens the runaway process.
The variations of radial velocity in the vaneless space show that the BFVSs with negative radial velocity emerge at the runner inlet and have regular transition near the no-load point. For the GVOs at 15° and 9°, the location of BFVSs changing back and forth between the hub side and mid-span (Figure 4a and Figure 5a). For GVO at 6°, the BFVSs only occur at the mid-span (Figure 6a). In general, the BFVSs will block the through flow, leading to increased pressure in the guide vane domain. For large GVO conditions, after the onset of BFVSs on the hub side in turbine mode, the total pressure PGN increases progressively until the operating points enter into reverse pump mode in the forward direction (Figure 4a and Figure 5a). The total pressure PGN then drops sharply with the location of BFVSs turning from hub side to mid-span. When the operating points move out from the turbine-braking mode to the turbine mode in the backward direction, the total pressure PGN decreases with BFVSs turning location. Although the changes of total pressure PGN of GVO at 6° are different from those of GVOs at larger values, the local change trends around the turbine braking region are similar (Figure 6a). Therefore, it can be concluded that the local pressure rise caused by the blockage of BFVSs in front of the guide-vane is not the main reason for un-damped runaway oscillations.

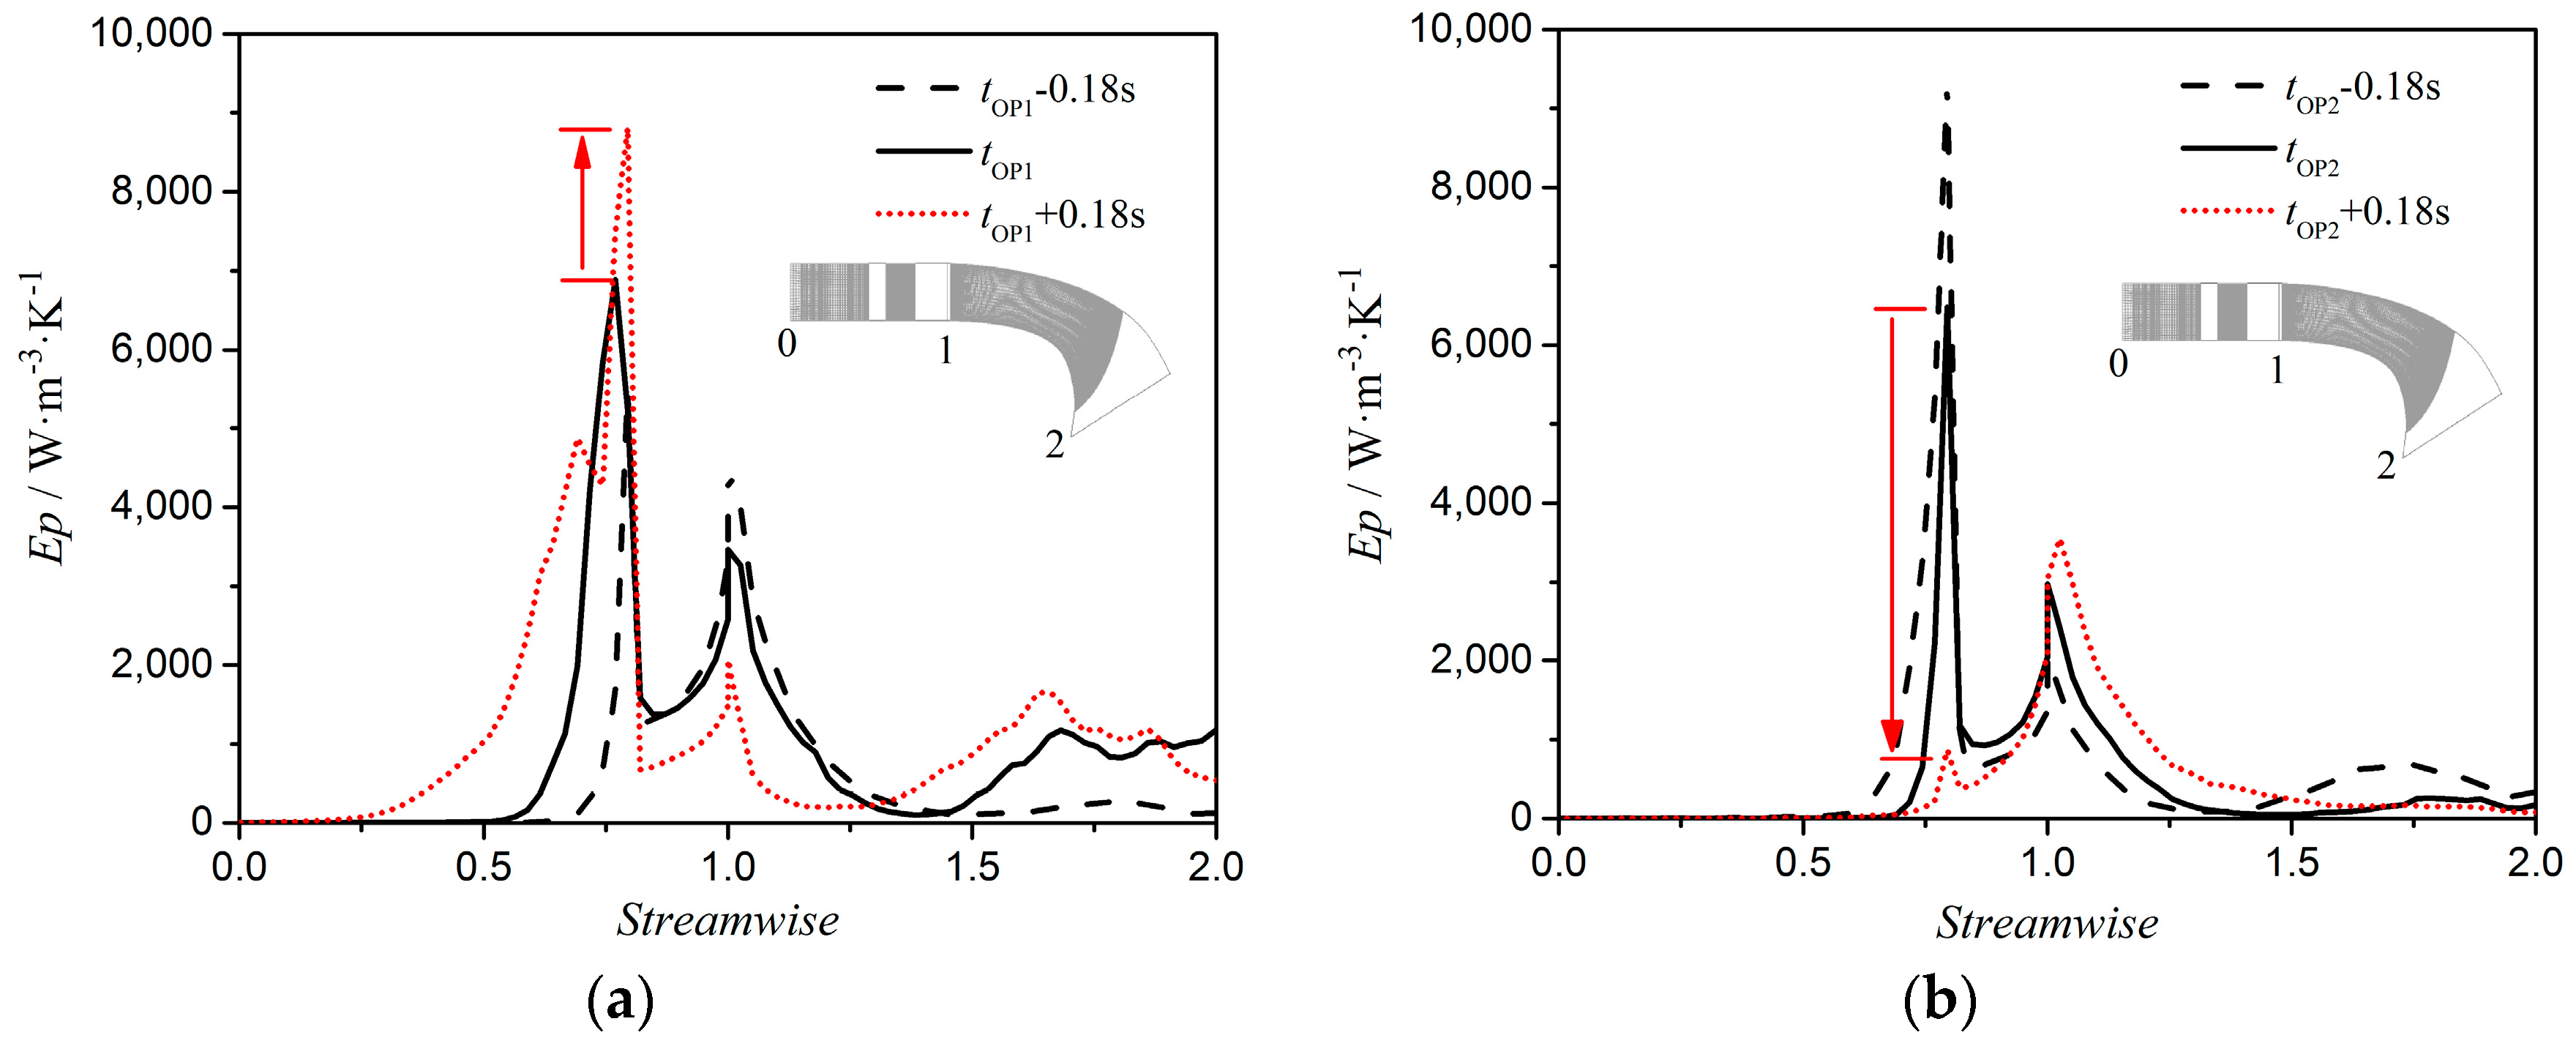
3.3. Influence of Discharge Change Rate on Runaway Stability

In general, the water head of a pump-turbine during transient process were main influenced by the discharge change rate dQ/dt and the hydraulic loss [12]. In order to identify the cause of above distinctive differences on dynamic trajectories between large GVOs and 6° GVO, the transient variations of discharge Q, the discharge change rate dQ/dt, the total pressure, and static pressure for the GVOs at 15° and 6° are shown in Figure 8. As shown in the figure, the change laws of static pressure fluctuations are consistent with the change laws of the discharge change rate dQ/dt for the two cases. However, the variation amplitudes of discharge change rate dQ/dt and static pressure for the 15° GVO condition are both approximately 3.5 times higher than those for the 6° GVO condition, which means that the flow fields inside the pump-turbine change more rapidly at larger GVO. In addition, the change laws of total pressure and static pressure for 15° GVO are similar (Figure 8a), while they are significantly different for 6° GVO (Figure 8b). This difference demonstrates that the sharp change in discharge make the static pressure dominate the water head for 15° GVO. If the discharge changes slowly, the change in kinetic pressure will have more influence on the transient total pressure, i.e., the water head.
When the pump-turbine operates at part load, the kinetic pressure in the turbine will be enhanced by the development of vortex structures, which leads to energy dissipation with vortex breakdown. The traditional method for evaluating energy dissipation, i.e., hydraulic loss, in a pump-turbine is through the evaluation of the pressure drop. However, the pressure drop cannot intuitively reflect the influence of energy dissipation caused by local unstable flow patterns. According to the second law of thermodynamics, the excess hydraulic energy is dissipated into internal energy with the development of vortices, which is irreversible and leads to increased entropy [30,31,32]. Therefore, the local entropy production rate can be used to access the influence of the development of local vortices in the pump-turbine on local flow energy dissipation.
The temperature in the flow of the pump-turbine is constant, and the temperature change is neglected. Kock and Herwig [33] proposed a model to calculate the local entropy production rate induced by the velocity fluctuation. In Menter’s k-ω SST turbulence model, the local entropy production rate induced by velocity fluctuation can be calculated by Equation (8) as
E p = β ρ ω k T e  
where β is the SST closure constant, given as β = 0.09, ω is the turbulent eddy frequency (s−1), k is the turbulent energy(m2/s2), ρ is the fluid density(kg/m3), and Te is the temperature (K).
Figure 9 and Figure 10 show the distributions of entropy production rate Ep and total pressure coefficient PT for 6° GVO condition at some typical instants. As the operating point moves forward to the no-load point, the entropy production rate mainly increases in the guide-vane, around the runner inlet and near the draft tube wall (Figure 9), in which the flow separations and vortex structures will gradually emerge and develop. The region with high total pressure in the draft tube (Figure 10) is in accordance with the region with the high entropy production rate; however, the total pressure distribution cannot reflect the energy dissipation in the runner and guide-vane domain.
Figure 11 shows a new dynamic trajectory (green line) by neglecting the influence of kinetic pressure in the water head for the 6° GVO condition. The change law of the new dynamic trajectory around no-load is similar to that of the dynamic trajectories of large GVO conditions with positive slopes dTED/dnED at no-load points (see Figure 4 and Figure 5). Therefore, it can be concluded that the energy dissipation caused by kinetic pressure have a positive effect on the runaway stability, which results in negative slopes dTED/dnED at no-load points.

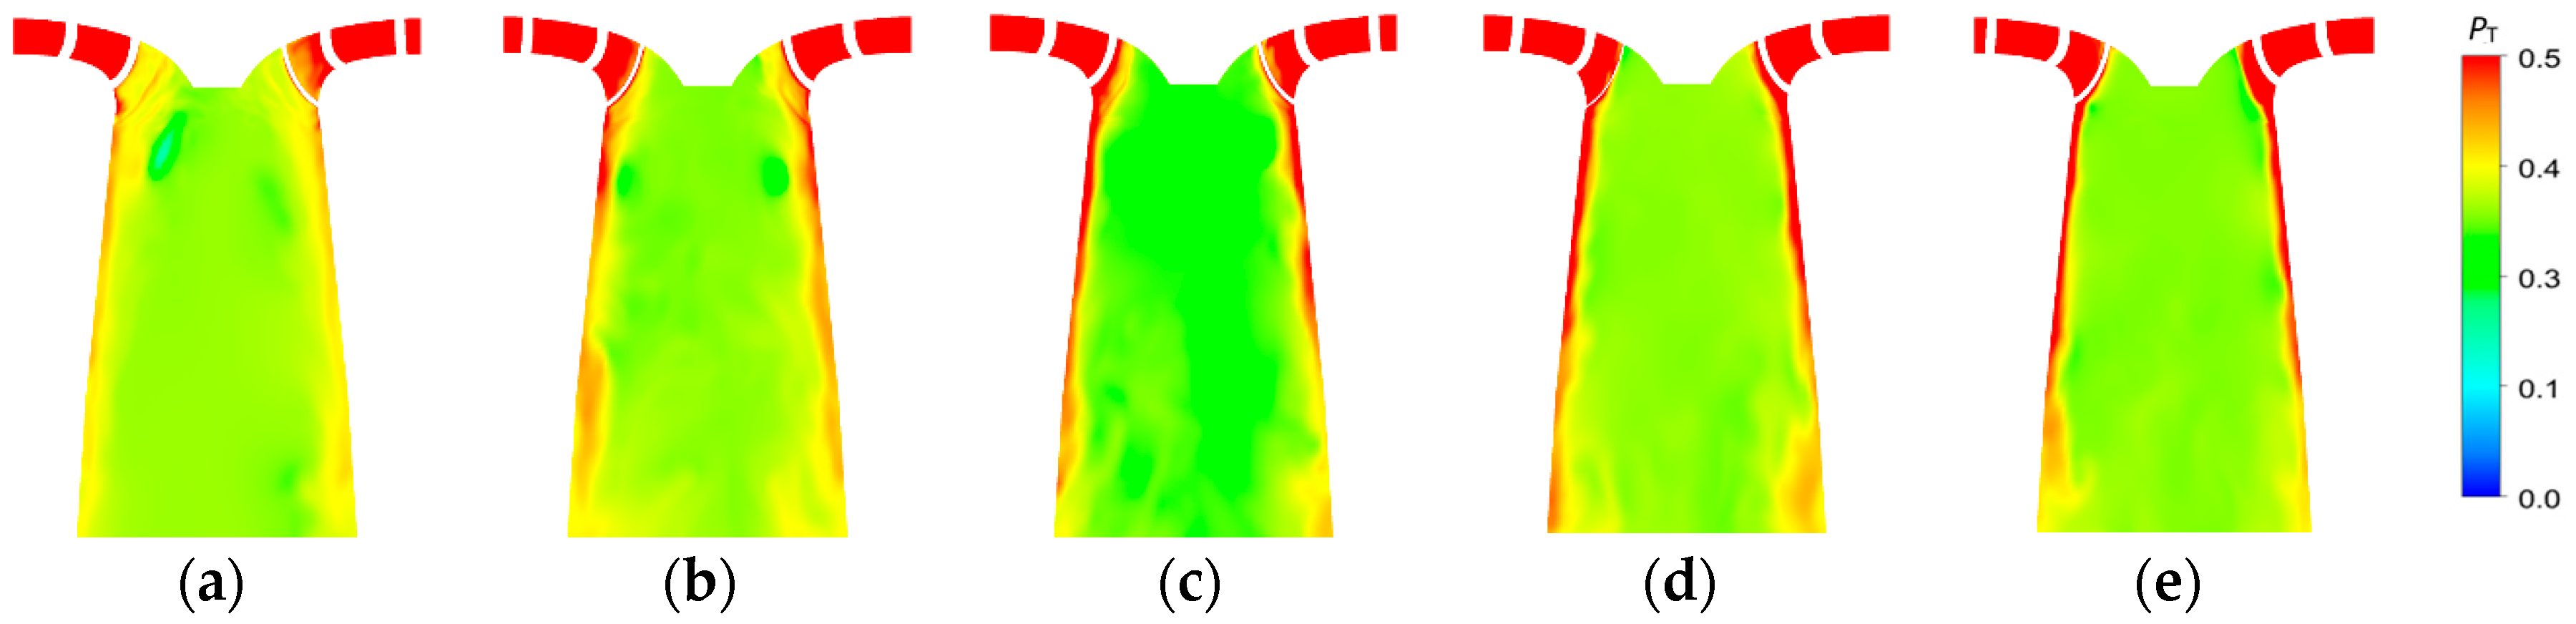
3.4. Influence of Flow Transitions on Discharge Change Rate

The above investigations demonstrate that the sharp change in discharge around the no-load points is detrimental to the runaway oscillation stability. Meanwhile, a remarkable relevance can be observed between the backflow transitions at the runner inlet and the discharge change rate.
During the runaway process for large GVOs (9°, 15°, and 24°), the location of BFVSs on the hub side will turn to the mid-span as the operating point enters into the turbine braking region in the forward direction, and the falling rate of discharge will increase. Afterward, the location of BFVSs will change in a reverse process as the operating point moves out from the turbine braking region in the backward direction, and the rising rate of discharge will increase dramatically. For 6° GVO, the BFVSs only occur at the mid-span of the runner inlet, and the radial velocity only changes in magnitude but without direction. Although the discharge changes in falling and rising stages also are different, their amplitudes are quite small.
Figure 12 and Figure 13 show the distribution changes in the entropy production rate Ep along the streamwise direction of flow passages around no-load points OP1 and OP2 for 15° and 6° GVOs, respectively. As shown in Figure 12, the entropy production rate has a sudden change around the no-load points for 15° GVO, which means that the transition of BFVSs at the runner inlet leads to a dramatic change in energy dissipation and causes a sharp change in the flow resistance, which results in a rapid change in discharge. Moreover, the change range of the entropy production rate within the guide-vane domain in the backward direction is much larger than that in the forward direction (Figure 12). Therefore, the change in the energy dissipation inside the flow passages in the stage with increased discharge is higher than that in the stage with decreased discharge, which leads to significant differences in the discharge change rate in both directions (Figure 8a). Conversely, the entropy production rate changes very slightly around no-load points for 6° GVO (Figure 13). Therefore, the change in discharge at no-load points for 6° GVO is slighter than that for 15° GVO.
Figure 14 shows the vortex structures in the guide-vane and runner passages at no-load points OP1 and OP2 for 15° and 6° GVOs. The Q-criterion is employed to identify the vortex structures [34]. Here, the iso-surface of the Q-criterion was set to 500,000 s−2 and colored by the magnitude of the entropy production rate. For 15° GVO, the runner inlet was severely blocked by the unstable vortices, but the region with separation vortices at no-load point OP1 is larger than at no-load point OP2, especially nearby the runner outlet (Figure 14a). This explains why there is a higher entropy production rate near the runner outlet at OP1 than at OP2 (see Figure 12). For 6° GVO, the runner passages are also blocked severely by separation vortices (Figure 14b). However, the vortices in the guide-vane domain have a smaller value of the entropy production rate. In other words, smaller energy is dissipated there. Although the energy dissipation of separation vortices at no-load points for 15° GVO is higher than that for 6° GVO, the change rate in energy dissipation for 15° GVO has much more influence on the change in discharge, which is unfavorable to the oscillation stability of a pump turbine in a runaway process.

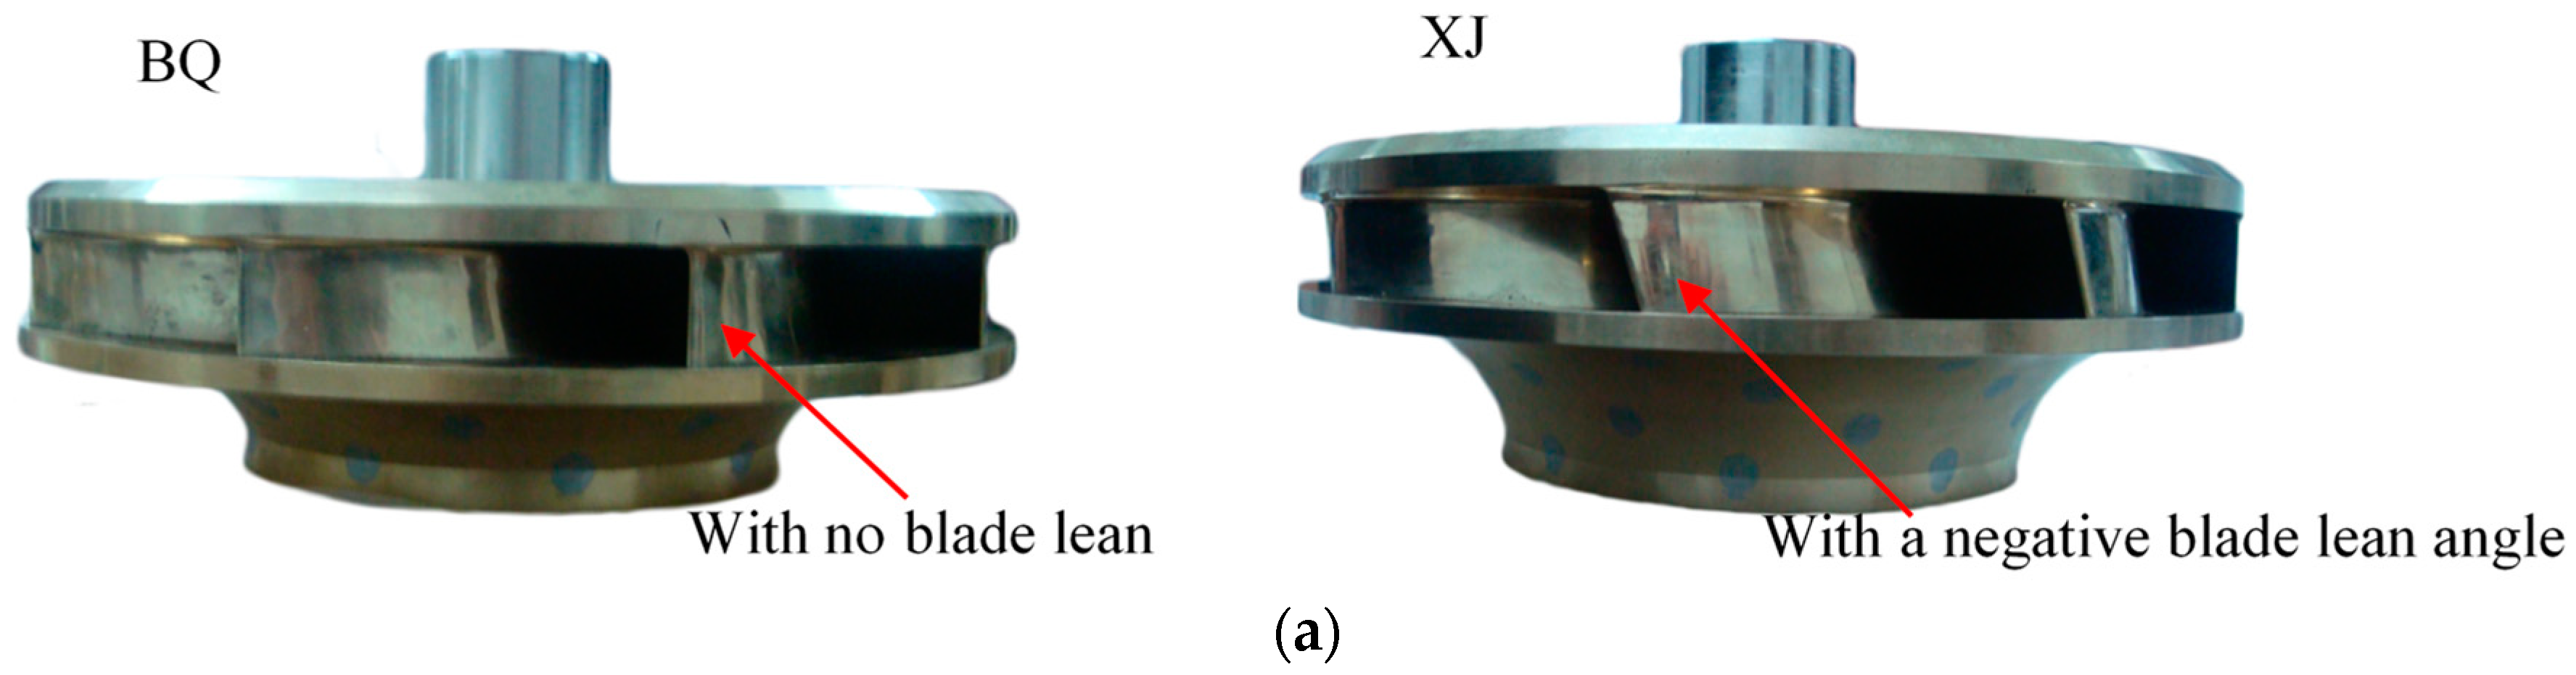
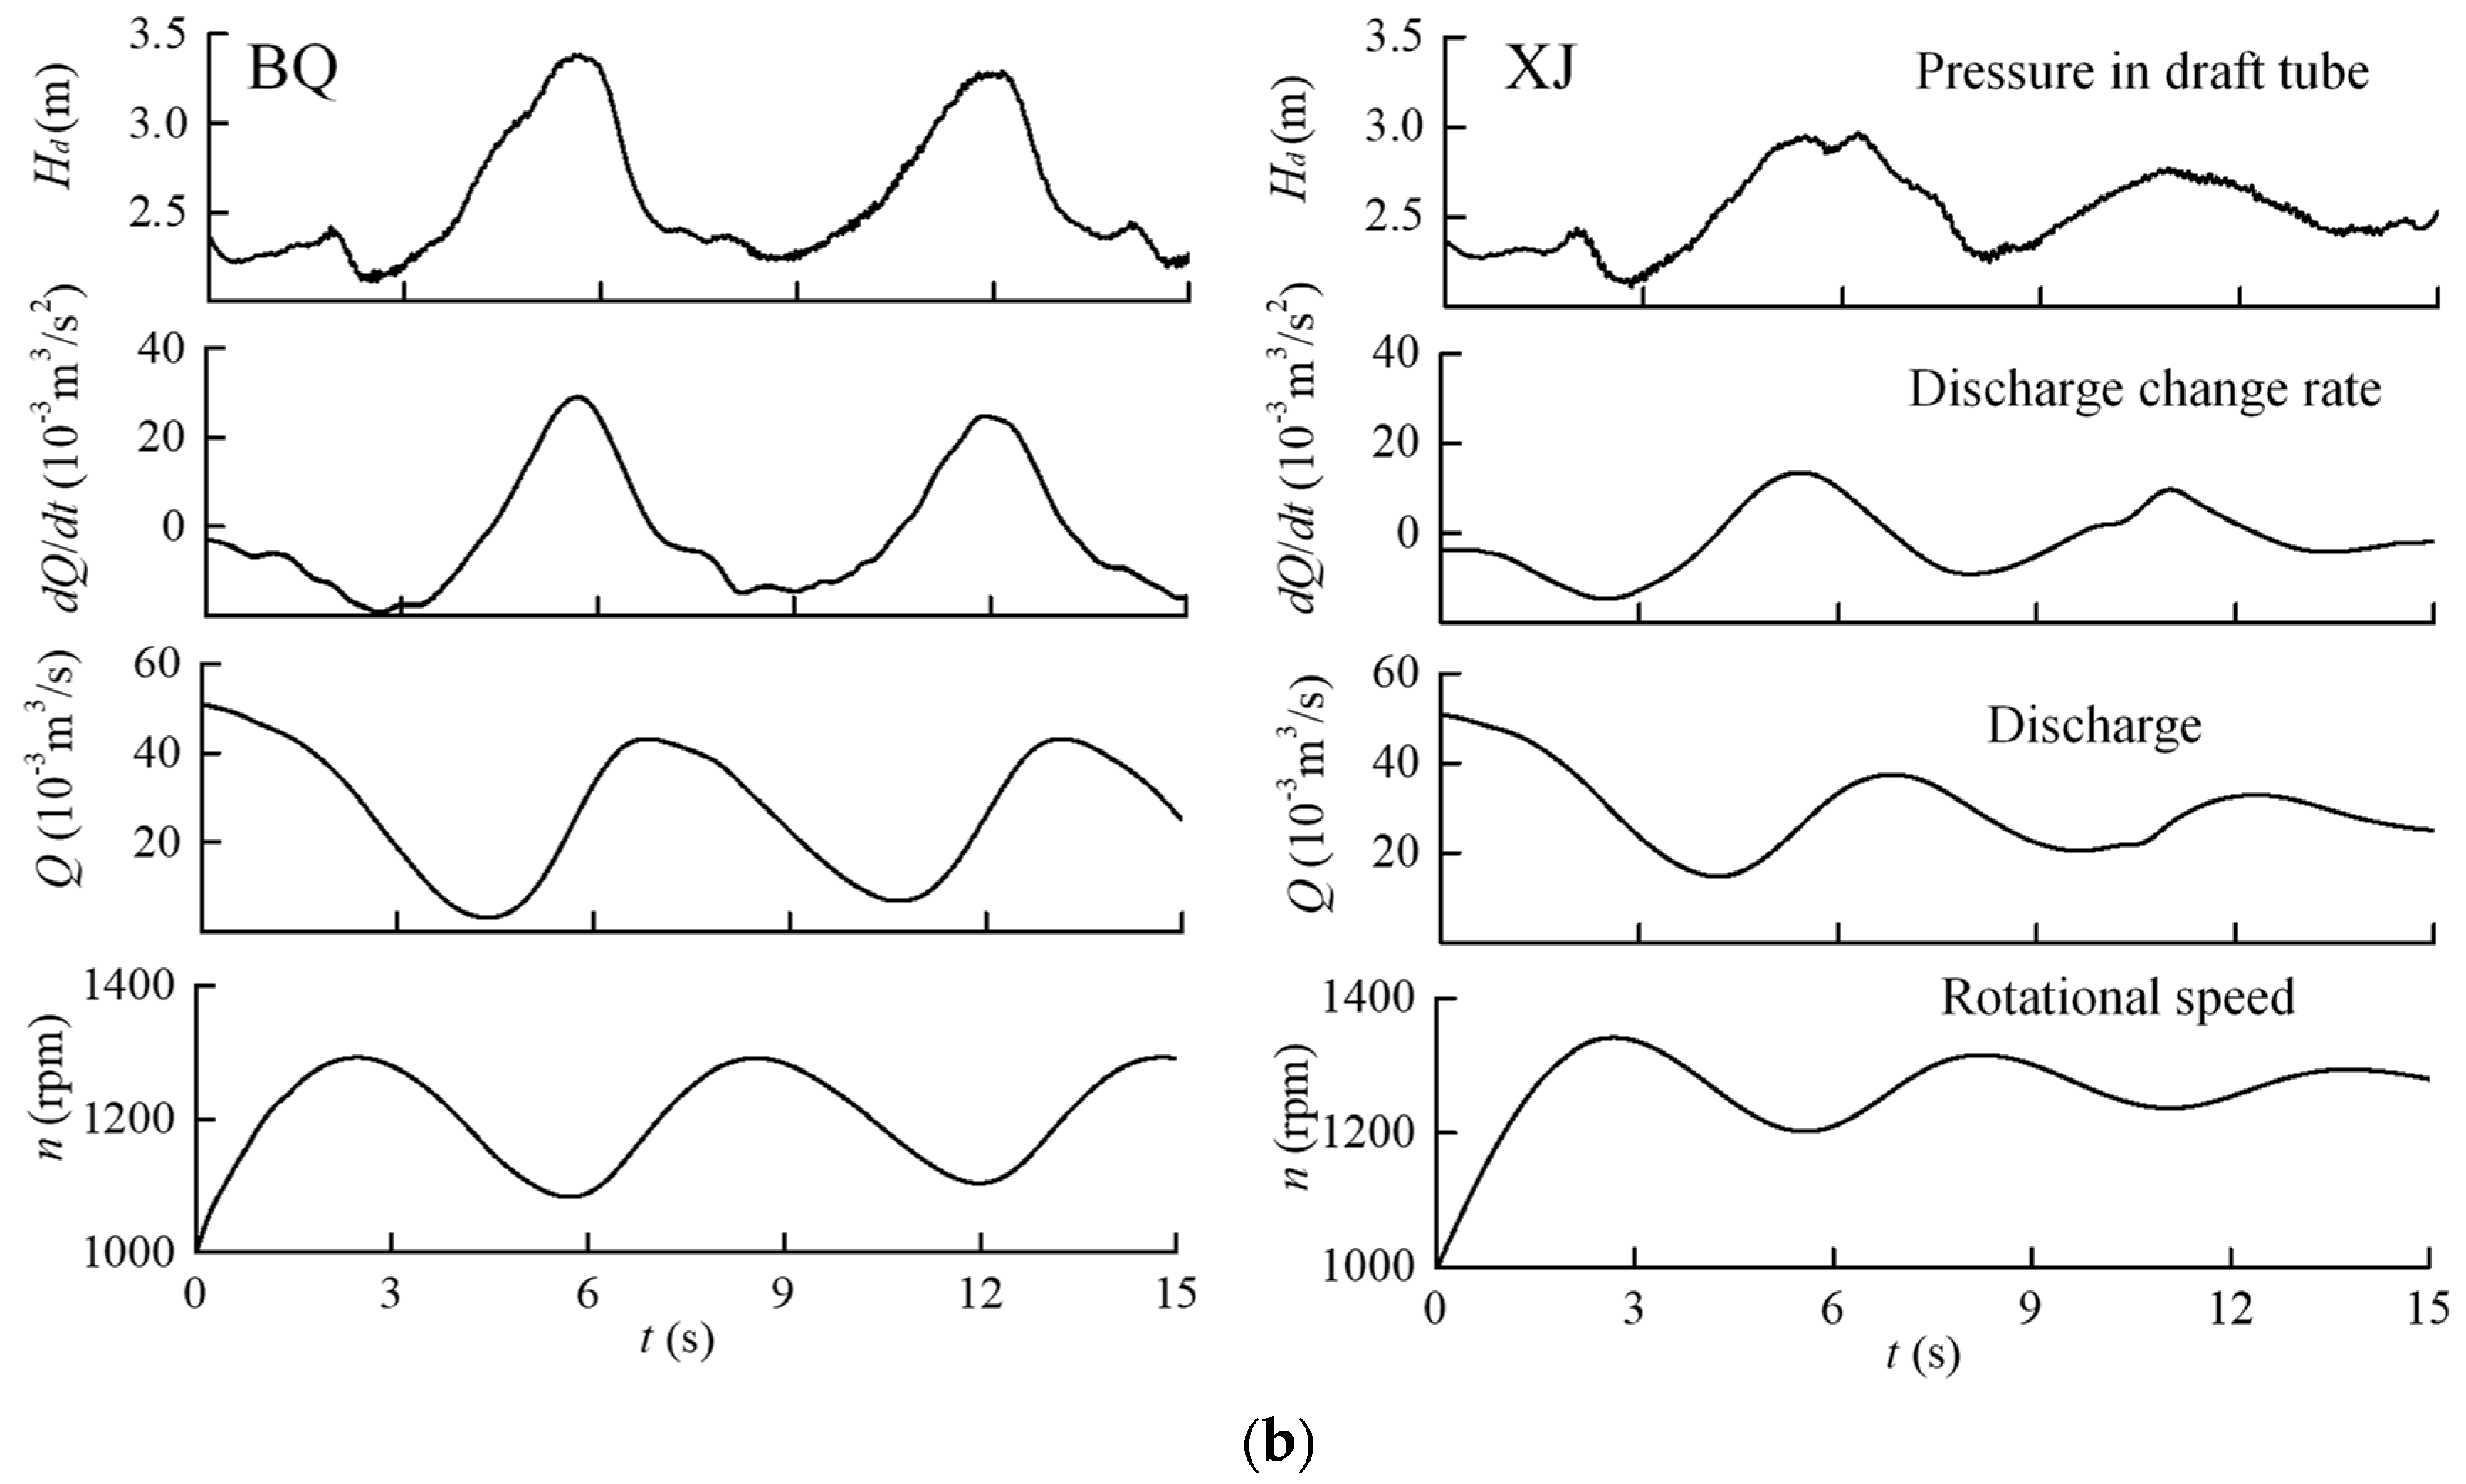
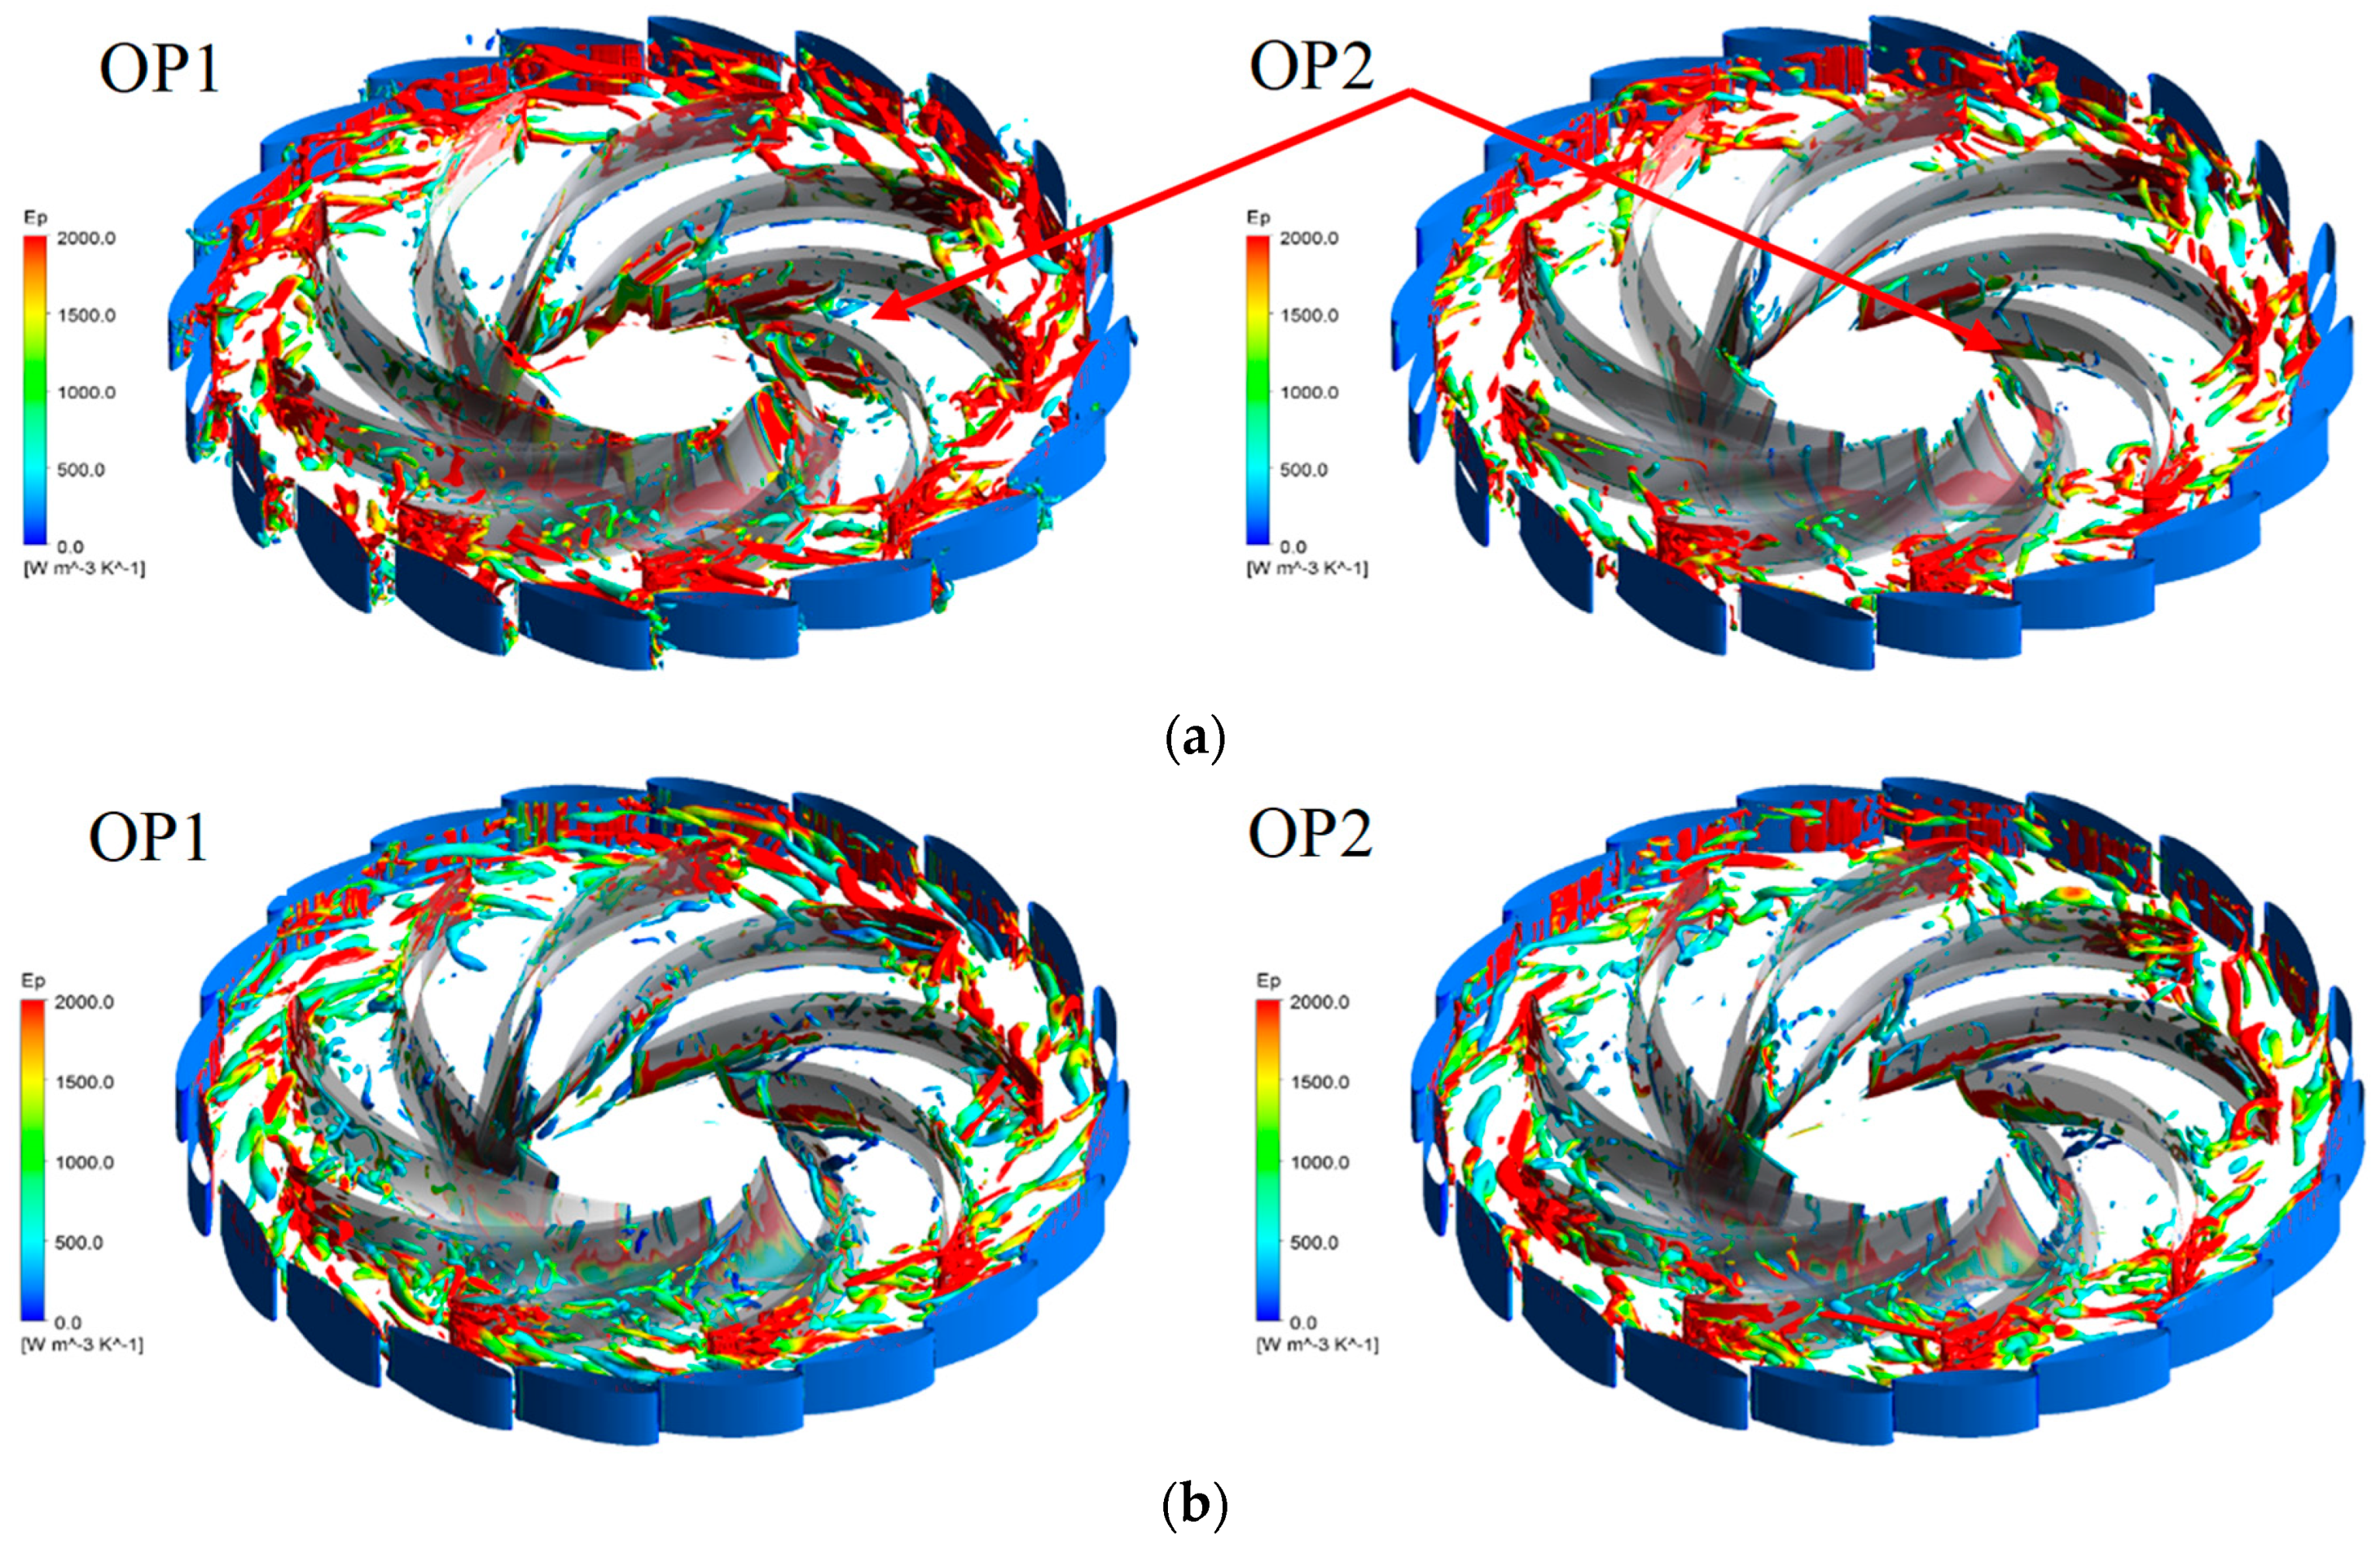
3.5. Improvement of the Runaway Oscilation Stability

In general, at the start-up of pump-turbine, synchronization speed is reached at a small GVO degree, usually less than 9°. If the stable runaway region of a pump-turbine is expanded, the unit can operate more safely. Now that we know that the runaway oscillation stability is affected by the backflows at the runner inlet, the stability can be improved by changing the development law of the BFVSs at the runner inlet. The authors redesigned the shape of the runner blade leading edge. As shown in Figure 15, the original runner has no lean at the runner blade leading edge, while the improved runner has a negative lean angle at the runner blade leading edge. Figure 16 show the comparisons of the dynamic characteristic between the improved and original cases during the runaway process at 9° GVO. As shown in the figure, a stable runaway process of the pump-turbine can be achieved by the improved runner. The changes of the transient macro parameters of two cases are very close until the BFVSs emerge at the runner inlet. The changes in radial velocity show that the BFVSs of the improved case only occur at the midspan of the runner inlet. As a result, the change amplitude of discharge change rate dQ/dt for the improved case is significant smaller than that for original case, and the dynamic trajectory of the improved case has negative slopes dTED/dnED at the no-load points, which satisfies the runaway oscillation stability criterion. Therefore, the runaway process is damped.

4. Conclusions

Three-dimensional transient numerical simulations were carried out on the runaway processes of a low specific-speed pump-turbine at four GVOS. The evolution of BFVSs at the runner inlet was investigated in depth. Further, entropy production theory was used to analyze the dissipation characteristics of different types of BFVSs and their impacts on the runaway stability. The internal mechanism of runaway oscillation instability was obtained. A design criteria is proposed to extend the stable runaway operating range.
During the runaway oscillation process, BFVSs occur at the runner inlet for all GVOs, which results in severe separations and complicated vortices in the guide-vane and runner domains. For the large GVO condition, the energy dissipations have a sharp change around the no-load points with the location of BFVSs at the runner inlet changing between hub side and midspan, which makes the discharge change rapidly. As a result, the slopes of dynamic trajectories at the no-load point become positive, so the runaway oscillation is self-excited. Conversely, for the small GVO condition, the BFVSs only occur at the midspan of the runner inlet, and the change rate of energy dissipation is very small around the no-load points, which makes the discharge change slightly. Consequently, the slopes of dynamic trajectories at the no-load points become negative, and the runaway oscillation is therefore damped. If the occurrence of BFVSs at hub side of the runner inlet the runner is suspended, a more stable pump-turbine for runaway process can be obtained. Experimental verifications will be conducted in future work.

Author Contributions

L.X. conceived and designed the study and wrote the paper; Q.Z. performed the study; C.Z. analyzed the data.

Funding

This research received no external funding.

Acknowledgments

This work was supported by the National Natural Science Foundation of China (Grant No. 51579187, 51839008), the Technology Research Program of the National Science and Technology Research Center for Inland Waterway Regulation Engineering (grant number NERC2014A05), the Chongqing Research Program of Application Foundation and Advanced Technology (grant number cstc2016jcyjA1935, cstc2016jcyjA1937), the Science and Technology Project of the Chongqing Education Committee (grant number KJ1600514, KJ1600535, KJQN201800712), and the Open Fund Project of the Key Laboratory for Inland Waterway Regulation Engineering of Ministry of communication in Chongqing Jiaotong University (grant number NHHD-201505, NHHD-201513).

Conflicts of Interest

The authors declare no conflict of interest.

Nomenclature

TTorque (N·m)
nRotational speed (rpm)
QRotational inertia (kg·m2)
gGravitational acceleration (m·s−2)
D1Runner inlet diameter (m)
HWater head (m)
ρ Water density (kg·m−3)
tTime (s)
n ED Speed factor ( n D 1 / ( 60 g H ) )
Q ED Discharge factor ( Q / ( D 1 2 g H ) )
T ED Torque factor ( T / ( ρ D 1 3 g H ) )
PTTotal pressure (Pa)
PNPressure coefficient (P/0.5ρ (πnD1/60)2)
GVOGuide vane opening
nsSpecific speed nQ0.5/H0.75
BFVSBackflow vortex structure
V r Radial velocity (m·s−1)
V r N Normalized radial velocity ( V r / π n 0 D 1 / 30 )

References

  1. Rehman, S.; Al-Hadhrami, L.; Alam, M. Pumped hydro energy storage system: A technological review. Renew. Sustain. Energy Rev. 2015, 44, 586–598. [Google Scholar] [CrossRef]
  2. Spänhoff, B. Current status and future prospects of hydropower in Saxony (Germany) compared to trends in Germany, the European Union and the World. Renew. Sustain. Energy Rev. 2014, 30, 518–525. [Google Scholar] [CrossRef]
  3. Pérez-Sánchez, M.; Sánchez-Romero, F.; Ramos, H.; López-Jiménez, P. Energy recovery in existing water networks: Towards greater sustainability. Water 2017, 9, 97. [Google Scholar] [CrossRef]
  4. Paish, O. Micro-hydropower: Status and prospects. Proc. Inst. Mech. Eng. A J. Power Energy 2002, 216, 31–40. [Google Scholar] [CrossRef]
  5. Trivedi, C.; Cervantes, M.; Gandhi, B.; Dahlhaug, O. Transient pressure measurements on a high head model Francis turbine during emergency shutdown, total load rejection, and runaway. J. Fluids Eng. 2014, 136, 121107. [Google Scholar] [CrossRef]
  6. Zuo, Z.; Fan, H.; Liu, S.; Wu, Y. S-Shaped Characteristics on the Performance Curves of Pump-Turbines in Turbine Mode—A Review. Renew. Sustain. Energy Rev. 2016, 60, 836–851. [Google Scholar] [CrossRef]
  7. Zhang, X.; Cheng, Y.; Xia, L.; Yang, J.; Qian, Z. Looping Dynamic Characteristics of a Pump-Turbine in the S-Shaped Region during Runaway. J. Fluids Eng. 2016, 138, 091102. [Google Scholar] [CrossRef]
  8. Zuo, Z.; Liu, S.; Sun, Y.; Wu, Y. Pressure fluctuations in the vaneless space of High-head pump-turbines—A review. Renew. Sustain. Energy Rev. 2015, 41, 965–974. [Google Scholar] [CrossRef]
  9. Cavazzini, G.; Covi, A.; Pavesi, G. Analysis of the unstable behavior of a pump-turbine in turbine mode: Fluid-dynamical and spectral characterization of the S-Shape characteristic. J. Fluids Eng. 2016, 138, 021105. [Google Scholar] [CrossRef]
  10. Liu, L.; Zhu, B.; Bai, L.; Liu, X.; Zhao, Y. Parametric Design of an Ultrahigh-Head Pump-Turbine Runner Based on Multi objective Optimization. Energies 2017, 10, 1169. [Google Scholar] [CrossRef]
  11. Xia, L.; Cheng, Y.; You, J.; Zhang, X.; Yang, J.; Qian, Z. Mechanism of the S-Shaped Characteristics and the Runaway Instability of Pump-Turbines. J. Fluids Eng. 2017, 139, 031101. [Google Scholar] [CrossRef]
  12. Rezghi, A.; Riasi, A. Sensitivity analysis of transient flow of two parallel pump-turbines operating at runaway. Renew. Energy 2016, 86, 611–622. [Google Scholar] [CrossRef]
  13. Zhang, H.; Chen, D.; Wu, C.; Wang, X.; Lee, J.; Jung, K. Dynamic Modeling and Dynamical Analysis of Pump-Turbines in S-shaped Regions during Runaway Operation. Energy Convers. Manag. 2017, 138, 375–382. [Google Scholar] [CrossRef]
  14. Zhou, J.; Karney, B.; Hu, M.; Xu, J. Analytical study on possible self-excited oscillation in S-shaped regions of pump-turbines. Proc. Inst. Mech. Eng. A J. Power Energy 2011, 225, 1132–1142. [Google Scholar] [CrossRef]
  15. Zeng, W.; Yang, J.; Guo, W. Runaway instability of pump-turbines in S-shaped regions considering water compressibility. J. Fluids Eng. 2015, 137, 051401. [Google Scholar] [CrossRef]
  16. Dörfler, P.; Engineer, A.; Pendse, R. Stable operation achieved on a single-stage reversible pump-turbine showing instability at no load. In Proceedings of the 19th IAHR Symposium on Hydraulic Machinery and Cavitation, Singapore, 9–11 September 1998. [Google Scholar]
  17. Xiao, Y.; Zhu, W.; Wang, Z.; Zhang, J.; Ahn, S.-H.; Zeng, C.; Luo, Y. Numerical Analysis of the Effect of Misaligned Guide Vanes on Improving S-Shaped Characteristics for a Pump-Turbine. J. Fluids Eng. 2018, 140, 031102. [Google Scholar]
  18. Staubli, T.; Senn, F.; Sallaberger, M. Instability of Pump-Turbines during Start-up in Turbine Mode. In Proceedings of the Hydro 2008, Ljubljana, Slovenia, 6–8 October 2008. [Google Scholar]
  19. Gentner, C.; Sallaberger, M.; Widmer, C.; Braun, O.; Staubli, T. Numerical and experimental analysis of instability phenomena in pump turbines. IOP Conf. Ser. Earth Env. Sci. 2012, 15, 032042. [Google Scholar] [CrossRef] [Green Version]
  20. Zeng, W.; Yang, J.; Hu, J. Pumped storage system model and experimental investigations on s-induced issues during transients. Mech. Syst. Signal Process. 2017, 90, 350–364. [Google Scholar] [CrossRef]
  21. Widmer, C.; Staubli, T.; Ledergerber, N. Unstable characteristics and rotating stall in turbine braking operation of pump-turbines. J. Fluids Eng. 2011, 133, 041101. [Google Scholar] [CrossRef]
  22. Pacot, O.; Kato, C.; Guo, Y.; Yamade, Y.; Avellan, F. Large eddy simulation of the rotating stall in a pump-turbine operated in pumping mode at a part-load condition. J. Fluids Eng. 2016, 13, 111102. [Google Scholar] [CrossRef]
  23. Xia, L.; Cheng, Y.; Yang, Z.; You, J.; Yang, J.; Qian, Z. Evolutions of Pressure Fluctuations and Runner Loads during Runaway Processes of a Pump-Turbine. J. Fluids Eng. 2017, 139, 091101. [Google Scholar] [CrossRef]
  24. Xia, L.; Cheng, Y.; Yang, J.; Cai, F. Evolution of flow structures and pressure fluctuations in the S-shaped region of a pump-turbine. J. Hydraul. Res. 2018, 1–15. [Google Scholar] [CrossRef]
  25. Wang, Z.; Zhu, B.; Wang, X.; Qin, D. Pressure fluctuations in the S-shaped region of a reversible pump-turbine. Energies 2017, 10, 96. [Google Scholar] [CrossRef]
  26. Martin, C. Stability of pump-turbines during transient operation. In Proceedings of the 5th Conference on Pressure Surges, BHRA, Hannover, Germany, 22–24 September 1986. [Google Scholar]
  27. Martin, C. Instability of pump-turbines with S-shaped characteristics. In Proceedings of the 20th IAHR Symposium on Hydraulic Machinery and Systems, Charlotte, NC, USA, 6–9 August 2000. [Google Scholar]
  28. Zhao, X.; Xiao, Y.; Wang, Z.; Luo, H.; Ahn, S.-H.; Yao, Y.; Fan, H. Numerical analysis of non-axisymmetric flow characteristic for a pump-turbine impeller at pump off-design condition. Renew. Energy 2018, 115, 1075–1085. [Google Scholar]
  29. Menter, F.; Egorov, Y. The scale-adaptive simulation method for unsteady turbulent flow predictions. Part 1: Theory and model description. Flow Turbul. Combust. 2010, 85, 113–138. [Google Scholar] [CrossRef]
  30. Herwig, H.; Gloss, D.; Wenterodt, T. A new approach to understanding and modelling the influence of wall roughness on friction factors for pipe and channel flows. J. Fluid Mech. 2008, 613, 35–53. [Google Scholar] [CrossRef]
  31. Li, D.; Wang, H.; Qin, Y.; Han, L.; Wei, X.; Qin, D. Entropy production analysis of hysteresis characteristic of a pump-turbine model. Energy Convers. Manag. 2017, 149, 175–191. [Google Scholar] [CrossRef]
  32. Saqr, K.; Shehata, A.; Taha, A.; ElAzm, M. CFD modelling of entropy generation in turbulent pipe flow: Effects of temperature difference and swirl intensity. Appl. Therm. Eng. 2016, 100, 999–1006. [Google Scholar] [CrossRef]
  33. Kock, F.; Herwig, H. Local entropy production in turbulent shear flows: A high-Reynolds number model with wall functions. Int. J. Heat Mass Transf. 2004, 47, 2205–2215. [Google Scholar] [CrossRef]
  34. Zhang, Y.; Liu, K.; Xian, H.; Du, X. A review of methods for vortex identification in hydro turbines. Renew. Sustain. Energy Rev. 2018, 81, 1269–1285. [Google Scholar] [CrossRef]
Figure 1. Different characterizations. (a) Runners. (b) Runaway oscillation processes [20].
Applsci 08 02193 g001aApplsci 08 02193 g001b
Figure 2. Computational domain and mesh. (a) Geometry; (b) mesh.
Applsci 08 02193 g002
Figure 3. Dynamic trajectories and static characteristic curves. (a) nEDQED; (b) nEDTED.
Applsci 08 02193 g003
Figure 4. Dynamic trajectories and time histories of operating parameters at GVO 15°. (a) Variation of pressure and radial velocity; (b) dynamic trajectories.
Applsci 08 02193 g004
Figure 5. Dynamic trajectories and time histories of operating parameters at GVO 9°. (a) Variation of pressure and radial velocity; and (b) dynamic trajectories.
Applsci 08 02193 g005
Figure 6. Dynamic trajectories and time histories of operating parameters at GVO 6°. (a) Variation of pressure and radial velocity; (b) dynamic trajectories.
Applsci 08 02193 g006
Figure 7. Schematic diagram of monitoring points and sections.
Applsci 08 02193 g007
Figure 8. Transient variations of operating parameters for 15° and 6° GVOs. (a) 15° GVO; (b) 6° GVO.
Applsci 08 02193 g008
Figure 9. Distribution of the entropy production Ep for 6° GVO at some typical instants; (a) t = 0.18 s; (b) t = 1.08 s; (c) t = 2.52 s; (d) t = 3.18 s; (e) t = 3.48 s.
Applsci 08 02193 g009
Figure 10. Distribution of total pressure PT for 6° GVO at some typical instants; (a) t = 0.18 s; (b) t = 1.08 s; (c) t = 2.52 s; (d) t = 3.18 s; (e) t = 3.48 s.
Applsci 08 02193 g010
Figure 11. Changes of dynamic trajectory by neglecting the influence of kinetic pressure for 6° GVO.
Applsci 08 02193 g011
Figure 12. Changes of the distribution of entropy production rate Ep along the streamwise direction of flow passages at no-load points OP1 and OP2 for 15° GVO; (a) in the forward direction; (b) in the backward direction.
Applsci 08 02193 g012
Figure 13. Changes of the distribution of entropy production rate Ep along the streamwise direction of flow passages at no-load points OP1 and OP2 for 6° GVO; (a) in the forward direction; (b) in the backward direction.
Applsci 08 02193 g013
Figure 14. Vortex structures in the flow passages at no-load points OP1 and OP2; (a) 15° GVO; (b) 6° GVO.
Applsci 08 02193 g014
Figure 15. The two runners. (a) Original runner; (b) improved runner.
Applsci 08 02193 g015
Figure 16. The dynamic characteristic between the improved and the original cases during runaway process at 9° GVO. (a) Transient parameters; (b) transient radial velocities; (c) dynamic trajectories.
Applsci 08 02193 g016
Table 1. Parameters of the model pump-turbine.
ParameterValue
Specific speed n QE = n Q / H 3 / 4 29.17
Runner inlet diameter D10.280 m
Runner outlet diameter D20.1409 m
Number of runner blades zb9
Number of stay vanes nsv20
Number of guide vanes ngv20
Rated rotational speed n01000 r/min
Guide-vane openings α6°, 9°, 15°, 24°
Table 2. Number of mesh elements (million).
Spiral-CaseGuide/Stay Vane (6°)Guide/Stay Vane (9°)Guide/Stay Vane (15°)Guide/Stay Vane (24°)RunnerDraft-Tube with Extension
1.012.06 1.98 2.421.96 2.452.34

