Article

Sound Velocity Estimation and Beamform Correction by Simultaneous Multimodality Imaging with Ultrasound and Magnetic Resonance

Medical Ultrasound Research Center, Doshisha University, Kyotanabe Kyoto 610-0321, Japan
*
Author to whom correspondence should be addressed.
Appl. Sci. 2018, 8(11), 2133; https://doi.org/10.3390/app8112133
Submission received: 14 September 2018 / Revised: 23 October 2018 / Accepted: 27 October 2018 / Published: 2 November 2018
(This article belongs to the Special Issue Ultrasound B-mode Imaging: Beamforming and Image Formation Techniques)

Abstract

:
Since the sound velocity for medical ultrasound imaging is usually set at 1540 m/s, the ultrasound imaging of a patient with a thick layer of subcutaneous fat is degraded due to variations in the sound velocity. This study proposes a method of compensating for image degradation to correct beamforming. This method uses the sound velocity distribution measured in simultaneous ultrasound (US) and magnetic resonance (MR) imaging. Experiments involving simultaneous imaging of an abdominal phantom and a human neck were conducted to evaluate the feasibility of the proposed method using ultrasound imaging equipment and a 1.5 T MRI scanner. MR-visible fiducial markers were attached to an ultrasound probe that was developed for use in an MRI gantry. The sound velocity distribution was calculated based on the MRI cross section, which was estimated as a corresponding cross section of US imaging using the location of fiducial markers in MRI coordinates. The results of the abdominal phantom and neck imaging indicated that the estimated values of sound velocity distribution allowed beamform correction that yielded compensated images. The feasibility of the proposed method was then evaluated in terms of quantitative improvements in the spatial resolution and signal-to-noise ratio.

1. Introduction

Ultrasound diagnostic equipment, which has widely been used in clinical diagnosis, assumes that sound velocity has a uniform distribution, since it is based on pulse-echo imaging. However, in biological soft tissues, the sound velocity ranges from 1400 m/s to 1600 m/s [1]. For example, the sound velocity in mammalian fat tissues ranges from 1400 m/s to 1490 m/s [1]. Therefore, since the sound velocity for ultrasound imaging (US imaging) is usually assumed to be 1540 m/s, the imaging of a patient with a thick layer of subcutaneous fat is degraded due to variations in the sound velocity. Significant image degradation presumably reduces spatial resolution and the signal-to-noise ratio (SNR) in US imaging. If the sound velocity distribution is known before imaging, image degradation could be reduced by compensating for improper beamformation. Various methods for the in vivo measurement of the sound velocity distribution have been proposed [2,3,4,5]. For example, Aoki et al. [6] and Nitta et al. [7] proposed methods for the measurement of the sound velocity in cartilage using magnetic resonance imaging (MRI) and US imaging. In the two methods, sound velocity is estimated based on the length of cartilage, as measured with MRI, divided by the time-of-flight, as measured with the ultrasonic pulse-echo technique. Since the estimated sound velocity is obtained at different times and locations in US imaging and MRI, the measurements are not accurate enough to correct beamforming. Thus, the aim of the current study was to evaluate the feasibility of a method of measuring the sound velocity distribution in vivo using a prototype simultaneous US imaging and MRI system. This method corrected beamforming to improve image quality in terms of the spatial resolution and SNR. In this study, magnetic-resonance-visible (MR-visible) fiducial markers were attached to an ultrasound probe to display a cross section of US imaging in MRI coordinates. The ultrasound probe was developed for use in the coils of an MRI scanner.
When measuring the sound velocity distribution with a simultaneous US imaging and MRI system, the following issues need to be resolved: (1) the development of an ultrasonic array probe for use in an MRI gantry; (2) the development of MR-visible fiducial markers and the estimation of the location of a cross section in MRI coordinates; and (3) the suppression of crosstalk (electrical noise) between the MRI scanner and ultrasound equipment. Curiel et al. [8] imaged a phantom kidney and a rabbit kidney by mechanically scanning a single transducer. Tang et al. [9] used a commercially available probe with attached MR-visible fiducial markers to simultaneously image a phantom. In the current study, linear array transducers made of 1-3 piezocomposite materials [10,11] were embedded in an ultrasound probe for use in an MRI gantry. The probe was made of nonmagnetic materials, and MR-visible fiducial markers were attached to it. The probe used in the gantry was connected to ultrasound equipment via a connector that passed through the walls shielding the MRI room and the control room. Crosstalk between the ultrasound equipment and the MRI scanner was reduced by grounding the connector.
Simultaneous imaging of an abdominal phantom and a human neck was performed to evaluate the feasibility of the proposed method. This was accomplished with US imaging equipment with 128 transmission/reception channels and a 1.5 T MRI scanner. Imaging of the phantom indicated that the error rate for the accuracy of sound velocity measurement was less than 6%, while the spatial resolution was 0.43 (the ratio of the lateral resolution before and after compensation), and the SNR was 8 dB. Simultaneous imaging of a human neck was performed to evaluate the compensation for image degradation due to the layer of subcutaneous fat. An acoustic standoff pad with a sound velocity similar to that of the fat tissue was inserted between the probe and the surface of the skin on the neck. Improvement in image quality was noted in the resulting image of the thyroid region. During imaging of the thyroid region in the neck, the spatial resolution (the ratio of the lateral resolution before and after compensation) was 0.60 and the SNR improved by 3 dB as compared to the SNR in the Region of Interest (ROI) without compensation. Nevertheless, the clinical feasibility of the proposed method, and especially its use in abdominal imaging, needs to be studied further.

2. Materials and Methods

2.1. Ultrasound Probe for Use in MRI

An ultrasound probe for use in an MRI gantry was developed to evaluate the feasibility of simultaneous US imaging and MRI. Array transducers made of 1-3 piezocomposite materials were embedded in the probe (Kyokutan, Japan Probe Co., Yokohama, Japan) as shown in Figure 1. The specifications of the array transducers are shown in Table 1. MR-visible fiducial markers were attached to the probe to indicate the probe position and orientation in a three-dimensional MR image. Each MR-visible fiducial marker was made of a polyoxymethylene (POM) sphere contained in an acrylic cylinder (9.00 mm in diameter and 8.50 mm in height) filled with olive oil, as shown in Figure 2. Since the marker appeared in an MRI as a dark sphere within a bright cylinder, the geometric center of the dark region served as the marker location. The eight markers were arranged in two rows in the probe as shown in Figure 1. The array transducers were arranged along the center line between the two rows. Thus, the location of the cross section of the ultrasound image was estimated based on the coordinates of the marker location in the MRI image. The transducer array was located along the central line between two rows formed by MR-visible fiducial markers. Thus, the cross section of an MRI image corresponding to a cross section of an ultrasound image was estimated as the plane through the central line and perpendicular to the lines formed by the pairs of markers. The central coordinates of each marker were calculated by MRI. The distance between the footprint of the transducer array and the marker array was measured in advance. Thus, the cross section of the ultrasound B-scan image was located in the coordinates of the MRI.

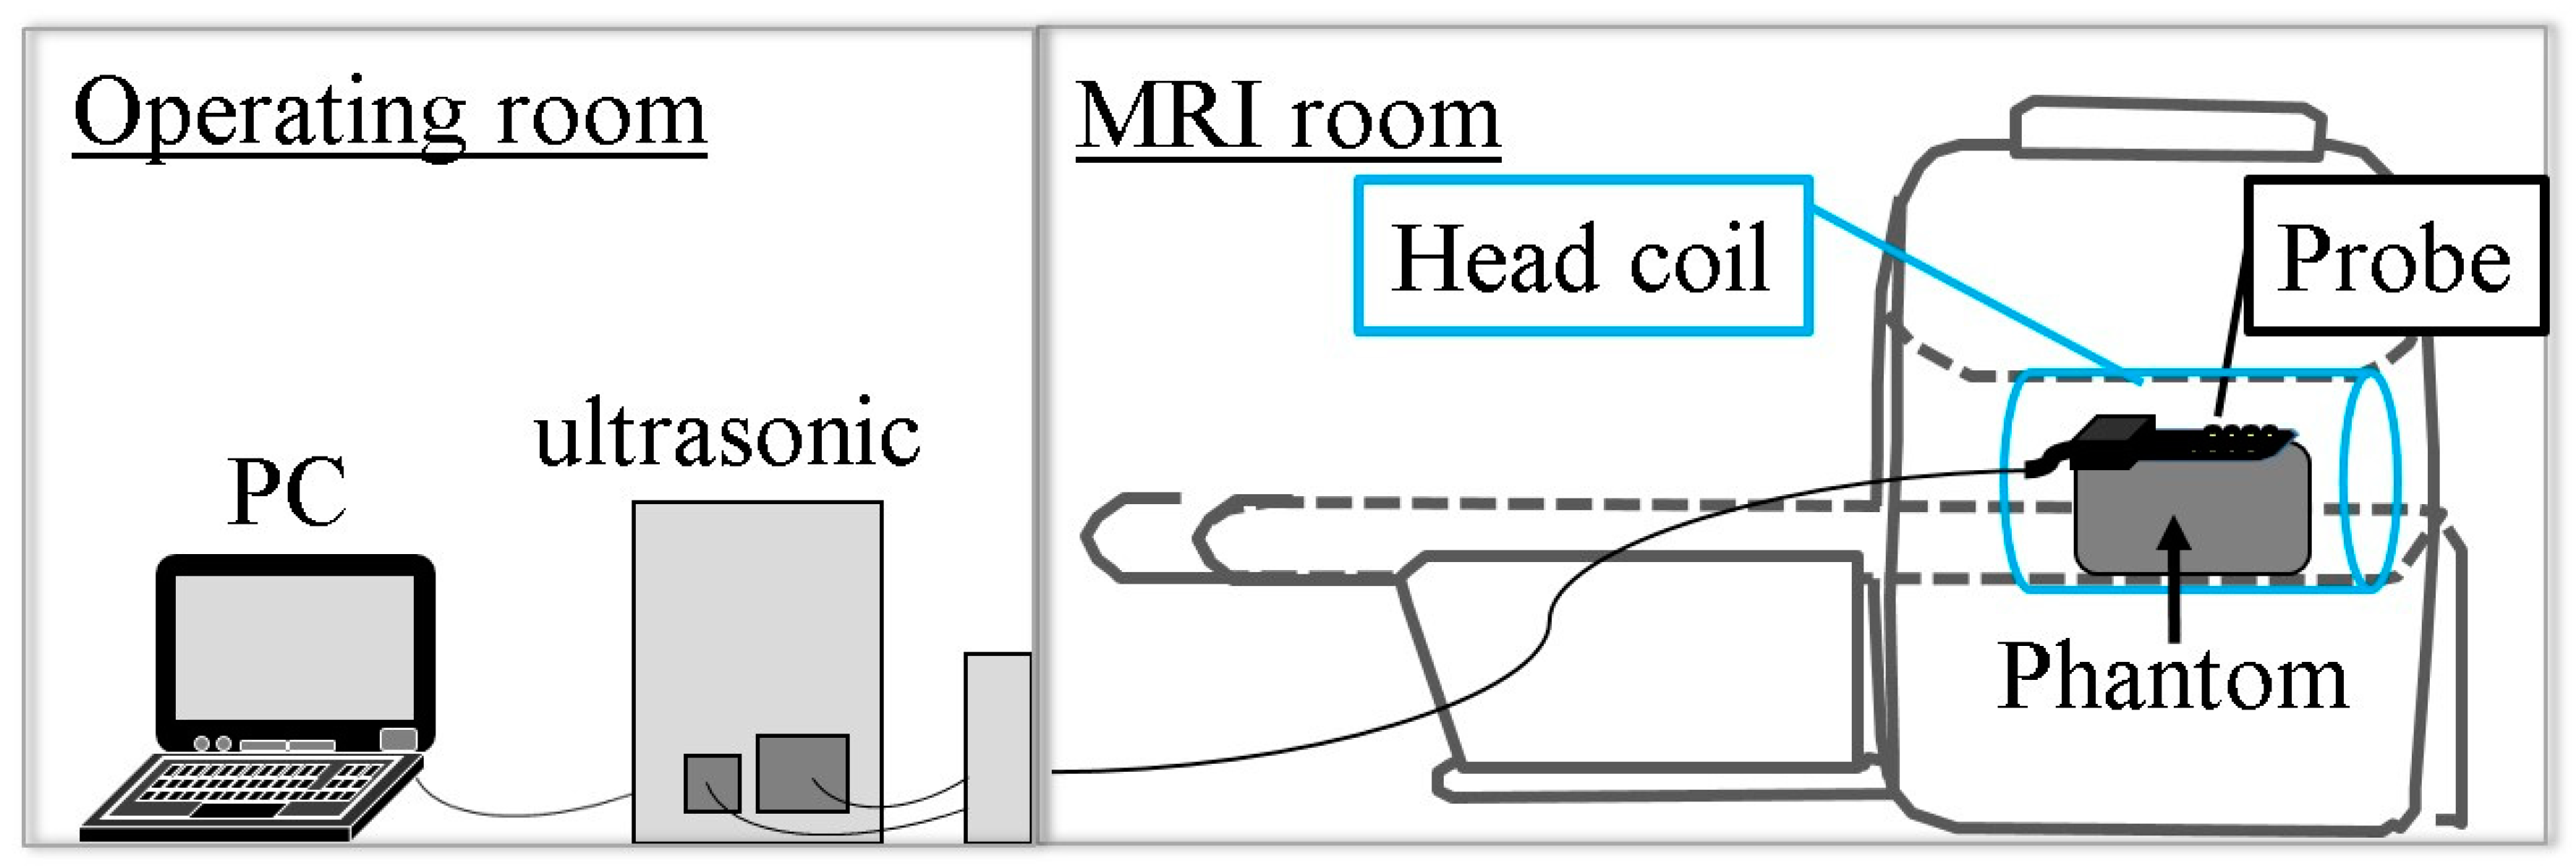
2.2. Simultaneous Multimodality Imaging System Using Ultrasound and Magnetic Resonance

This study used a simultaneous multimodality imaging system consisting of an MRI scanner (Echelon Vega, 1.5T, Hitachi Co., Tokyo, Japan) and US imaging equipment (RSYS0006MRF, Microsonic Co., Tokyo, Japan). The US imaging equipment was located in the control room as shown in Figure 3. The specifications of the US imaging equipment are shown in Table 2. The probe that was placed in the MRI scanner was connected to the US imaging equipment via a connector that passed through the walls shielding the MRI room and the control room. This connector was grounded in the MRI room to eliminate crosstalk between the MRI scanner and the US imaging equipment.
A B-scan image was formed by a dynamic focusing method applied to the echo signals received by array transducers. This focusing was obtained by the summation of delayed ultrasonic echo signals. The delay time sequence was calculated by the sound velocity and the path between an element of the array and a virtual focal point. Due to the conventional focusing method used, the sound velocity was assumed to have a constant value of 1540 m/s. The beamforming method proposed in this paper is a dynamic focusing technique that employs the sound velocity and the path estimated by simultaneous US imaging and MRI. This method can also be applied to the transmitting beam focusing technique if the sound velocity distribution is obtained by MRI. Through the use of simultaneous US imaging and MRI, beamform correction can be achieved for both the transmission and reception. Therefore, this method offers a novel approach to beamform correction.

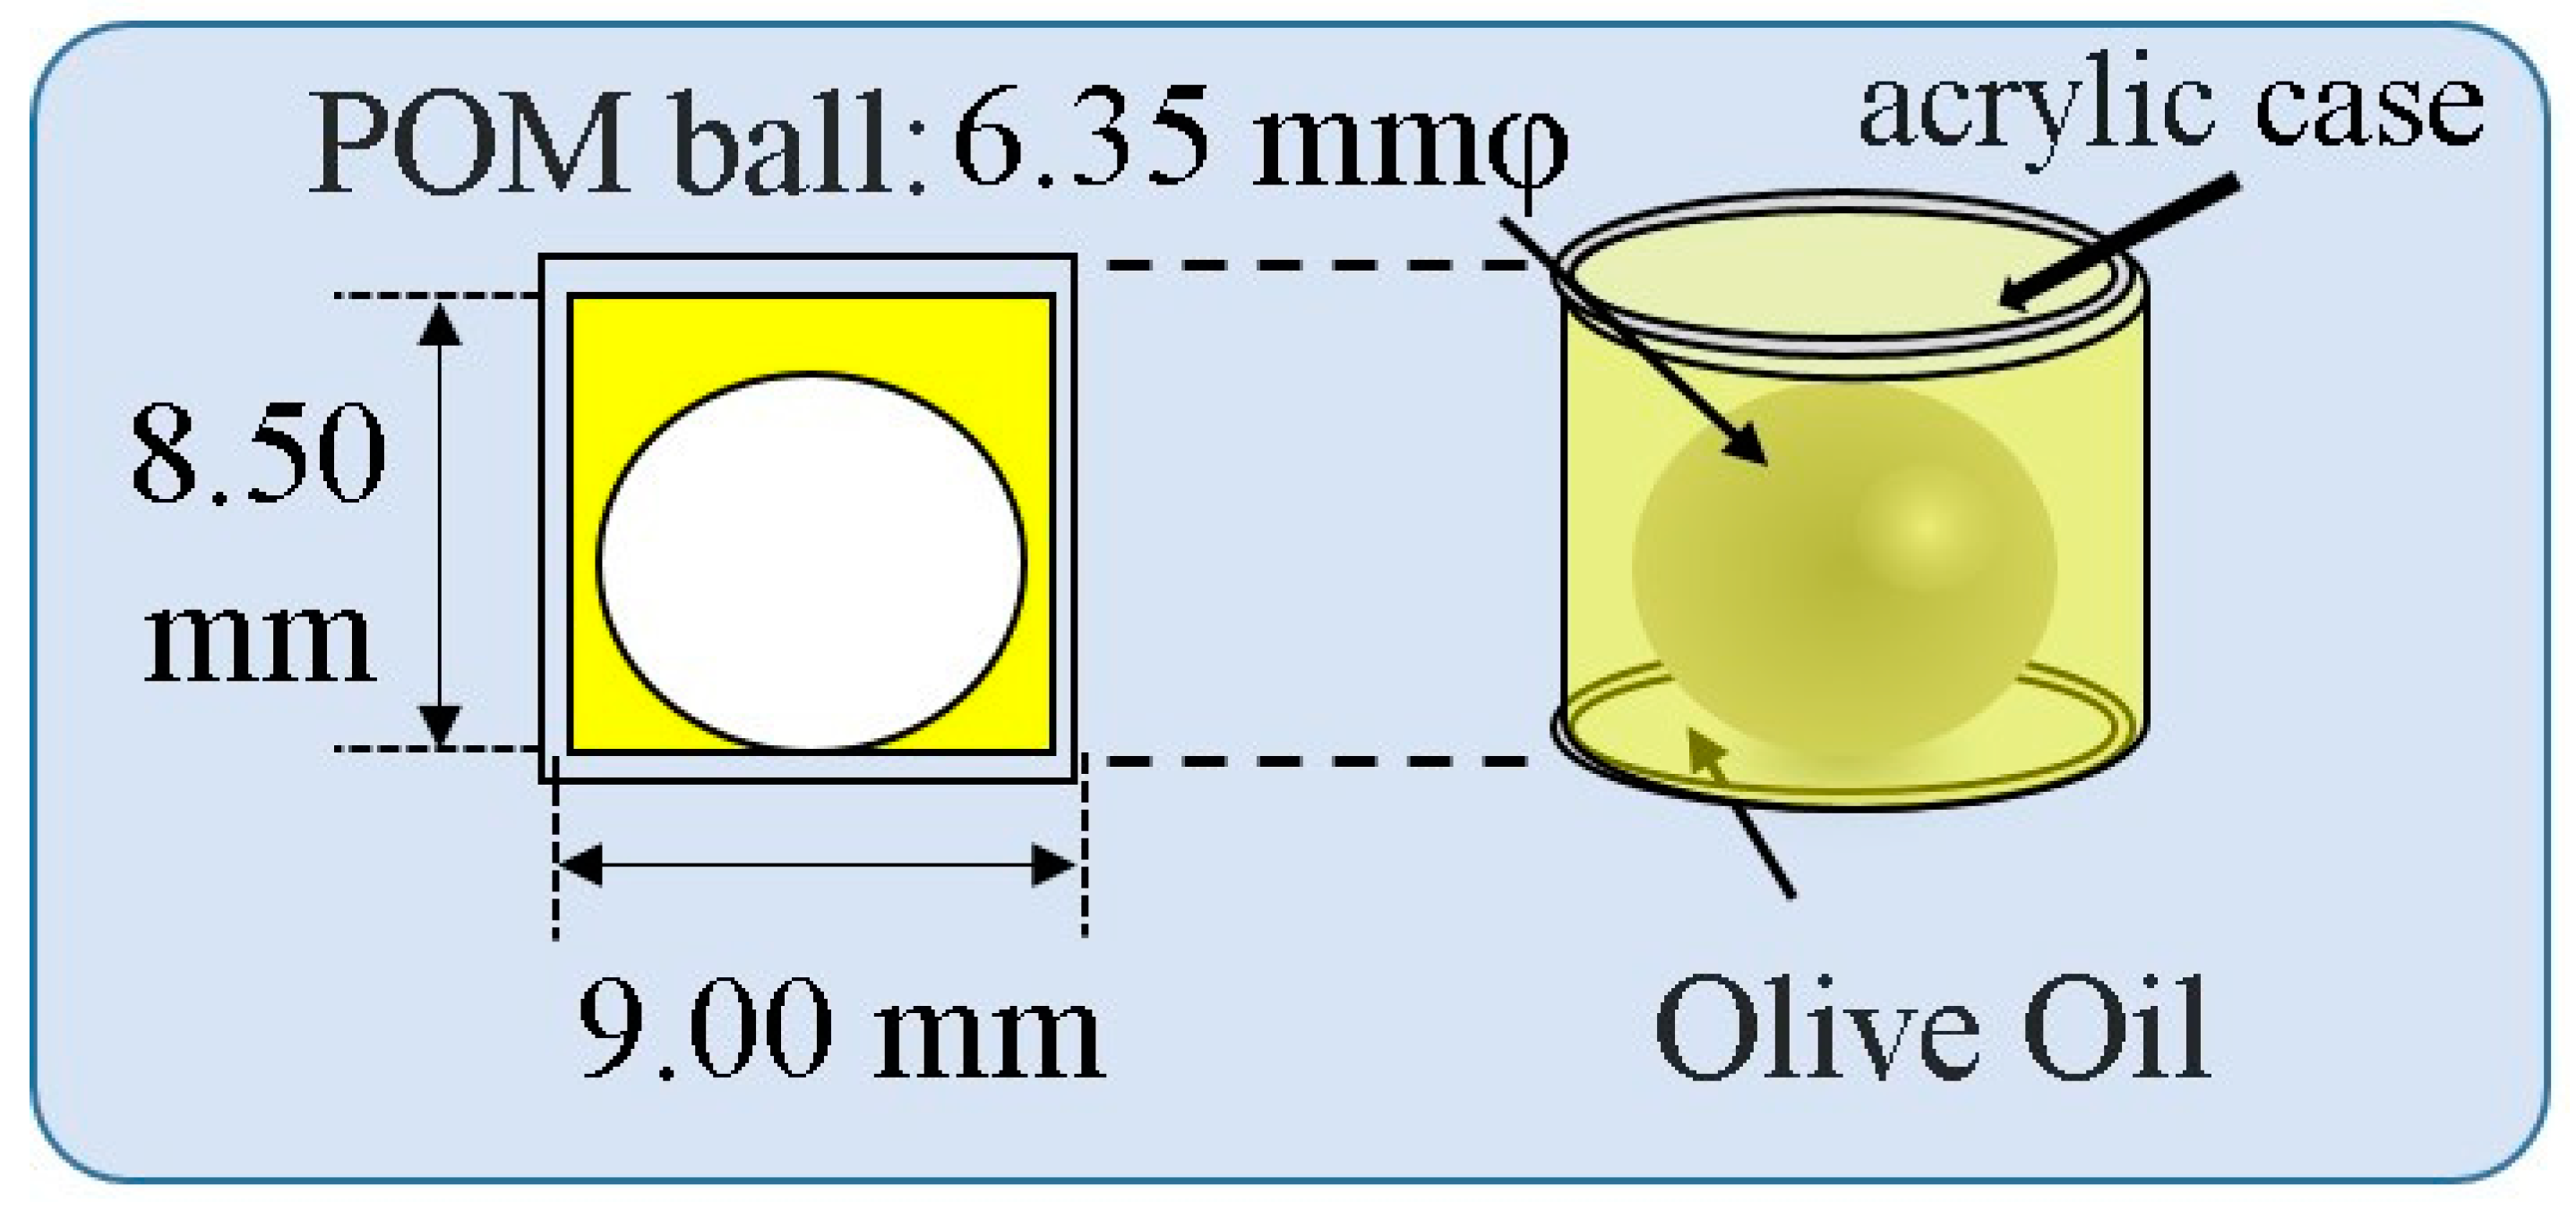
2.3. Measurement Method of Sound Velocity in Human Crus

An experiment was conducted to measure the sound velocity in human fat and muscle in the crus using the method of simultaneous US imaging and MRI. The probe was placed on the top of the crus. The focal length for the transmission beam was set at 30 mm. The MRI scan parameters for human crus imaging are shown in Table 3. An RF receiving coil for the knee was used in the MRI setup. The thickness, L, of muscle and fat was measured by MRI. The time-of-flight, T, was measured by using an ultrasonic echo signal. Thus, the sound velocity, c, was estimated to be c = 2L/T. The crura of three subjects were measured.

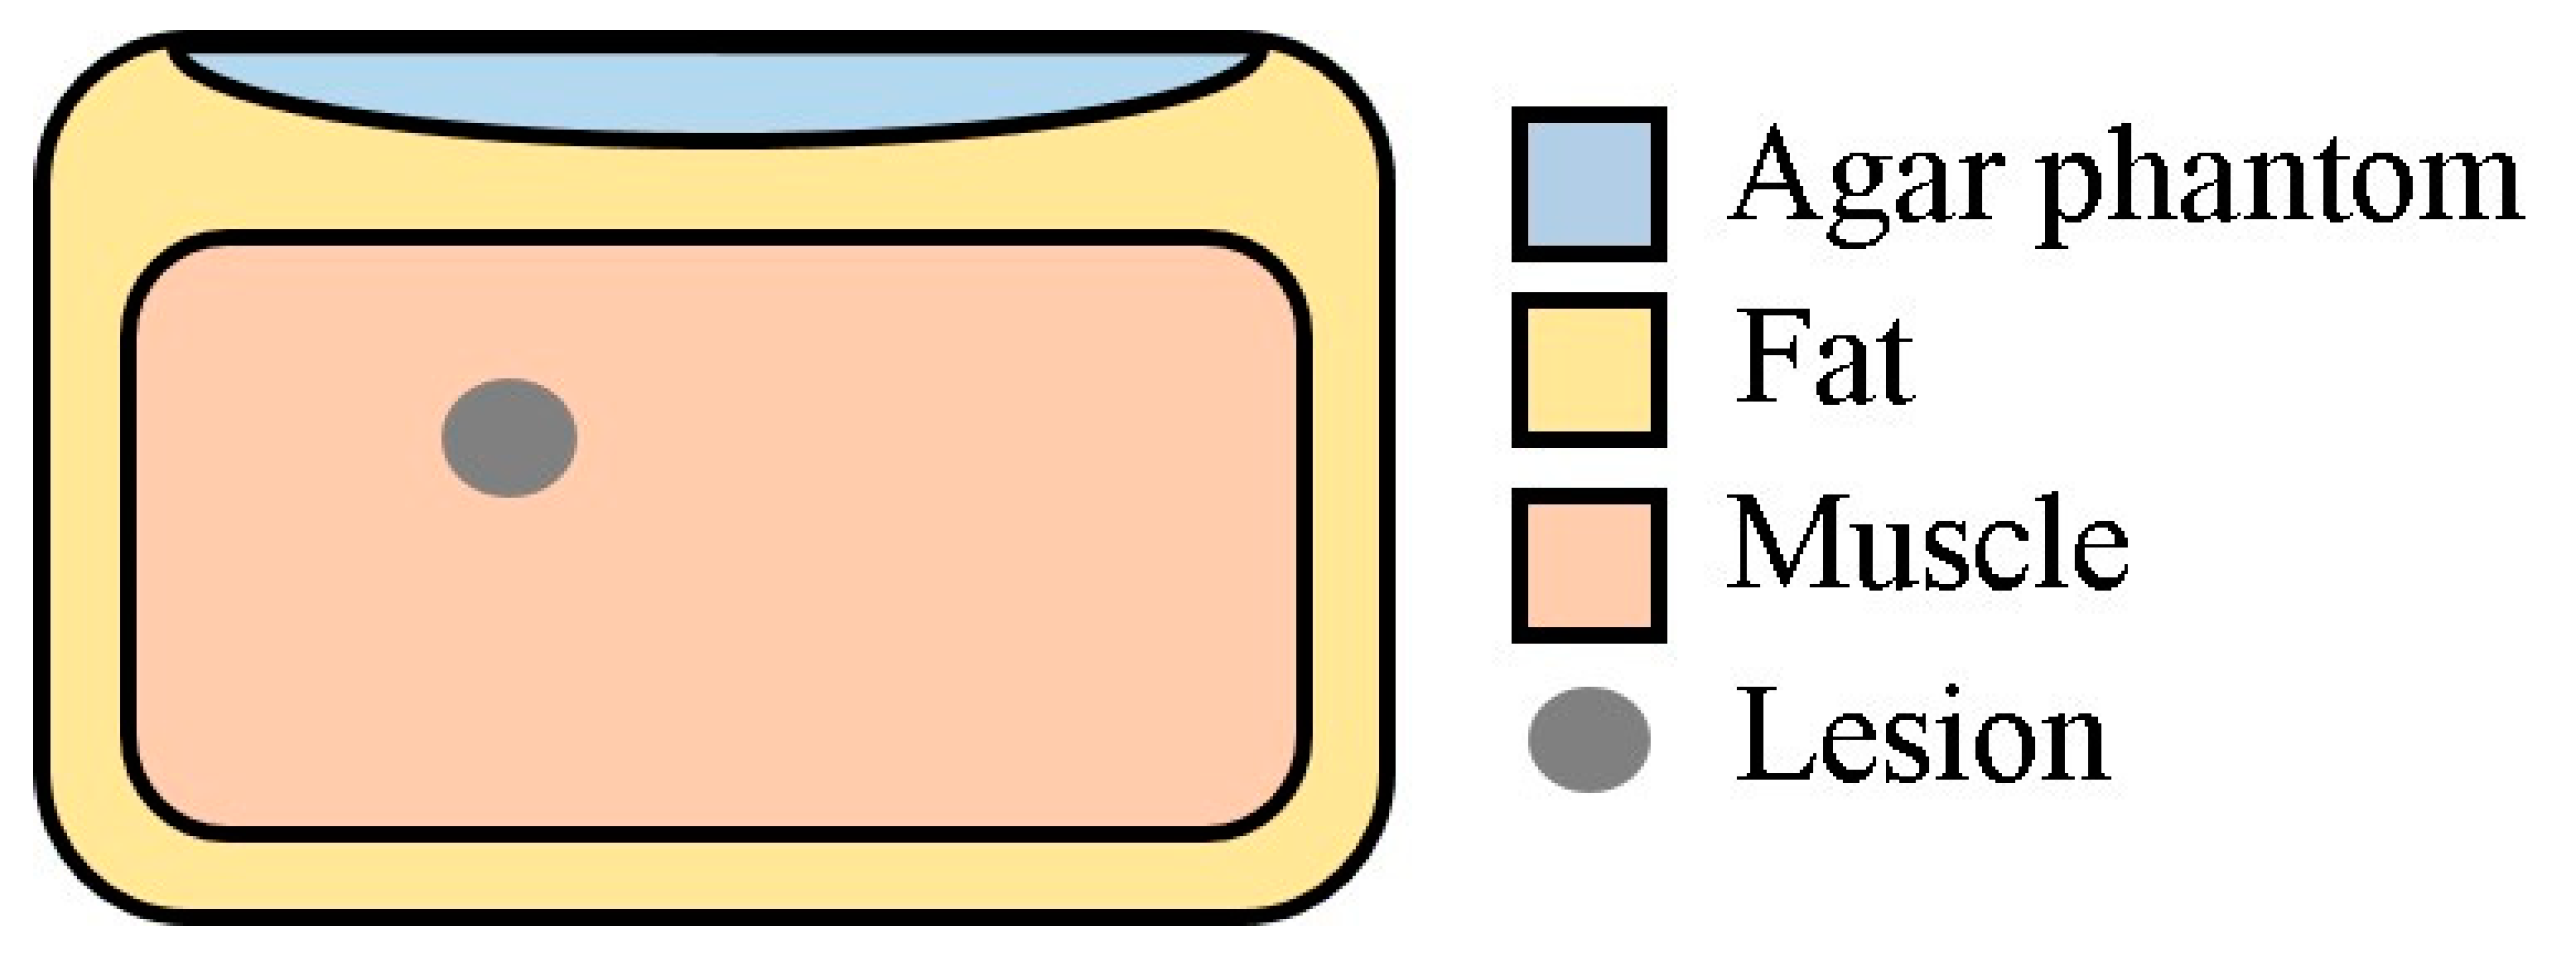
2.4. Experimental Imaging of an Abdominal Phantom using the Proposed Method of Compensating for the Sound Velocity Distribution to Correct Beamforming

An experiment was conducted to evaluate the accuracy with which the sound velocity distribution was measured during simultaneous US imaging and MRI of an abdominal phantom. Image degradation was compensated for by correcting beamforming using the measured sound velocity distribution. The Model 075A abdominal phantom (Triple Modality 3D Abdominal Phantom, CIRS, USA) was used in the experiment. The probe was placed on the top of the phantom. Agar gel containing 5% glycerol was placed between the phantom and the probe to avoid air cavities, as shown in Figure 4. The driving waveform to the transducers was a square wave containing 1.5 sinusoidal waves. The pulse repetition time was 190 μs. The focal length for the transmission beam was set at 30 mm using the conventional array focusing technique. Since the phantom consists of four regions with different sound velocities as shown in Figure 4, the sound velocity in each region was estimated using simultaneous US imaging and MRI. For each region, the length was represented by L and the time-of-flight was represented by T, so the sound velocity c was estimated to be c = 2L/T. The delay time for each element to form a beam must be calculated based on the estimated value of sound velocity on the path from an element to an arbitrary position during simultaneous imaging.
The signal processing was as follows: (1) RF data acquisition of 128 elements in a 128-channel digital format at 12 bits and 31.25 MHz; (2) the RF data of each channel were delayed by a certain amount of time calculated by Equations (1) or (2); (3) after quadrature detection at 5.0 MHz, the magnitude was calculated; and (4) the B-scan image was calculated using the logarithmic magnitude in a dynamic range of 60 dB.
For the conventional dynamic focusing in reception, the delay time of the ith element of the transducers τi is expressed as
τ i = ( i Δ x a / 2 ) 2 2 c l F
where Δx is the element pitch, a is the aperture length, c is the sound velocity, and lF is the focal length.
For the proposed compensated dynamic focusing in reception, the delay time of the ith element of the transducers τi is expressed as
τ i = k = 1 N l k c k + k = 1 N 0 l 0 k c 0 k
where N is the number of the region with the same sound velocity along the ultrasound propagation path from the ith element to the focal point, ck is the sound velocity in the kth region, and lk is the length of the path through the kth region. The subscript of 0 indicates the path from the center element of the aperture to the focal point. The region with the same sound velocity is estimated by MRI. MRI scan parameters for abdominal phantom imaging are shown in Table 4.

2.5. Experimental Imaging of the Human Neck

An experiment was conducted to measure the sound velocity distribution during simultaneous US imaging and MRI of the human neck. Image degradation due to a layer of subcutaneous fat was compensated for by correcting beamforming. The experimental setup was the same as that shown in Figure 3. Image quality significantly degrades due to a layer of subcutaneous fat in the abdominal region. An MRI scan takes 20 min. As the imaging time increases, the spatial resolution decreases due to heartbeat and respiration. MRI images need to be obtained with a high spatial resolution in order to significantly improve image quality. Thus, the neck region of a male healthy volunteer was imaged to avoid motion artifacts. Since the subject had a thin layer of subcutaneous fat in his neck, an acoustic standoff pad (Model AC-1, Acoustic standoff pads, ATS Laboratories Co., Nofolk, VA, USA) was placed between the ultrasound probe and the surface of the skin of the neck to mimic a layer of subcutaneous fat. This pad had a thickness of 10 mm and a sound velocity of 1410 m/s [12]. MRI scan parameters for human neck imaging are shown in Table 4.

3. Results and Discussion

3.1. Experimental Results of the Measurement of Sound Velocity in Human Crus

The transducer array was located along the central line between two rows formed by MR-visible fiducial markers. Thus, the cross section of an MRI image corresponding to a cross section of an ultrasound image was estimated as the plane through the central line and perpendicular to the lines formed by the pairs of markers. The resultant cross section of the MRI image is shown in Figure 5.
The estimated values of the sound velocity in human muscle and fat tissue in the crus for three subjects are shown in Table 5. The sound velocities in fat and muscle were measured as 1450 ± 20 m/s and 1560 ± 20 m/s, respectively. The sound velocities in human fat and muscle measured in vitro are typically in the ranges of 1459–1479 m/s and 1540–1566 m/s, respectively [1]. Those values are in approximate agreement with those obtained in this study, i.e., falling within the standard deviation.

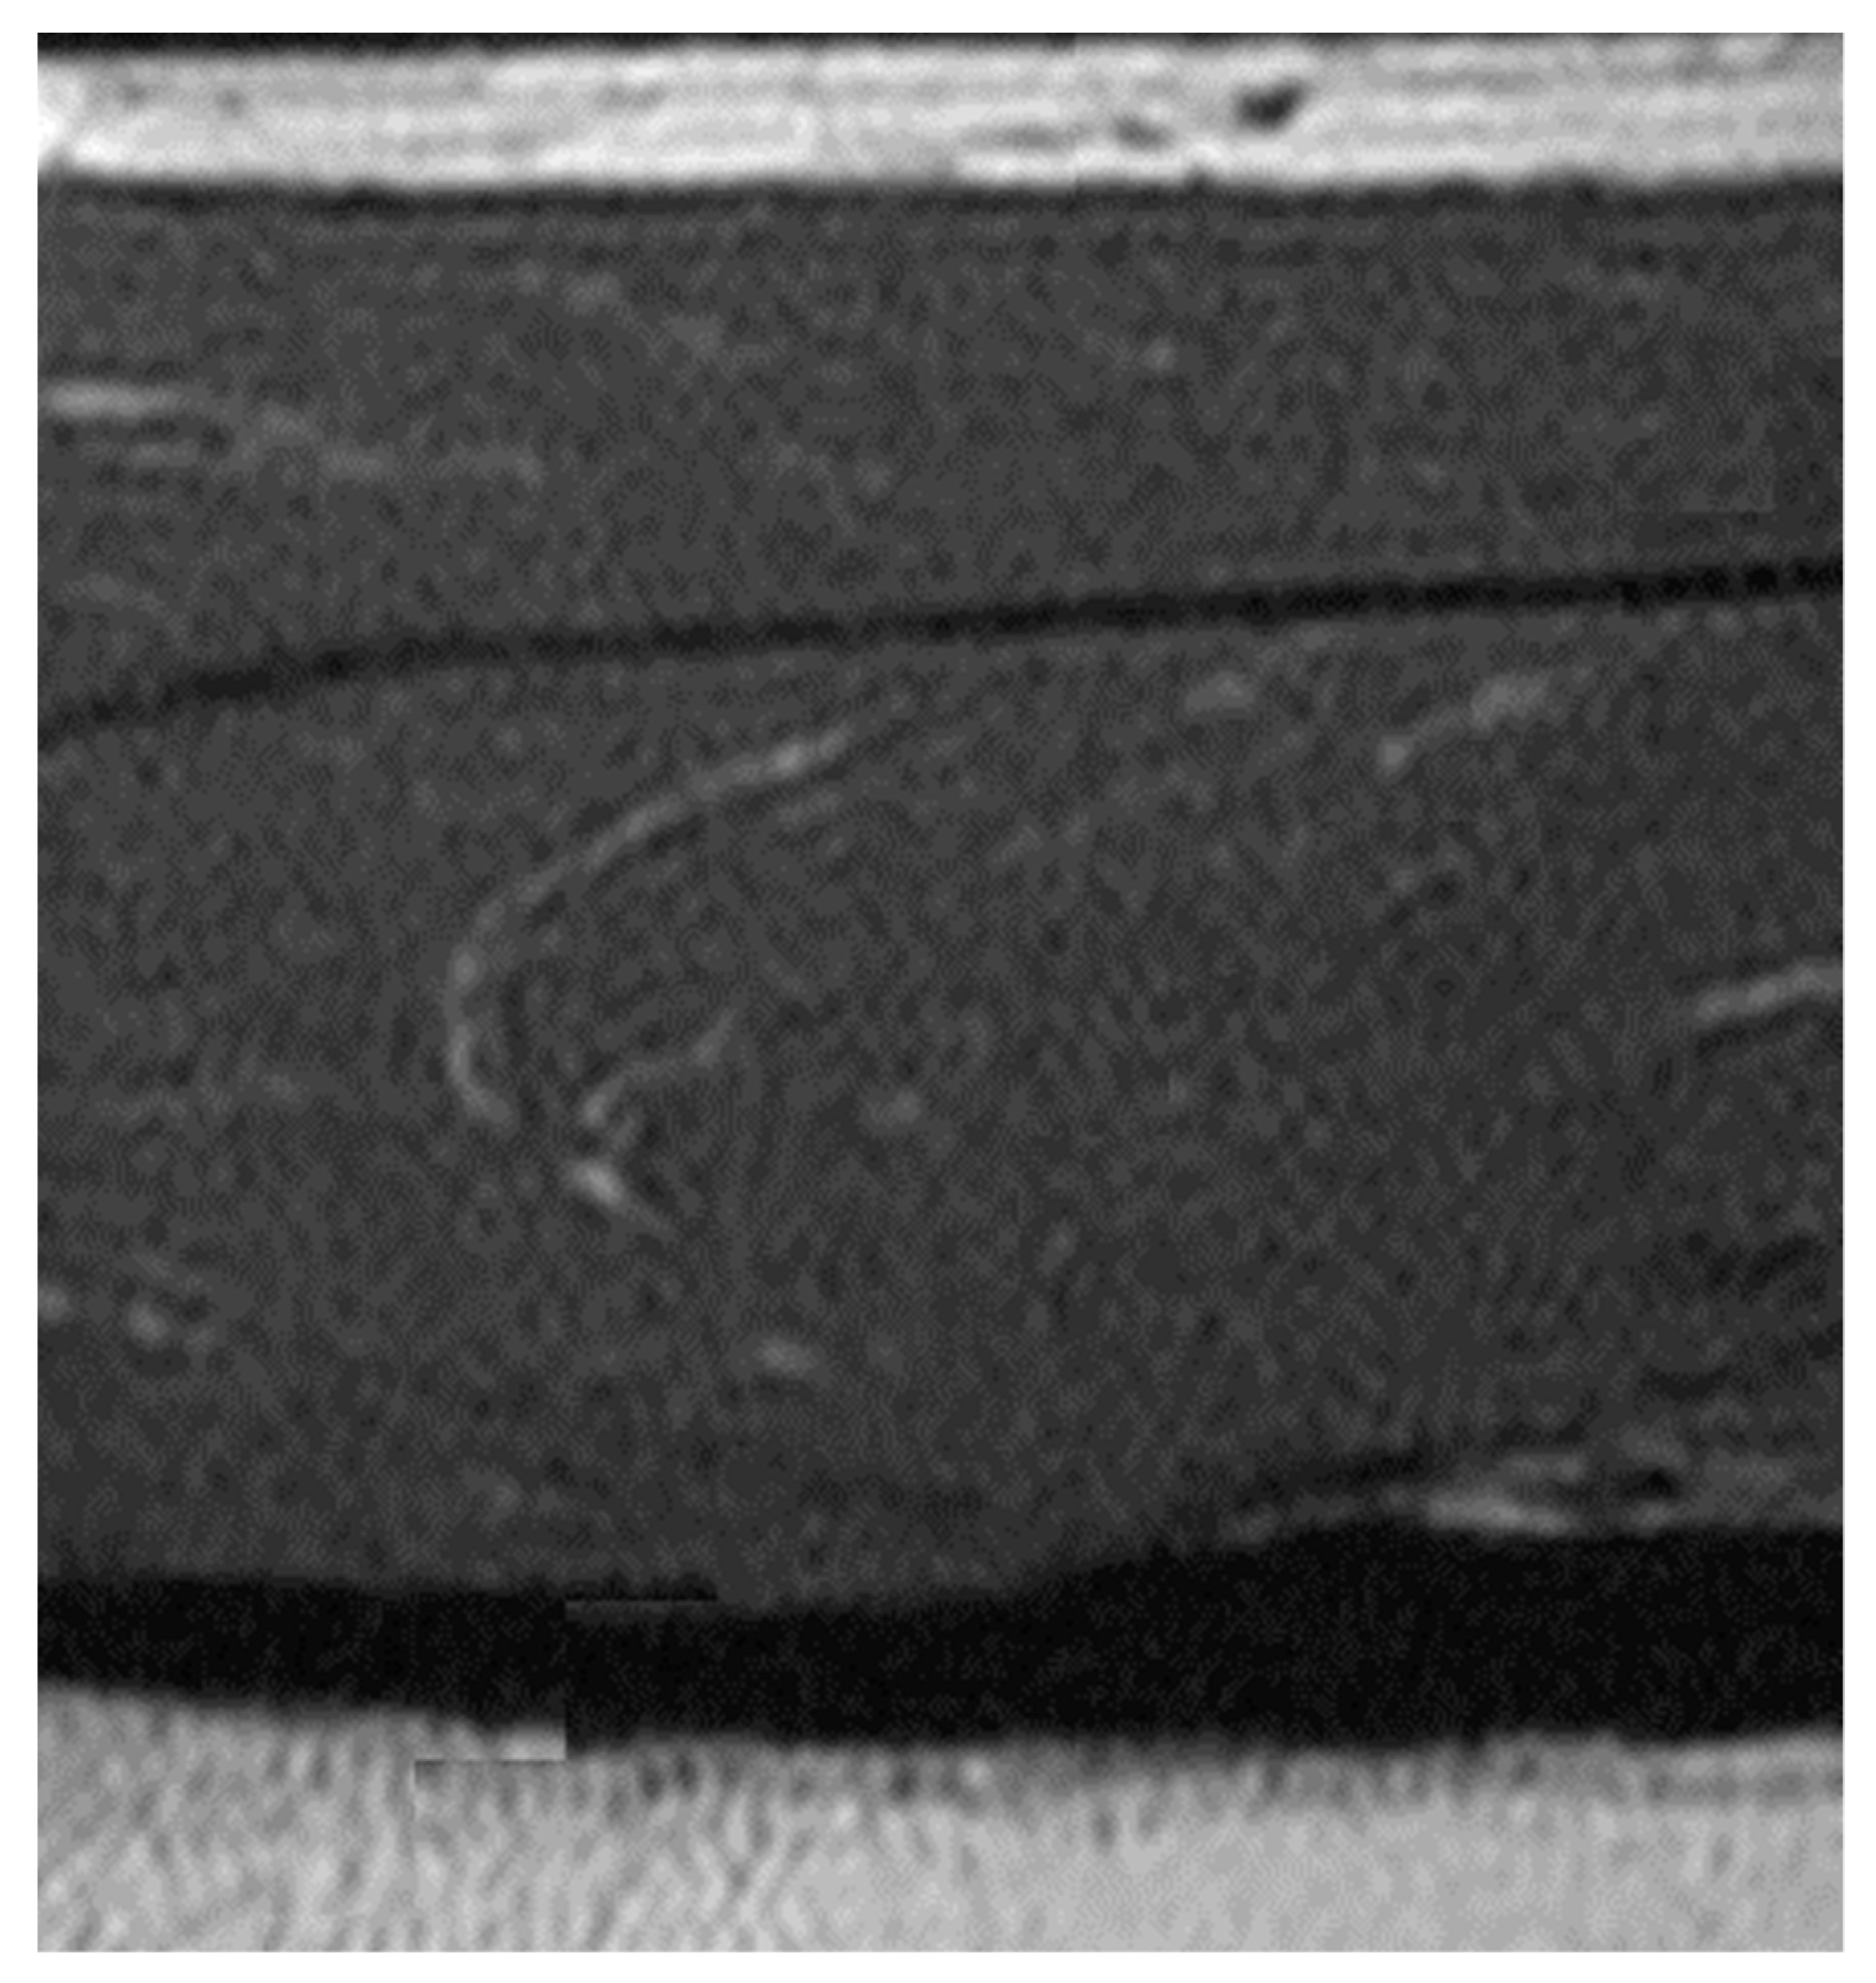
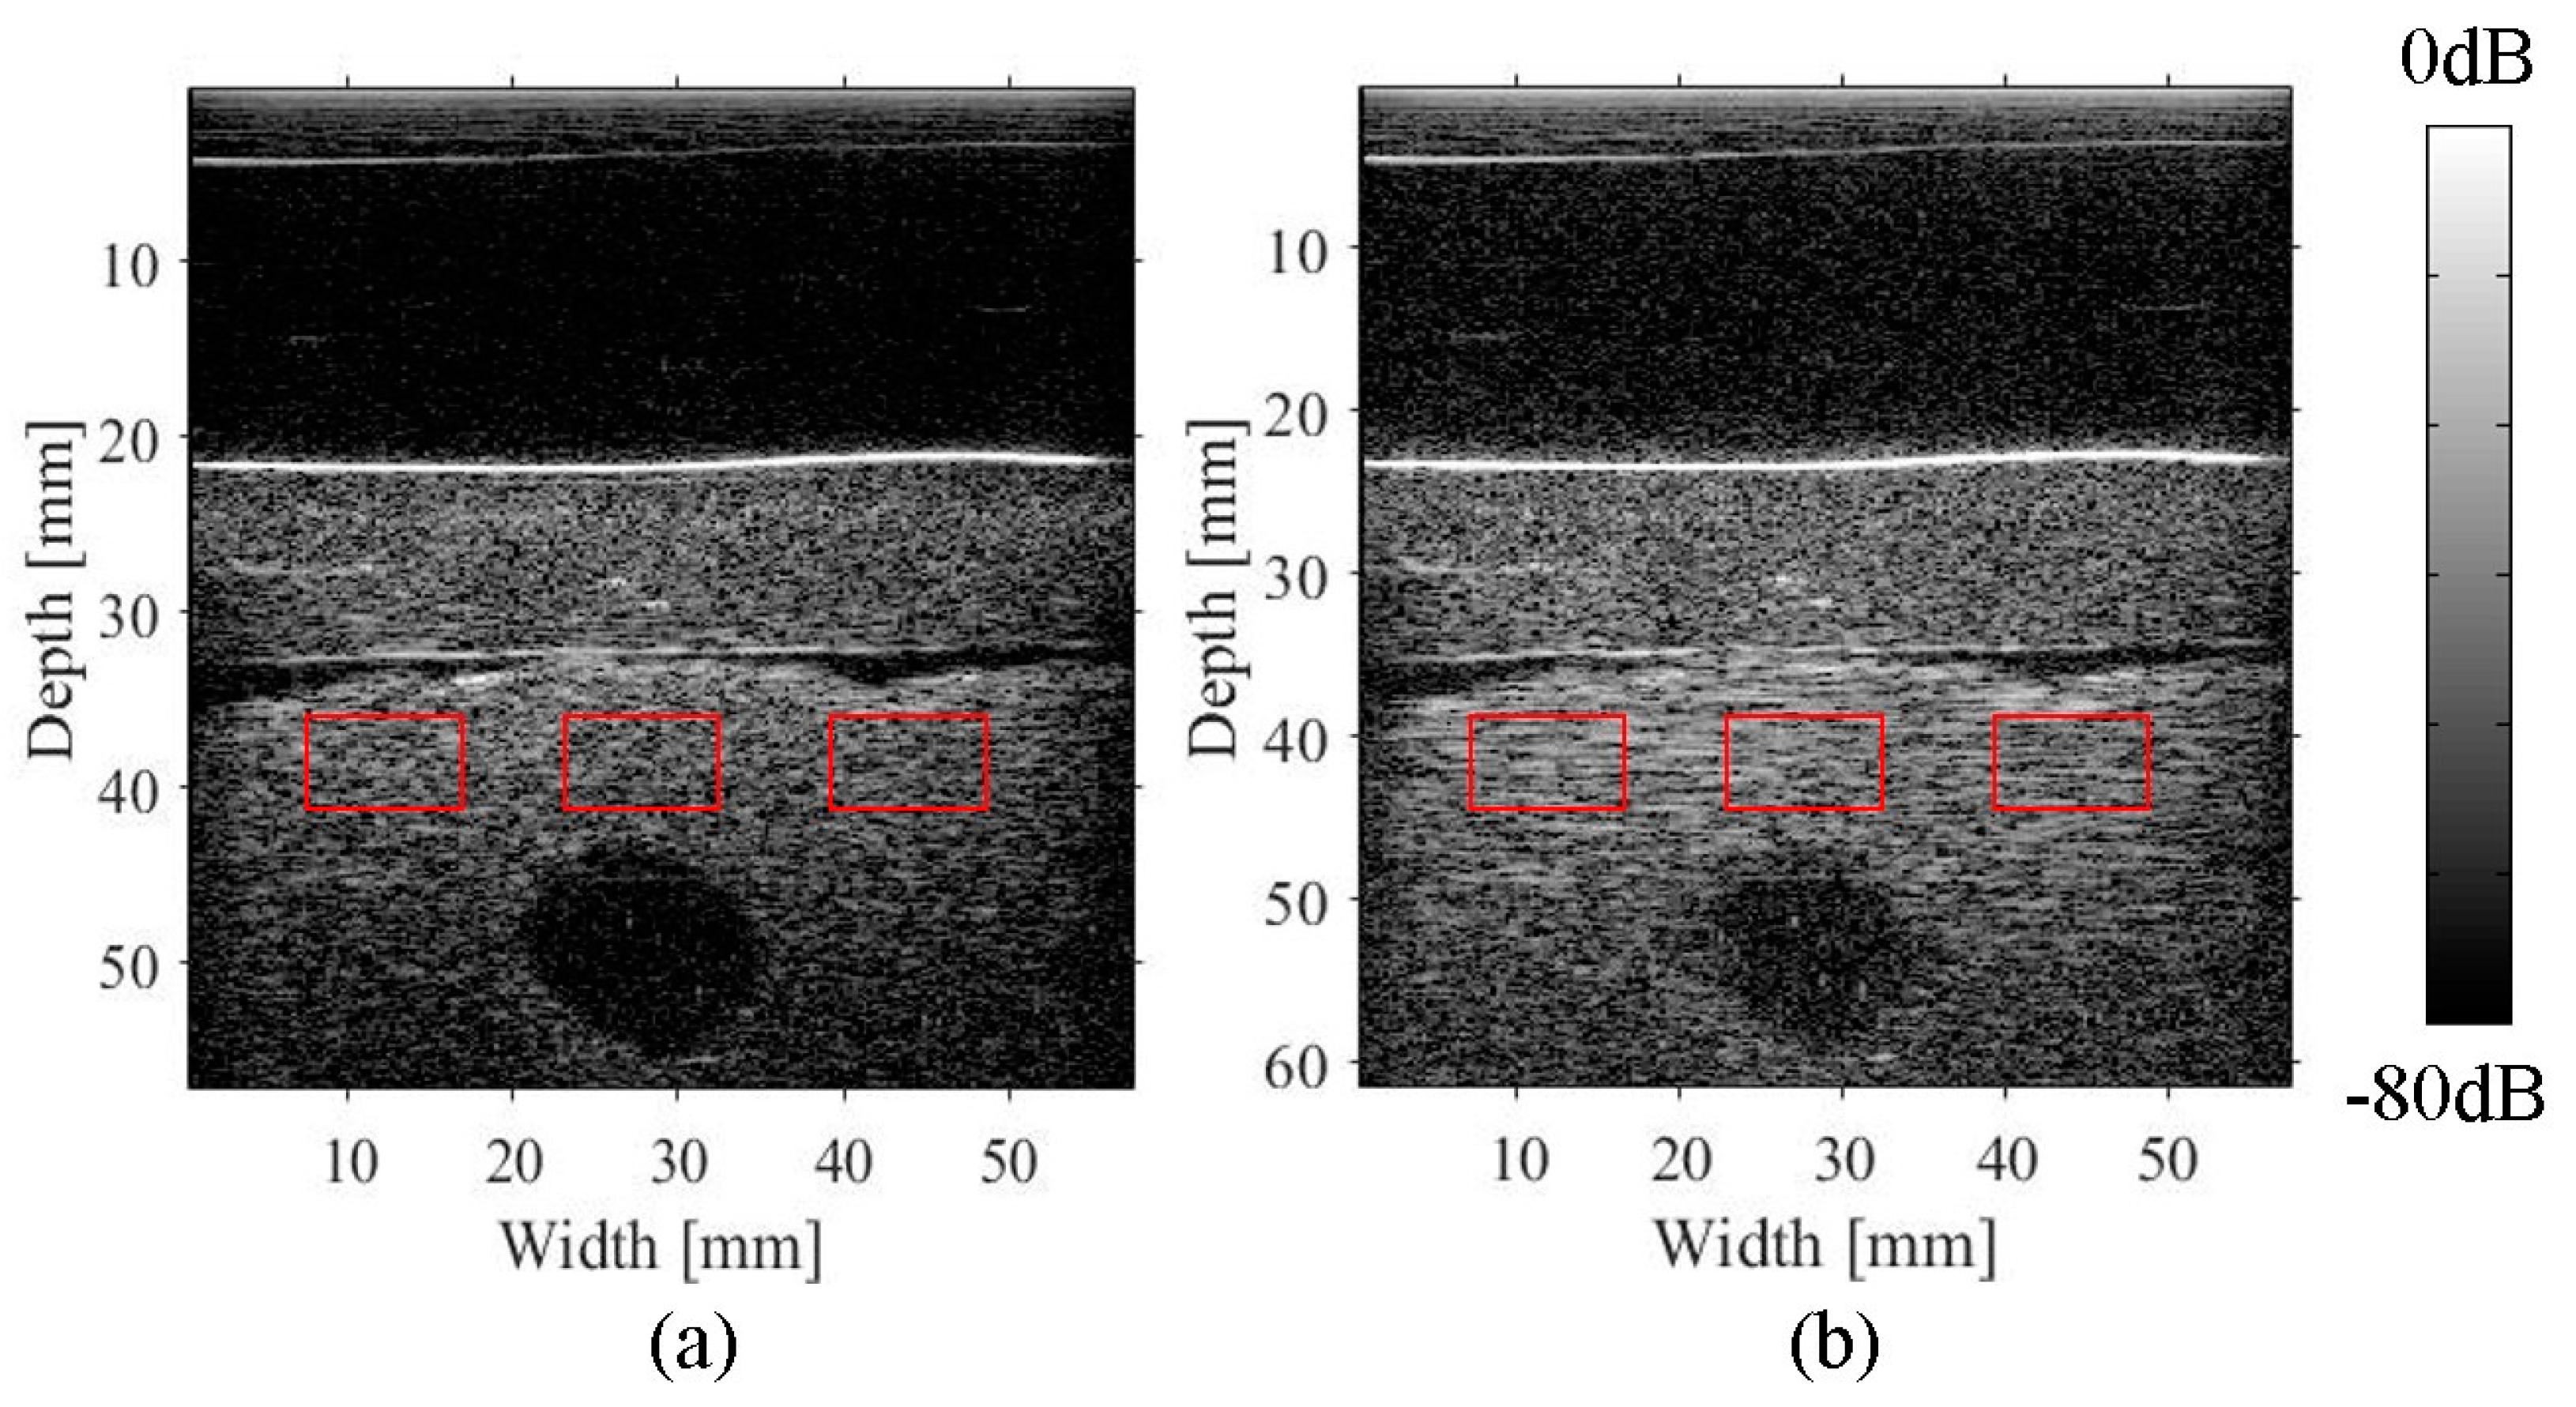
3.2. Imaging of an Abdominal Phantom

The results of the simultaneous imaging of an abdominal phantom are described as follows. The cross section of an MRI image was estimated based on MR-visible fiducial markers in the corresponding cross section of an ultrasound image, as shown in Figure 6. The sound velocity was estimated to be 1500 m/s in the agar gel and 1430 m/s in the fat-mimicking region. Image degradation was compensated for by using a sound velocity of 1540 m/s for the soft-tissue-mimicking region. The resulting image was compared to an ultrasound image that was obtained by assuming a sound velocity with a uniform distribution as shown in Figure 7. Fine specks are evident in the lower layer of fat in the compensated image, as shown in Figure 7a, although the margins of darker regions are indistinct. Similar specks are evident in the horizontal direction in a conventional B-scan image as shown in Figure 7b. This image was obtained when a constant sound velocity of 1540 m/s was used in beamforming. The margins of the darker circular region are clearly evident compared to those in the compensated image. Image degradation due to a fluctuation in sound velocity was improved by correcting beamforming using the estimated sound velocity distribution. To improve the spatial resolution, the half-width of the autocorrelation function in the horizontal direction was calculated for the three red squares shown in Figure 7; the half-width of the autocorrelation function is defined as the distance equal to half of the maximum value of the autocorrelation function. The calculated half-widths are shown in Table 6. The average ratio of improvement was 0.43. The SNR is defined as the signal power divided by the noise power; the signal power is calculated as the square of the maximum value in the transmitting focal region and the noise power is calculated as the standard deviation in the ROI. The improvement in the SNR was calculated to be 8 dB based on the images shown in Figure 7a,b.

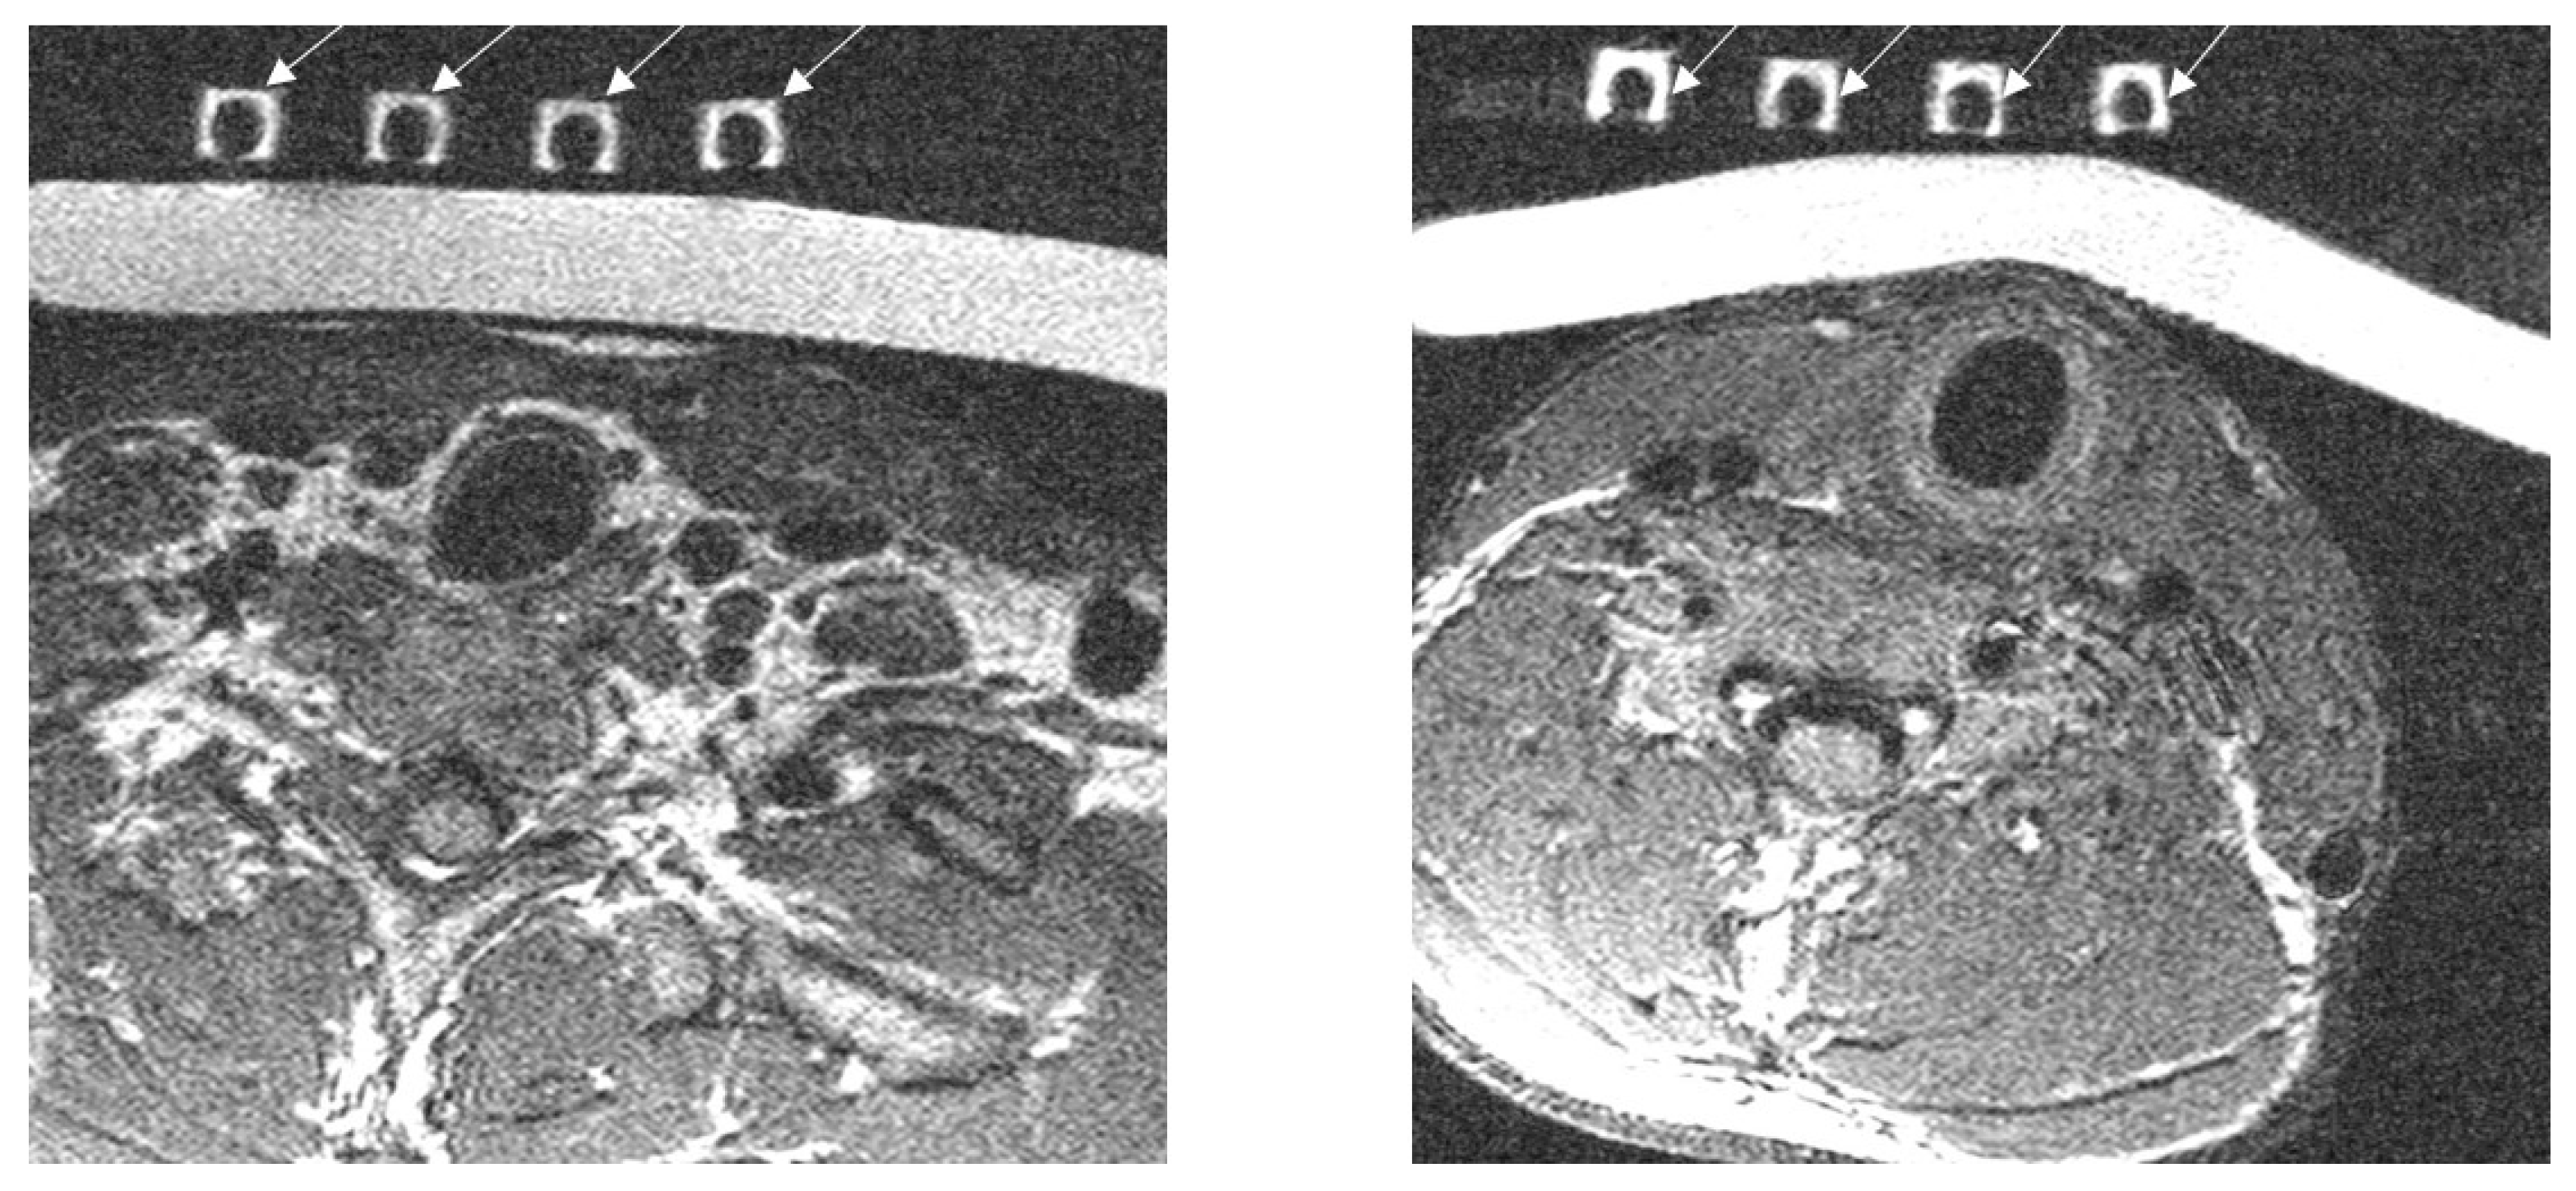
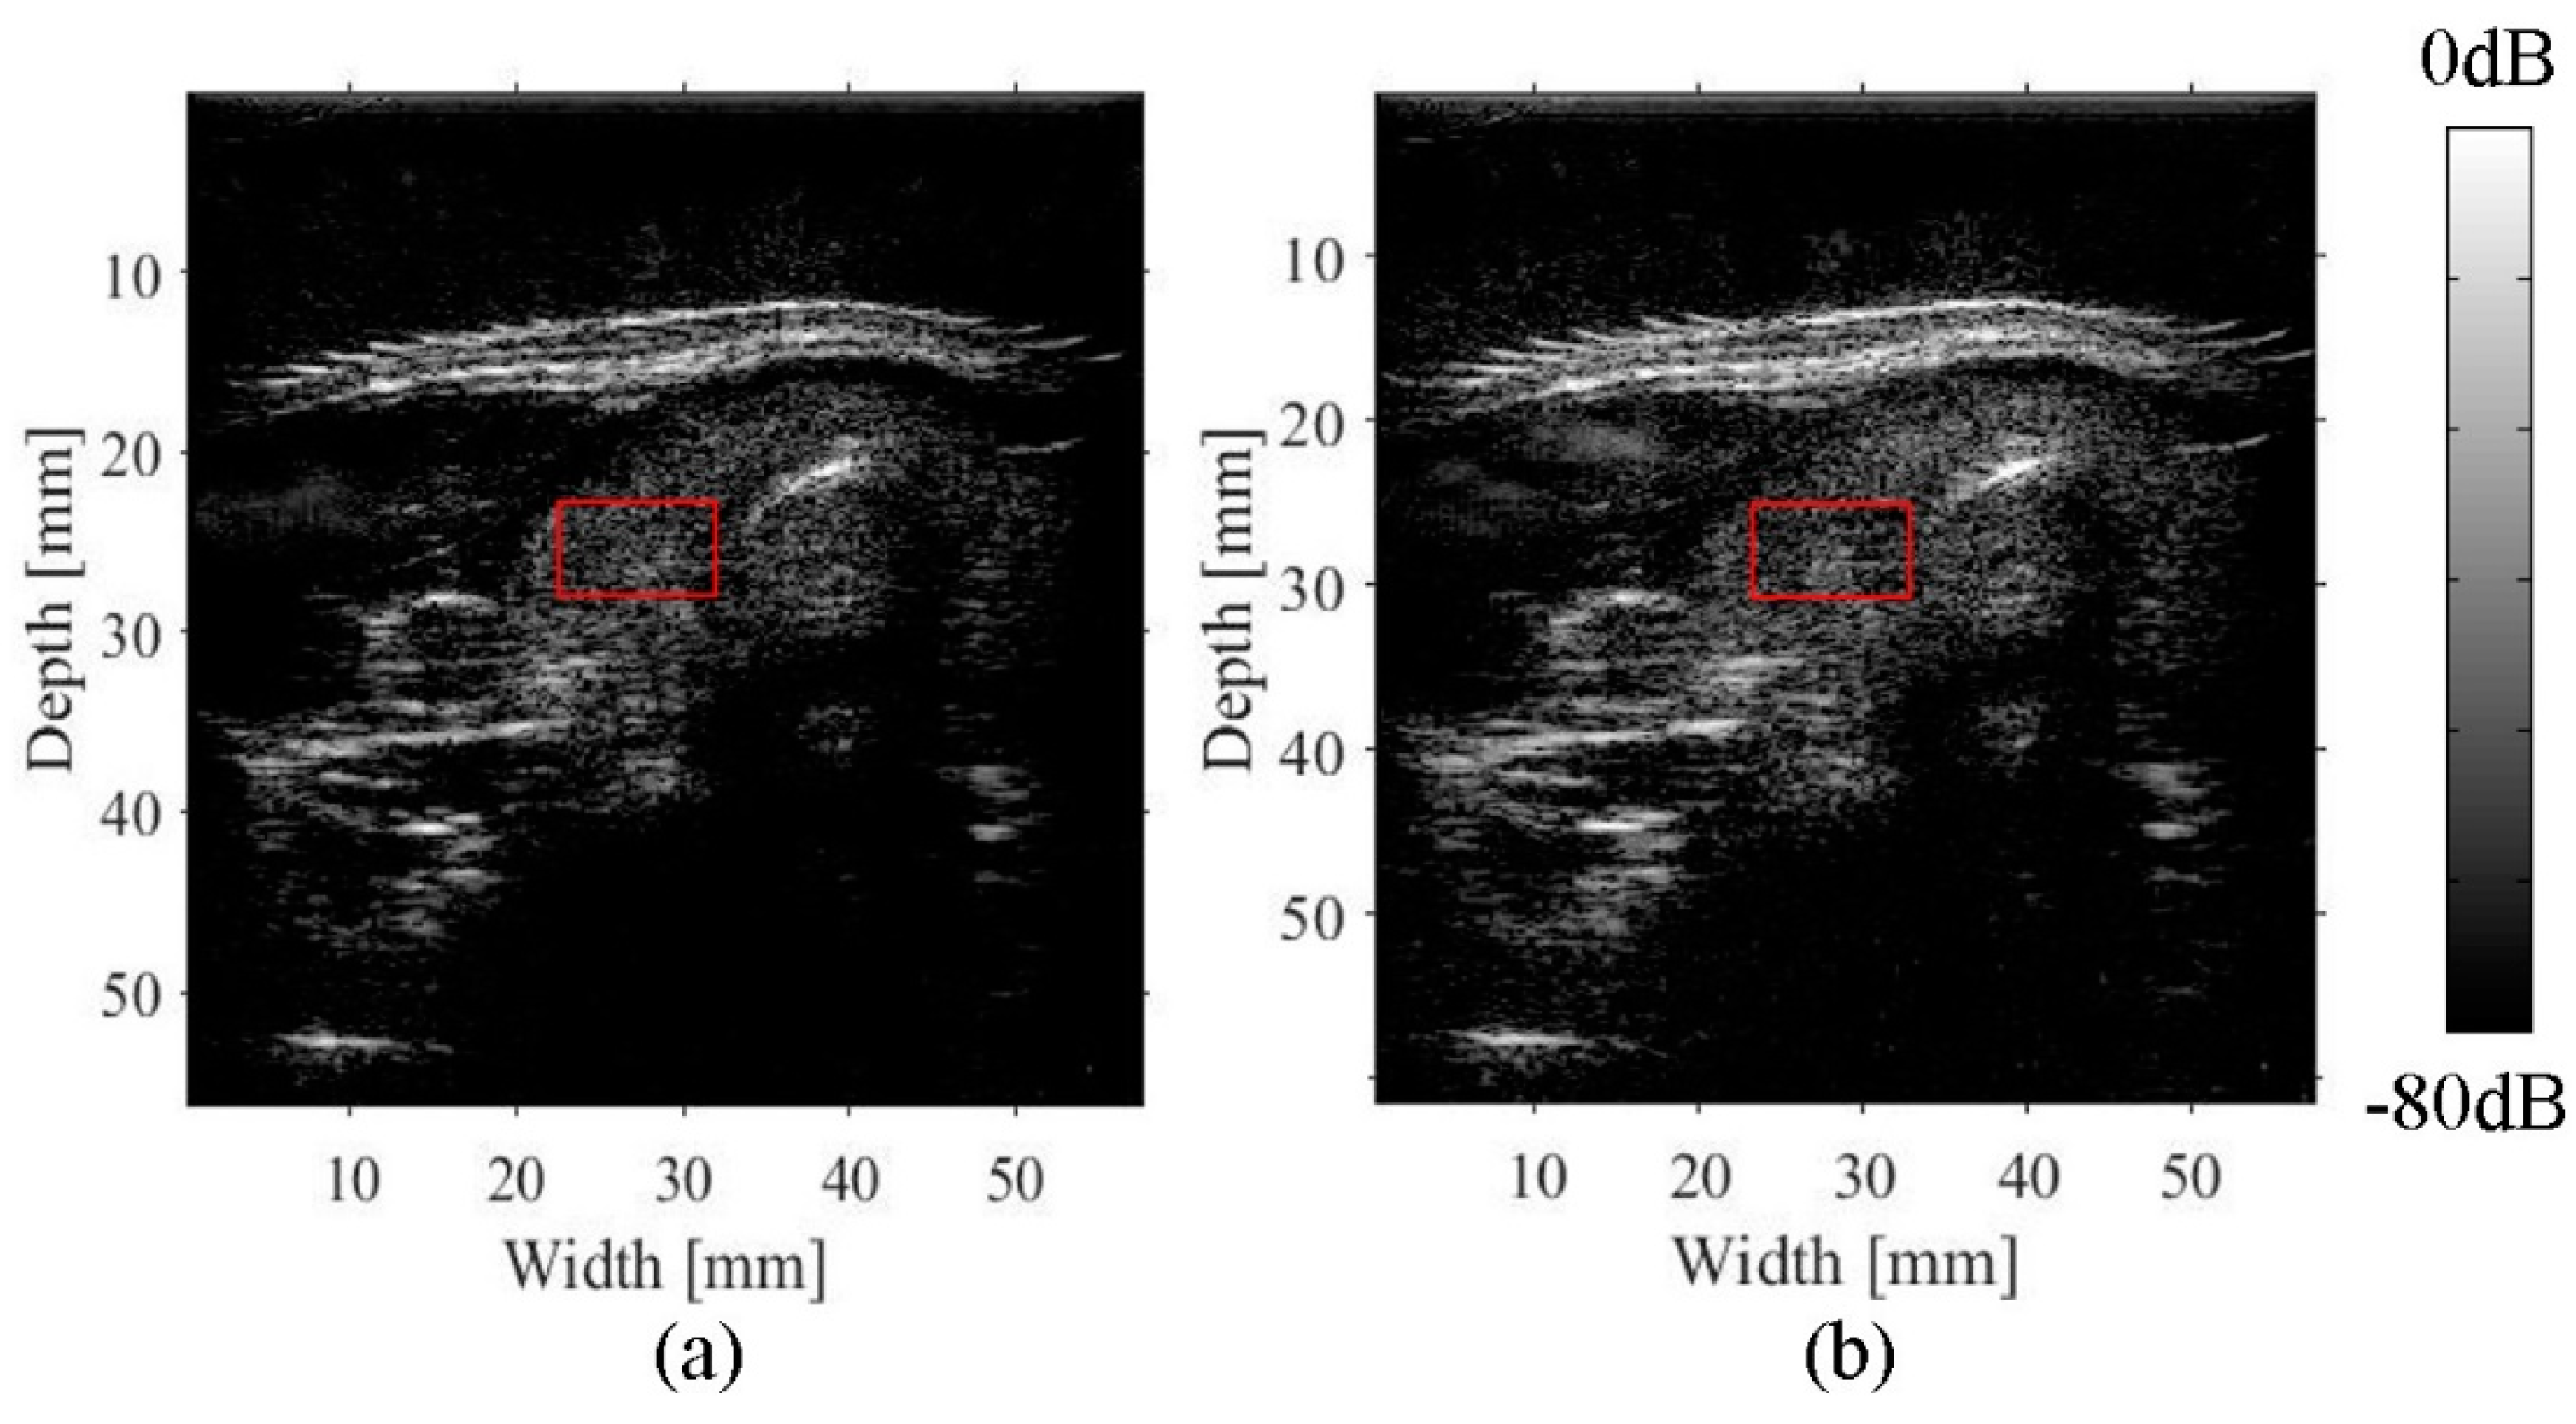
3.3. Imaging of the Neck

The simultaneous application of US imaging and MRI to the neck was performed to determine the feasibility of the proposed method of compensation. Examples of T1-weighted images that were obtained with the simultaneous imaging system are shown in Figure 8. The MR-visible fiducial markers that were attached to the ultrasound probe are indicated by the arrows in Figure 8. The cross section of an MR image corresponding to the cross section of an ultrasound image is shown in Figure 9. First, the sound velocity in the acoustic gel pad was estimated as 1360 m/s by simultaneous US imaging and MRI. The difference between the estimated value and the reference value was 50 m/s. Beamforming was corrected using an estimated sound velocity of 1360 m/s for the pad and a sound velocity of 1540 m/s for biological tissues in the neck region. The resulting image was compared to a conventional B-scan image as shown in Figure 10. Image degradation due to variations in the sound velocity was reduced by compensating for the sound velocity, as shown in Figure 10a. Without compensation, the conventional B-scan image was blurred as a result of fluctuations in the sound velocity, as shown in Figure 10b. To determine the improvement in the spatial resolution, the half-width of the autocorrelation function in the horizontal direction was calculated for the region of the red square shown in Figure 10. The ratio of the half-width of the autocorrelation in the conventional image with that in the compensated image was calculated to be 0.60. The improvement in the SNR was 3 dB. The results indicated that simultaneous US imaging and MRI is a feasible way to reduce image degradation due to layers of subcutaneous fat by compensating for the sound velocity to correct beamforming.

4. Conclusions

US imaging based on the pulse-echo method assumes that the sound velocity has a constant value in the imaging media. In general, a conventional B-scan imaging system uses a sound velocity of 1540 m/s as the mean value for biological soft tissues. Since the sound velocity for biological tissues ranges from 1400 m/s to 1600 m/s, differences in the sound velocity affect beamforming and cause image degradation. In particular, the sound velocity for fat tissue is 10% slower than the mean value for biological soft tissues, so a thick layer of subcutaneous fat degrades image quality in terms of the spatial resolution and SNR. Thus, this study proposed a method of compensating for image degradation due to fluctuations in sound velocity. This method uses simultaneous multimodality imaging with US and magnetic resonance to estimate the distribution of the sound velocity in order to correct beamforming. An experiment was conducted with a phantom and imaging of a human neck was performed to evaluate the feasibility of the proposed method. A cross section of an MRI image and the corresponding cross section of an ultrasound image were compared to accurately measure the sound velocity. An MR-visible fiducial marker was developed and attached to an ultrasound probe for use in an MRI gantry. The experiment with a phantom indicated that the spatial resolution and SNR improved. During imaging of the human neck, an acoustic standoff pad was placed between the ultrasound probe and the surface of the skin of the neck to mimic a layer of subcutaneous fat. The sound velocity in the pad was estimated using simultaneous US imaging and MRI. Imaging of the neck indicated that the correction of the beamforming using the estimated sound velocity resulted in improved image quality for the thyroid region. The current results indicated that the proposed method is a feasible form of beamform correction in terms of improvements in the spatial resolution and SNR.

Author Contributions

Conceptualization, I.A.; methodology, K.I., I.A.; software, K.I.; validation, K.I., I.A.; formal analysis, K.I., I.A.; investigation, K.I., S.A., K.N.; resources, I.A.; data curation, K.I., S.A., K.N.; writing—original draft preparation, K.I.; writing—review and editing, K.I., I.A.; visualization, K.I., S.A.; supervision, I.A.; project administration, I.A.; funding acquisition, I.A.

Acknowledgments

This study was supported by the MEXT-Support Program to Strategic Research Foundation at Private Universities, 2013–2017. The authors wish to thank Kazuya Niyagawa of Ricoh Co., Ltd. for his help with fiducial processing.

Conflicts of Interest

The authors declare no conflict of interest.

References

  1. Goss, S.A.; Johnston, R.L.; Dunn, F. Comprehensive compilation of empirical ultrasonic properties of mammalian tissues. J. Acoust. Soc. Am. 1978, 64, 423–457. [Google Scholar] [CrossRef] [PubMed]
  2. Robinson, D.E.; Ophir, J.; Wilson, L.S.; Chen, C.F. Pulse-Echo Ultrasound Speed Measurements: Progress and Prospects. Ultrasound Med. Biol. 1991, 17, 633–646. [Google Scholar] [CrossRef]
  3. Kondo, M.; Takamizawa, K.; Hirama, M.; Okazaki, K.; Iinuma, K.; Takehara, Y. An evaluation of an in vivo local sound speed estimation technique by the crossed beam method. Ultrasound Med. Biol. 1990, 16, 65–72. [Google Scholar] [CrossRef]
  4. Anderson, M.E.; Trahey, G.E. The direct estimation of sound speed using pulse–echo ultrasound. J. Acoust. Soc. Am. 1998, 104, 3099–3106. [Google Scholar] [CrossRef] [PubMed]
  5. Benjamin, A.; Zubajlo, R.E.; Dhyani, M.; Samir, A.E.; Thomenius, K.E.; Grajo, J.R.; Anthony, B.W. Surgery for Obesity and Related Diseases: I. A Novel Approach to the Quantification of The Longitudinal Speed of Sound and Its Potenital for Tissue Characterization. Ultrasound Med. Biol. 2018. [Google Scholar] [CrossRef] [PubMed]
  6. Aoki, T.; Nitta, N.; Furukawa, A. Non-invasive speed of sound measurement in cartilage by use of combined magnetic resonance imaging and ultrasound: An initial study. Radiol. Phys. Technol. 2013, 6, 480–485. [Google Scholar] [CrossRef] [PubMed]
  7. Nitta, N.; Kaya, A.; Misawa, M.; Hyodo, K.; Numano, T. Accuracy improvement of multimodal measurement of speed of sound based on image processing. Jpn. J. Appl. Phys. 2017, 56, 07JF17. [Google Scholar] [CrossRef]
  8. Curiel, L.; Chopra, R.; Hynynen, K. Progress in Multimodality Imaging: Truly Simultaneous Ultrasound and Magnetic Resonance Imaging. IEEE Trans. Med. Imaging 2007, 26, 1740–1746. [Google Scholar] [CrossRef] [PubMed] [Green Version]
  9. Tang, A.M.; Kacher, D.F.; Lam, E.Y.; Wong, K.K.; Jolesz, F.A.; Yang, E.S. Simultaneous Ultrasound and MRI System for Breast Biopsy: Compatibility Assessment and Demonstration in a Dual Modality Phantom. IEEE Trans. Med. Imaging 2008, 27, 247–254. [Google Scholar] [CrossRef] [PubMed]
  10. Smith, W.A.; Shaulov, A.; Auld, B.A. Tailoring the properties of composite piezoelectric materials for medical ultrasonic transducers. In Proceedings of the 1985 IEEE Ultrasonics Symposium, San Francisco, CA, USA, 16–18 October 1985; pp. 642–647. [Google Scholar]
  11. Smith, W.A. Modeling 1–3 Composite Piezoelectrics: Hydrostatic Response. IEEE Trans. Ultrason. Ferroelectr. Freq. Control 1993, 40, 41–49. [Google Scholar] [CrossRef] [PubMed]
  12. Lynch, T.; (Computerized Imaging Reference Systems, Incorporated (CIRS)). Personal communication, 2018.
Figure 1. Top view of the prototype ultrasound probe for use in MRI. Array transducers made of 1-3 piezocomposite materials were embedded in the probe (Kyokutan, Japan Probe Co., Yokohama, Japan). The specifications of the array transducers are shown in Table 1. MR-visible fiducial markers were attached to the probe to locate the probe position and orientation in a three-dimensional MRI image.
Applsci 08 02133 g001
Figure 2. MR-visible fiducial marker. (POM: polyoxymethylene).
Applsci 08 02133 g002
Figure 3. A simultaneous multimodality imaging system consisting of ultrasound (US) imaging equipment (RSYS0006MRF, Microsonic Co., Tokyo, Japan) and an MRI scanner (Echelon Vega, 1.5T, Hitachi Co., Tokyo, Japan). The probe that was placed in the MRI scanner was connected to the US imaging equipment via a connector that passed through the walls shielding the MRI room and the control room.
Applsci 08 02133 g003
Figure 4. Composition of the phantom used in the experiment.
Applsci 08 02133 g004
Figure 5. An example of an MRI image of a human crus. The fat layer corresponds to the upper high-brightness region. The sound velocity in fat was measured in the central fat layer. The sound velocity in muscle was measured in the central muscle region between the bottom of the fat layer and the top of the fascia layer (lower-brightness horizontal stripe region).
Applsci 08 02133 g005
Figure 6. Cross section of an MRI image corresponding to that of an ultrasound image.
Applsci 08 02133 g006
Figure 7. Comparison of B-mode images of the phantom obtained using the proposed method of compensation (a) and a conventional approach (b). The three red squares indicate ROIs for calculation of the autocorrelation function for a B-mode image.
Applsci 08 02133 g007
Figure 8. Examples of MR images obtained using the simultaneous multimodality imaging system. Each image corresponds to a cross section, and rows of fiducial marker arrays are indicated by arrows. The probe was equipped with two rows of marker arrays, as shown in Figure 1.
Applsci 08 02133 g008
Figure 9. The estimated cross section of the MR image corresponding to the cross section of the ultrasound image according to coordinates of MR-visible fiducial markers.
Applsci 08 02133 g009
Figure 10. B-mode images of the neck obtained using the proposed method of compensation (a) and a conventional approach (b). A red square indicates a ROI in part of the thyroid for the autocorrelation function in each B-mode image.
Applsci 08 02133 g010
Table 1. Specifications of the array transducers used in MRI.
Bandwidth (MHz)Number of ElementsElement Pitch (mm)Element Size (mm)Focal Length of Acoustic Lens (mm)
5–81920.308.0 × 0.2020
Table 2. Specifications of US imaging equipment.
Maximum Number of Probe Interface ChannelsNumber of TX/RX ChannelsA/D Resolution (Bits)Sampling Frequency (Hz)Memory Capacitance Channel (MB)
2561281231.25256
Table 3. MRI scan parameters for human crus.
SequenceTRTEThicknessSlicesFrequency EncodingPhase Encoding
SE937 ms19.7 ms2.0 mm30256180
Table 4. MRI scan parameters for the abdominal phantom and human neck.
SequenceTRTEThicknessSlicesFrequency EncodingPhase Encoding
SE1436 ms20 ms1.5 mm45256180
Table 5. The estimated values of sound velocity obtained by simultaneous US imaging and MRI.
Subject 1Subject 2Subject 3AverageReferences [1]
Fat layerLength (mm)3.58 ± 0.14.63 ± 0.14.24 ± 0.1--
Time of flight (μs)5.02 ± 0.036.34 ± 0.035.86 ± 0.03--
Sound velocity (m/s)1430 ± 401460 ± 301450 ± 401445 ± 201459–1479
Muscle tissueLength (mm)15.00 ± 0.114.13 ± 0.115.7 ± 0.1--
Time of flight (μs)9.75 ± 0.0317.92 ± 0.0320.0 ± 0.03--
Sound Velocity (m/s)1540 ± 101580 ± 101570 ± 101562 ± 301540–1566
Table 6. Comparison of the half-widths of the autocorrelation functions in the lateral direction.
ROIsThe Half-Width of the Autocorrelation Function for a Compensated ImageThe Half-Width of the Autocorrelation Function for a Conventional ImageRatio of the Half-Width Improvement
Left square1.35 mm2.55 mm0.53
Center square0.85 mm2.60 mm0.30
Right square1.33 mm3.02 mm0.44
Average1.18 mm2.72 mm0.43

