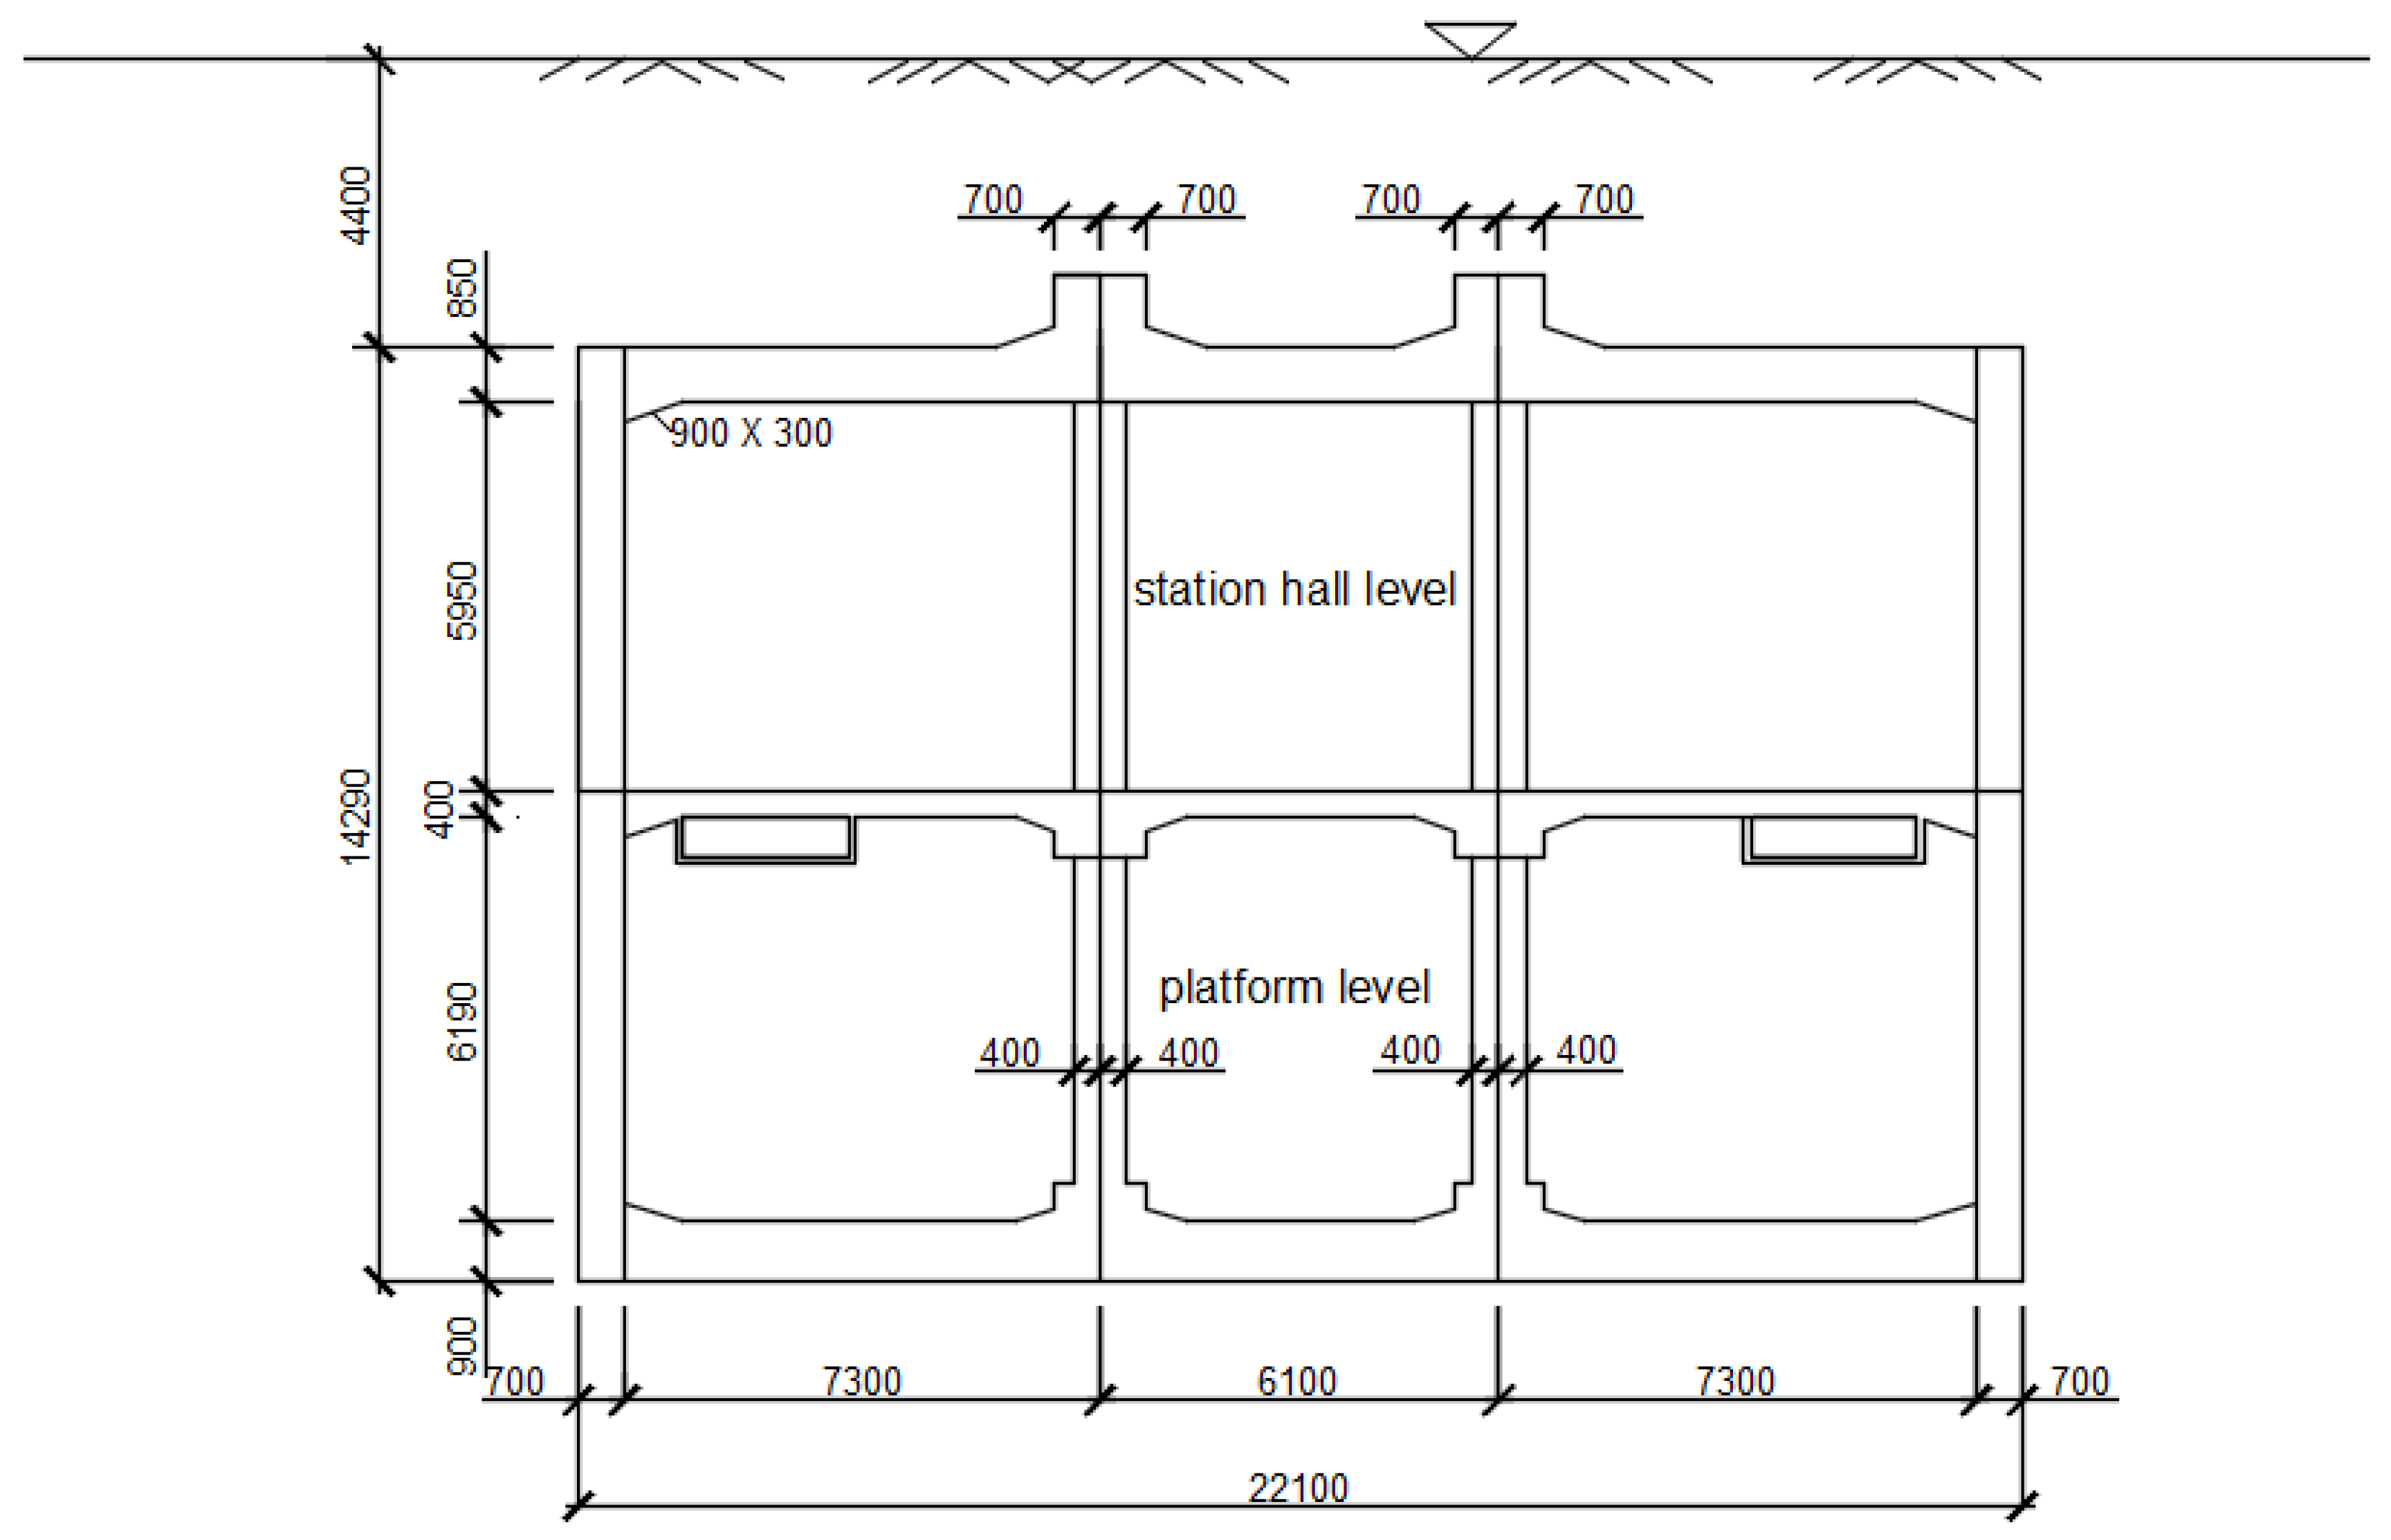
Figure 1.
Cross-sectional view (vertical cut through the structure, normal to the axis of the tunnel) of a three-span two-floor reinforced concrete frame, providing the inspiration for fire testing in [
40].
Figure 1.
Cross-sectional view (vertical cut through the structure, normal to the axis of the tunnel) of a three-span two-floor reinforced concrete frame, providing the inspiration for fire testing in [
40].
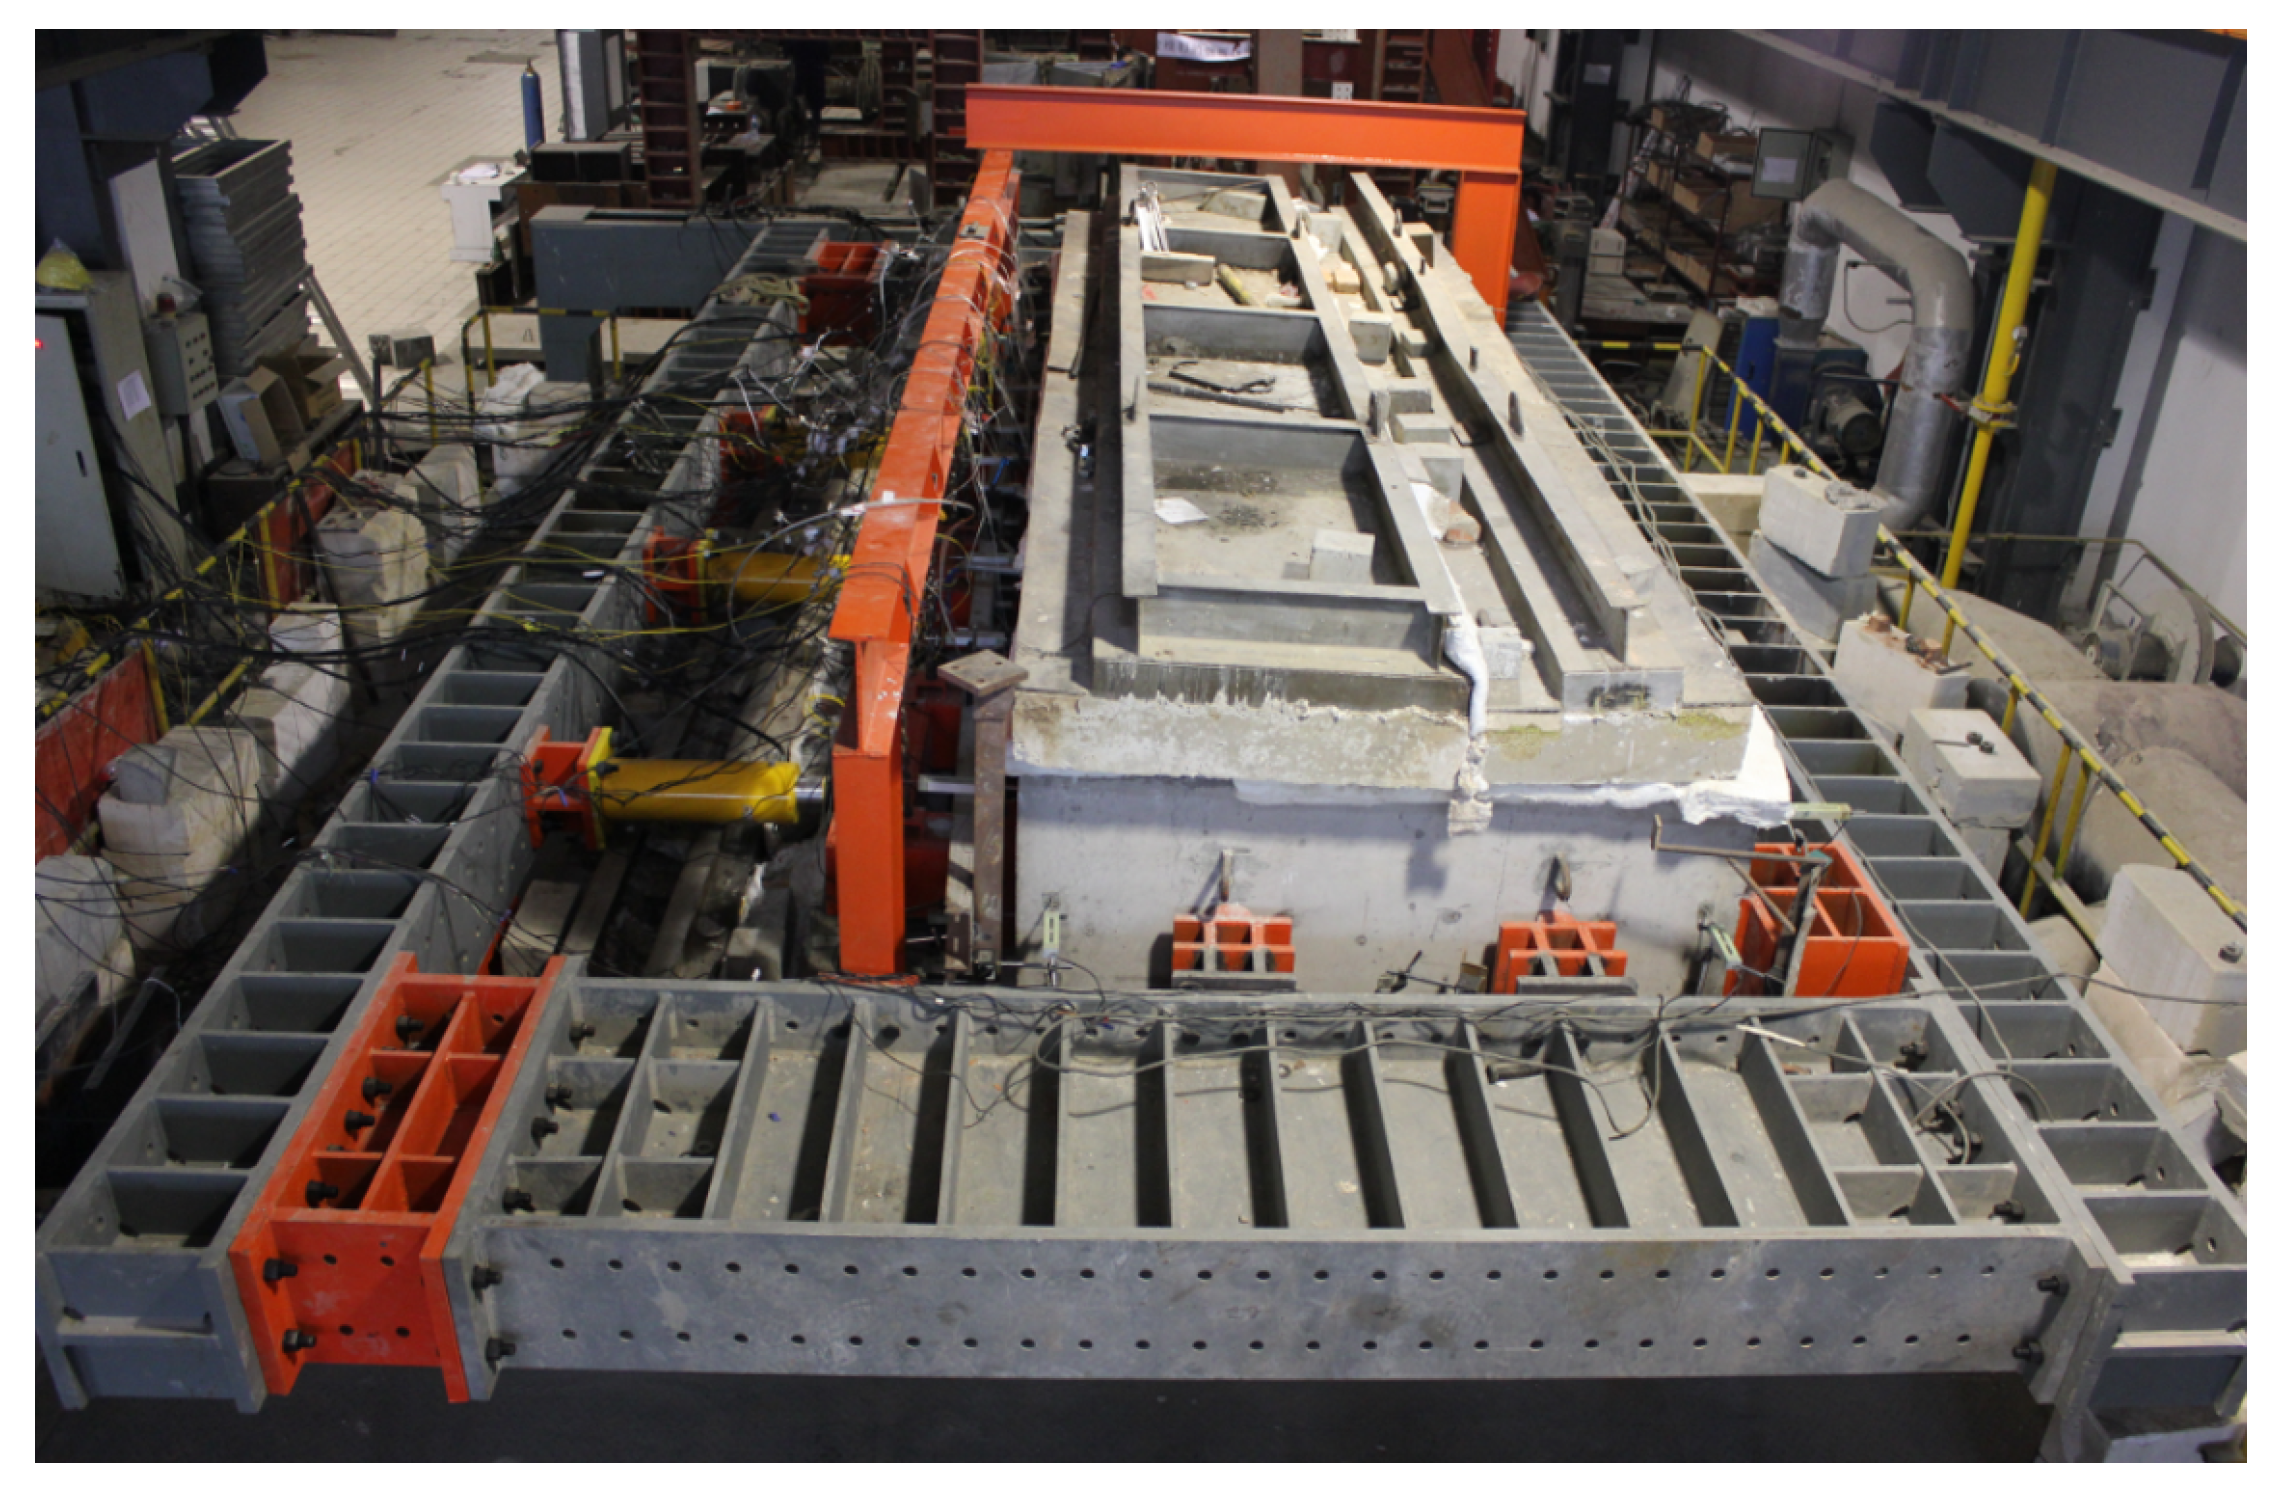
Figure 2.
Setup of the large-scale fire test, taken from [
40]. The specimen was placed sidelong on top of the furnace and closed with a fire-resistant cover.
Figure 2.
Setup of the large-scale fire test, taken from [
40]. The specimen was placed sidelong on top of the furnace and closed with a fire-resistant cover.
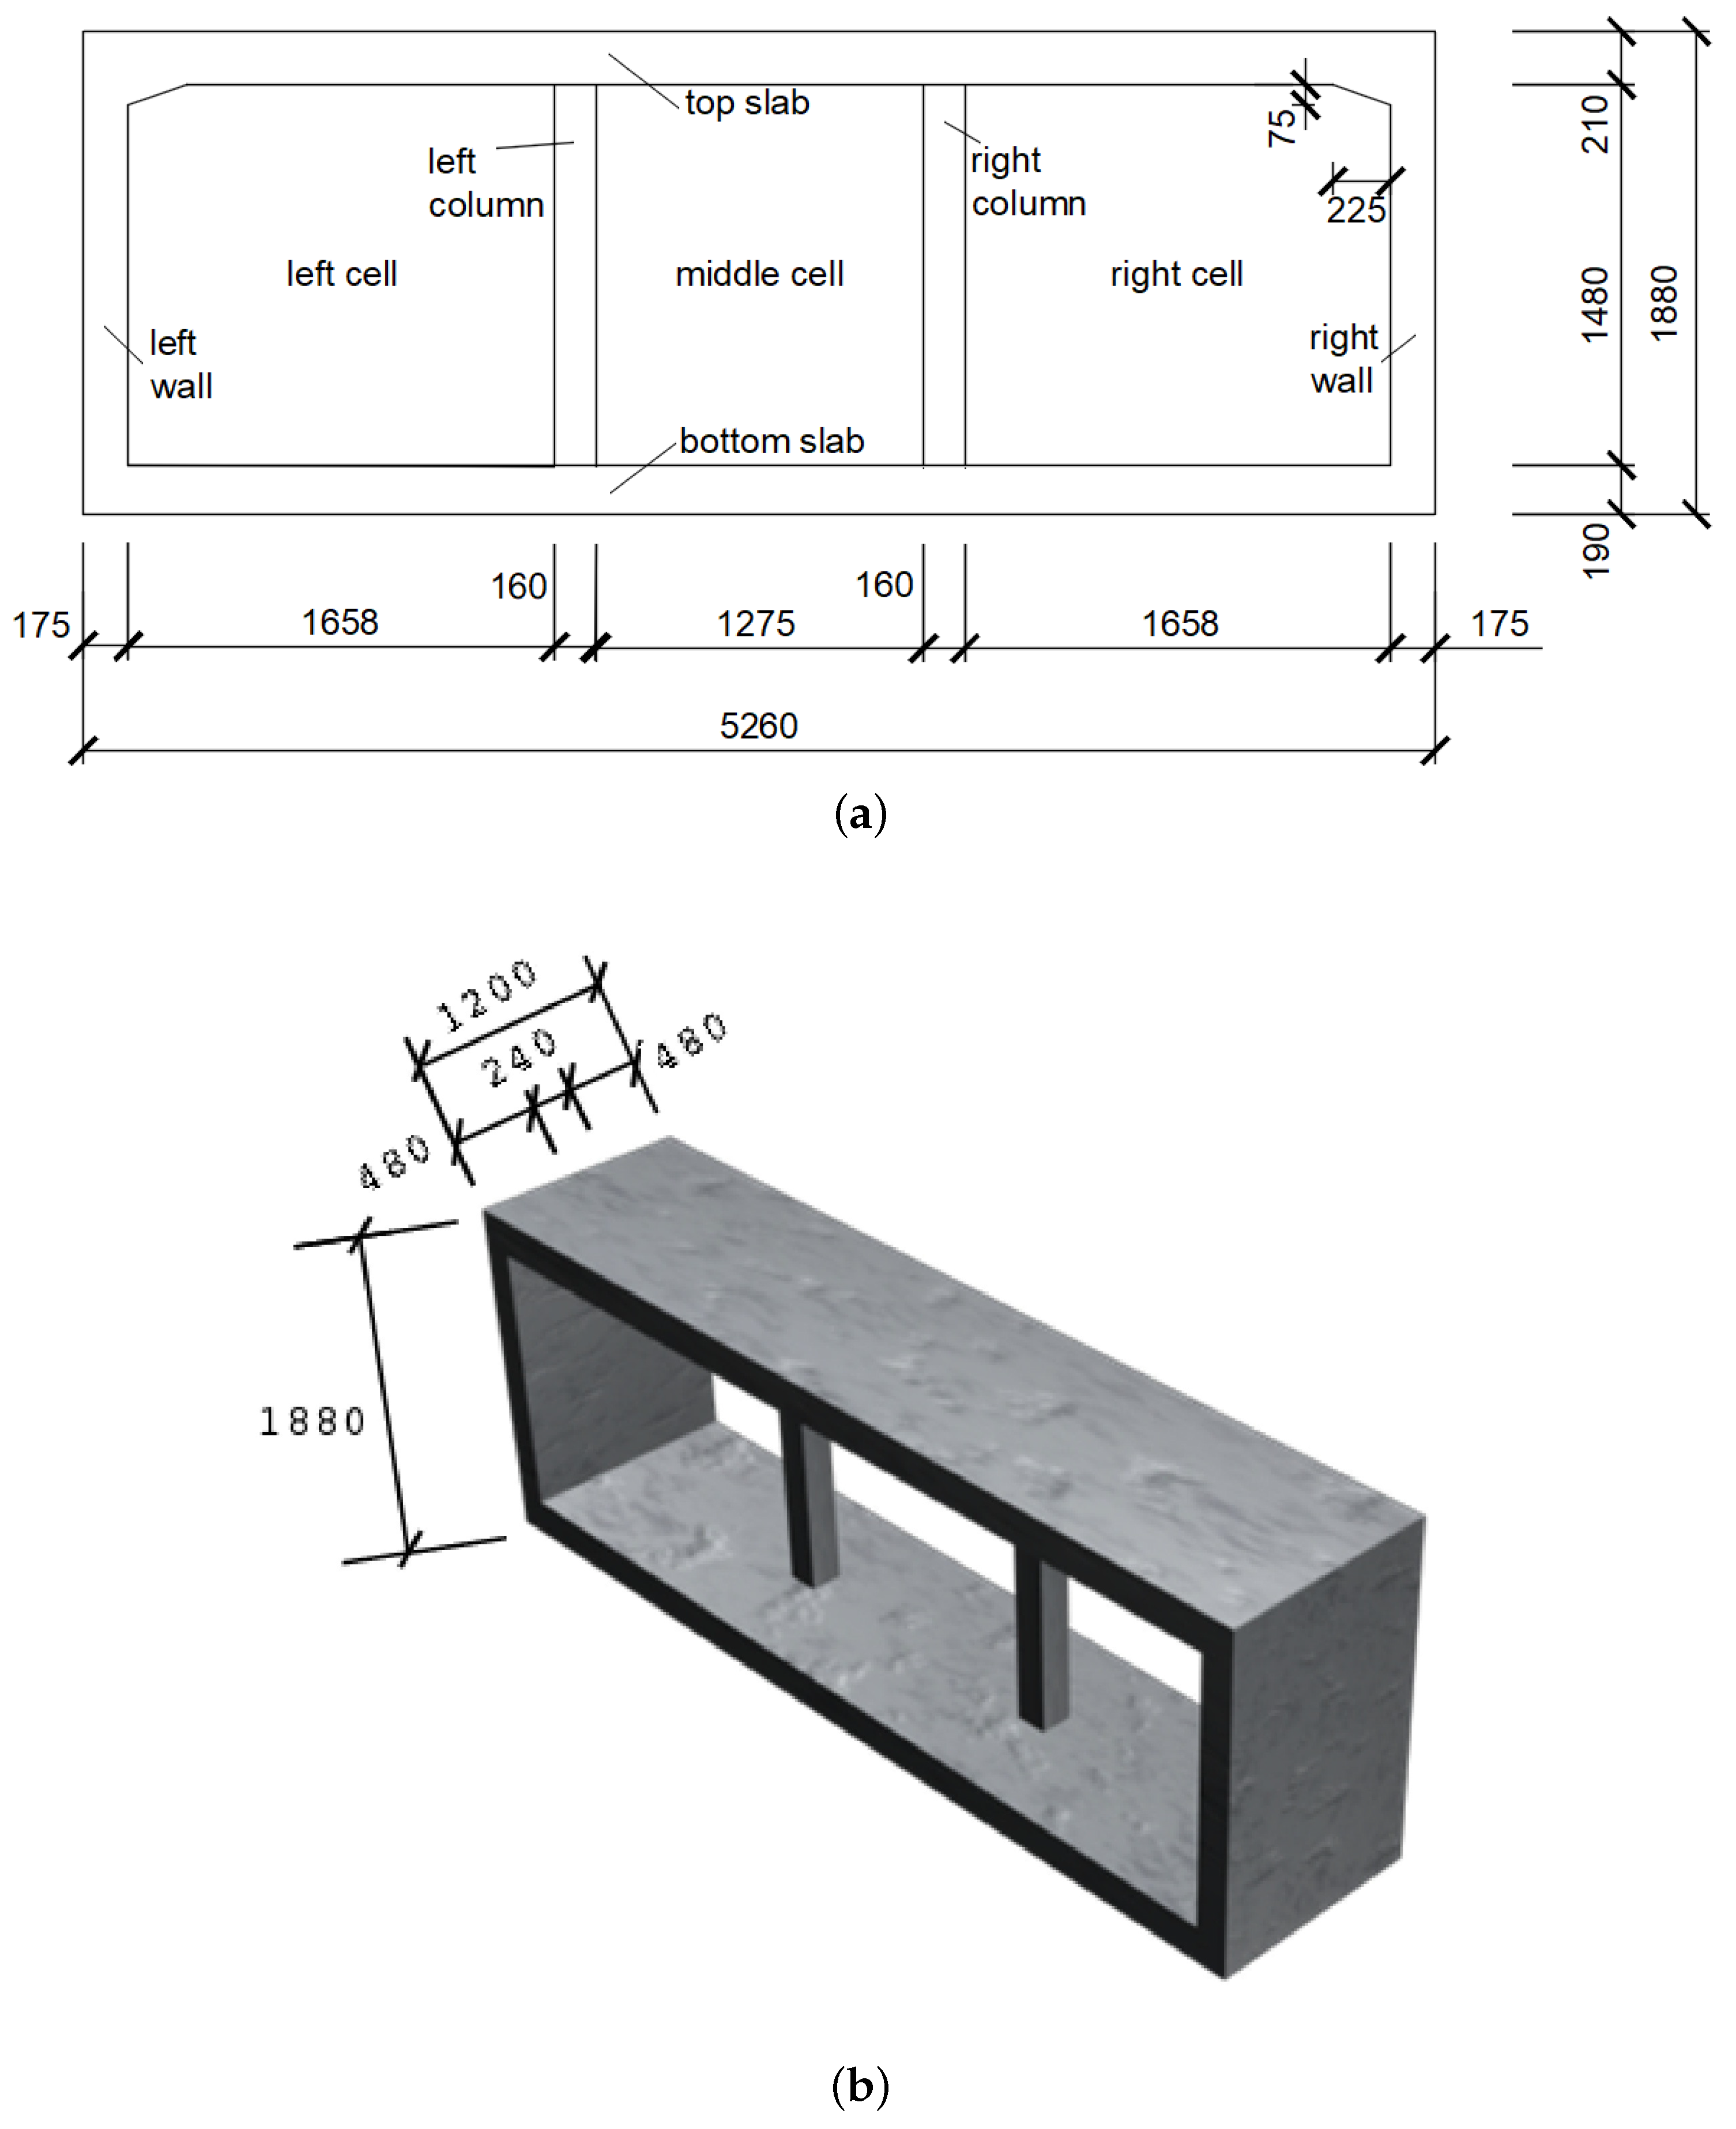
Figure 3.
Geometric dimensions of the tested structure (mm): (
a) cross-section and (
b) perspective representation; adapted from [
40].
Figure 3.
Geometric dimensions of the tested structure (mm): (
a) cross-section and (
b) perspective representation; adapted from [
40].
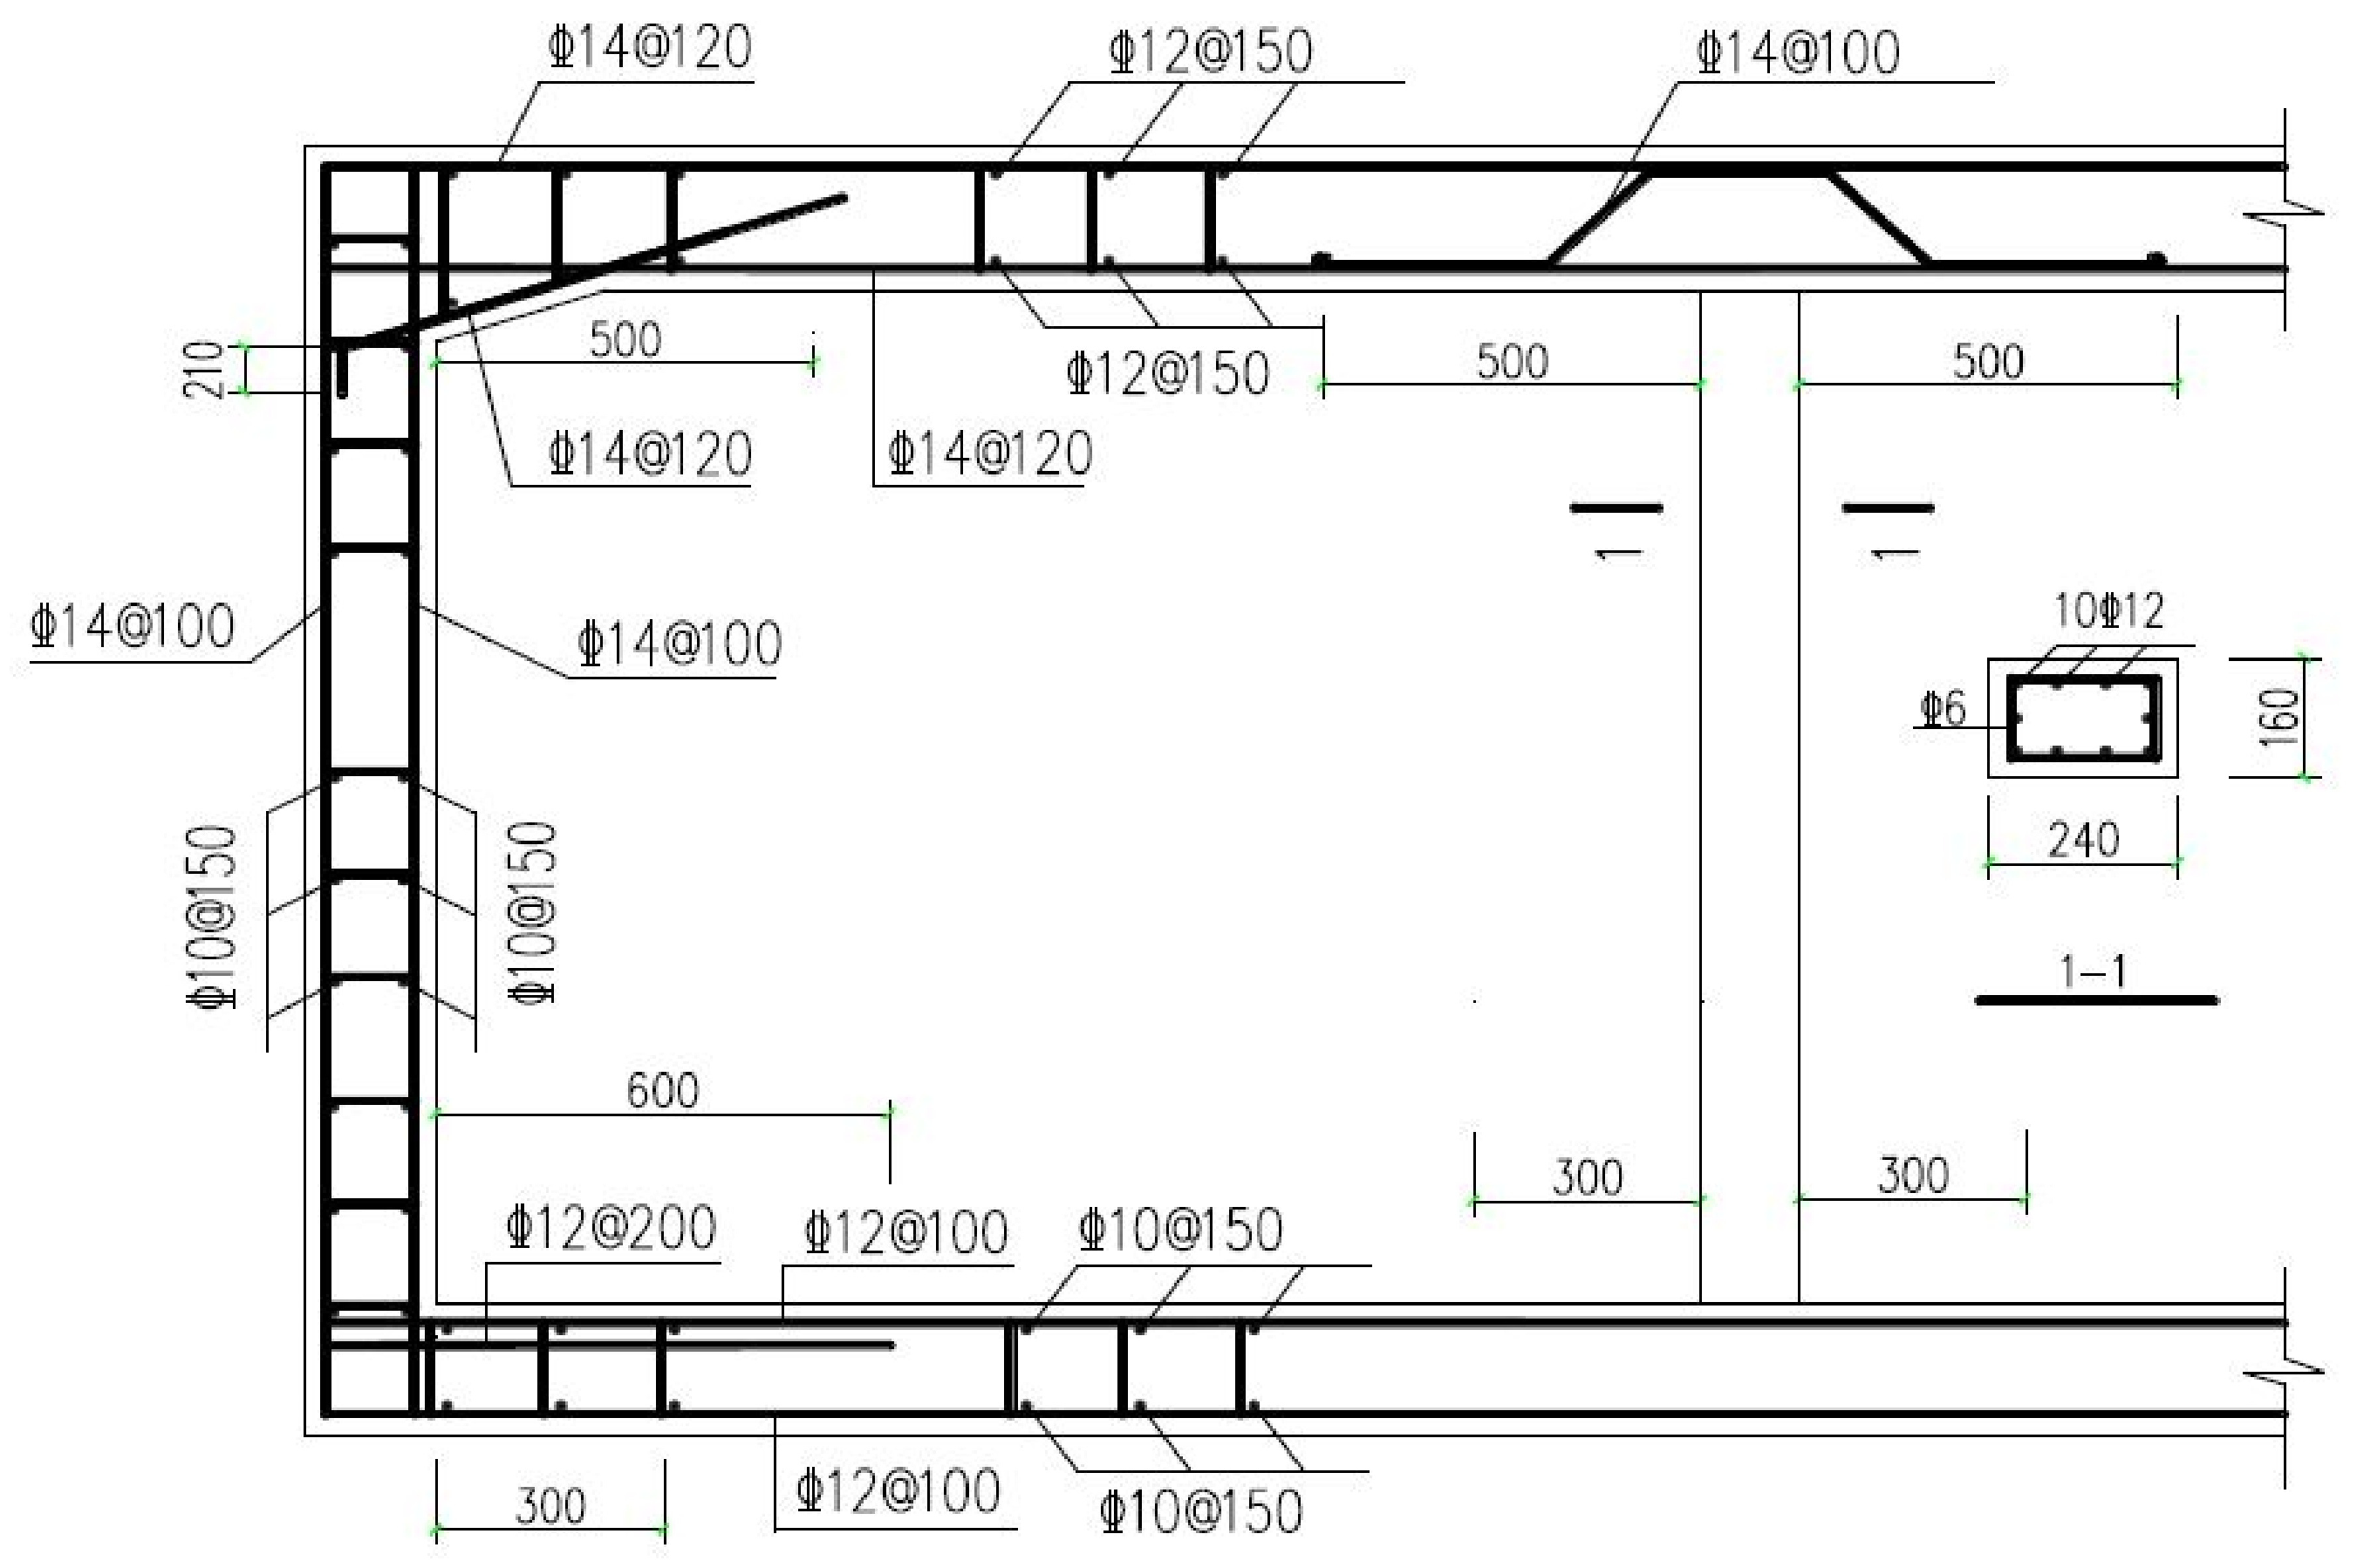
Figure 4.
Reinforcement drawing of the tested structure (mm), taken from [
40].
Figure 4.
Reinforcement drawing of the tested structure (mm), taken from [
40].
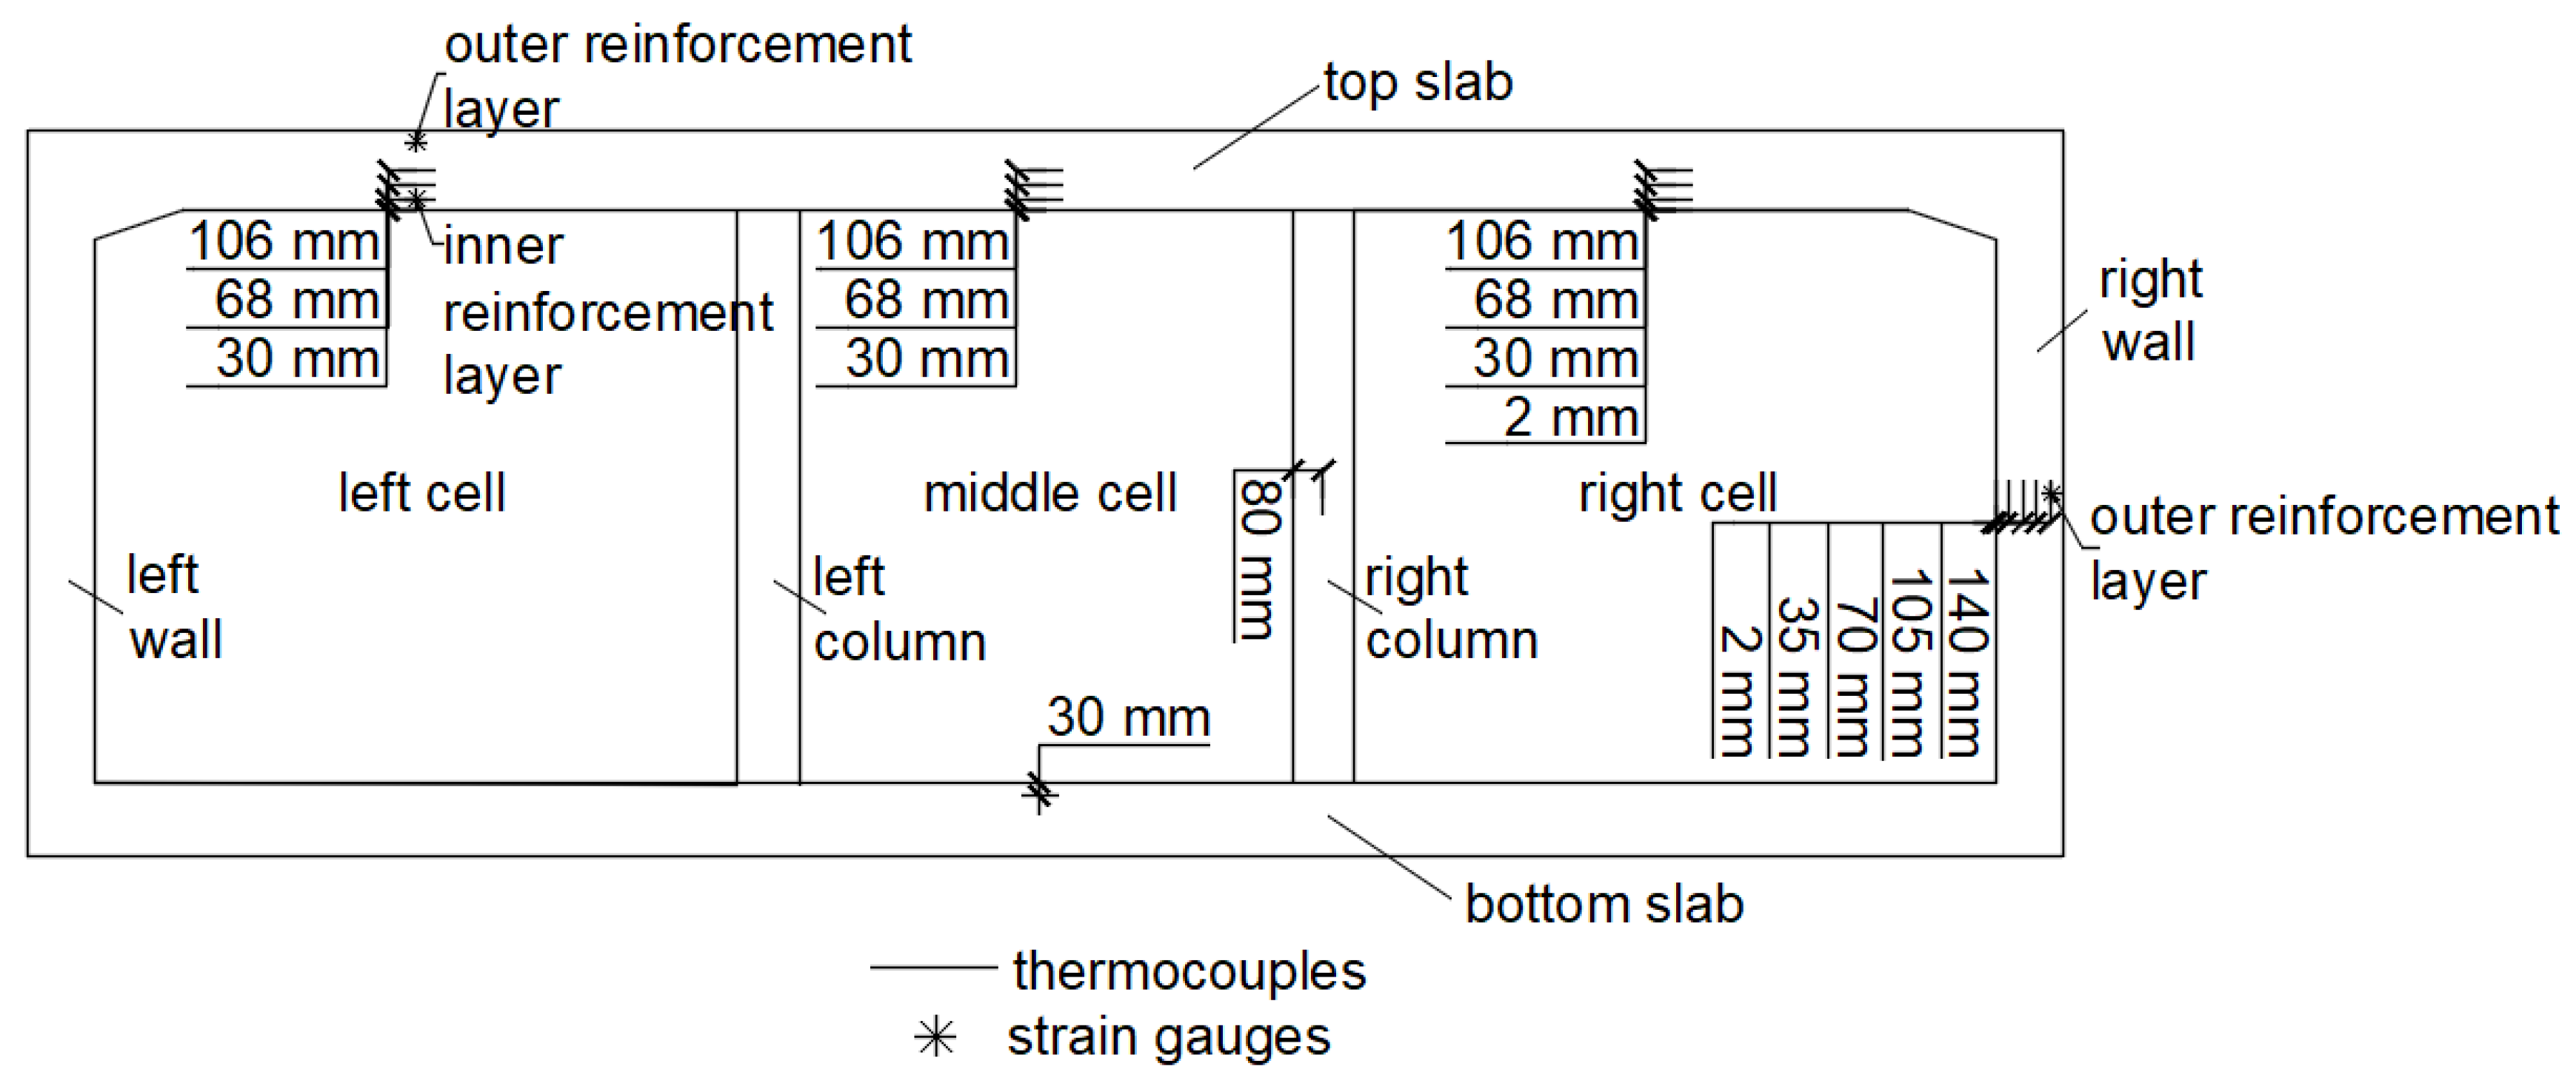
Figure 5.
Elements of the tested structure and positions of thermocouples and strain gauges.
Figure 5.
Elements of the tested structure and positions of thermocouples and strain gauges.
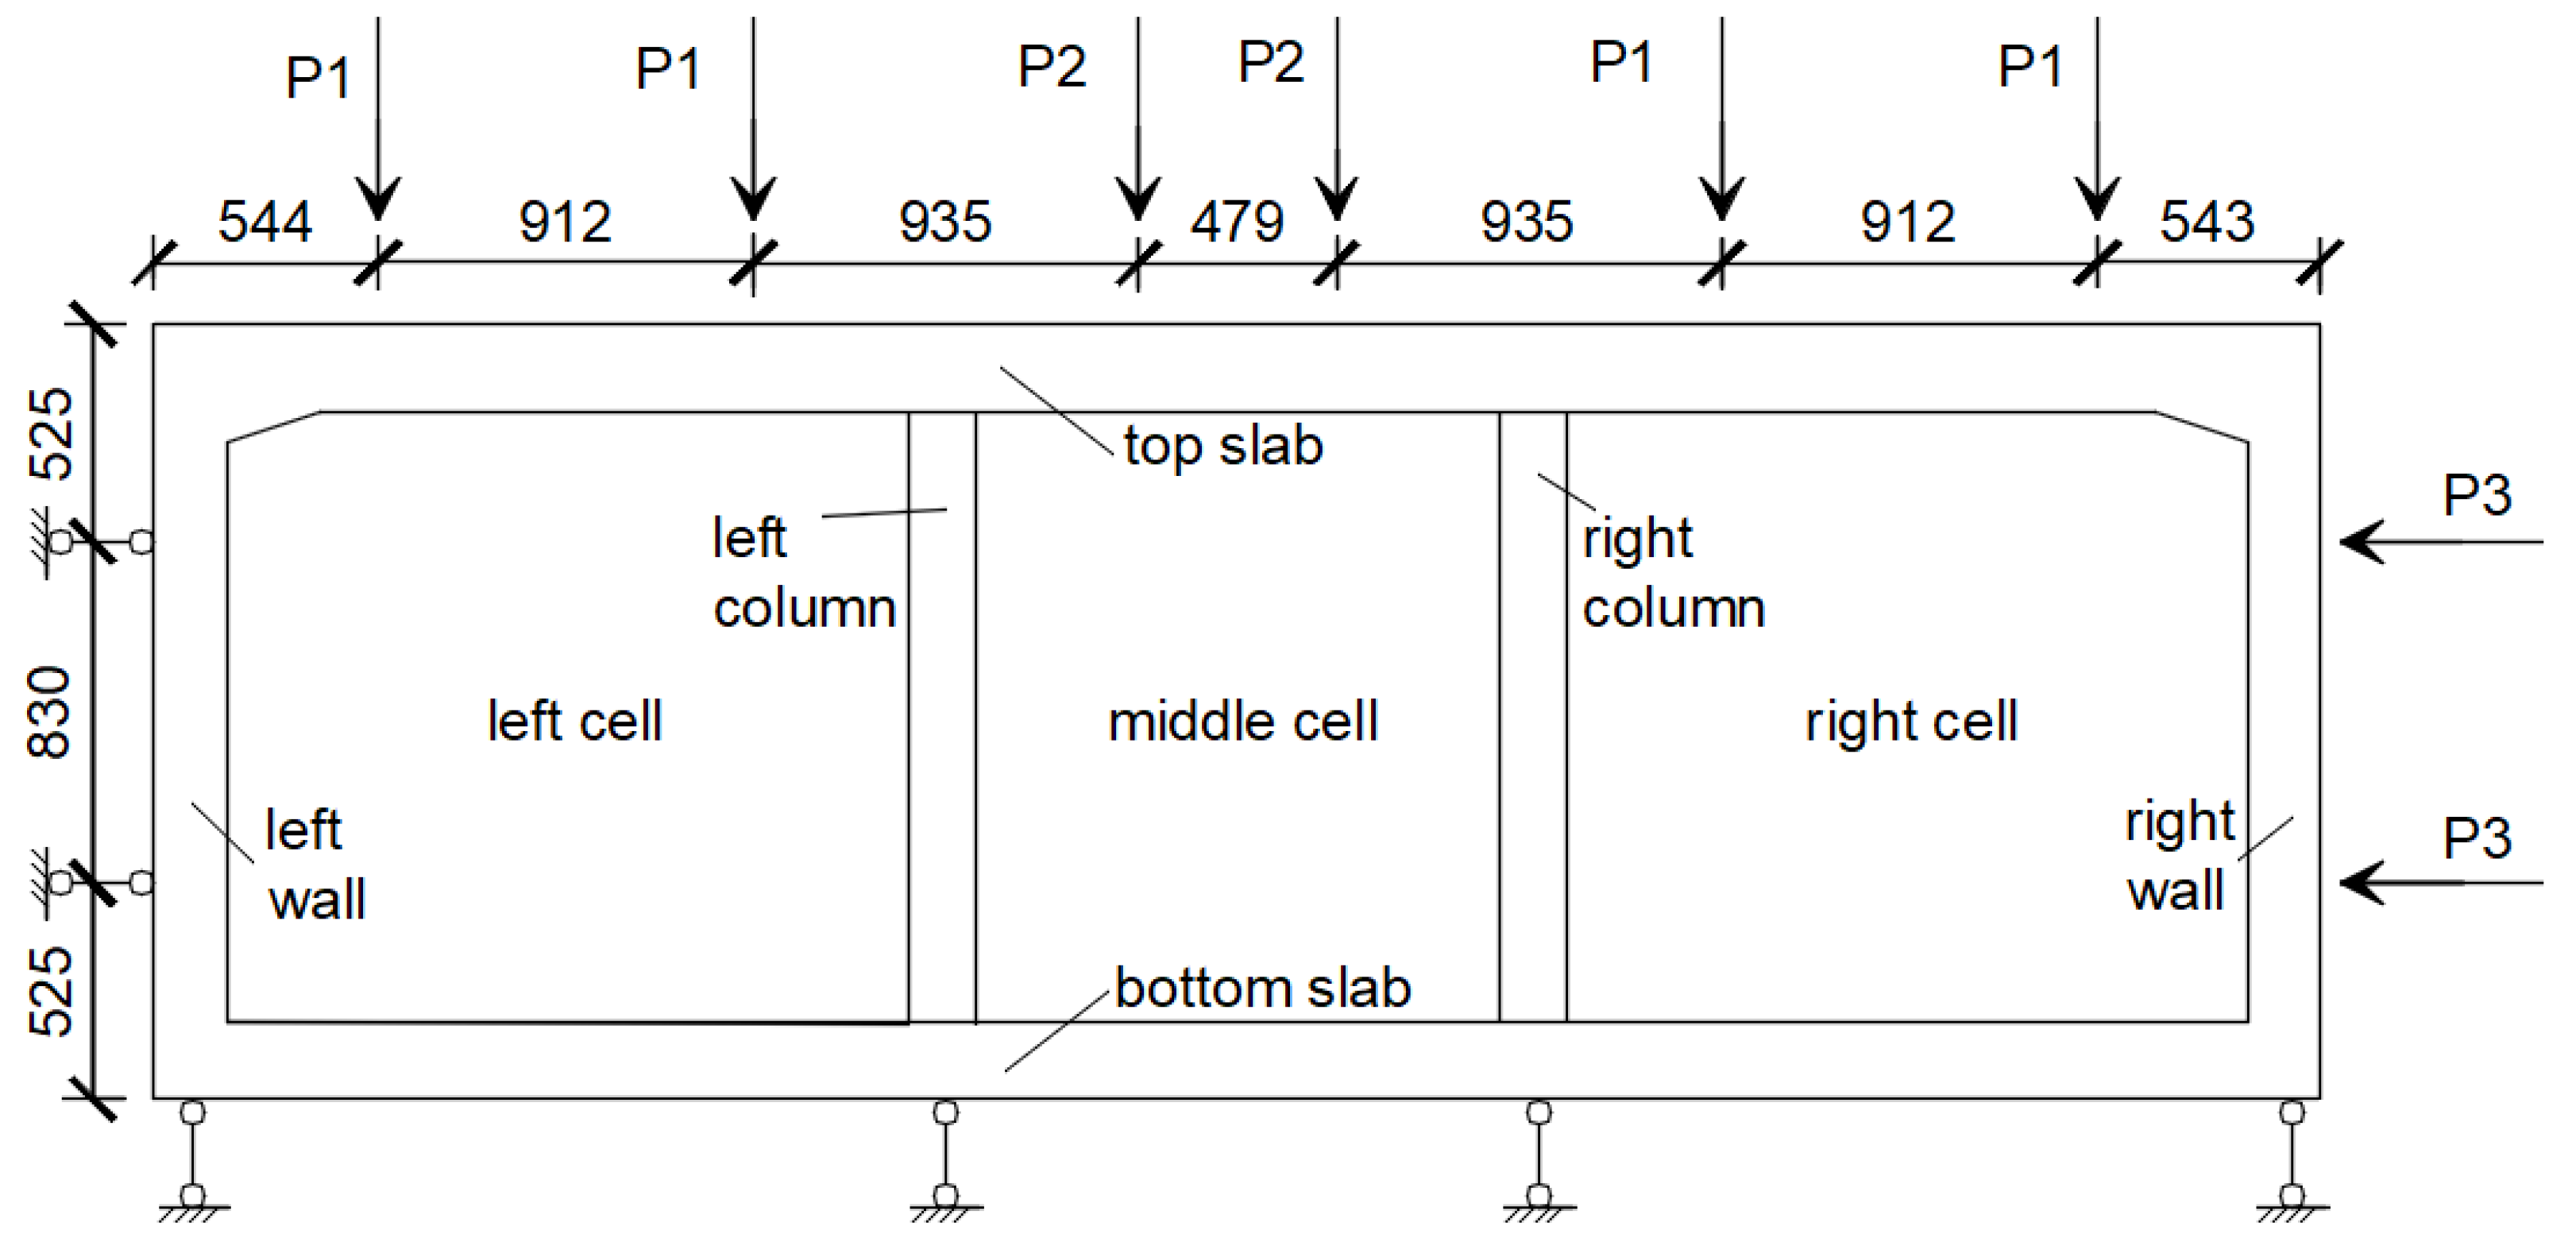
Figure 6.
Support and loading conditions of the tested structure, adapted from [
40].
Figure 6.
Support and loading conditions of the tested structure, adapted from [
40].
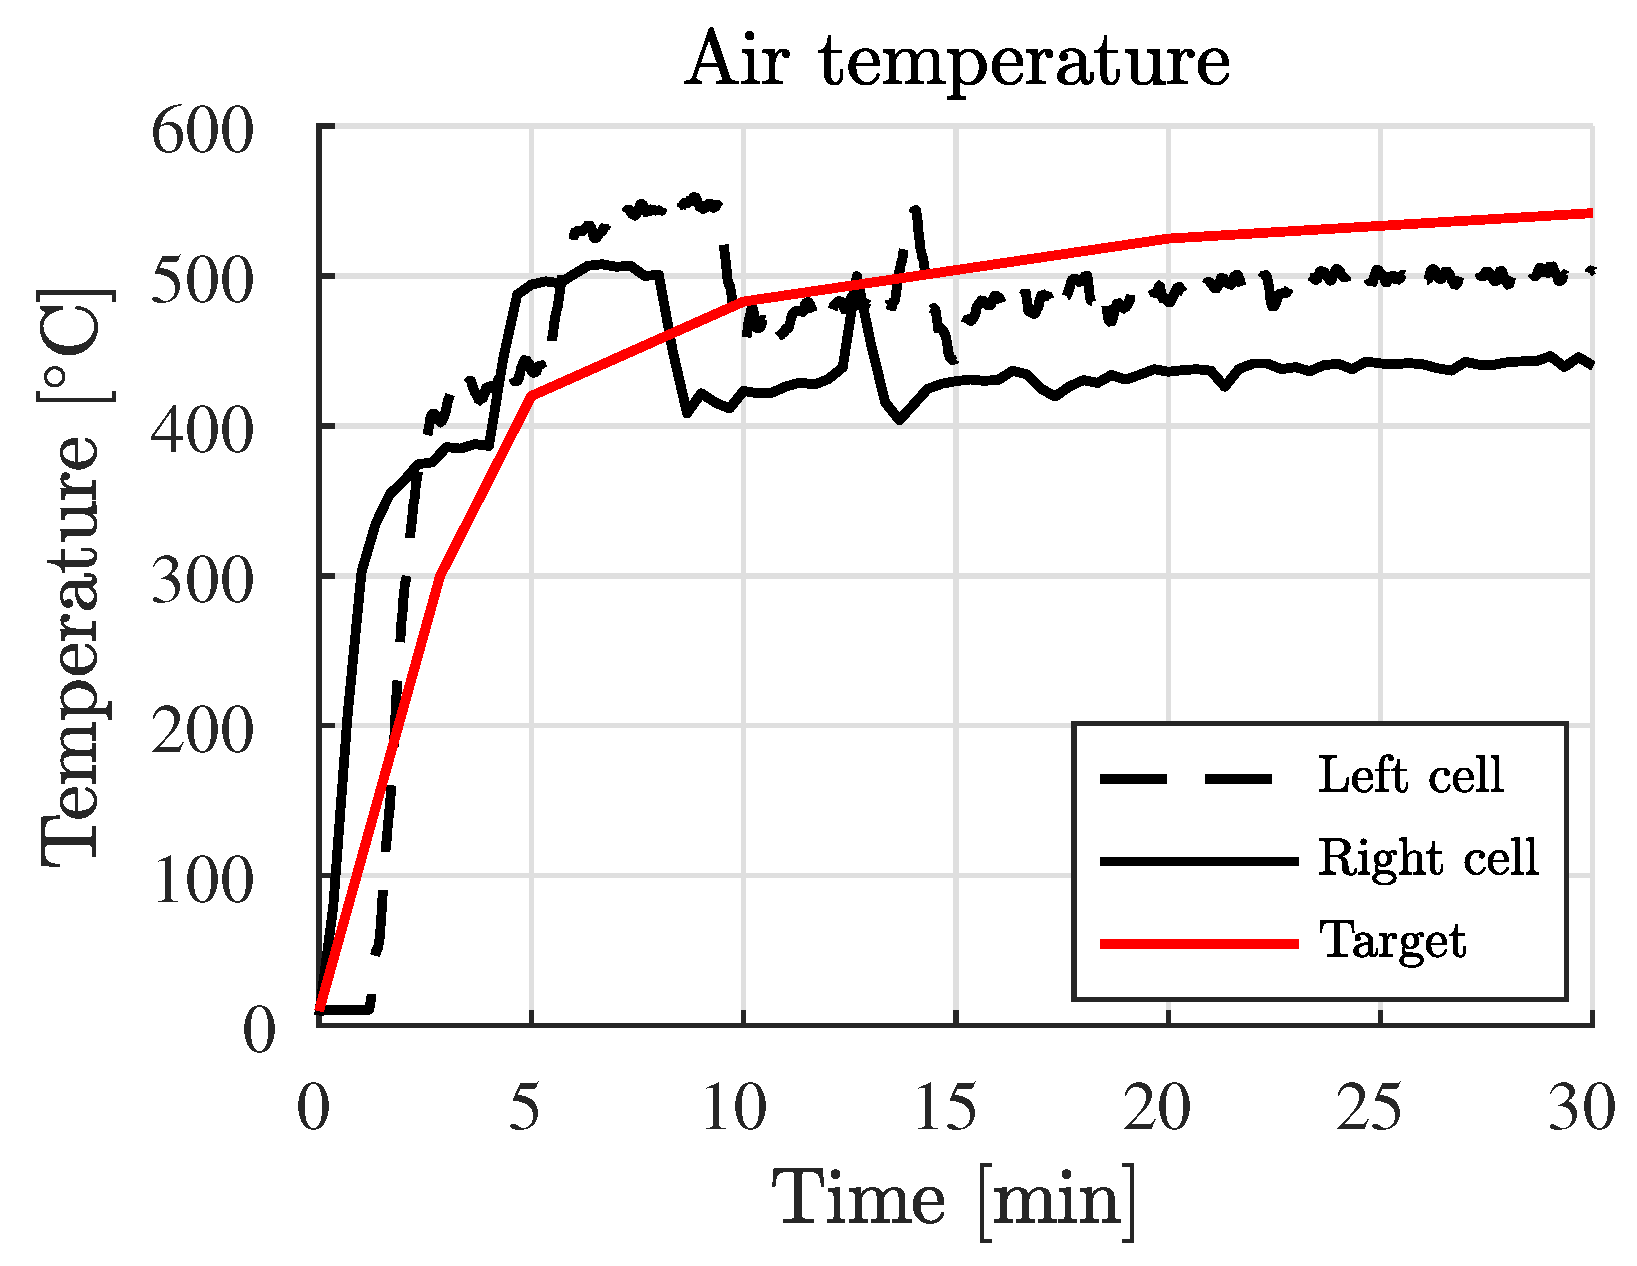
Figure 7.
Temperature history of the air inside the tested structure.
Figure 7.
Temperature history of the air inside the tested structure.
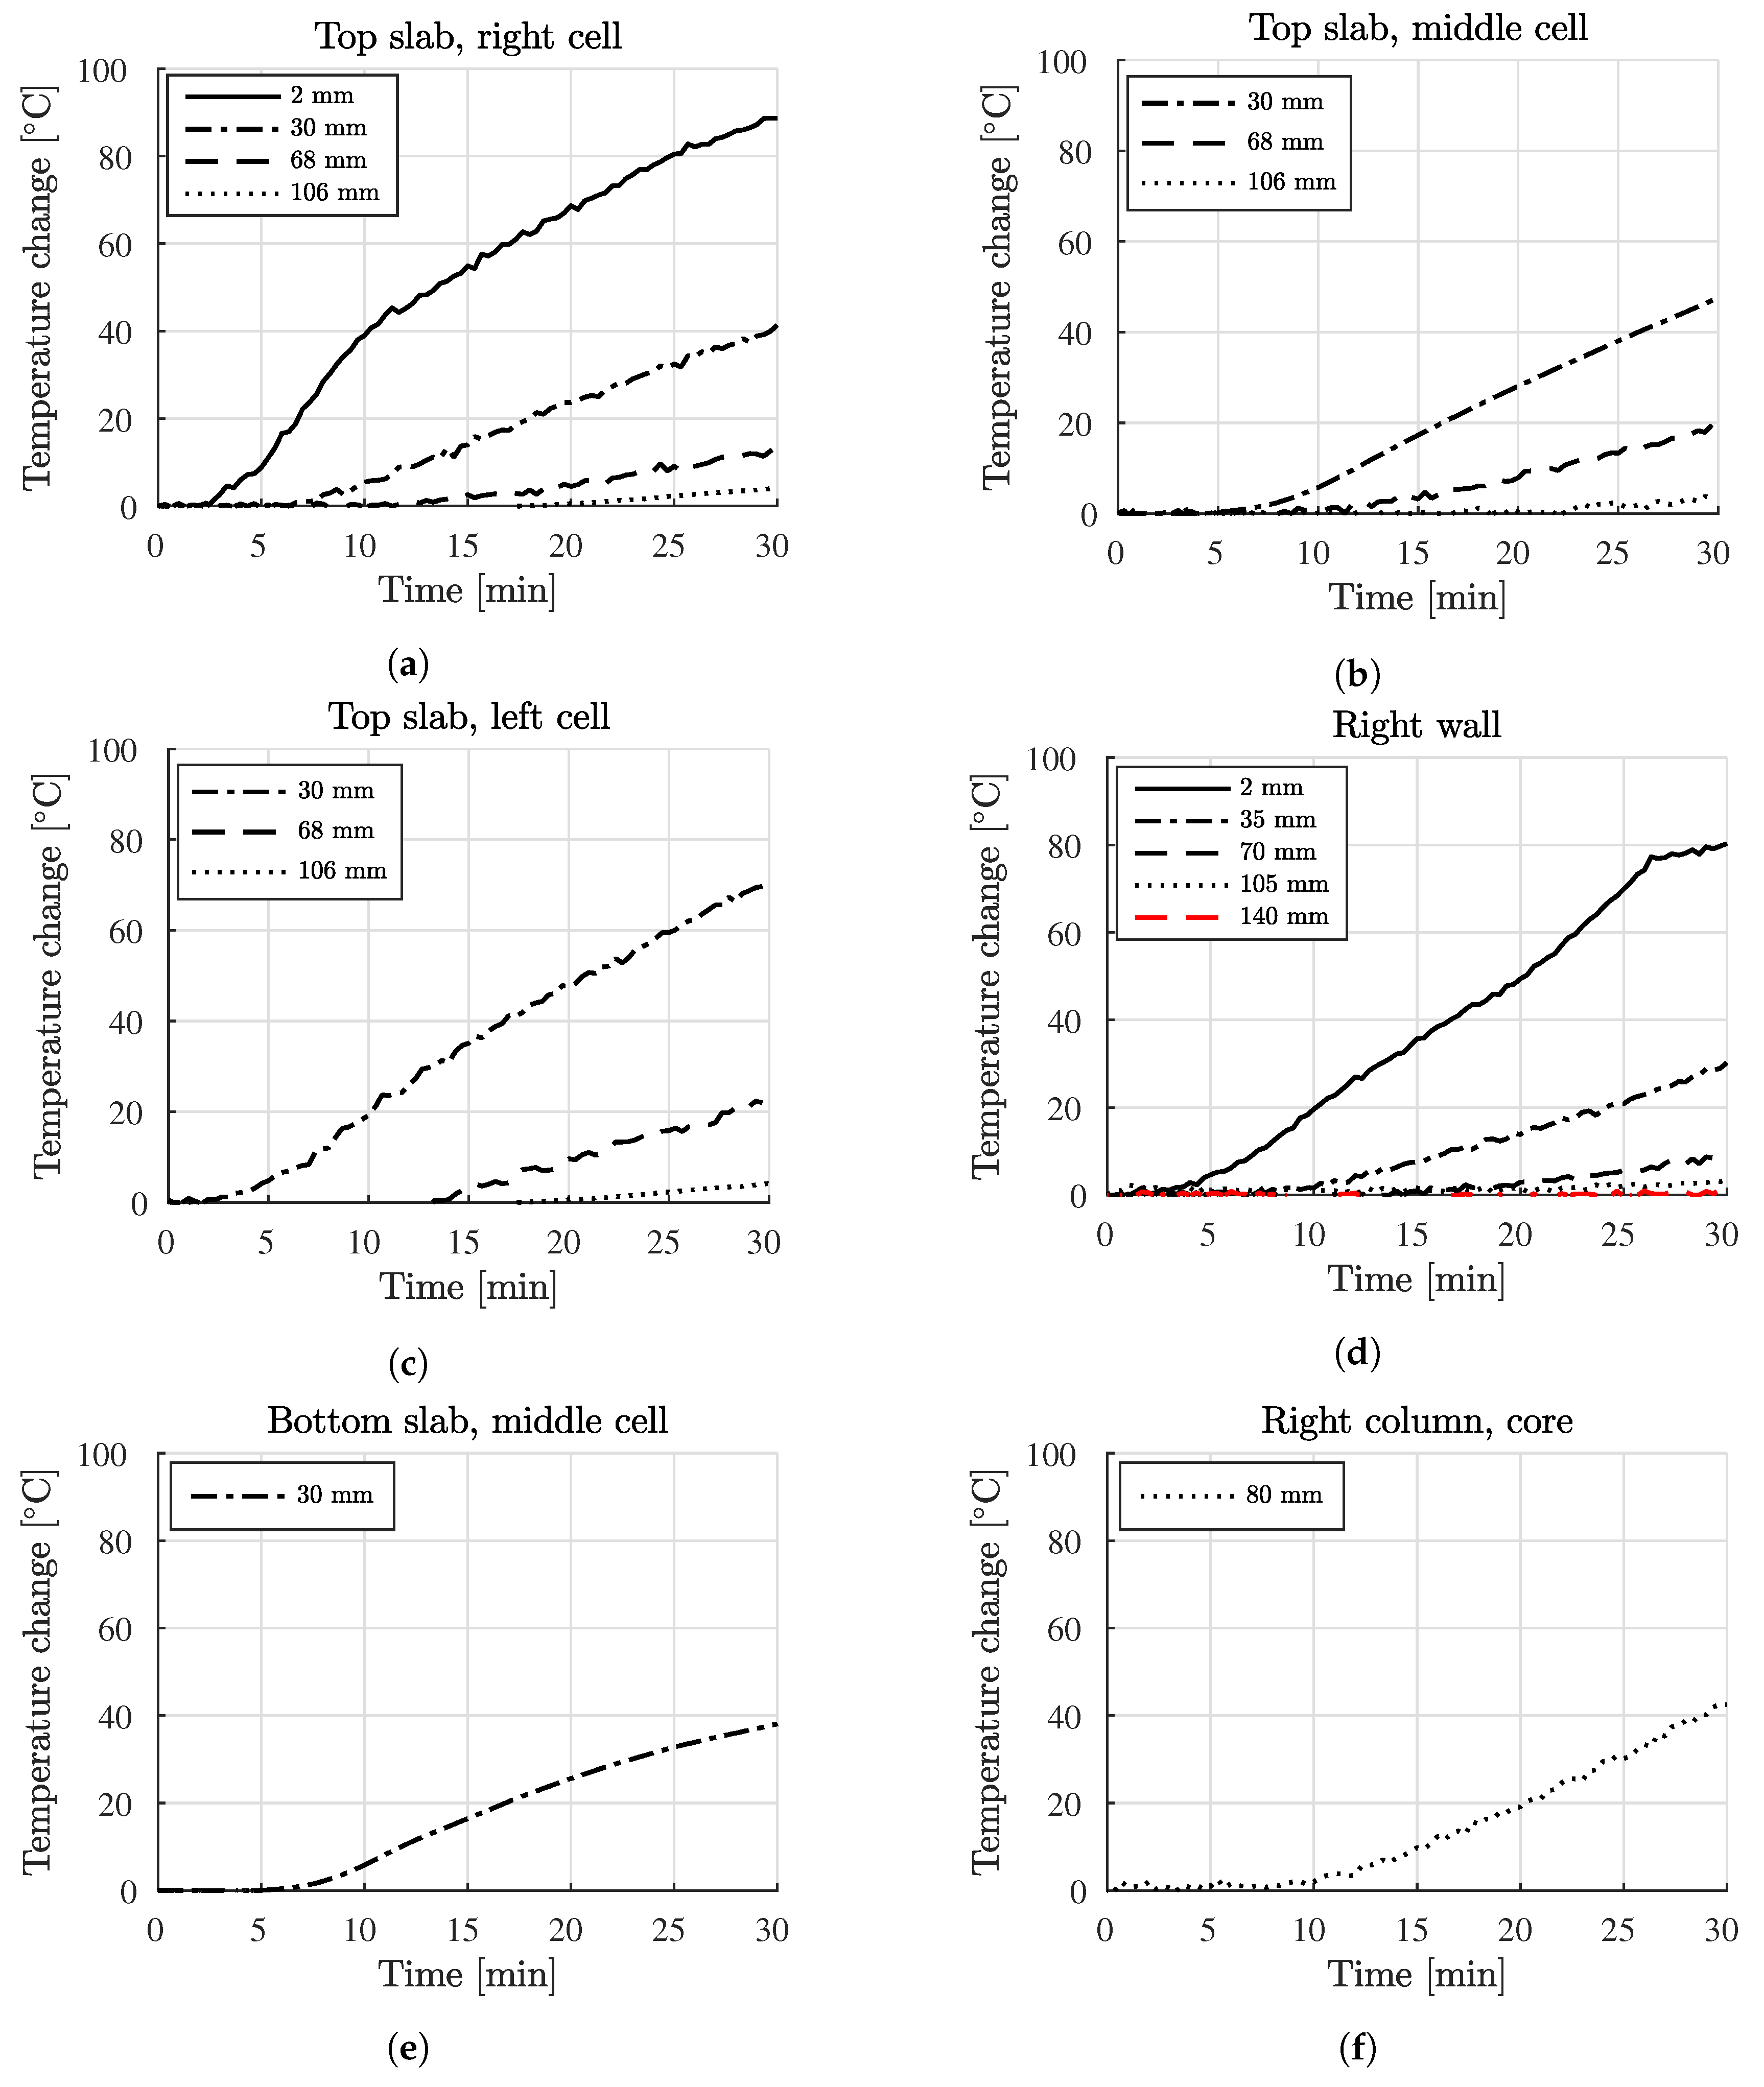
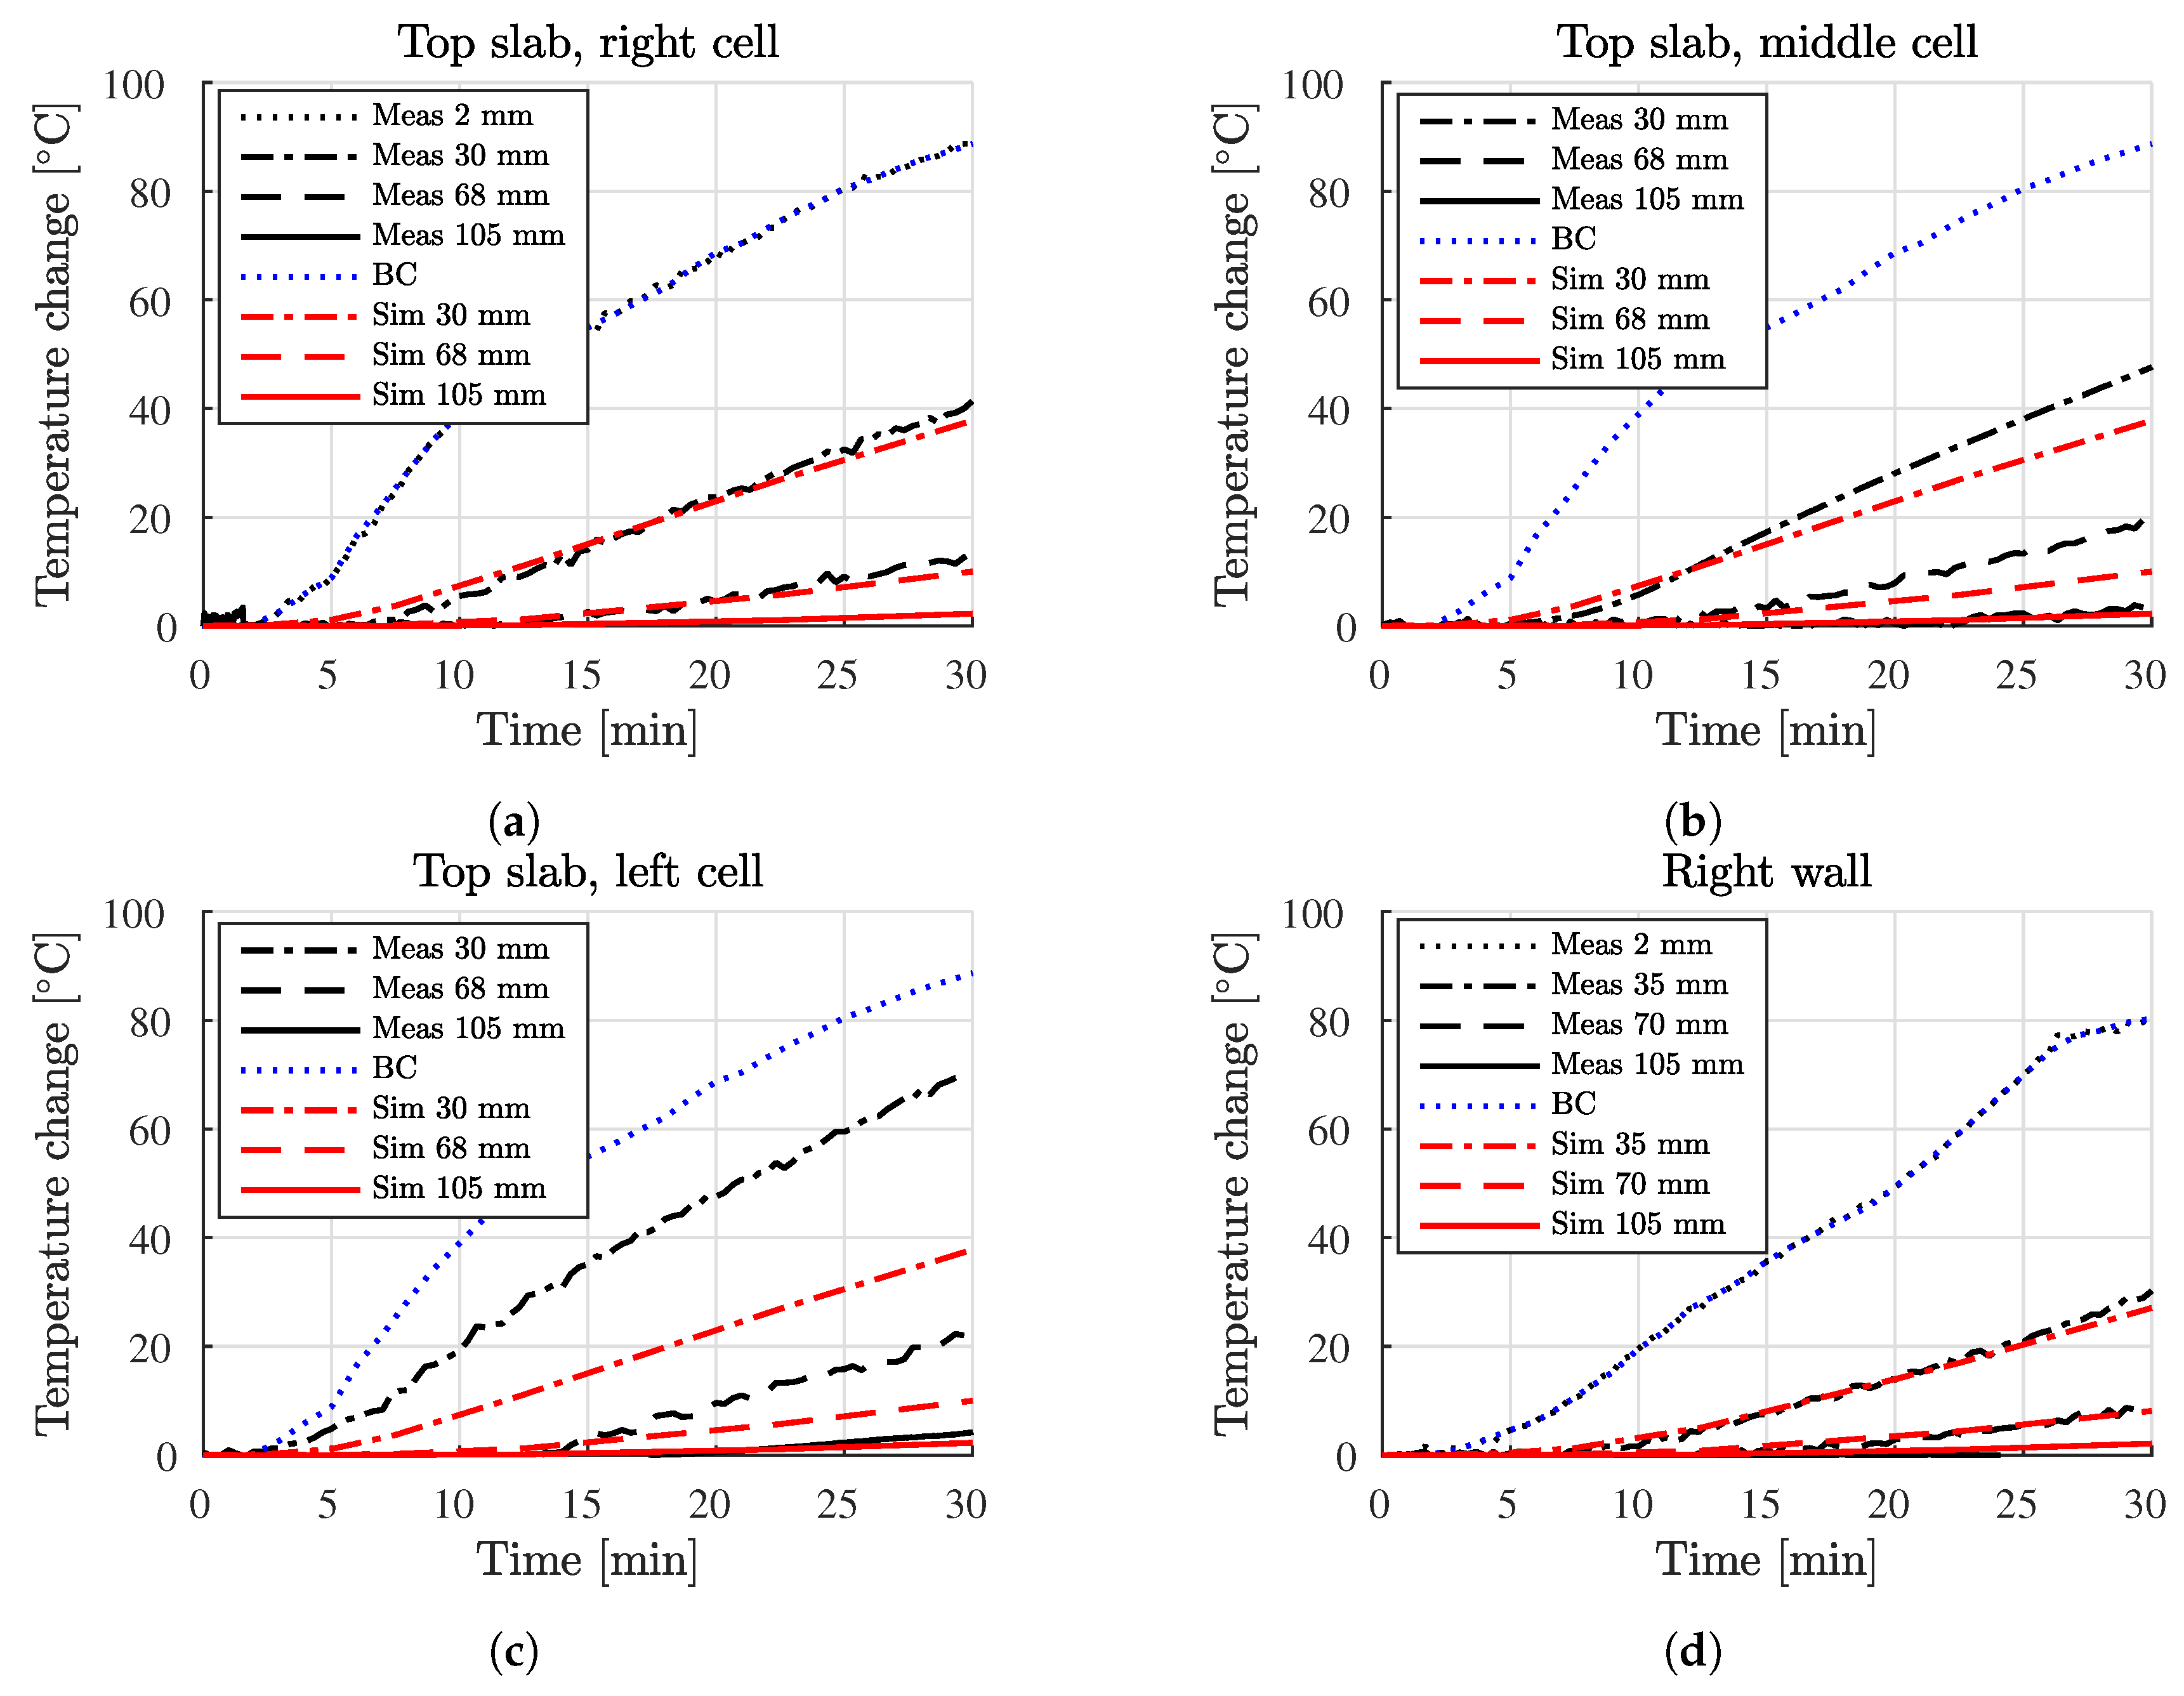
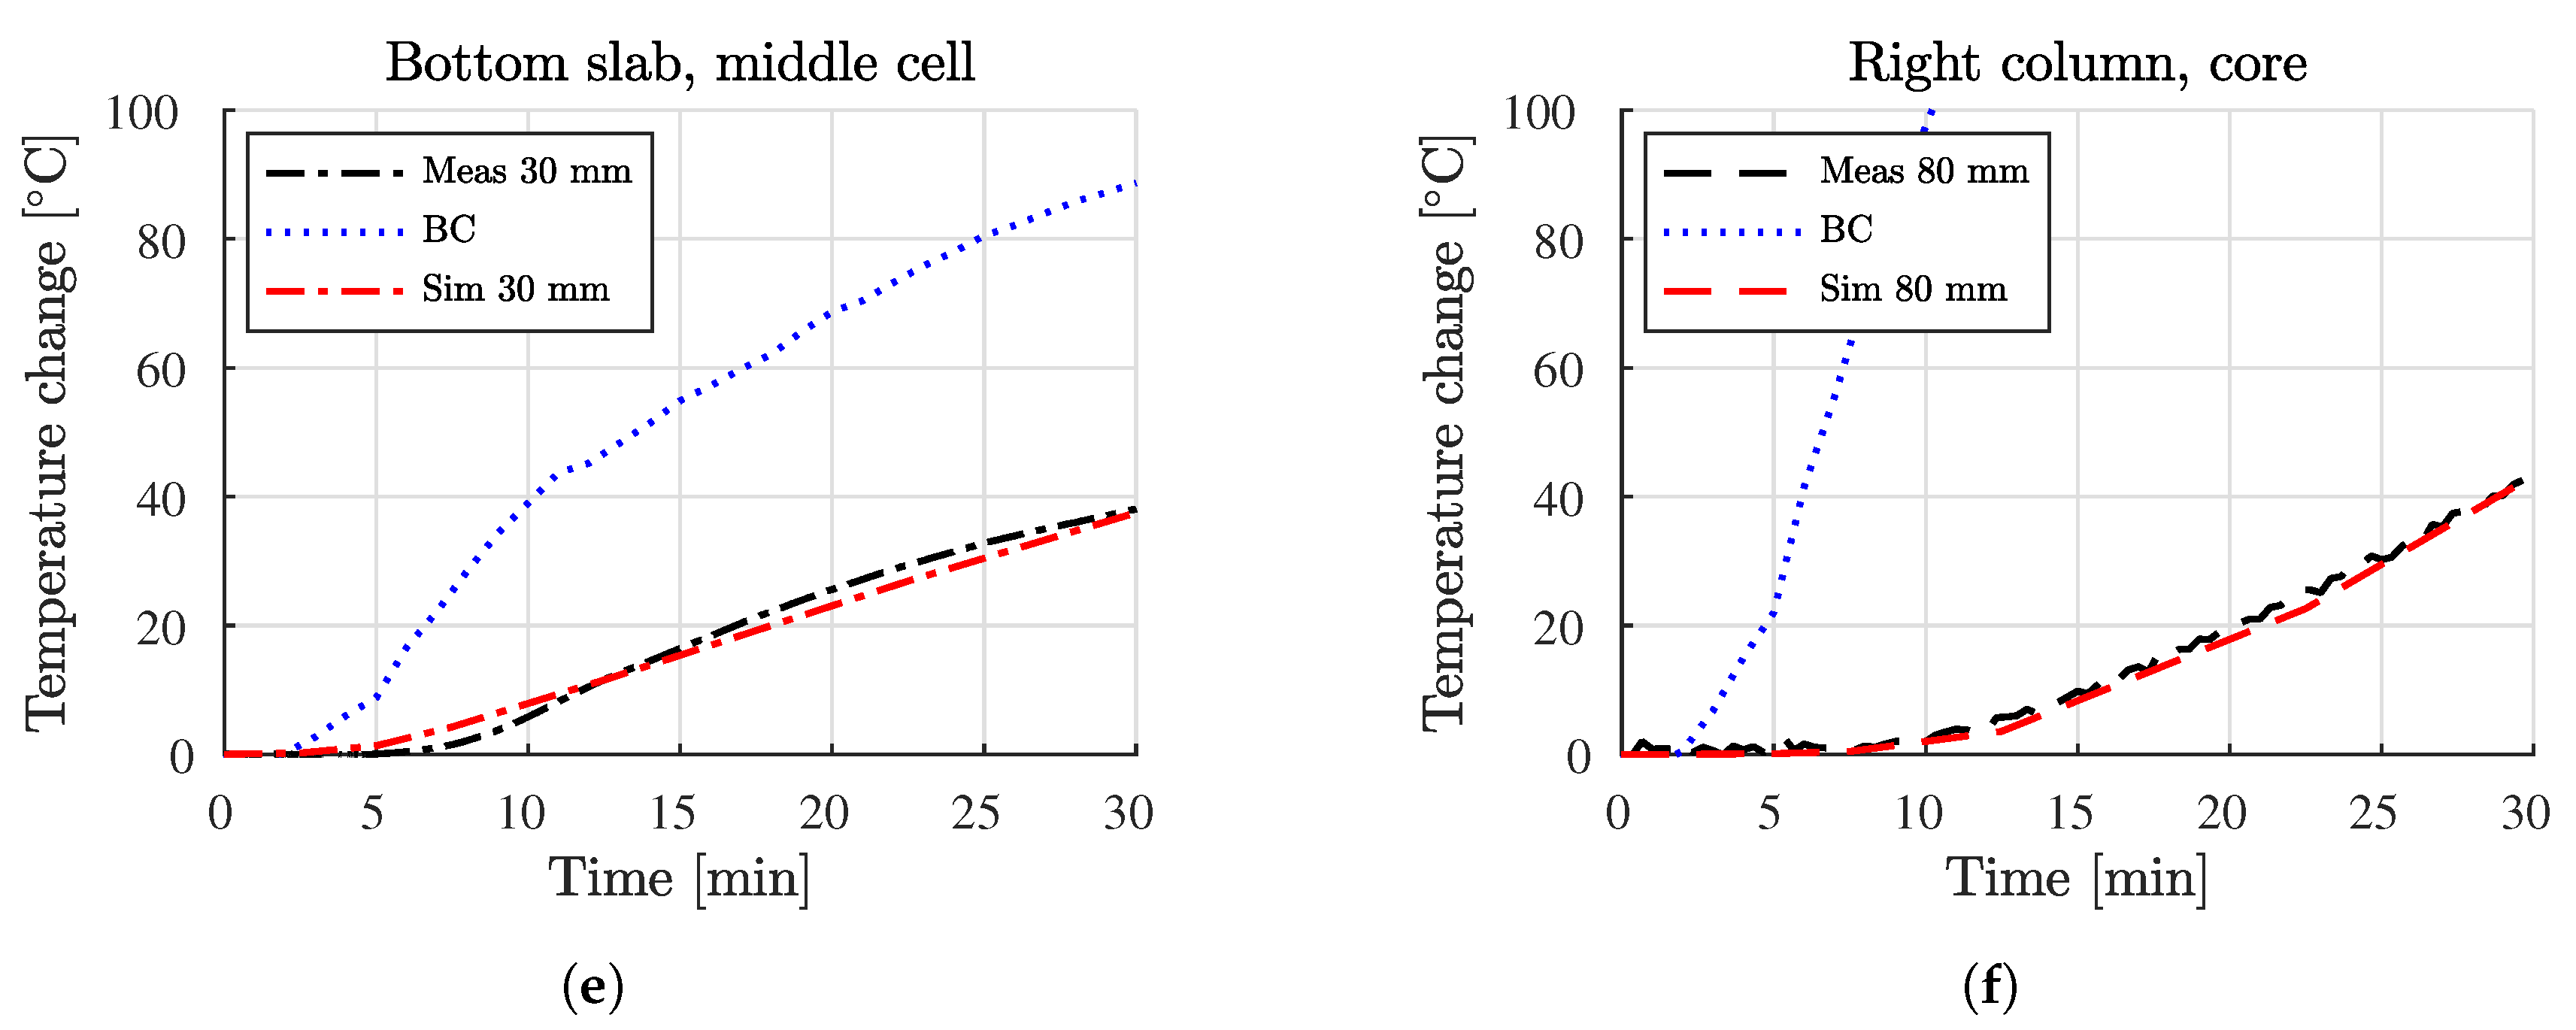
Figure 8.
Measured evolutions of temperature changes: (a) top slab, at the midspan of the right cell, (b) top slab, at the midspan of the middle cell, (c) top slab, at the midspan of the left cell, (d) center of the right wall, (e) bottom slab, at the midspan of the middle cell, and (f) core of the right column.
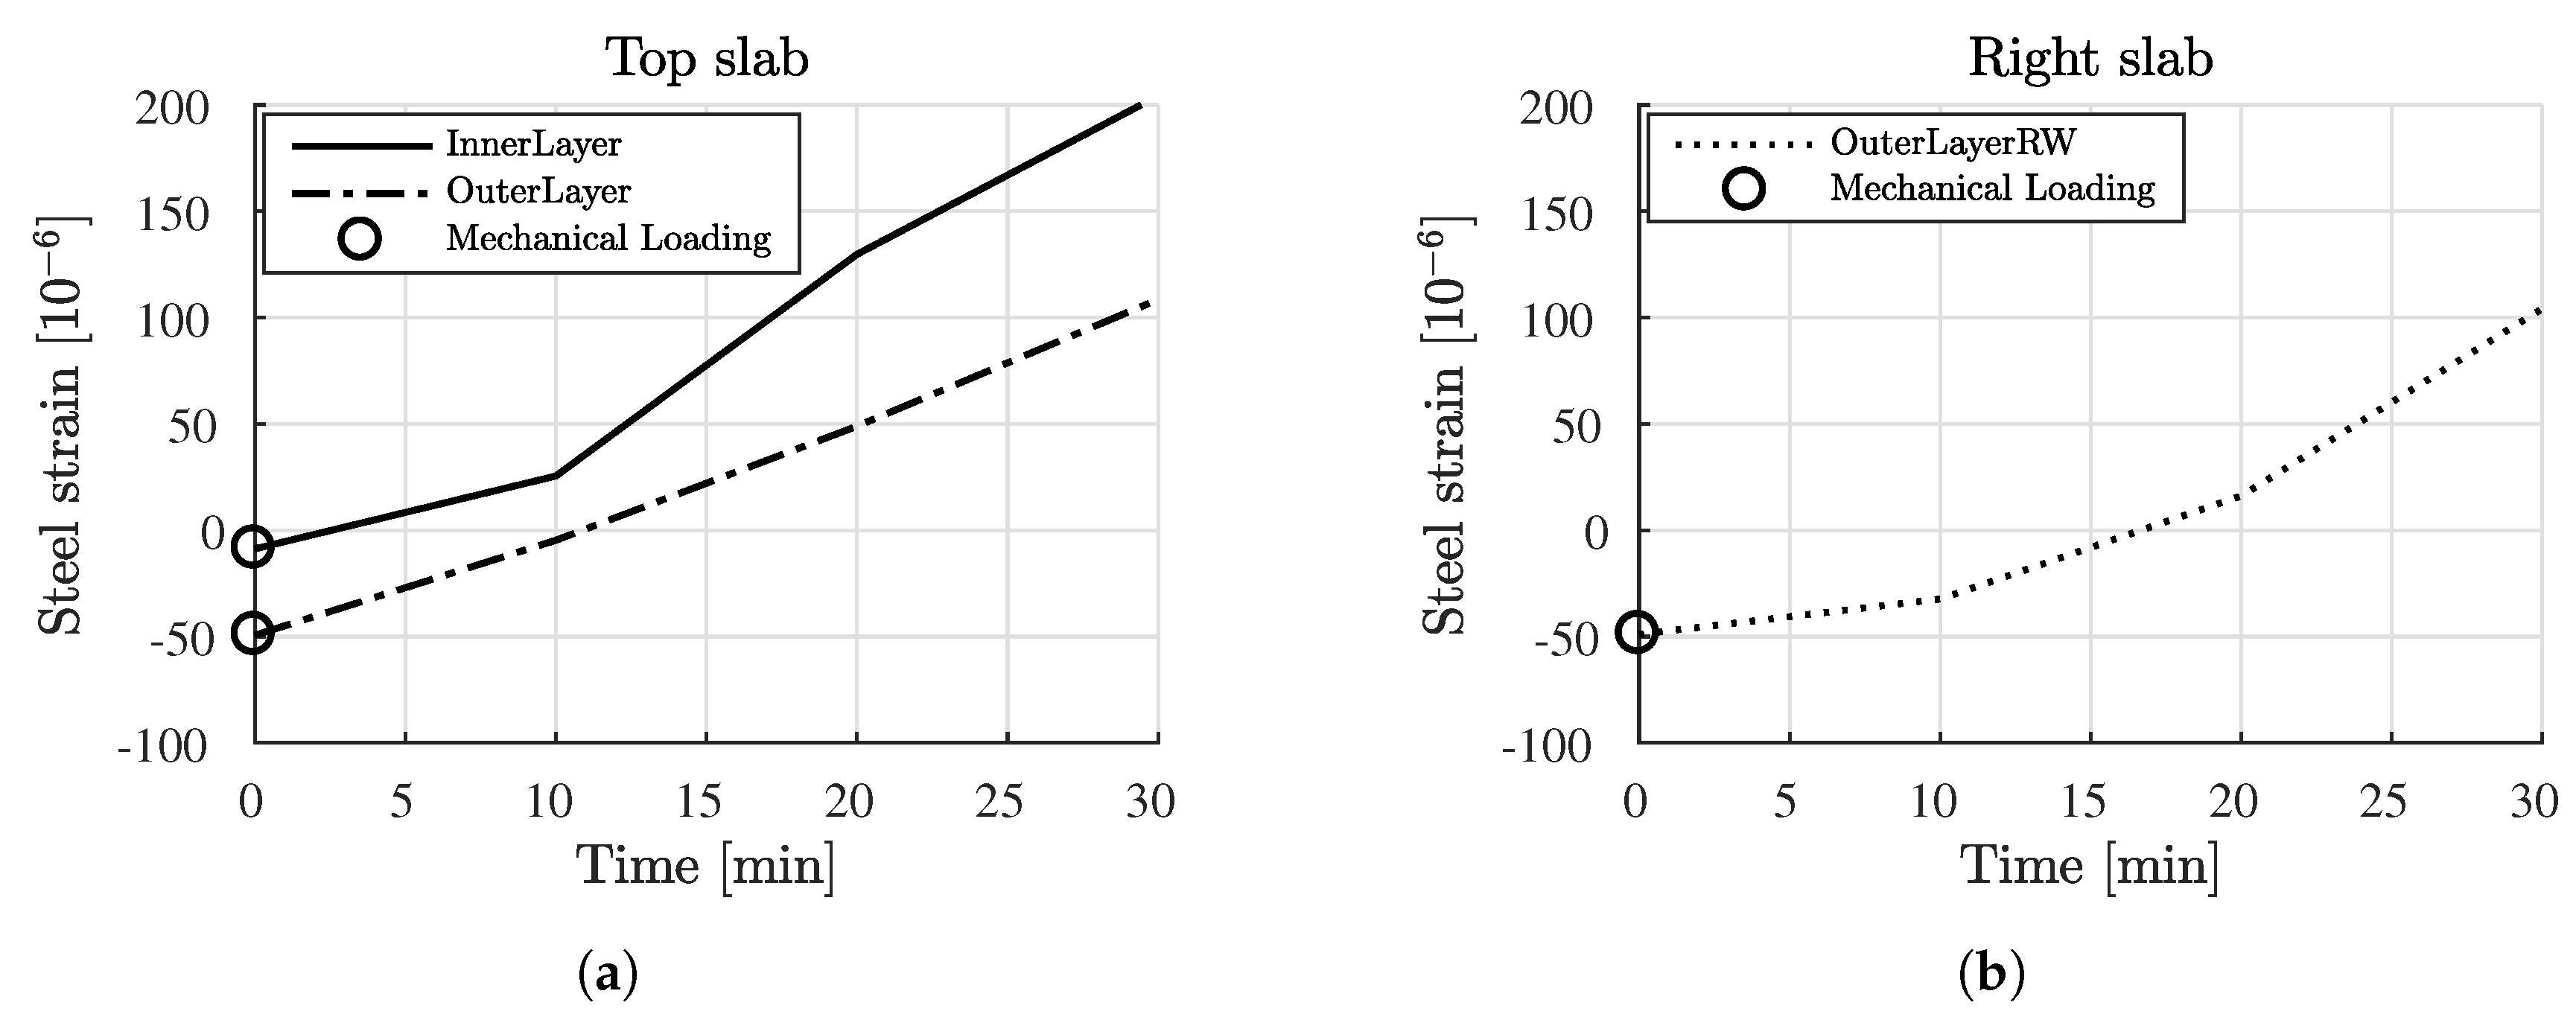
Figure 9.
Measured evolutions of total strains of steel rebar: (a) top slab, at the midspan of the left cell, and (b) center of the right wall.
Figure 9.
Measured evolutions of total strains of steel rebar: (a) top slab, at the midspan of the left cell, and (b) center of the right wall.
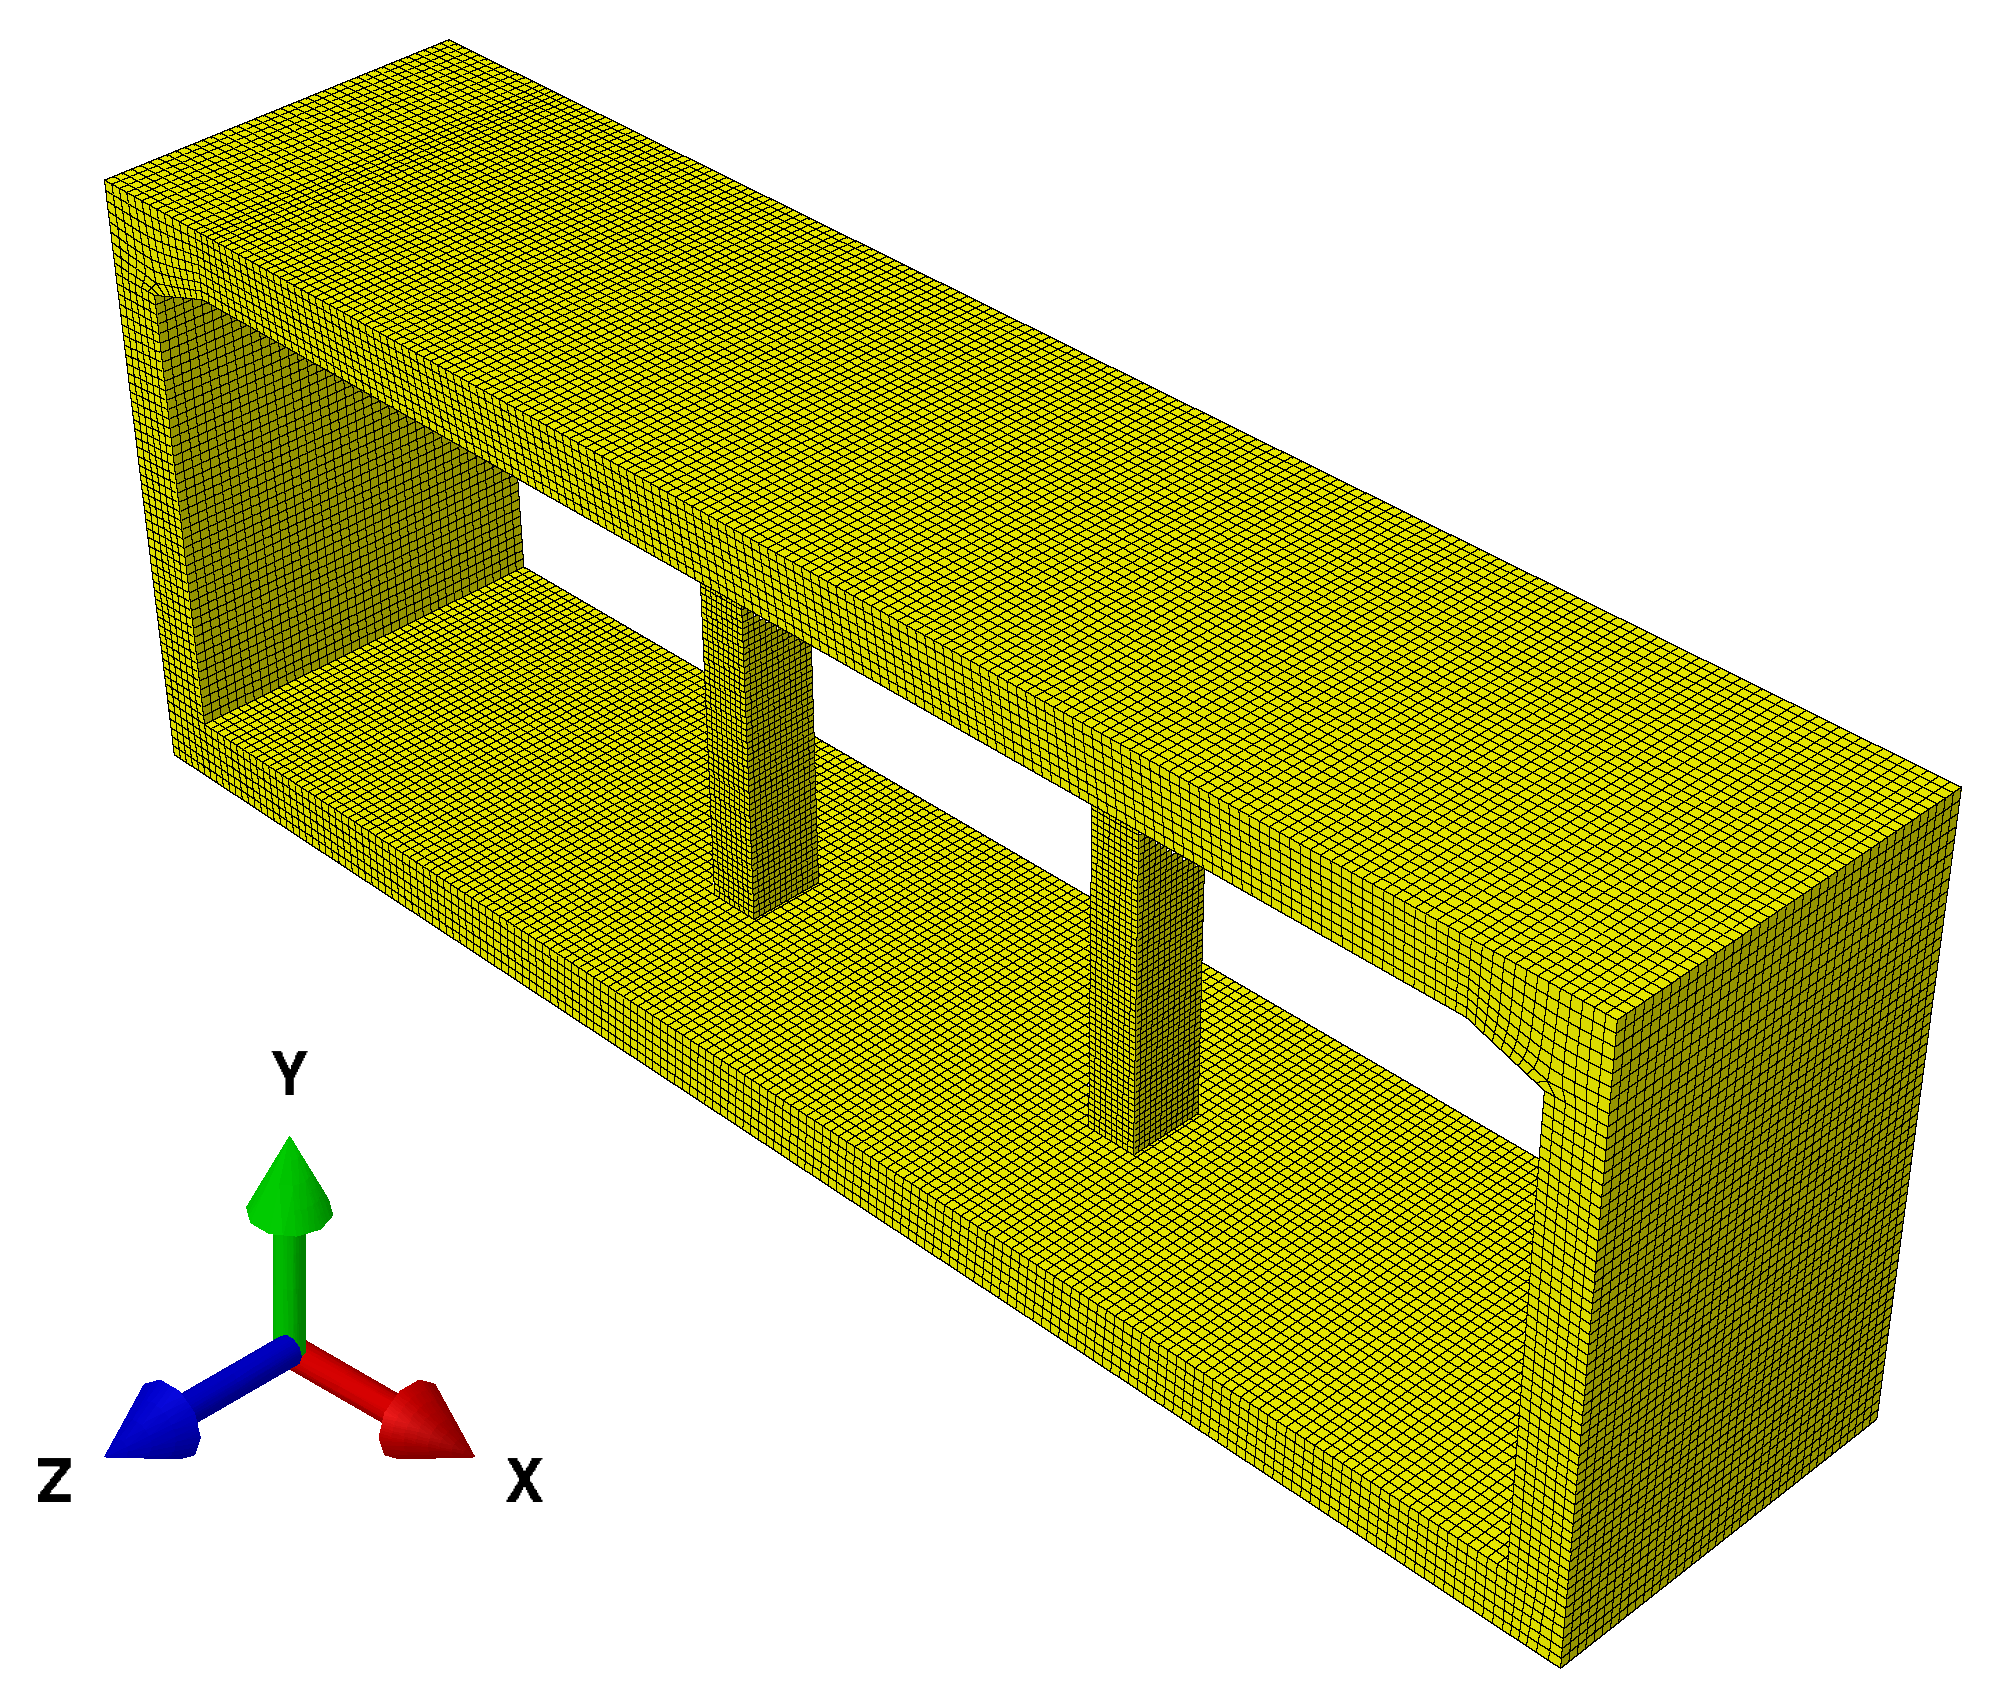
Figure 10.
Three-dimensional Finite Element mesh of the analyzed structure and the Cartesian coordinate system used.
Figure 10.
Three-dimensional Finite Element mesh of the analyzed structure and the Cartesian coordinate system used.
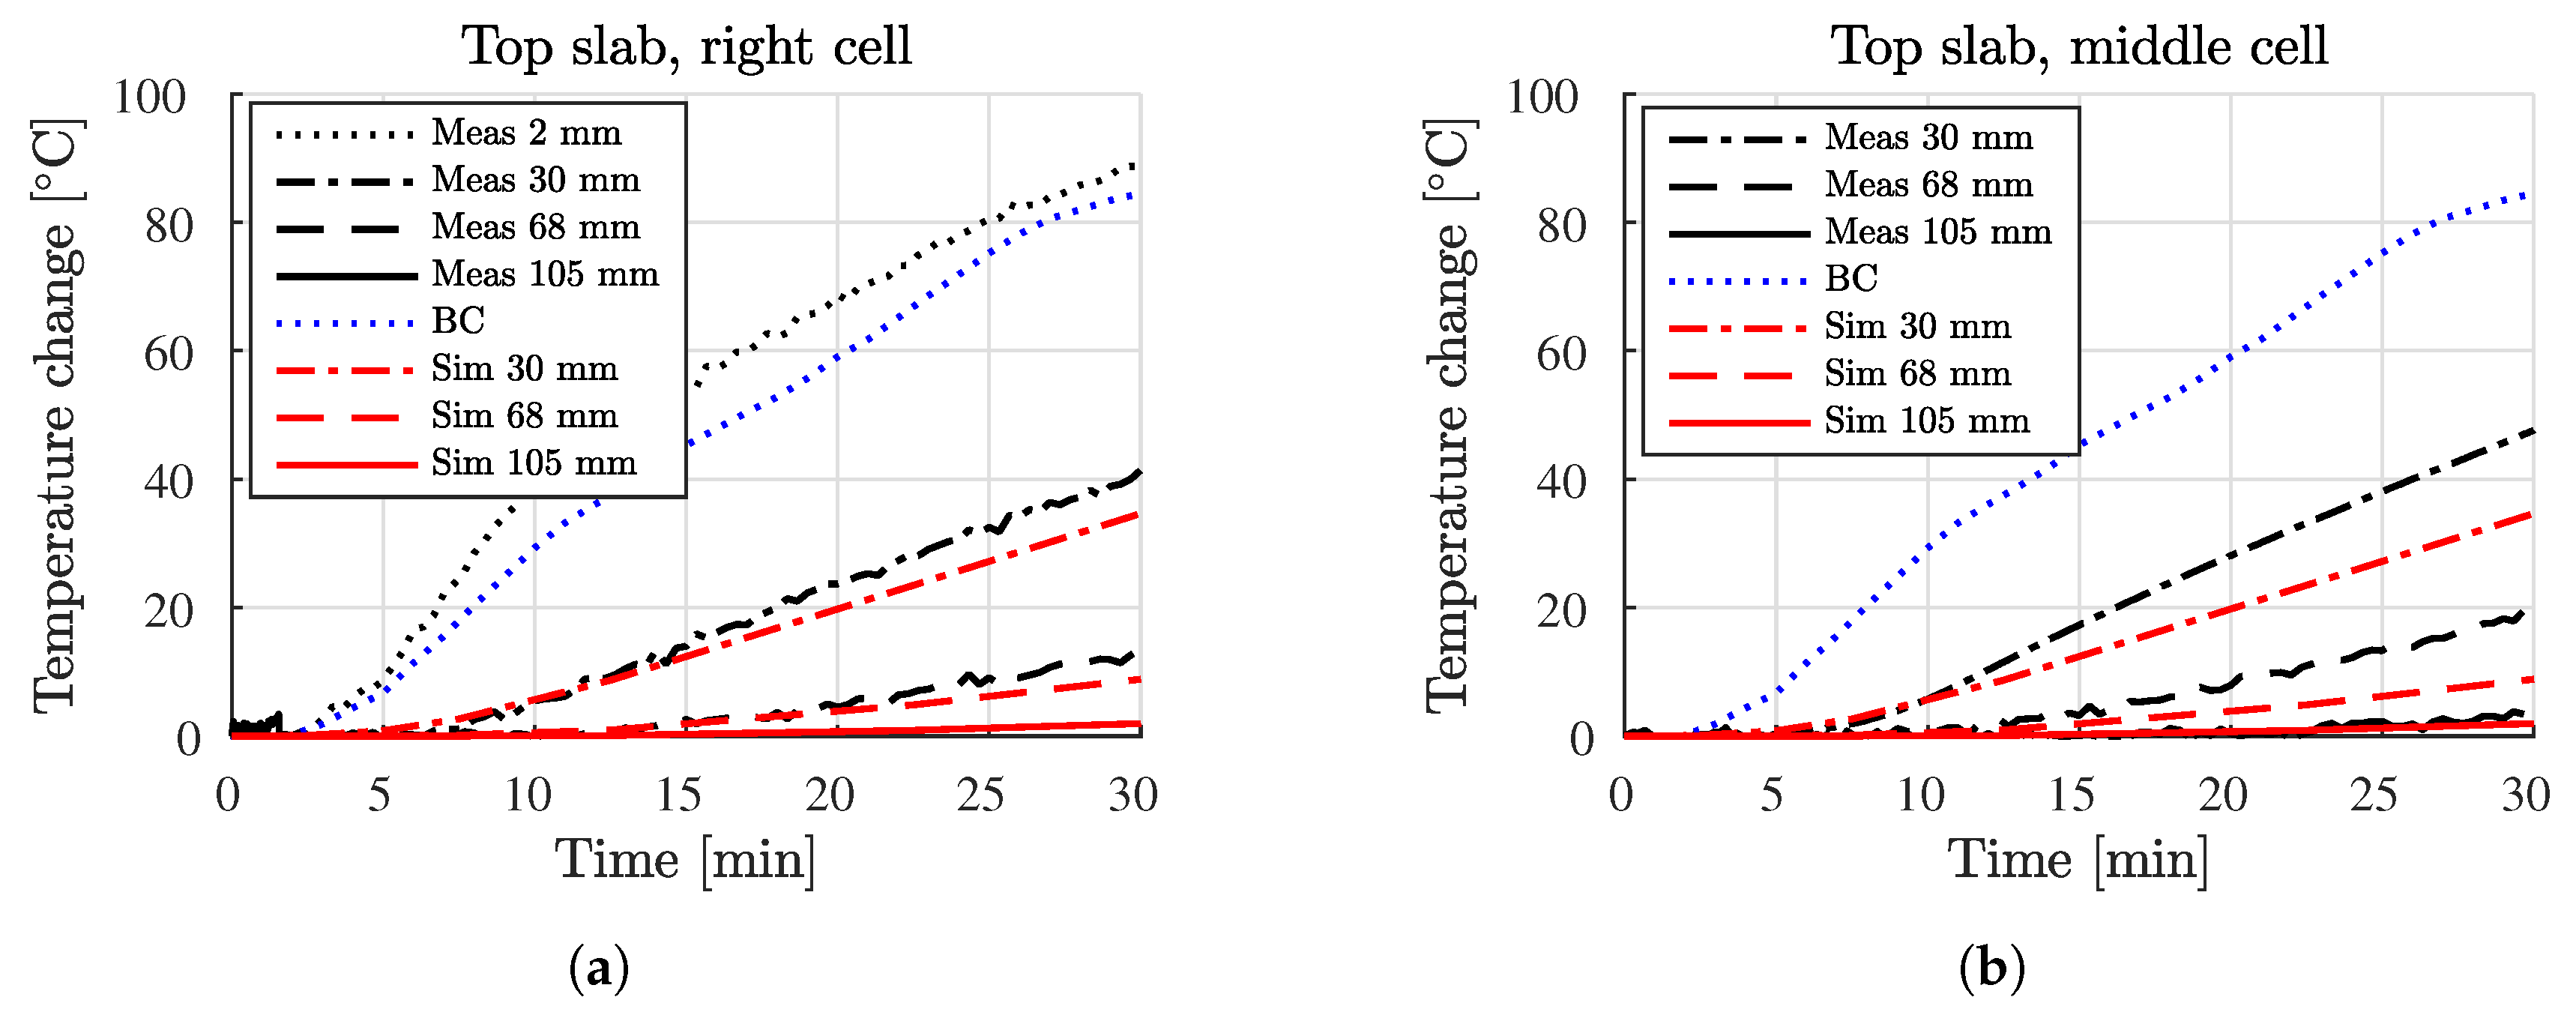
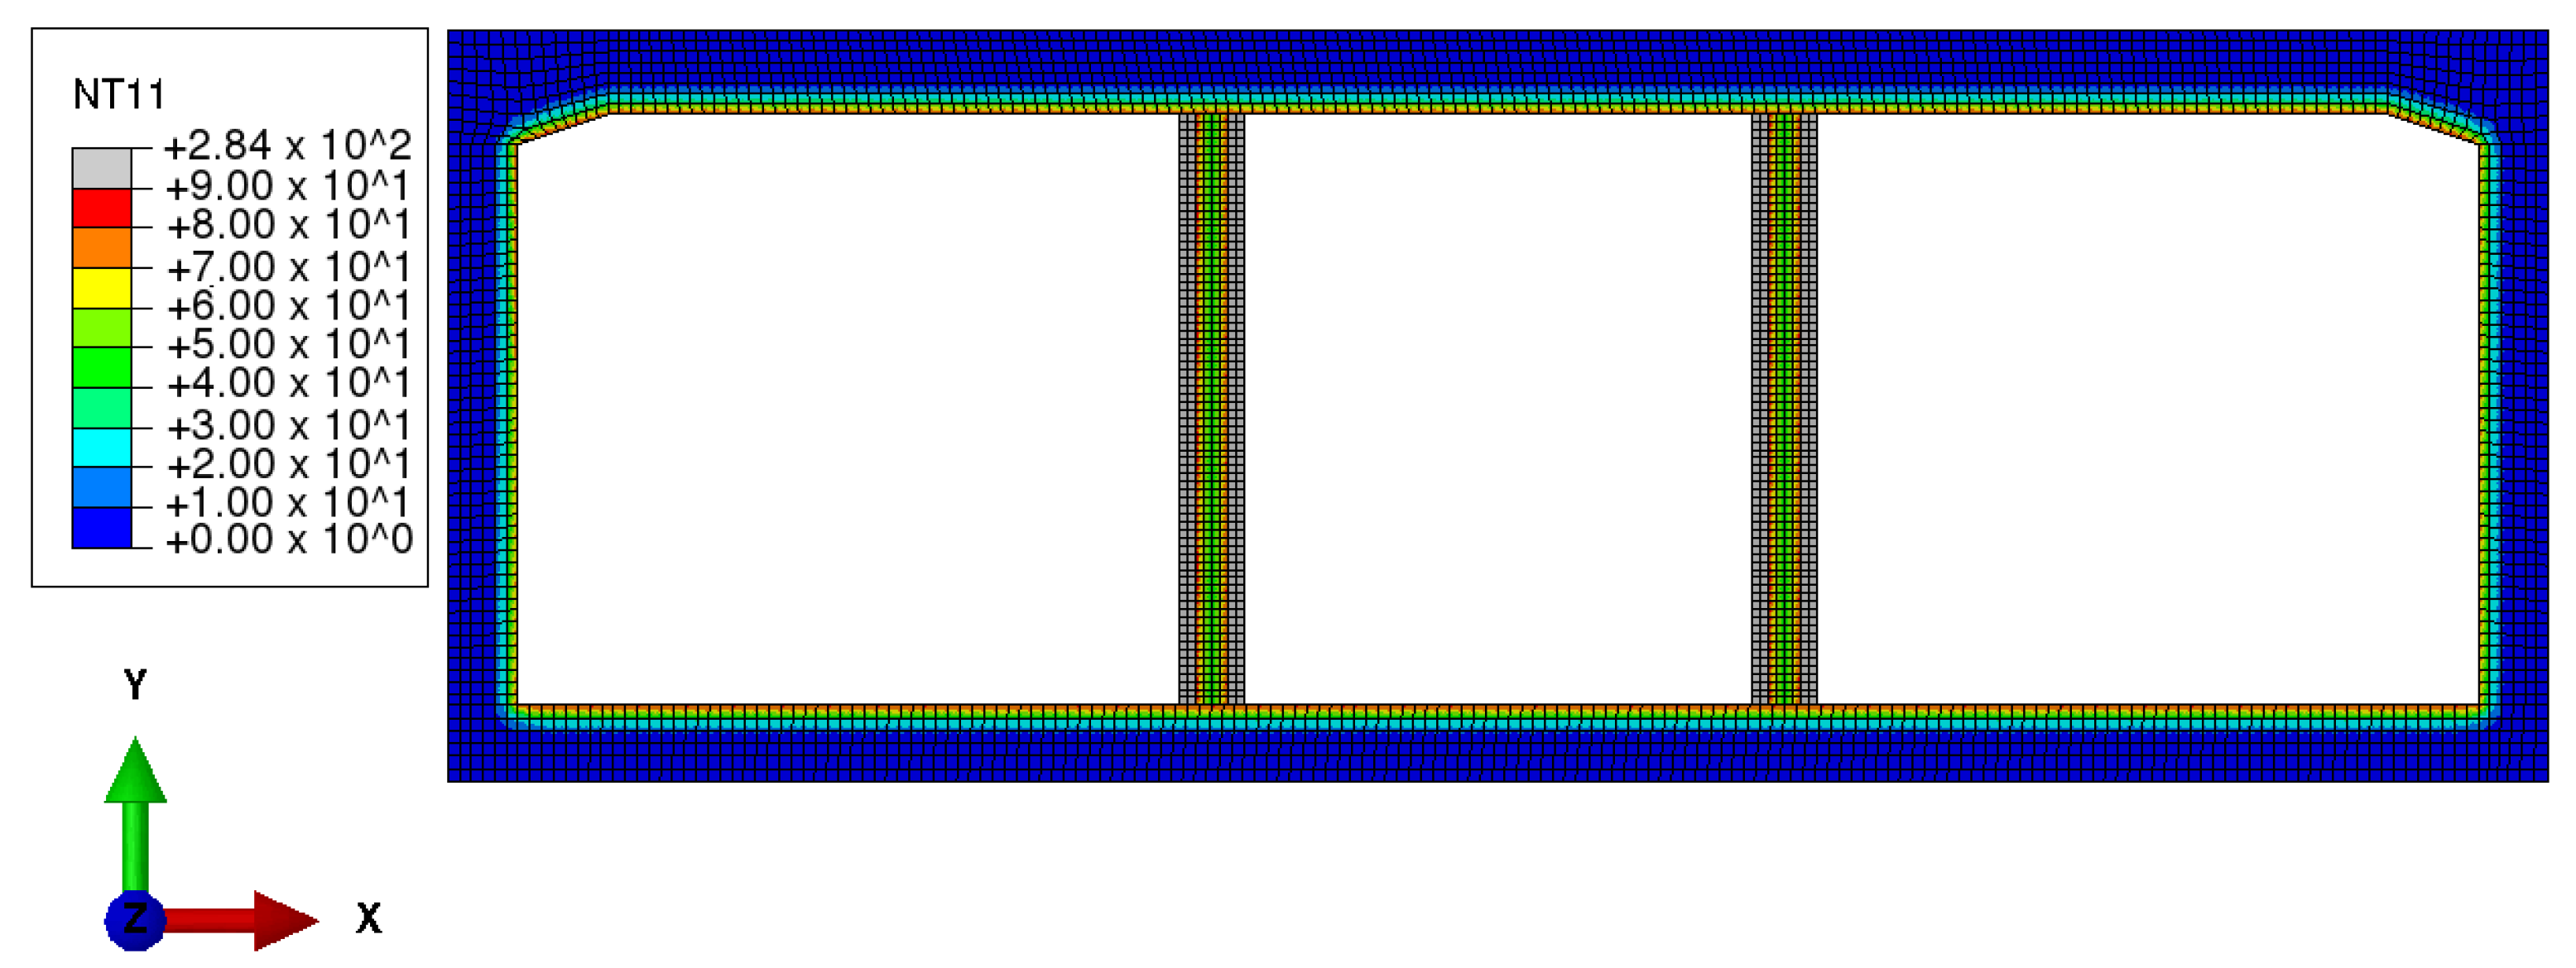
Figure 11.
Comparison of simulated evolutions of the temperature inside the analyzed structure, obtained by prescribing a spatially-uniform temperature history along the entire inner surface, with experimental data: (a) top slab, at the midspan of the right cell, (b) top slab, at the midspan of the middle cell, (c) top slab, at the midspan of the left cell, (d) center of the right wall (e) bottom slab, at the midspan of the middle cell, and (f) core of the right column. Sim, simulated; Meas, measured.
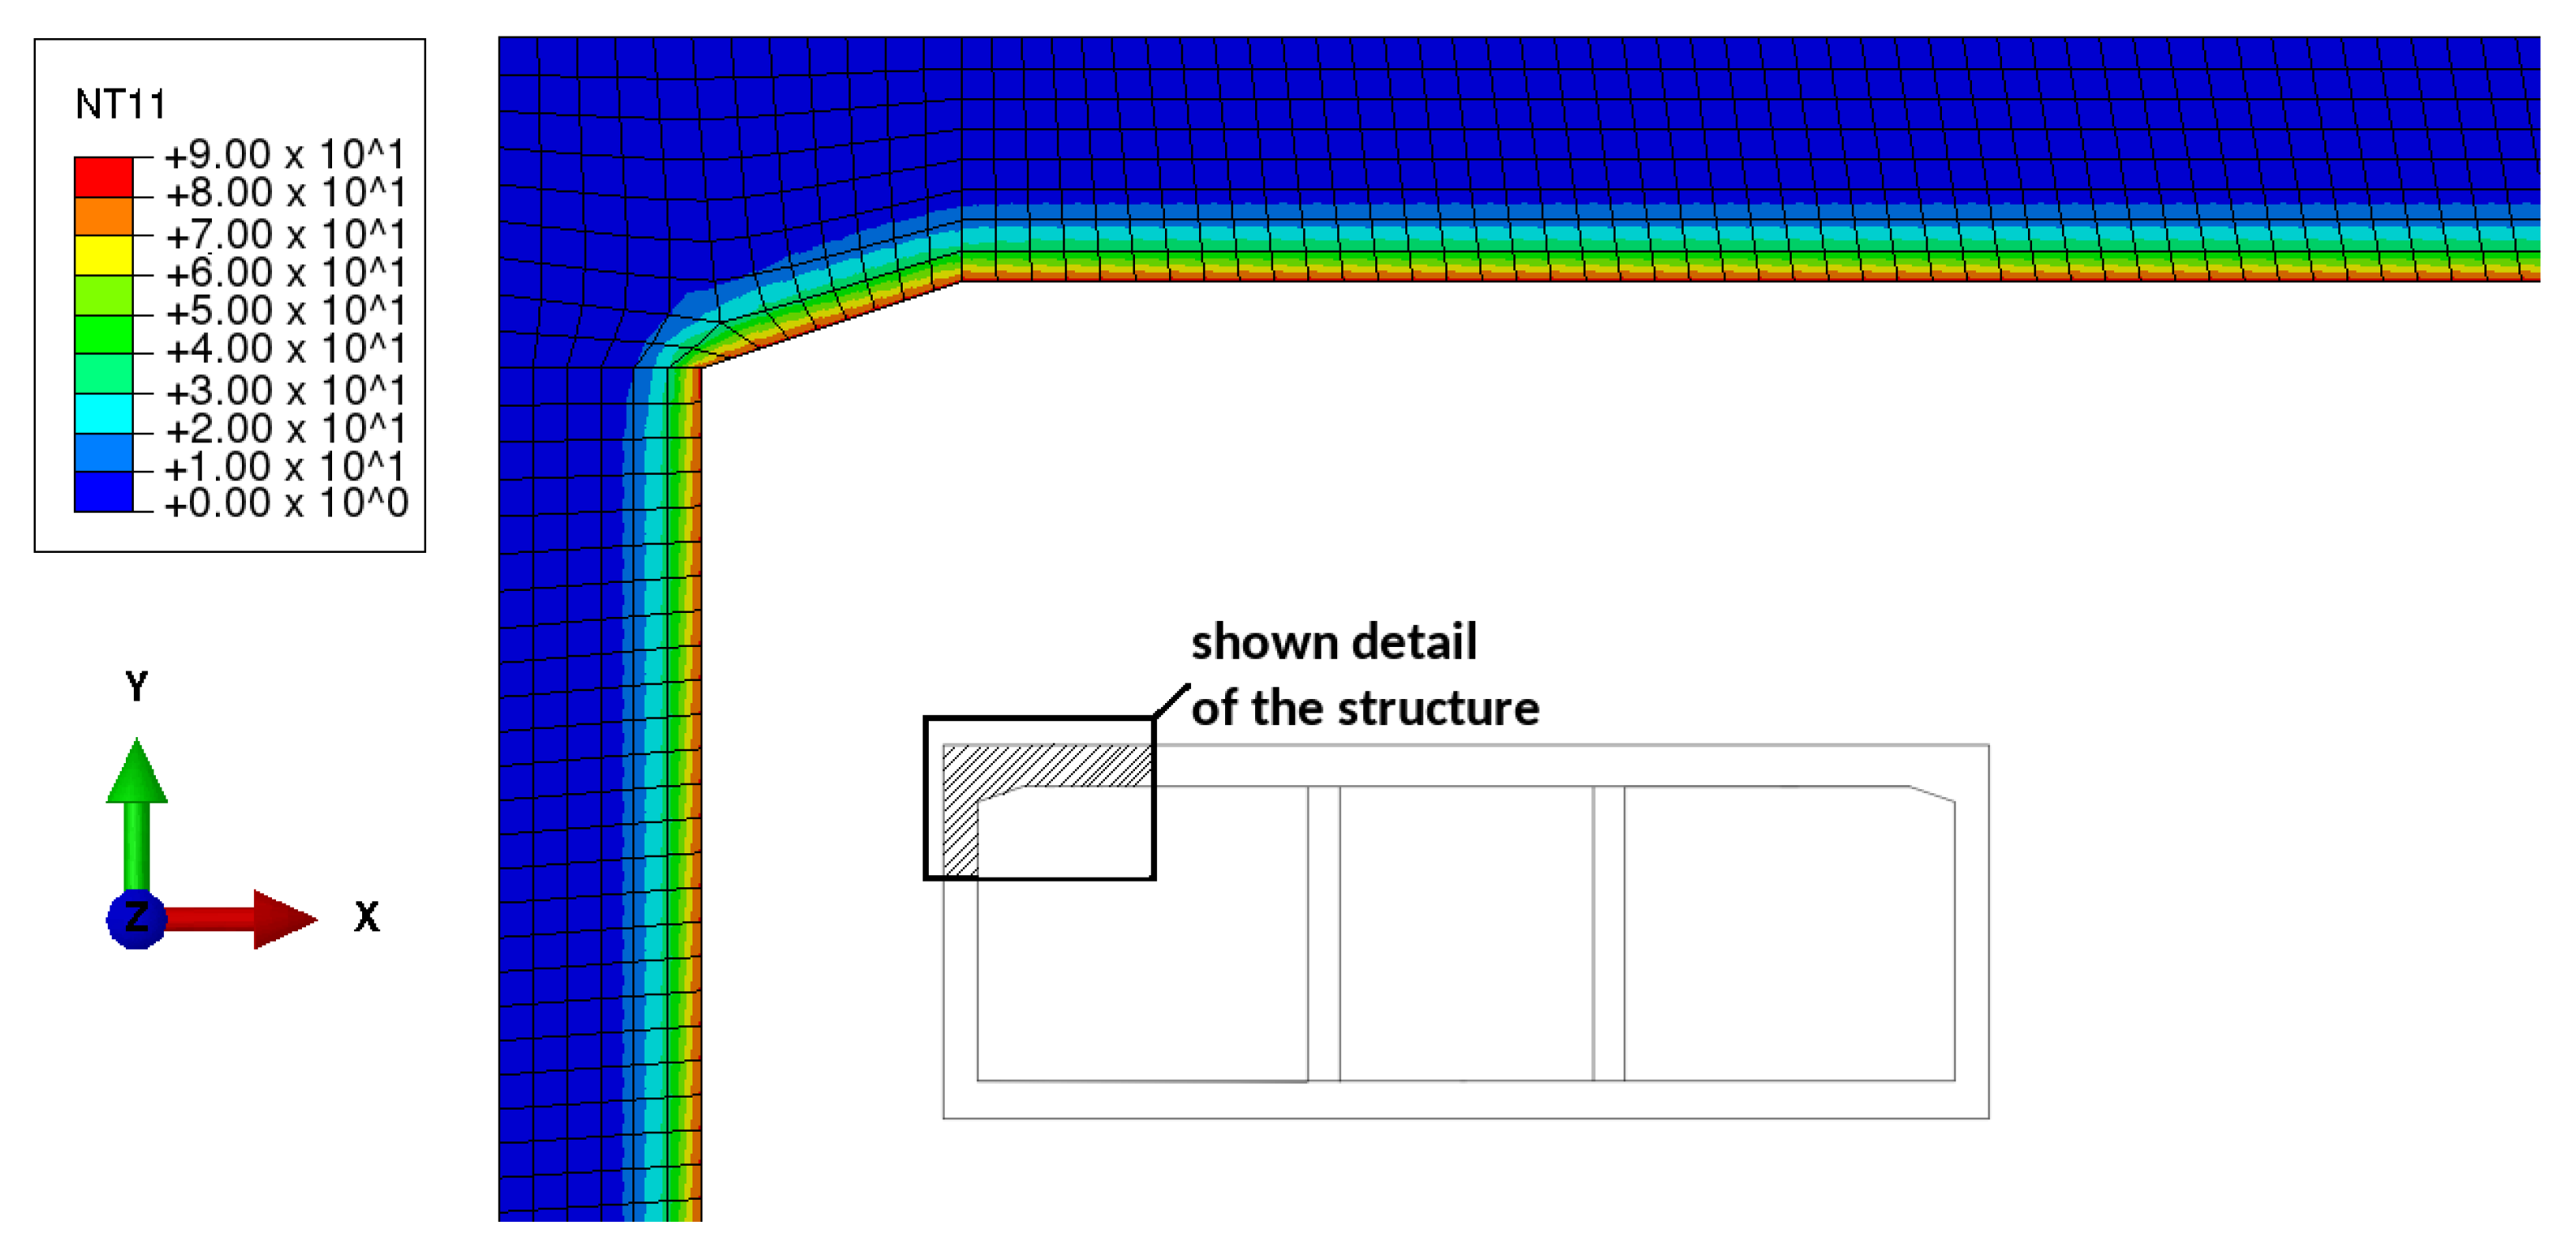
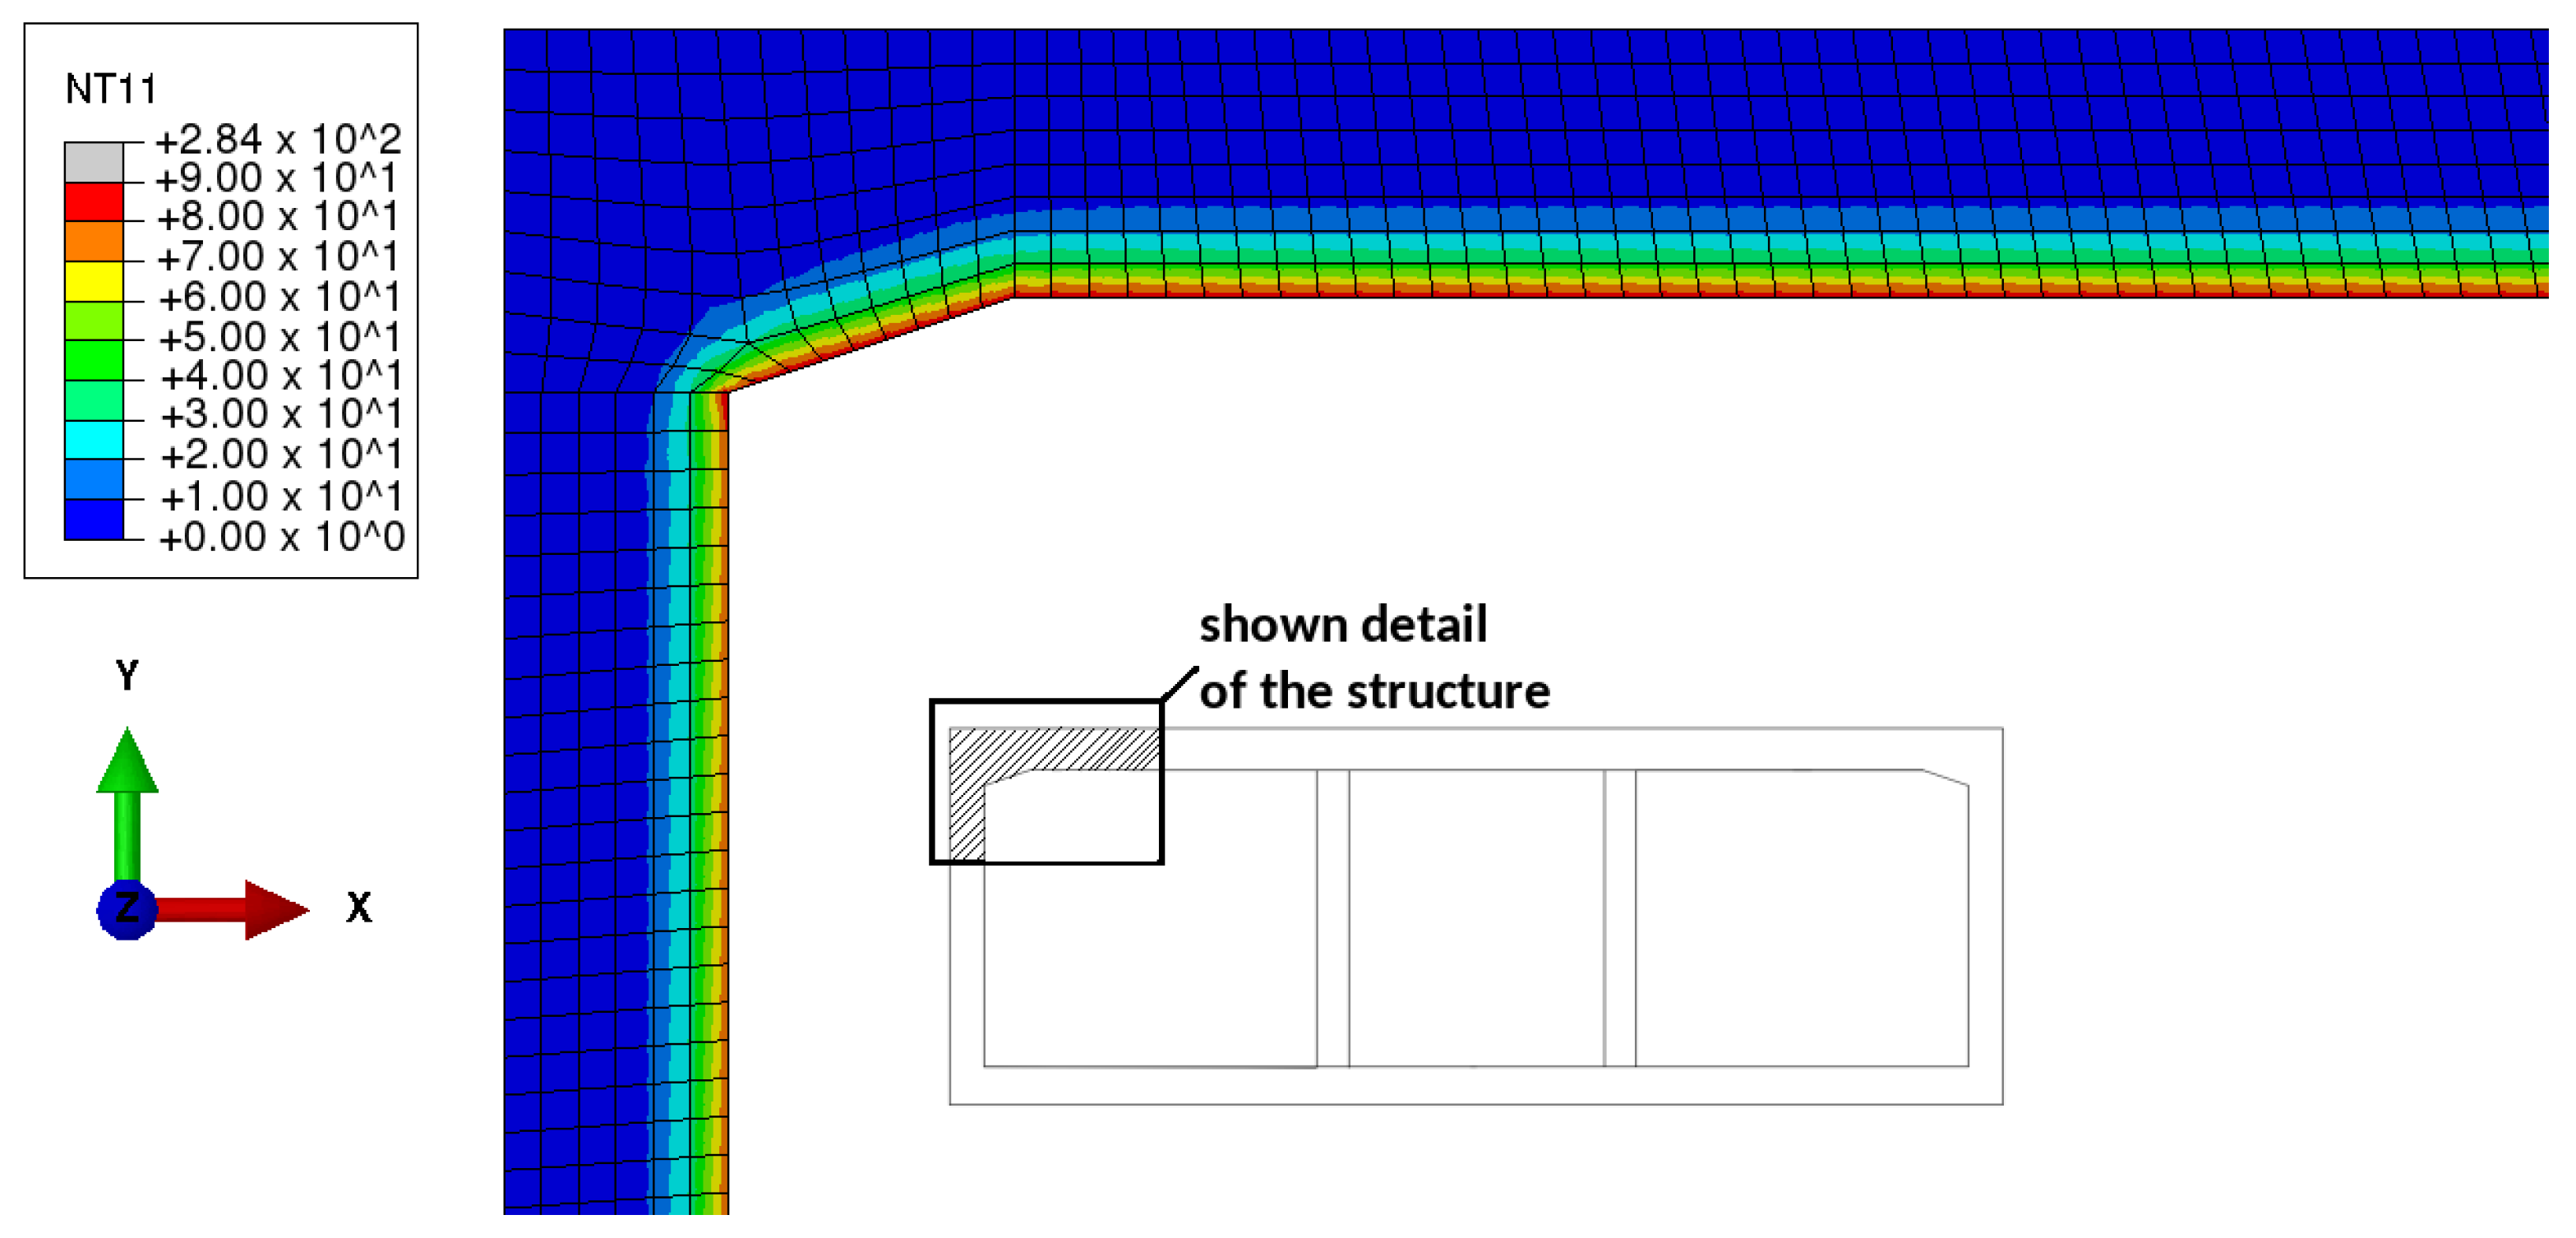
Figure 12.
Temperature distribution obtained by prescribing a uniform surface temperature history, 30 min after the start of the thermal loading: detail showing the connection of the left wall to the top slab.
Figure 12.
Temperature distribution obtained by prescribing a uniform surface temperature history, 30 min after the start of the thermal loading: detail showing the connection of the left wall to the top slab.
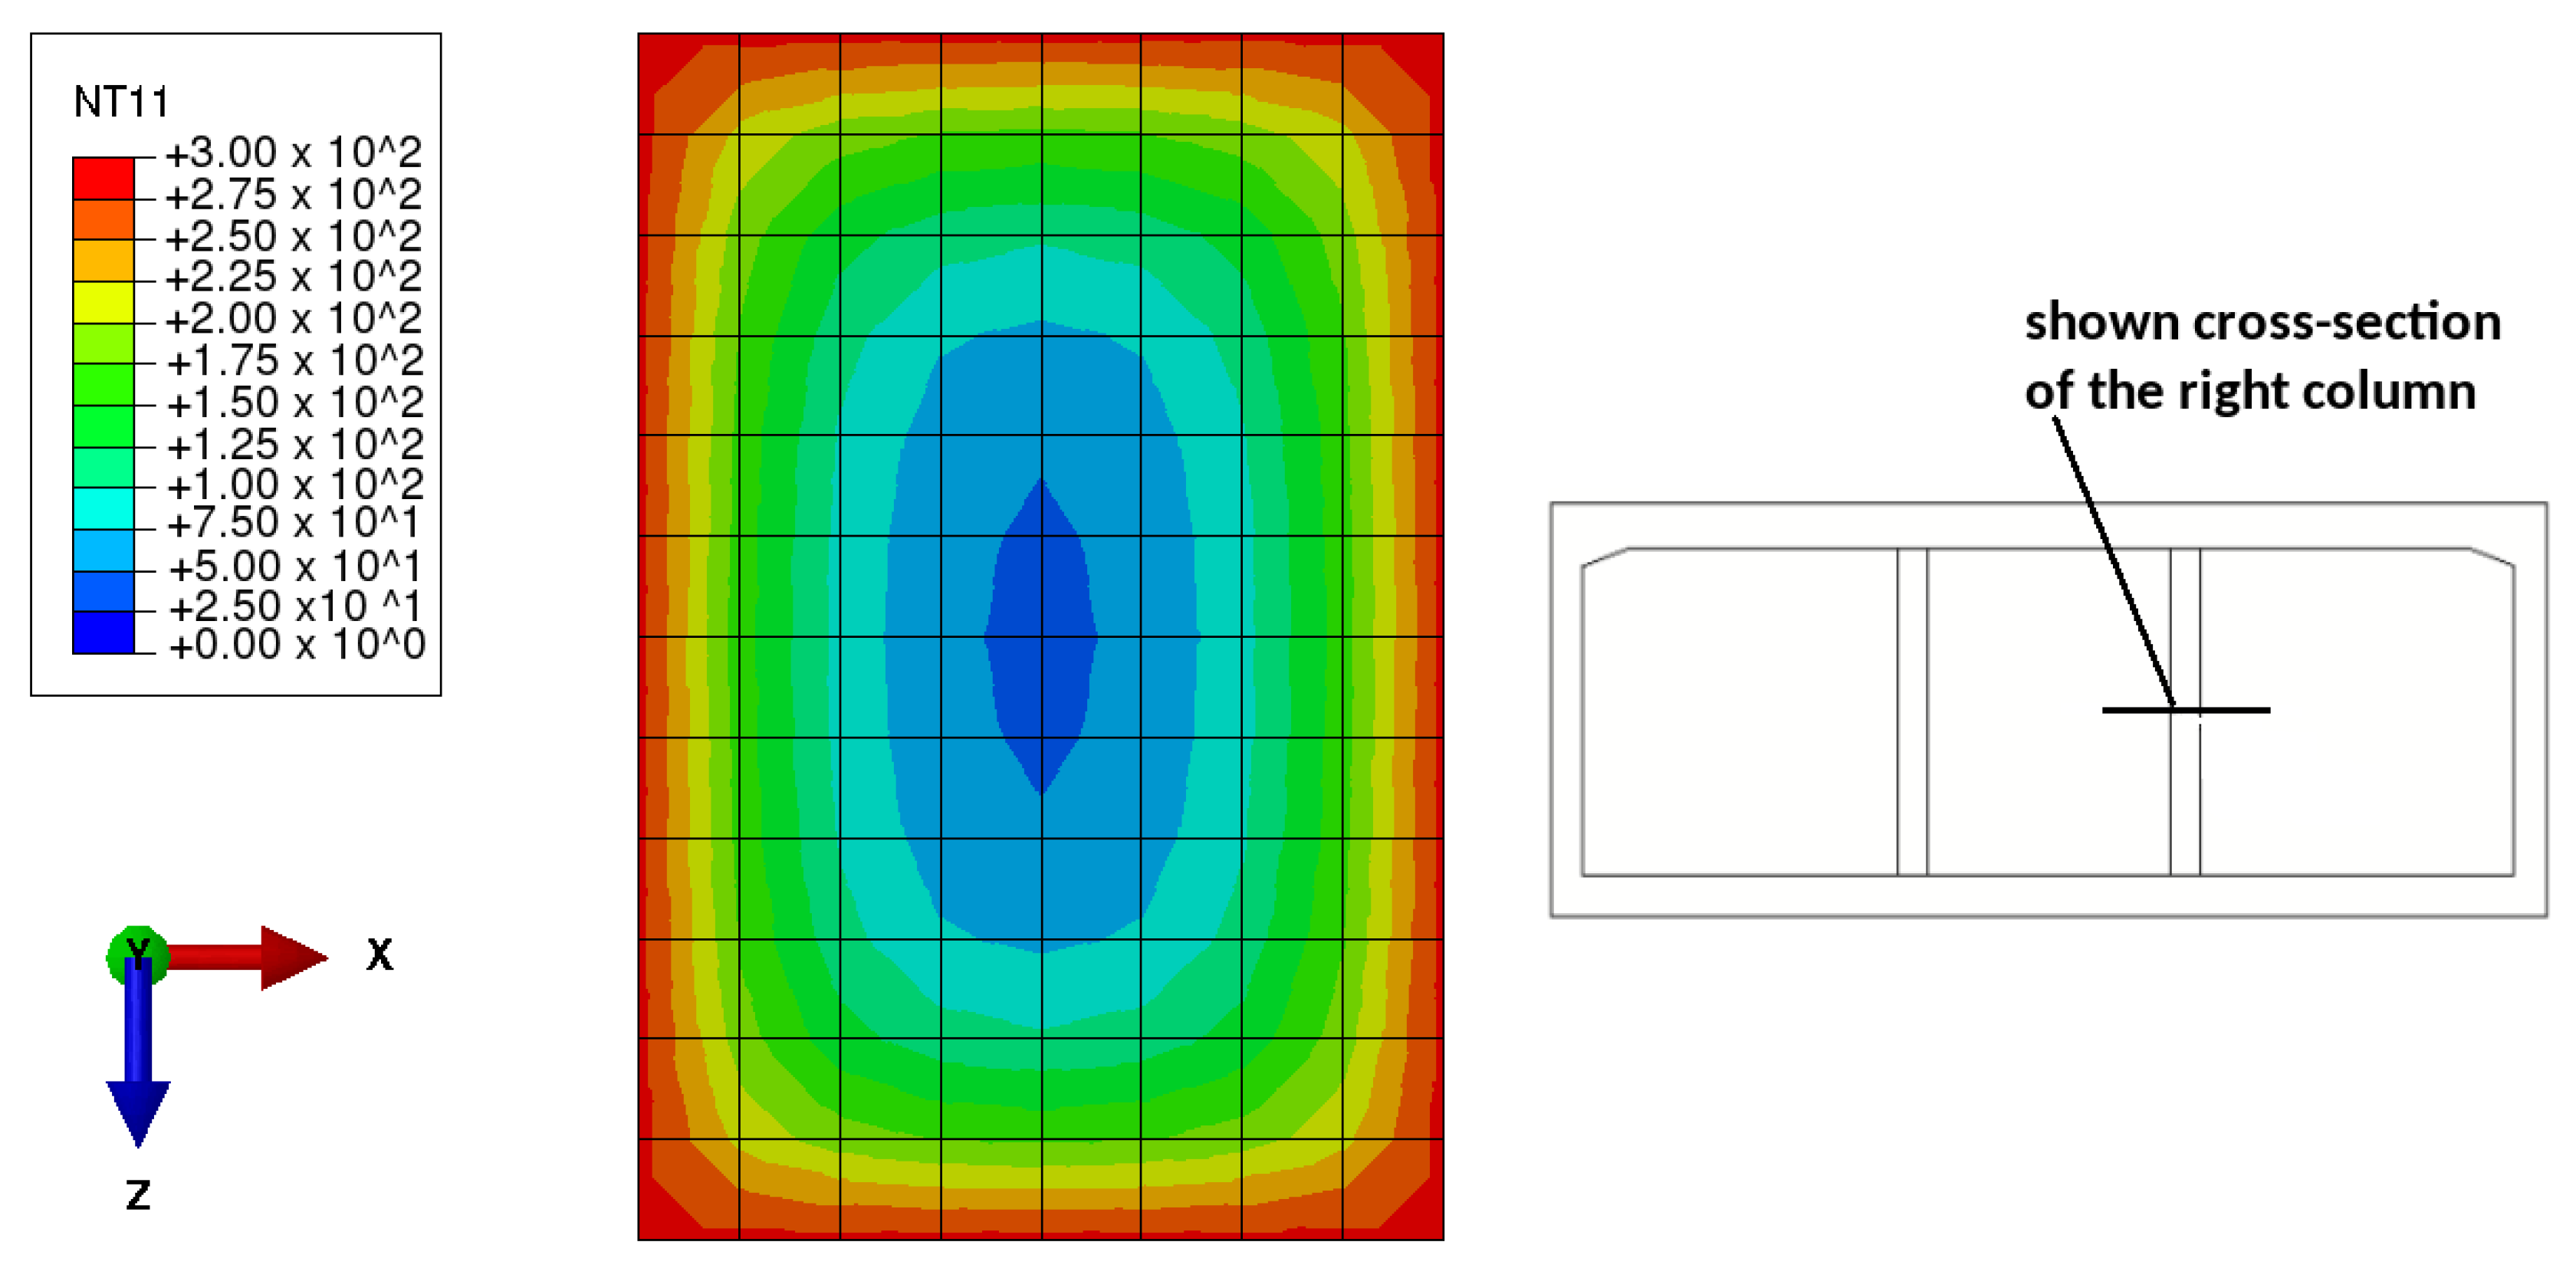
Figure 13.
Temperature distribution obtained by prescribing a uniform surface temperature history, 30 min after the start of the thermal loading: detail showing the central cross-section of the right column.
Figure 13.
Temperature distribution obtained by prescribing a uniform surface temperature history, 30 min after the start of the thermal loading: detail showing the central cross-section of the right column.
Figure 14.
Comparison of the simulated evolutions of the temperature inside the analyzed structure, obtained by prescribing three piecewise spatially-uniform temperature histories along the inner surface, with experimental data: (a) top slab, at the midspan of the middle cell, (b) top slab, at the midspan of the right cell, (c) top slab, at the midspan of the left cell, (d) center of the right wall (e) bottom slab, at the midspan of the middle cell, and (f) core of the right column.
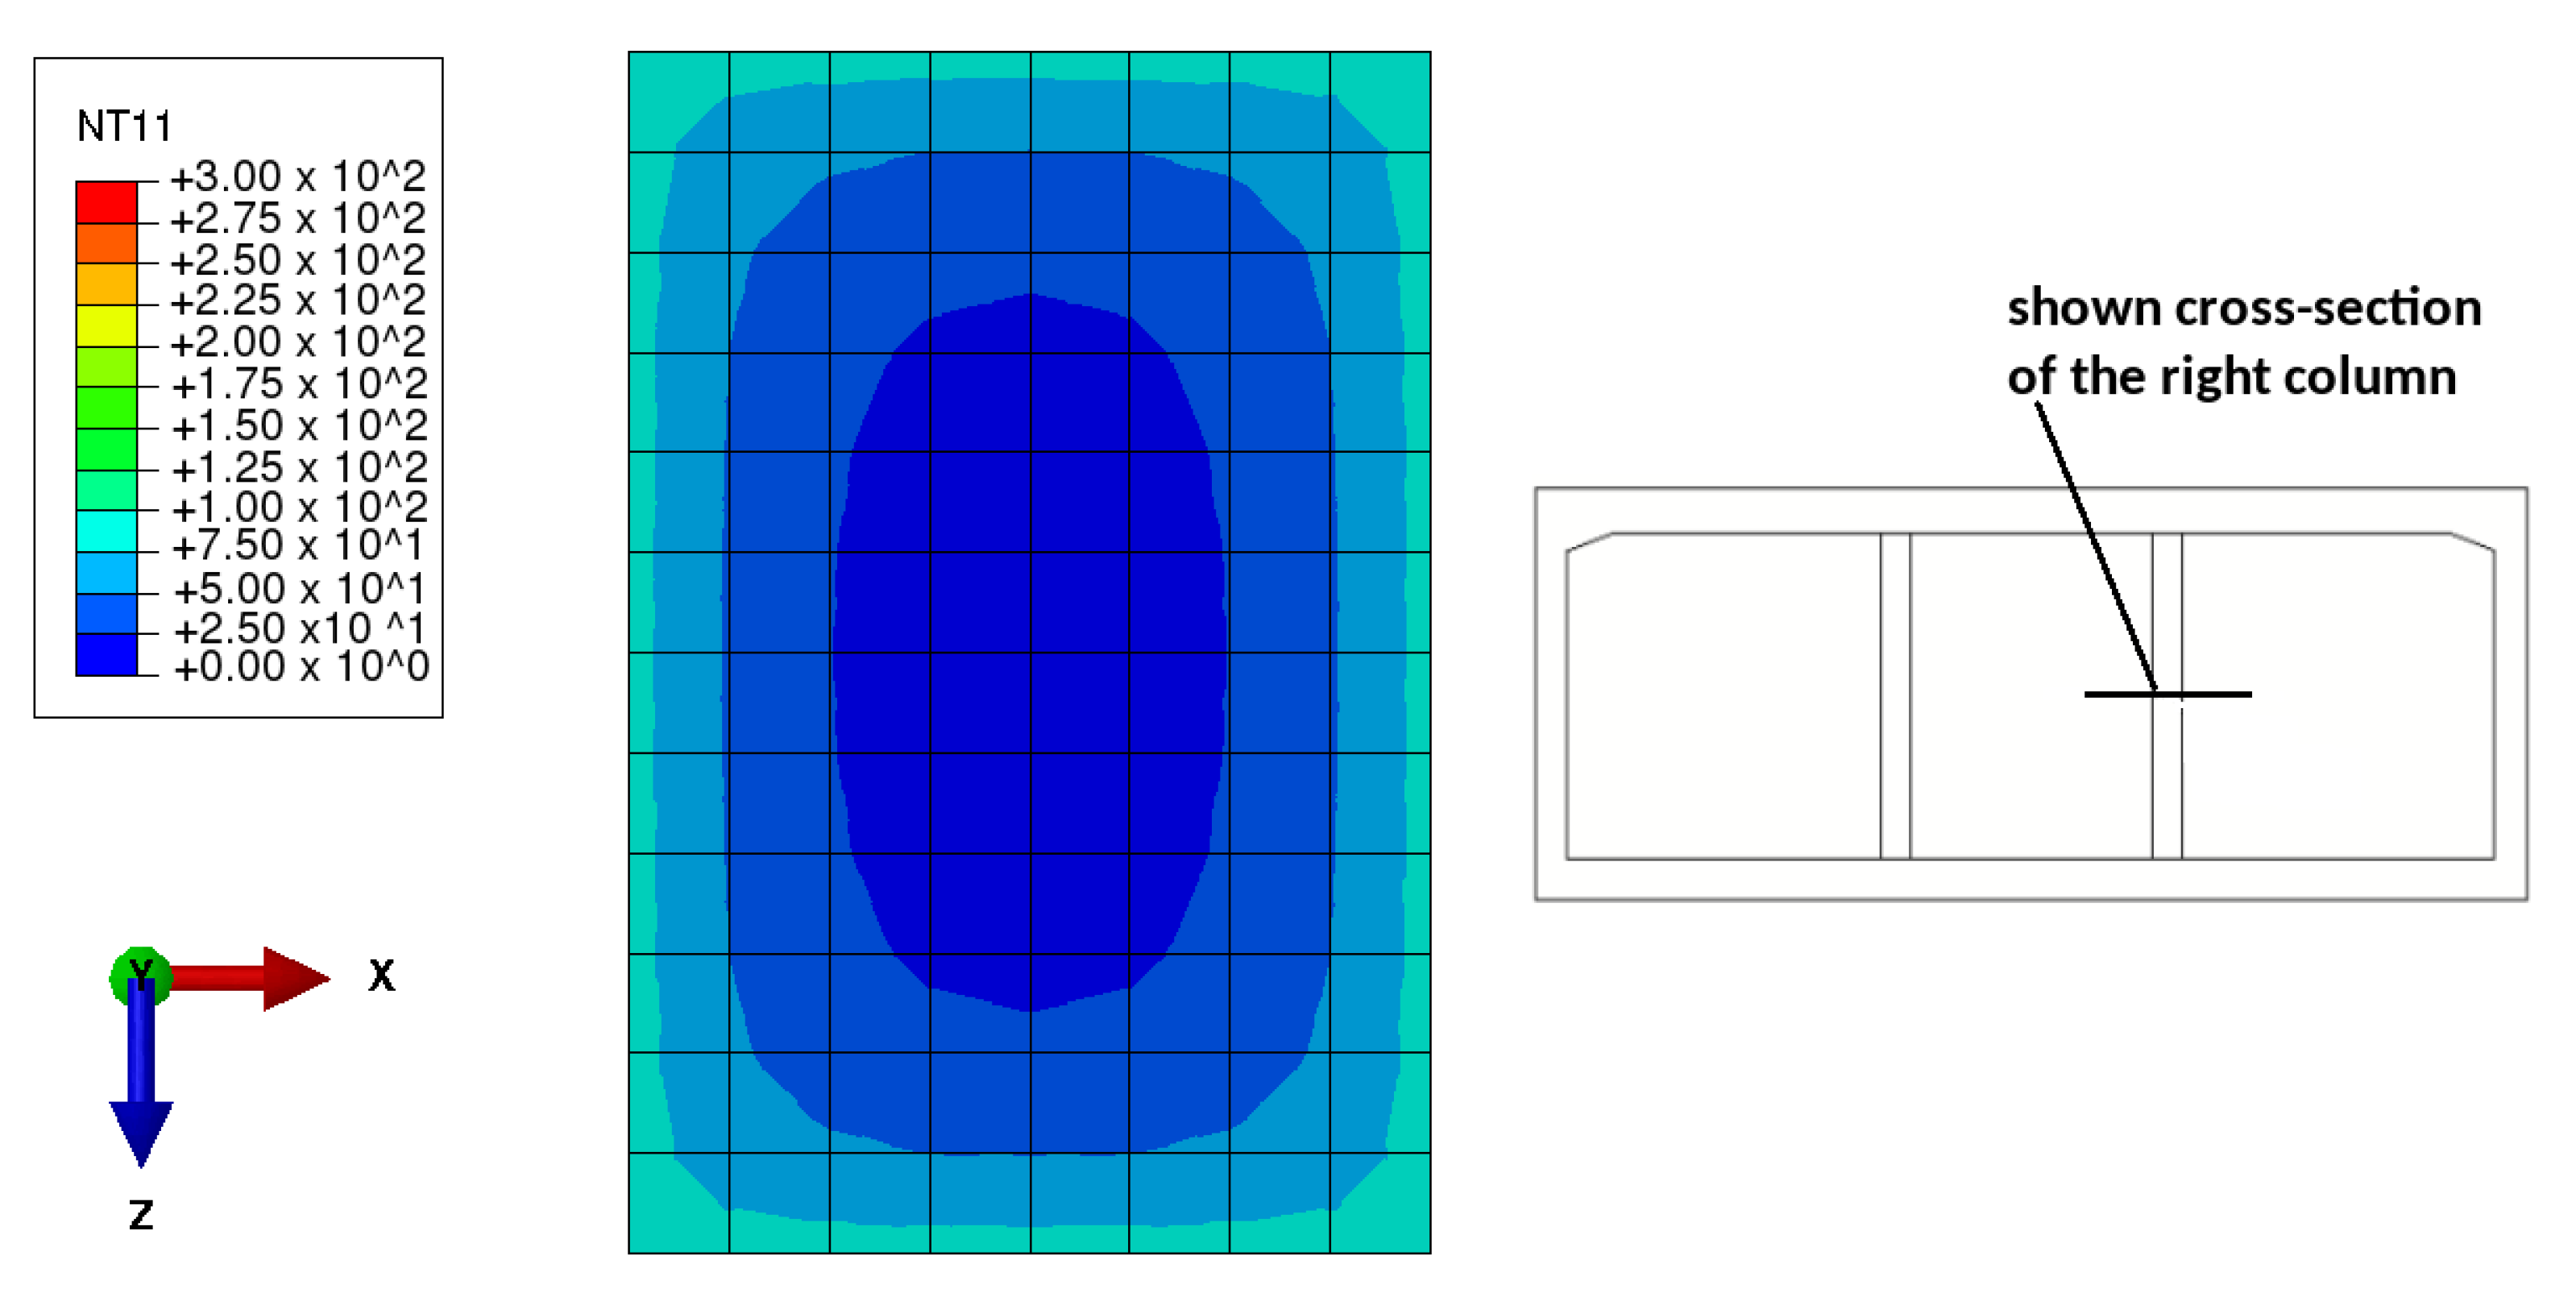
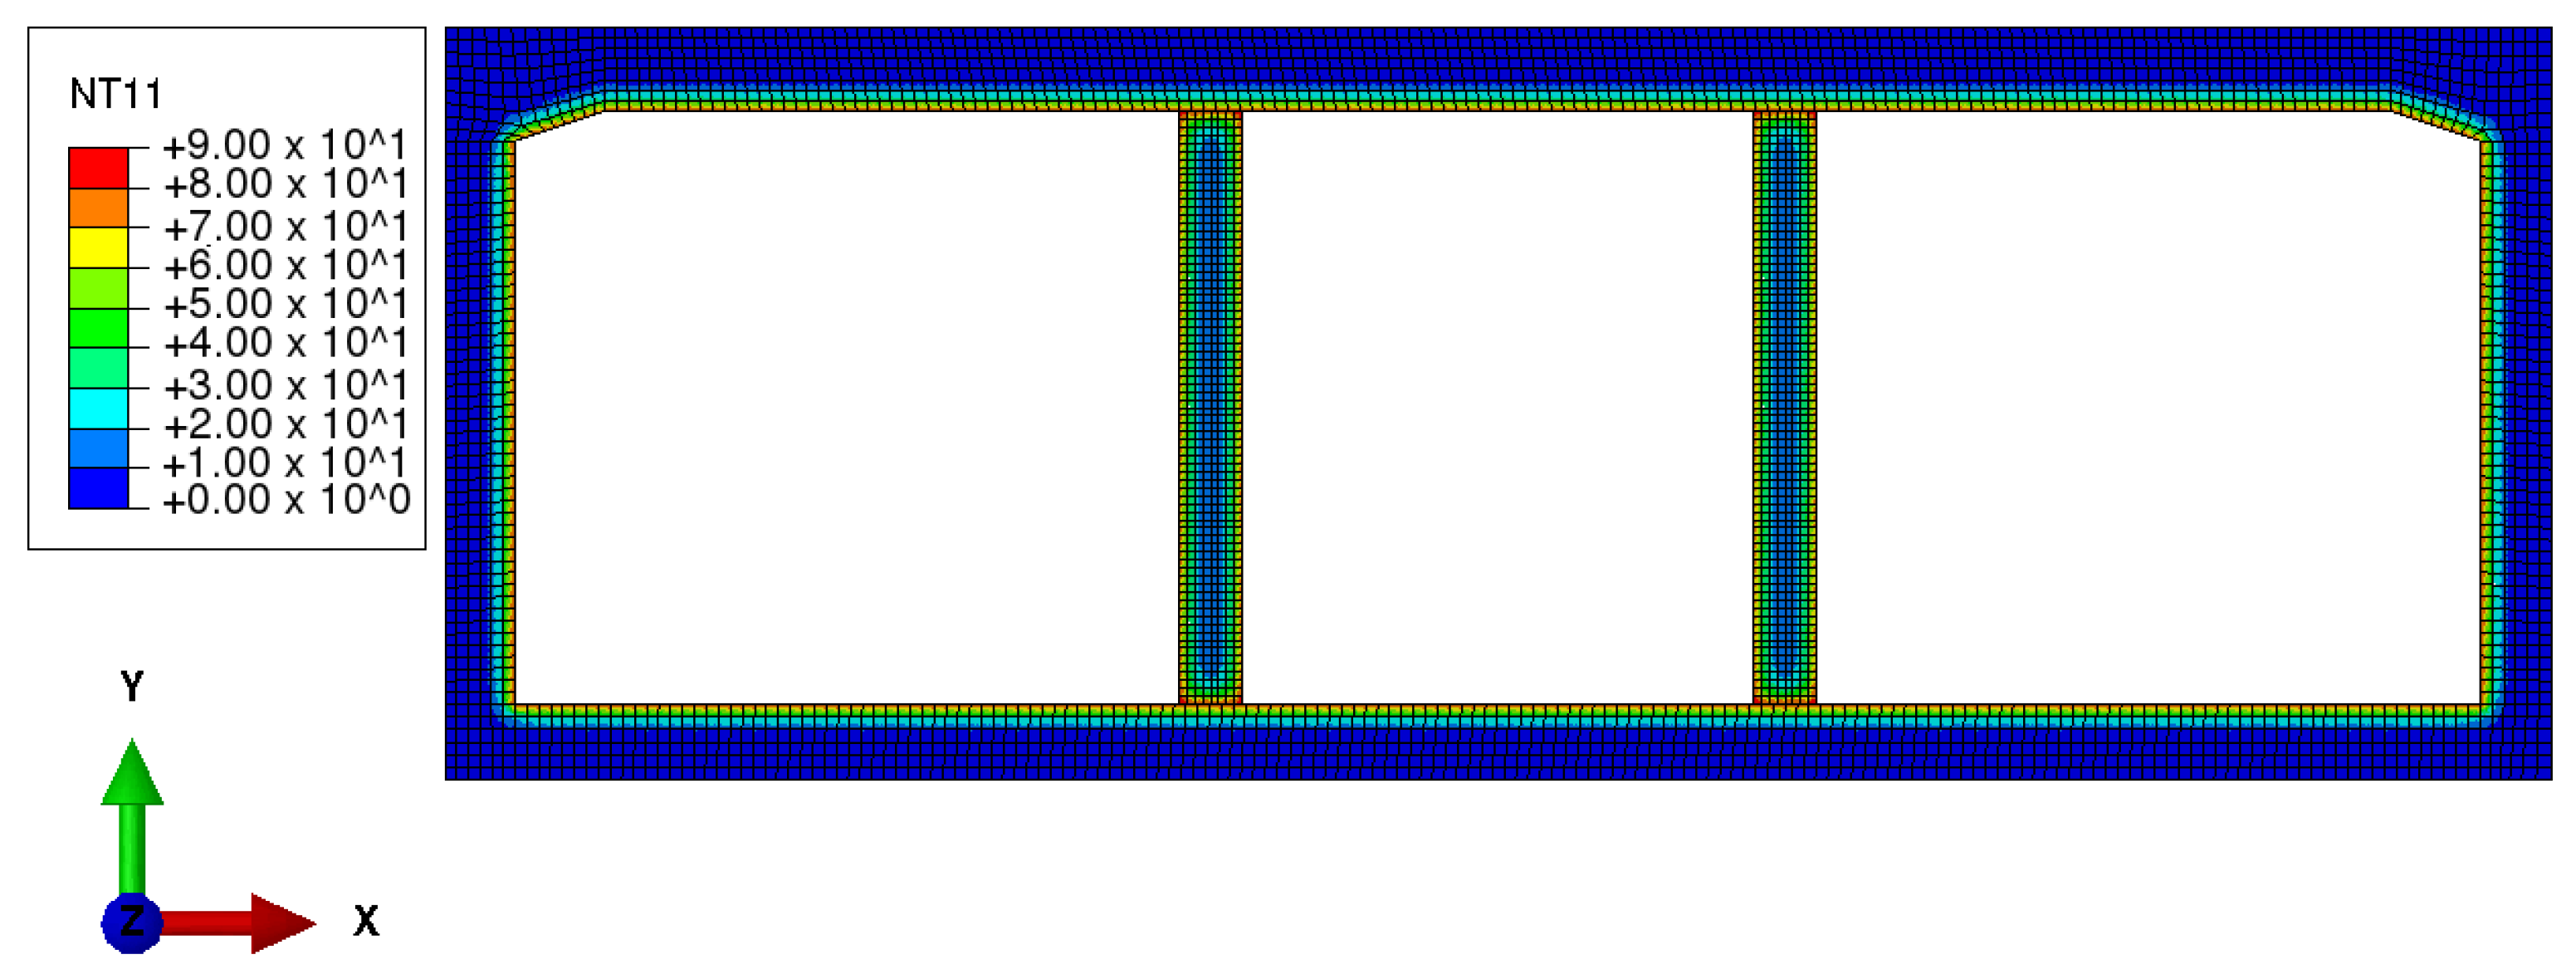
Figure 15.
Temperature distribution obtained by prescribing three piecewise uniform surface temperature histories, 30 min after the start of the thermal loading: detail showing the central cross-section of the right column.
Figure 15.
Temperature distribution obtained by prescribing three piecewise uniform surface temperature histories, 30 min after the start of the thermal loading: detail showing the central cross-section of the right column.
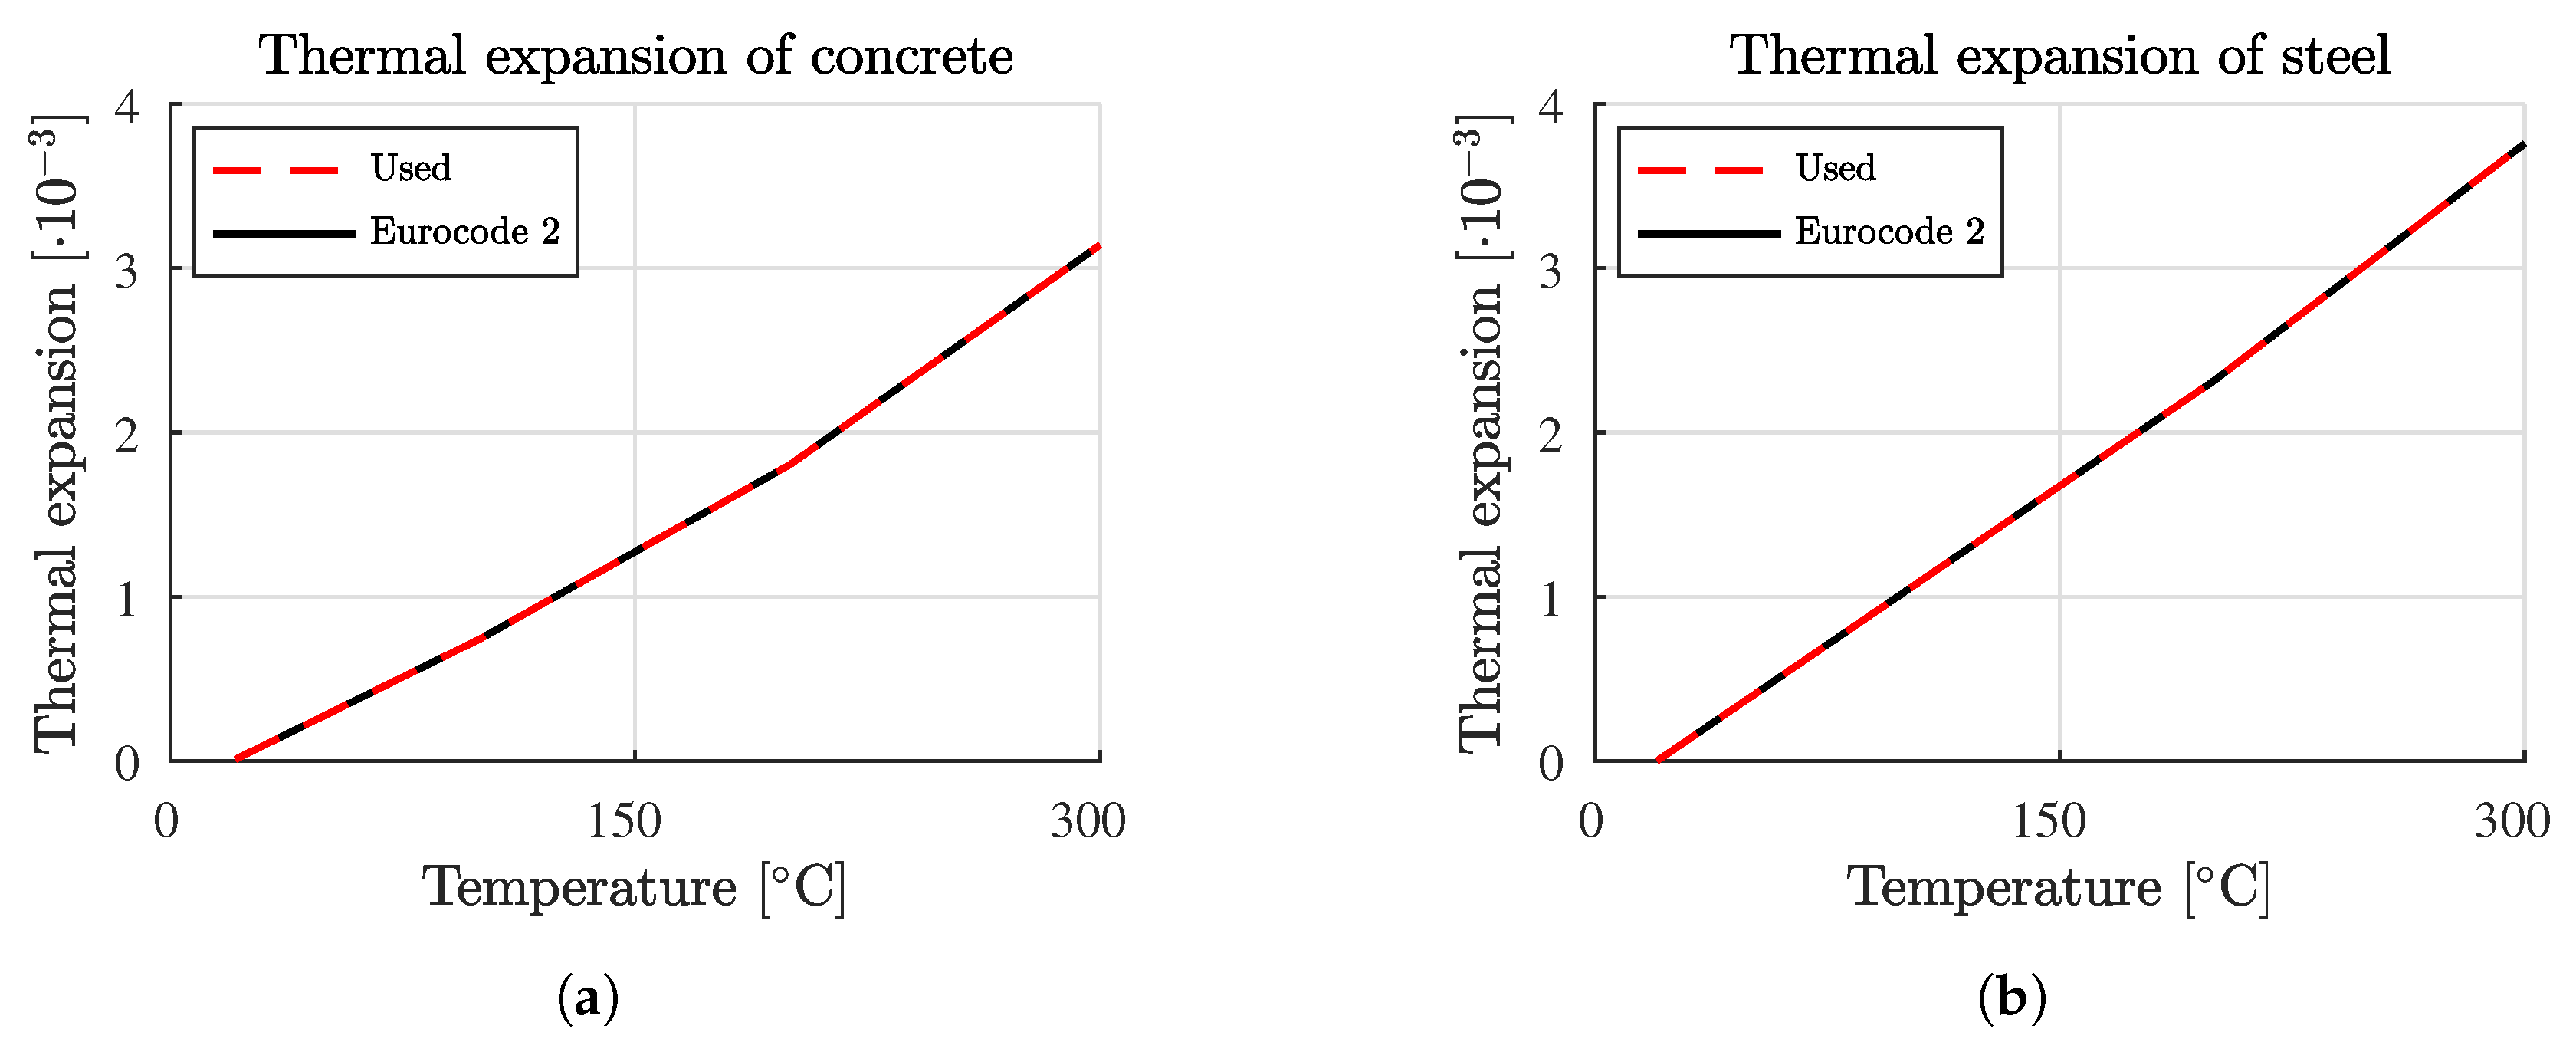
Figure 16.
Coefficients of thermal expansion as a function of the temperature, according to Eurocode 2 [
43], for: (
a) concrete and (
b) steel.
Figure 16.
Coefficients of thermal expansion as a function of the temperature, according to Eurocode 2 [
43], for: (
a) concrete and (
b) steel.
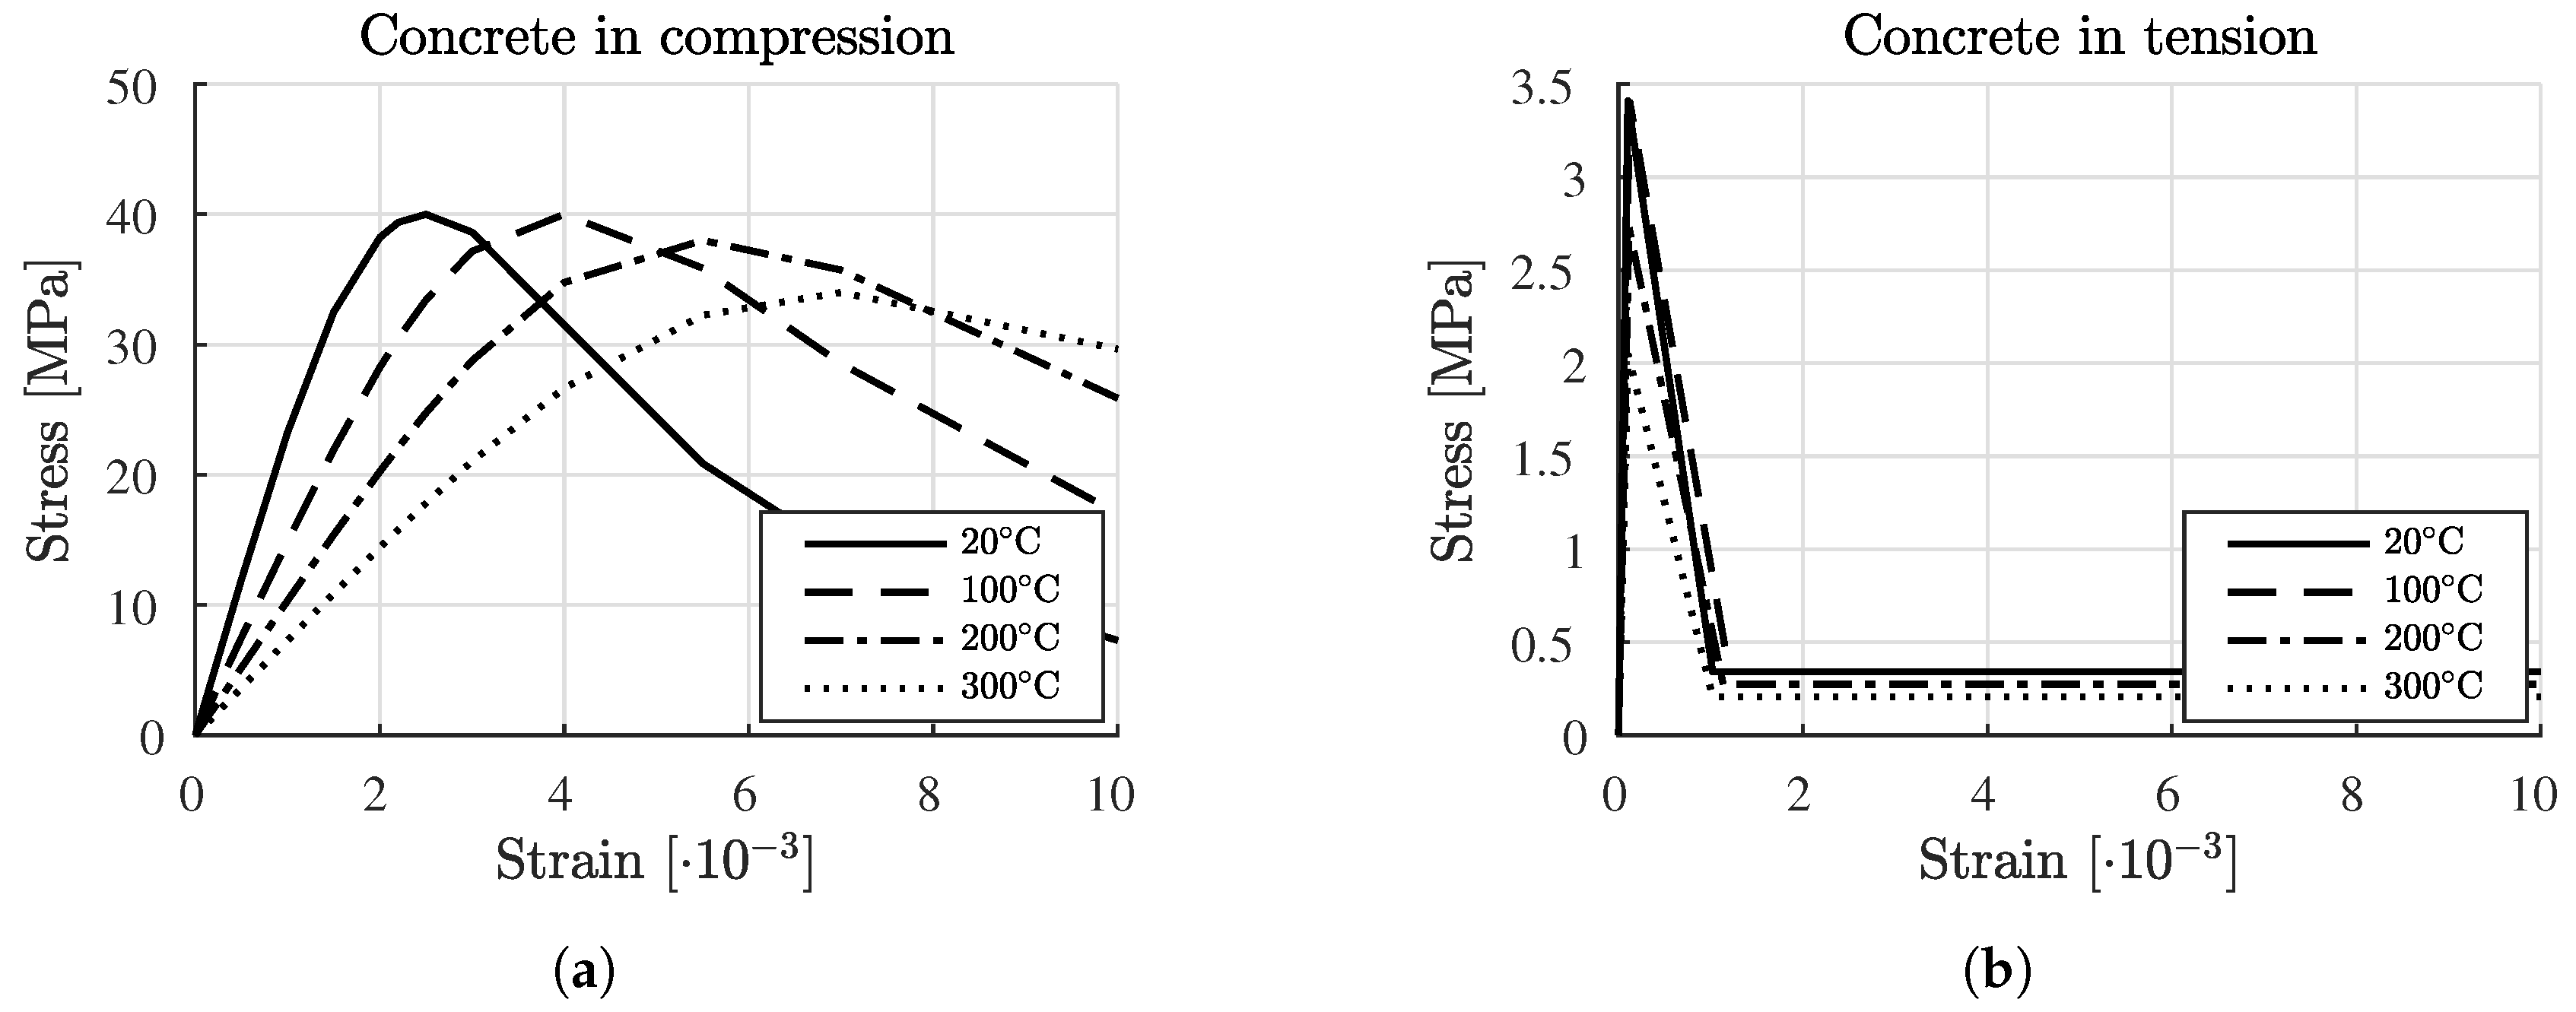
Figure 17.
Temperature-dependent stress-strain relations recommended by Eurocode 2 for concrete subjected to uniaxial (a) compression and (b) tension.
Figure 17.
Temperature-dependent stress-strain relations recommended by Eurocode 2 for concrete subjected to uniaxial (a) compression and (b) tension.
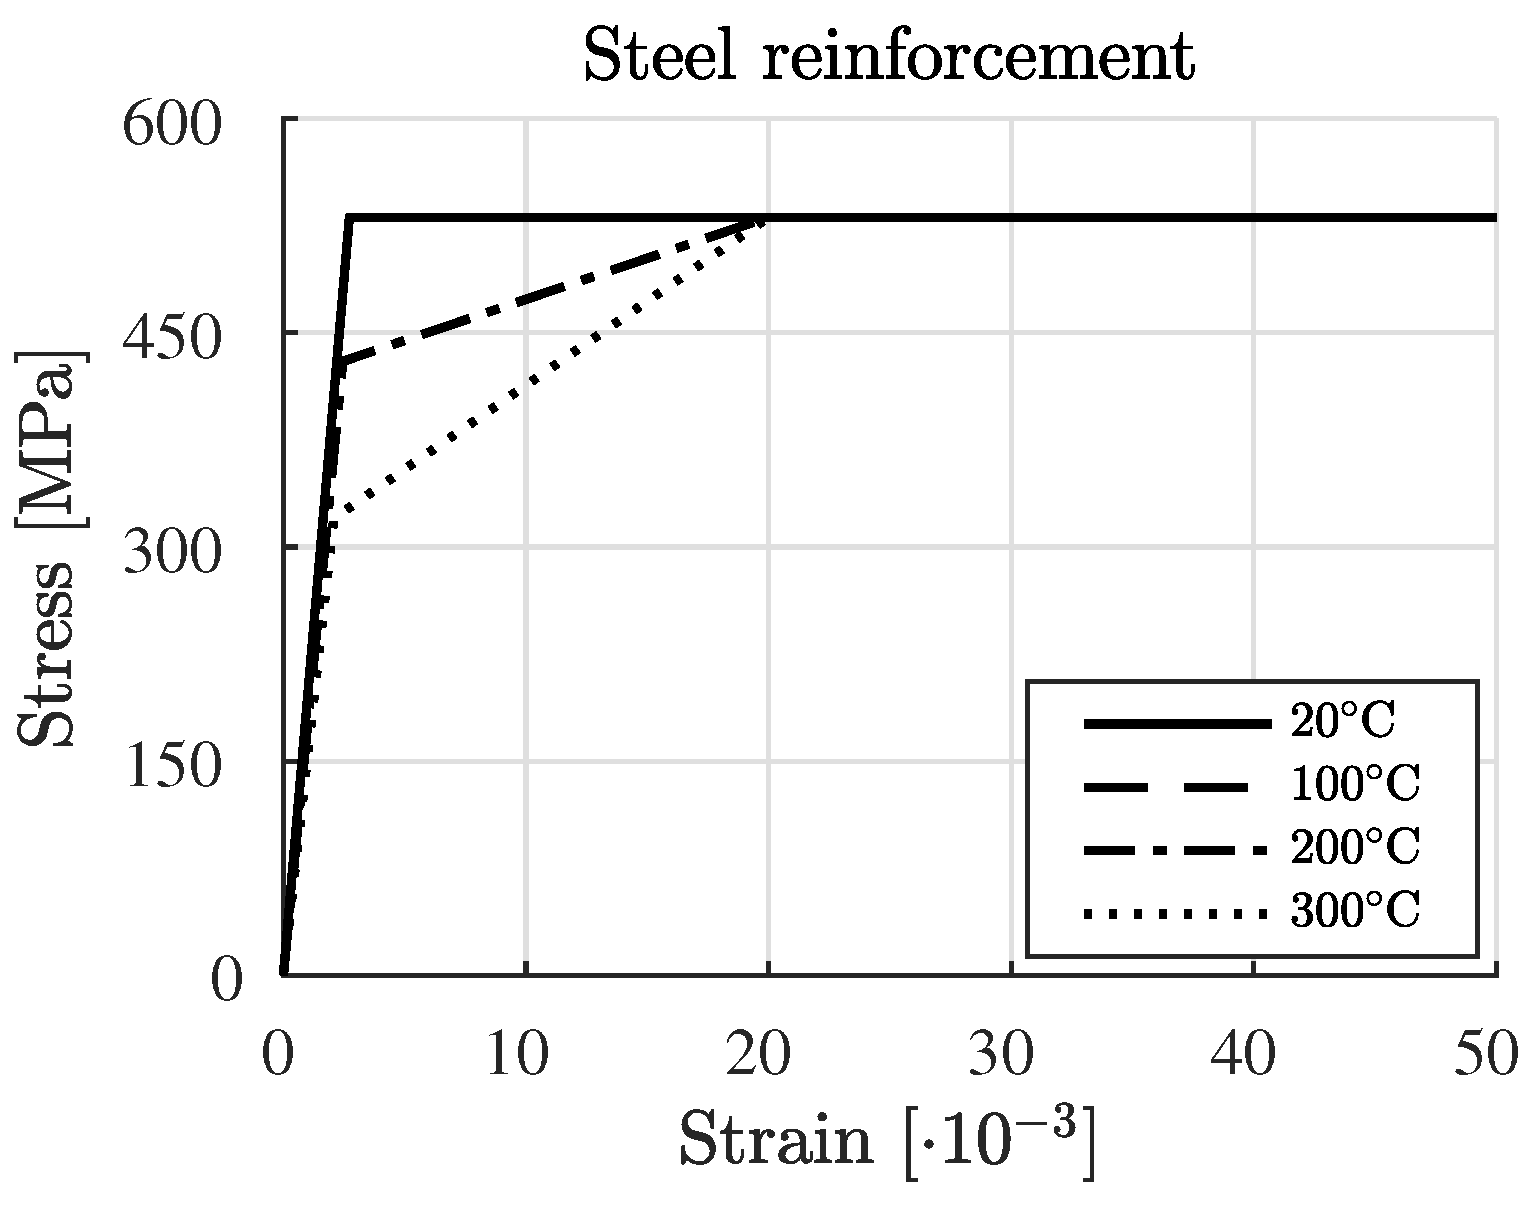
Figure 18.
Temperature-dependent behavior of steel rebar subjected to uniaxial tension, as recommended by Eurocode 2.
Figure 18.
Temperature-dependent behavior of steel rebar subjected to uniaxial tension, as recommended by Eurocode 2.
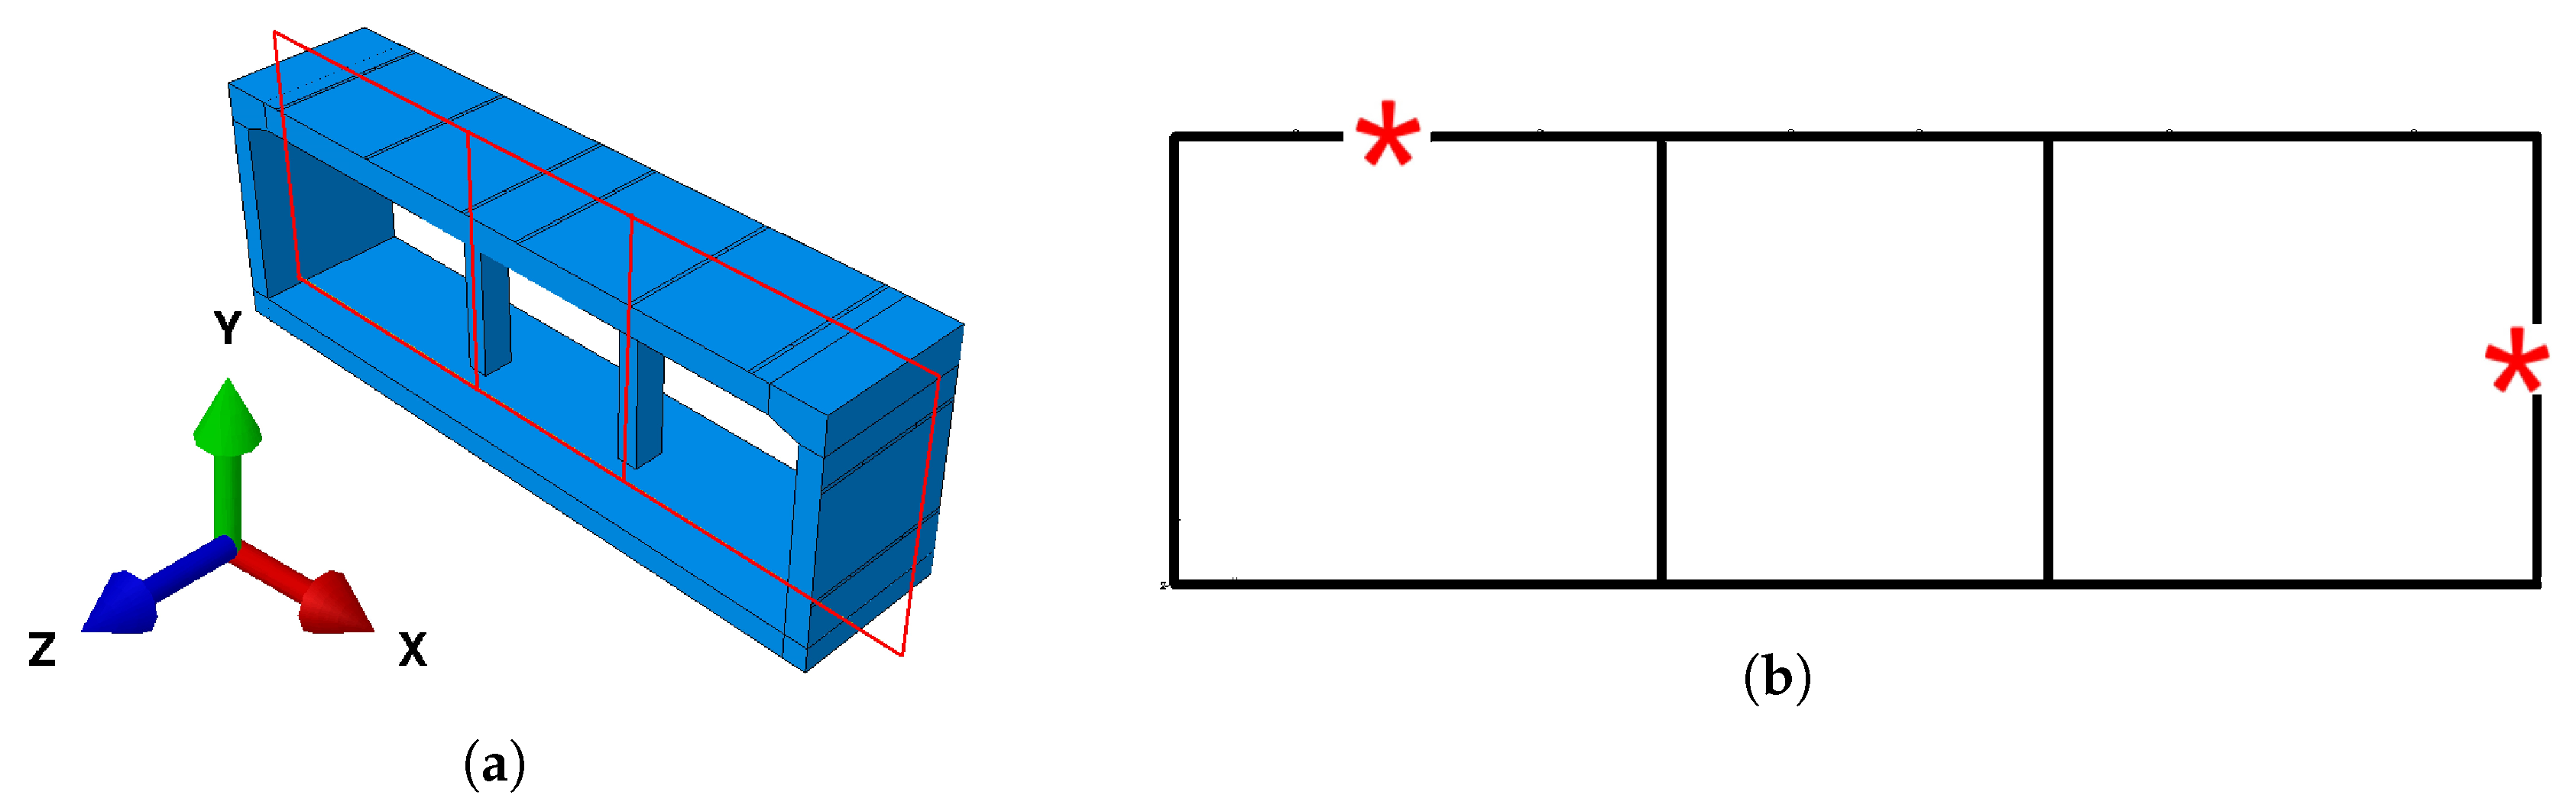
Figure 19.
Positions at which measurements of strains were carried out during testing: (a) perspective representation and (b) cross-section, coinciding with the plane of symmetry of the structure that contains the columns.
Figure 19.
Positions at which measurements of strains were carried out during testing: (a) perspective representation and (b) cross-section, coinciding with the plane of symmetry of the structure that contains the columns.
Figure 20.
Measured and simulated strains of steel rebar: (a) outer and (b) inner reinforcement at the midspan of the left cell of the top slab, and (c) outer reinforcement at the center of the right wall: strain increments, resulting from application of the thermal loading, considering linear-elastic (LE) or elasto-plastic (EP) material behavior of concrete and a prescription of one uniform surface temperature history (U) or of three different piecewise uniform surface temperature histories (P).
Figure 21.
Plastic strains, developed on the outer surface of the top slab at its connection to the lateral wall right before the onset of cracking, as obtained from a thermomechanical simulation based on temperature-dependent and elasto-plastic material behavior, as well as on the prescription of one uniform surface temperature history; the results refer to the time instant six minutes and 3.4 s after the beginning of the fire test.
Figure 22.
Plastic strains, developed on the outer surface of the top slab at its connection to the lateral wall right after the onset of cracking, as obtained from a thermomechanical simulation based on temperature-dependent and elasto-plastic material behavior, as well as on the prescription of one uniform surface temperature history; the results refer to the time instant 6 min and 3.6 s after the beginning of the fire test.
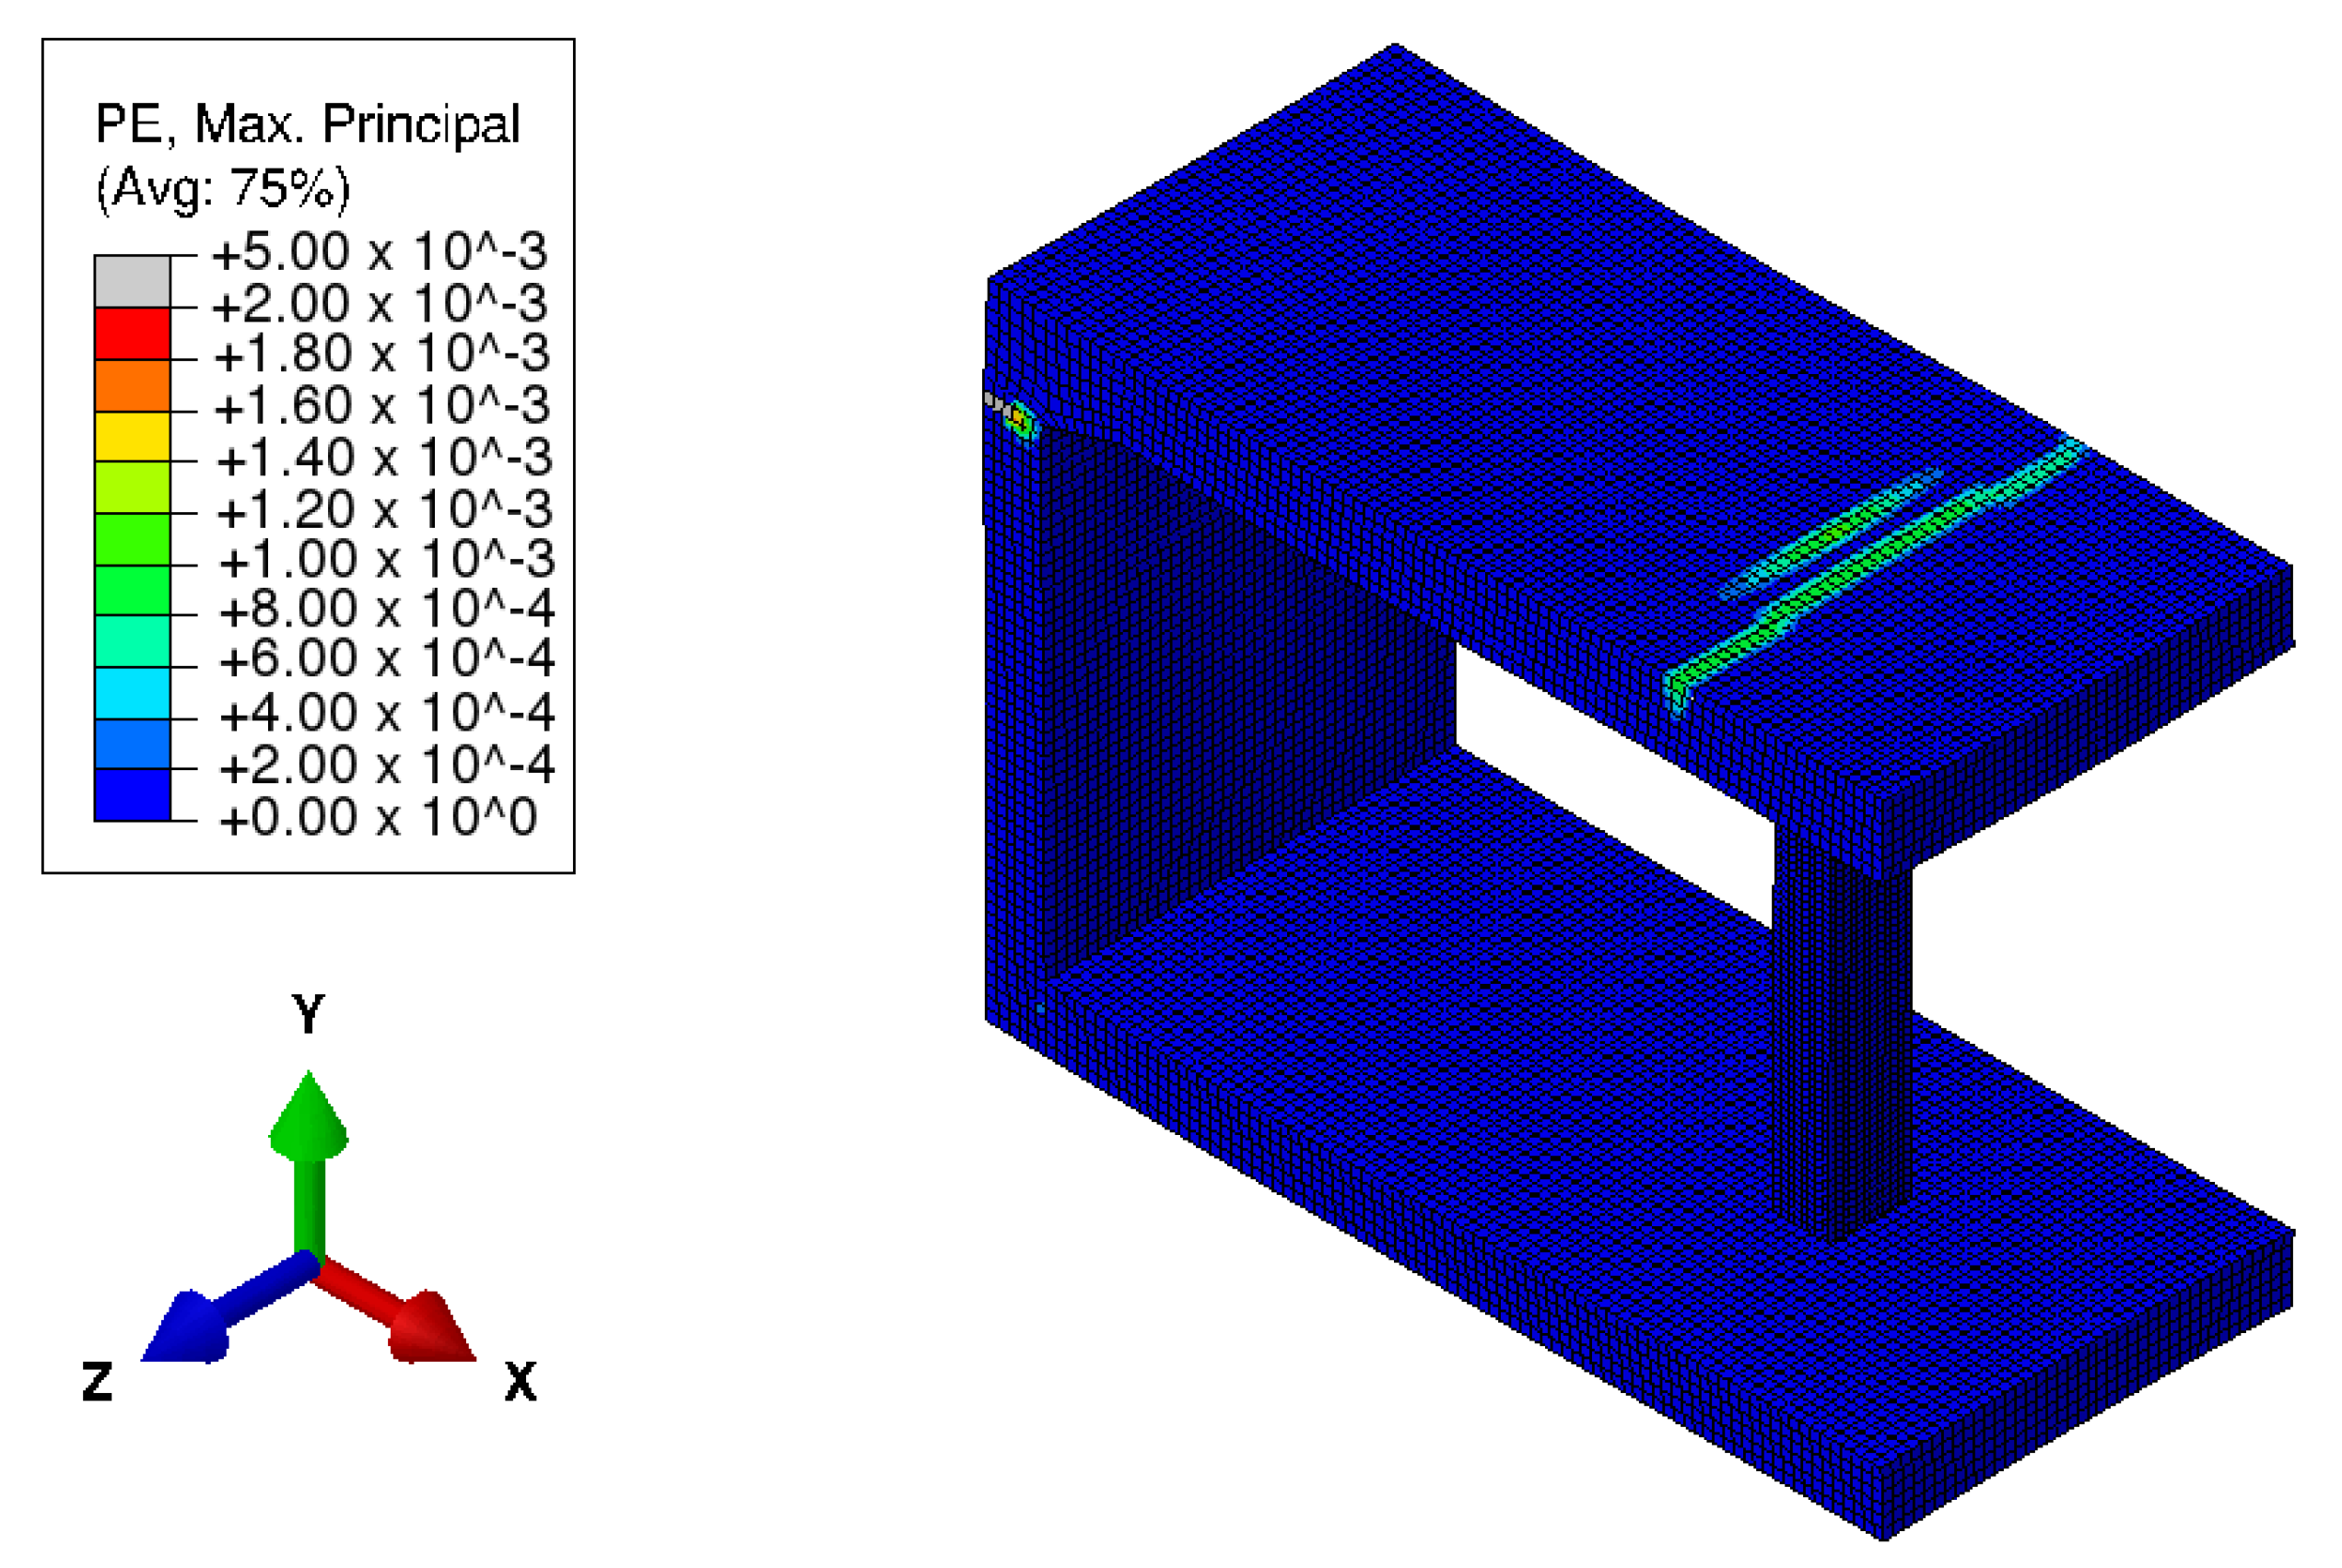
Figure 23.
Plastic strains, developed on the outer surface of the top slab at its connection to the column right before the onset of cracking, as obtained from a thermomechanical simulation based on temperature-dependent and elasto-plastic material behavior, as well as on the prescription of one uniform surface temperature history; the results refer to the time instant 13 min and 50.5 s after the beginning of the fire test.
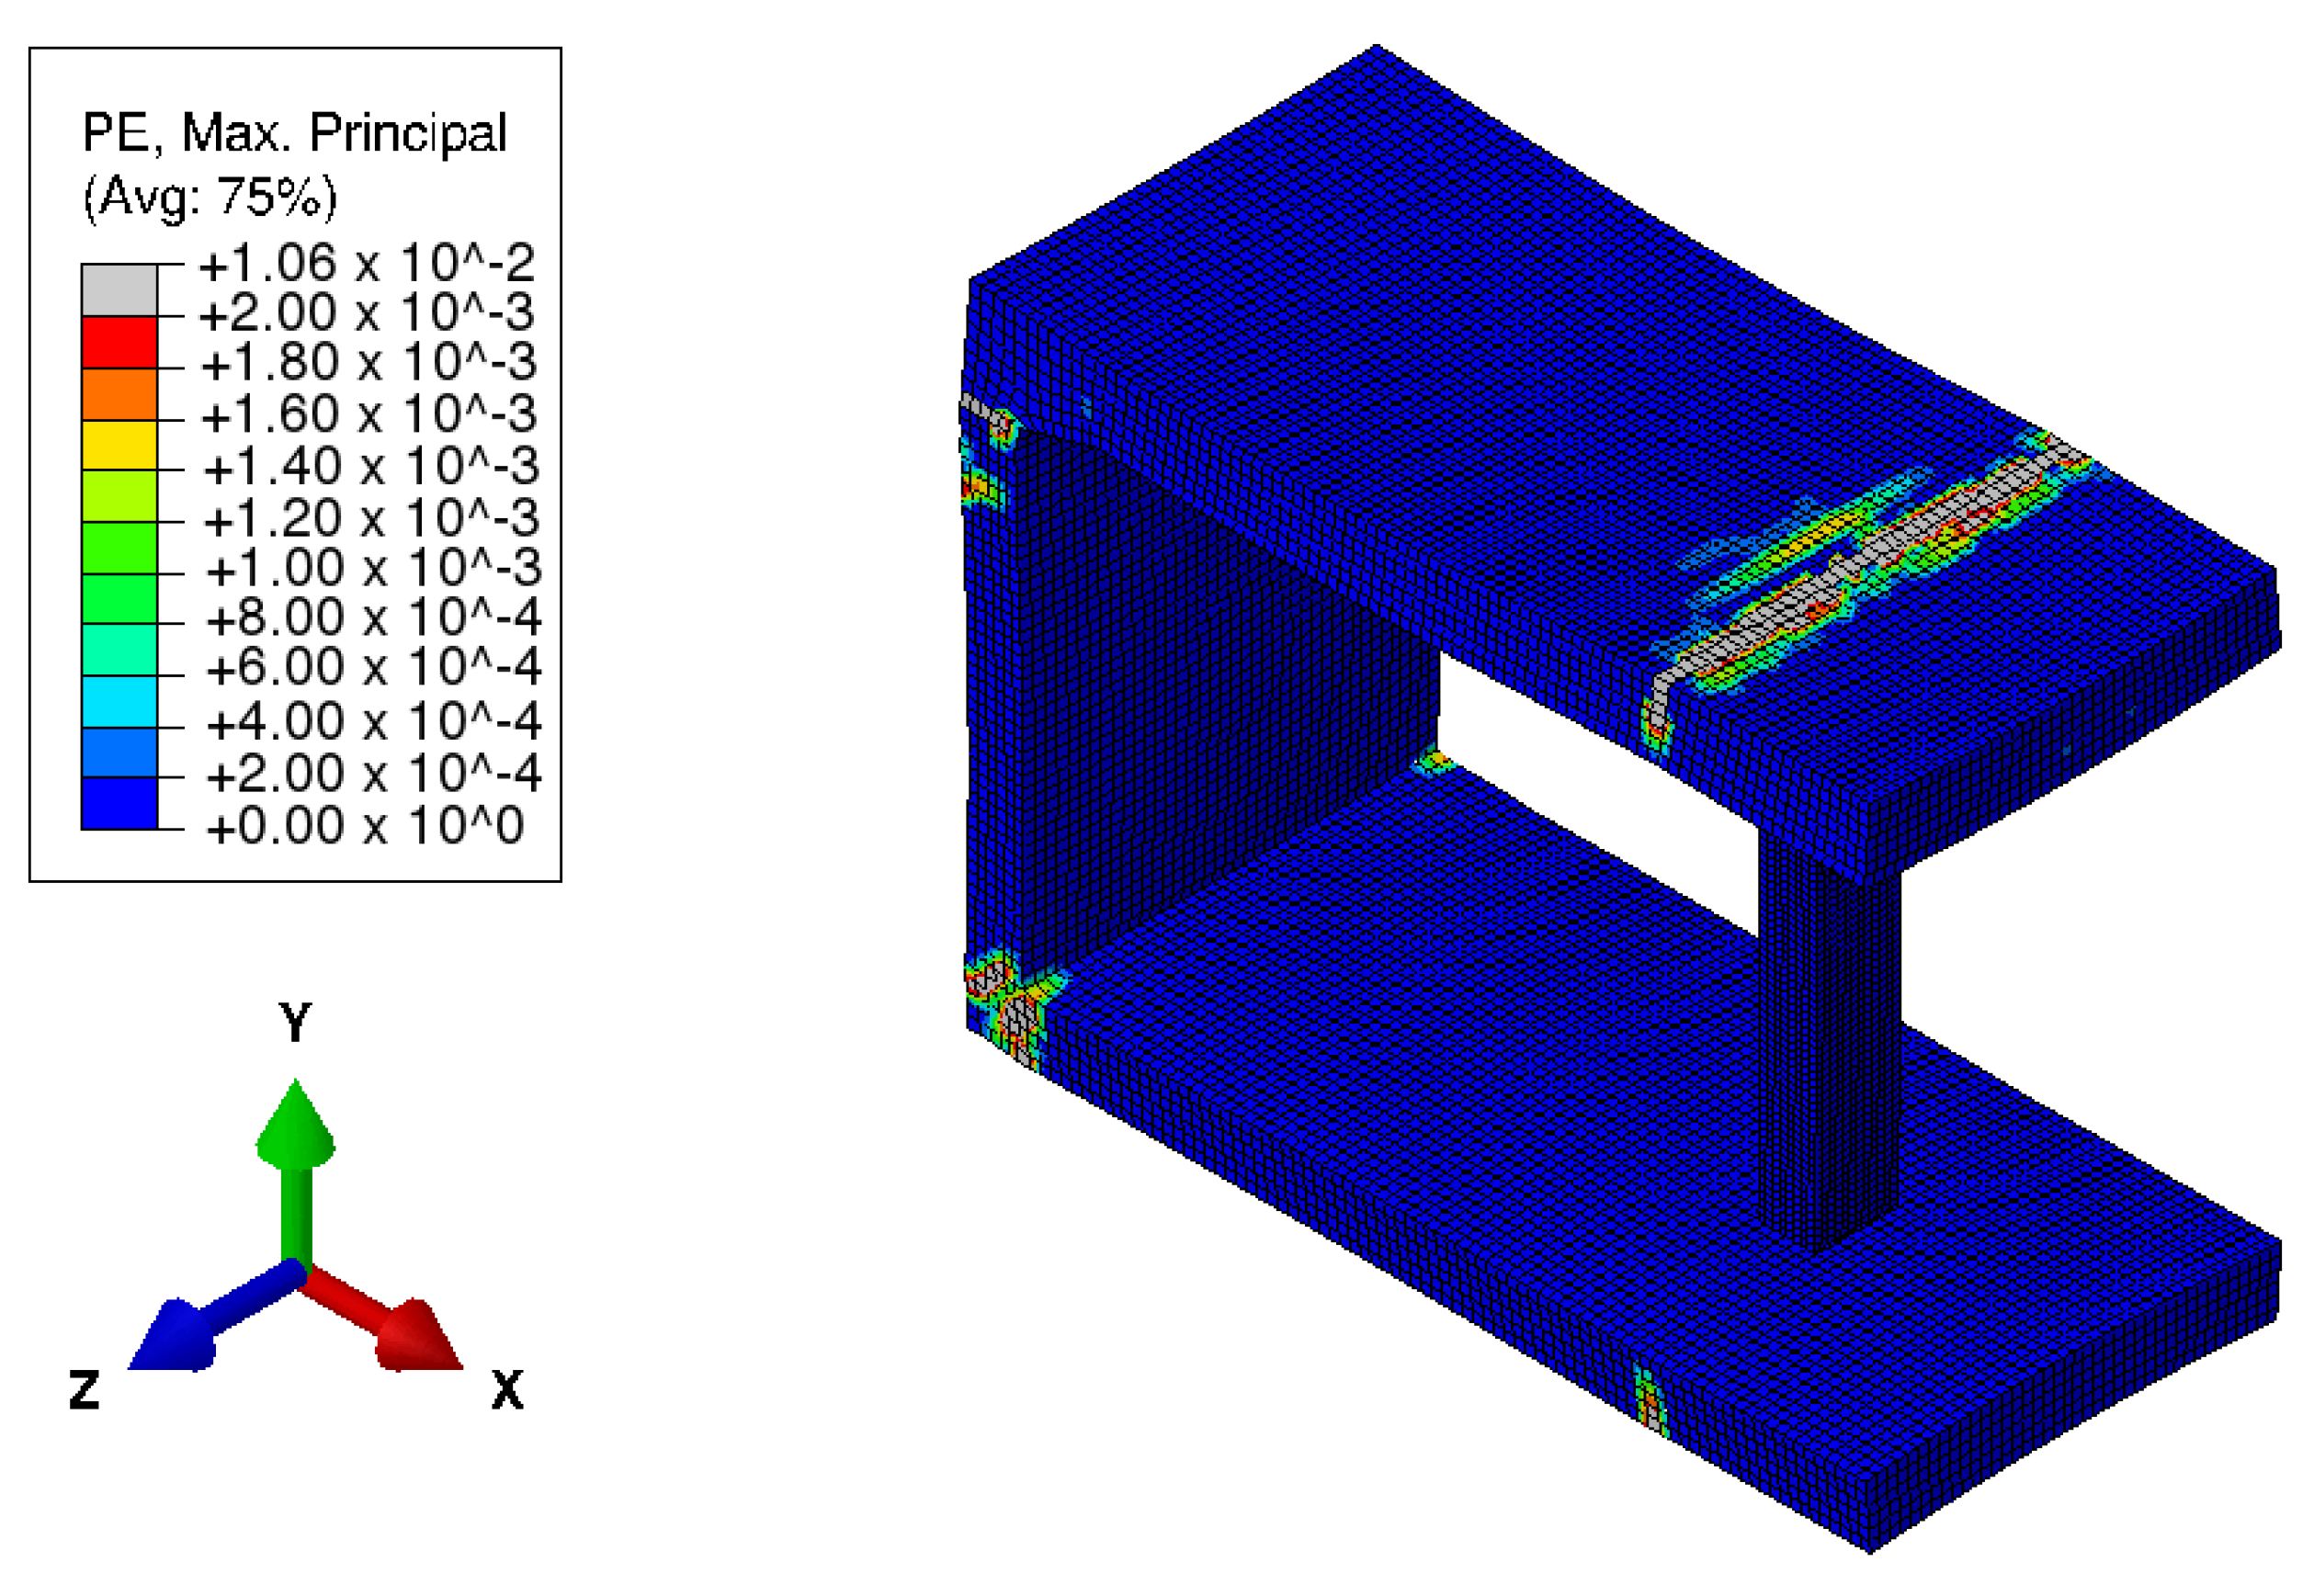
Figure 24.
Plastic strains, developed on the outer surface of the top slab at its connection to the column right after the onset of cracking, as obtained from a thermomechanical simulation based on temperature-dependent and elasto-plastic material behavior, as well as on the prescription of one uniform surface temperature history; the results refer to the time instant 13 min and 50.7 s after the beginning of the fire test.
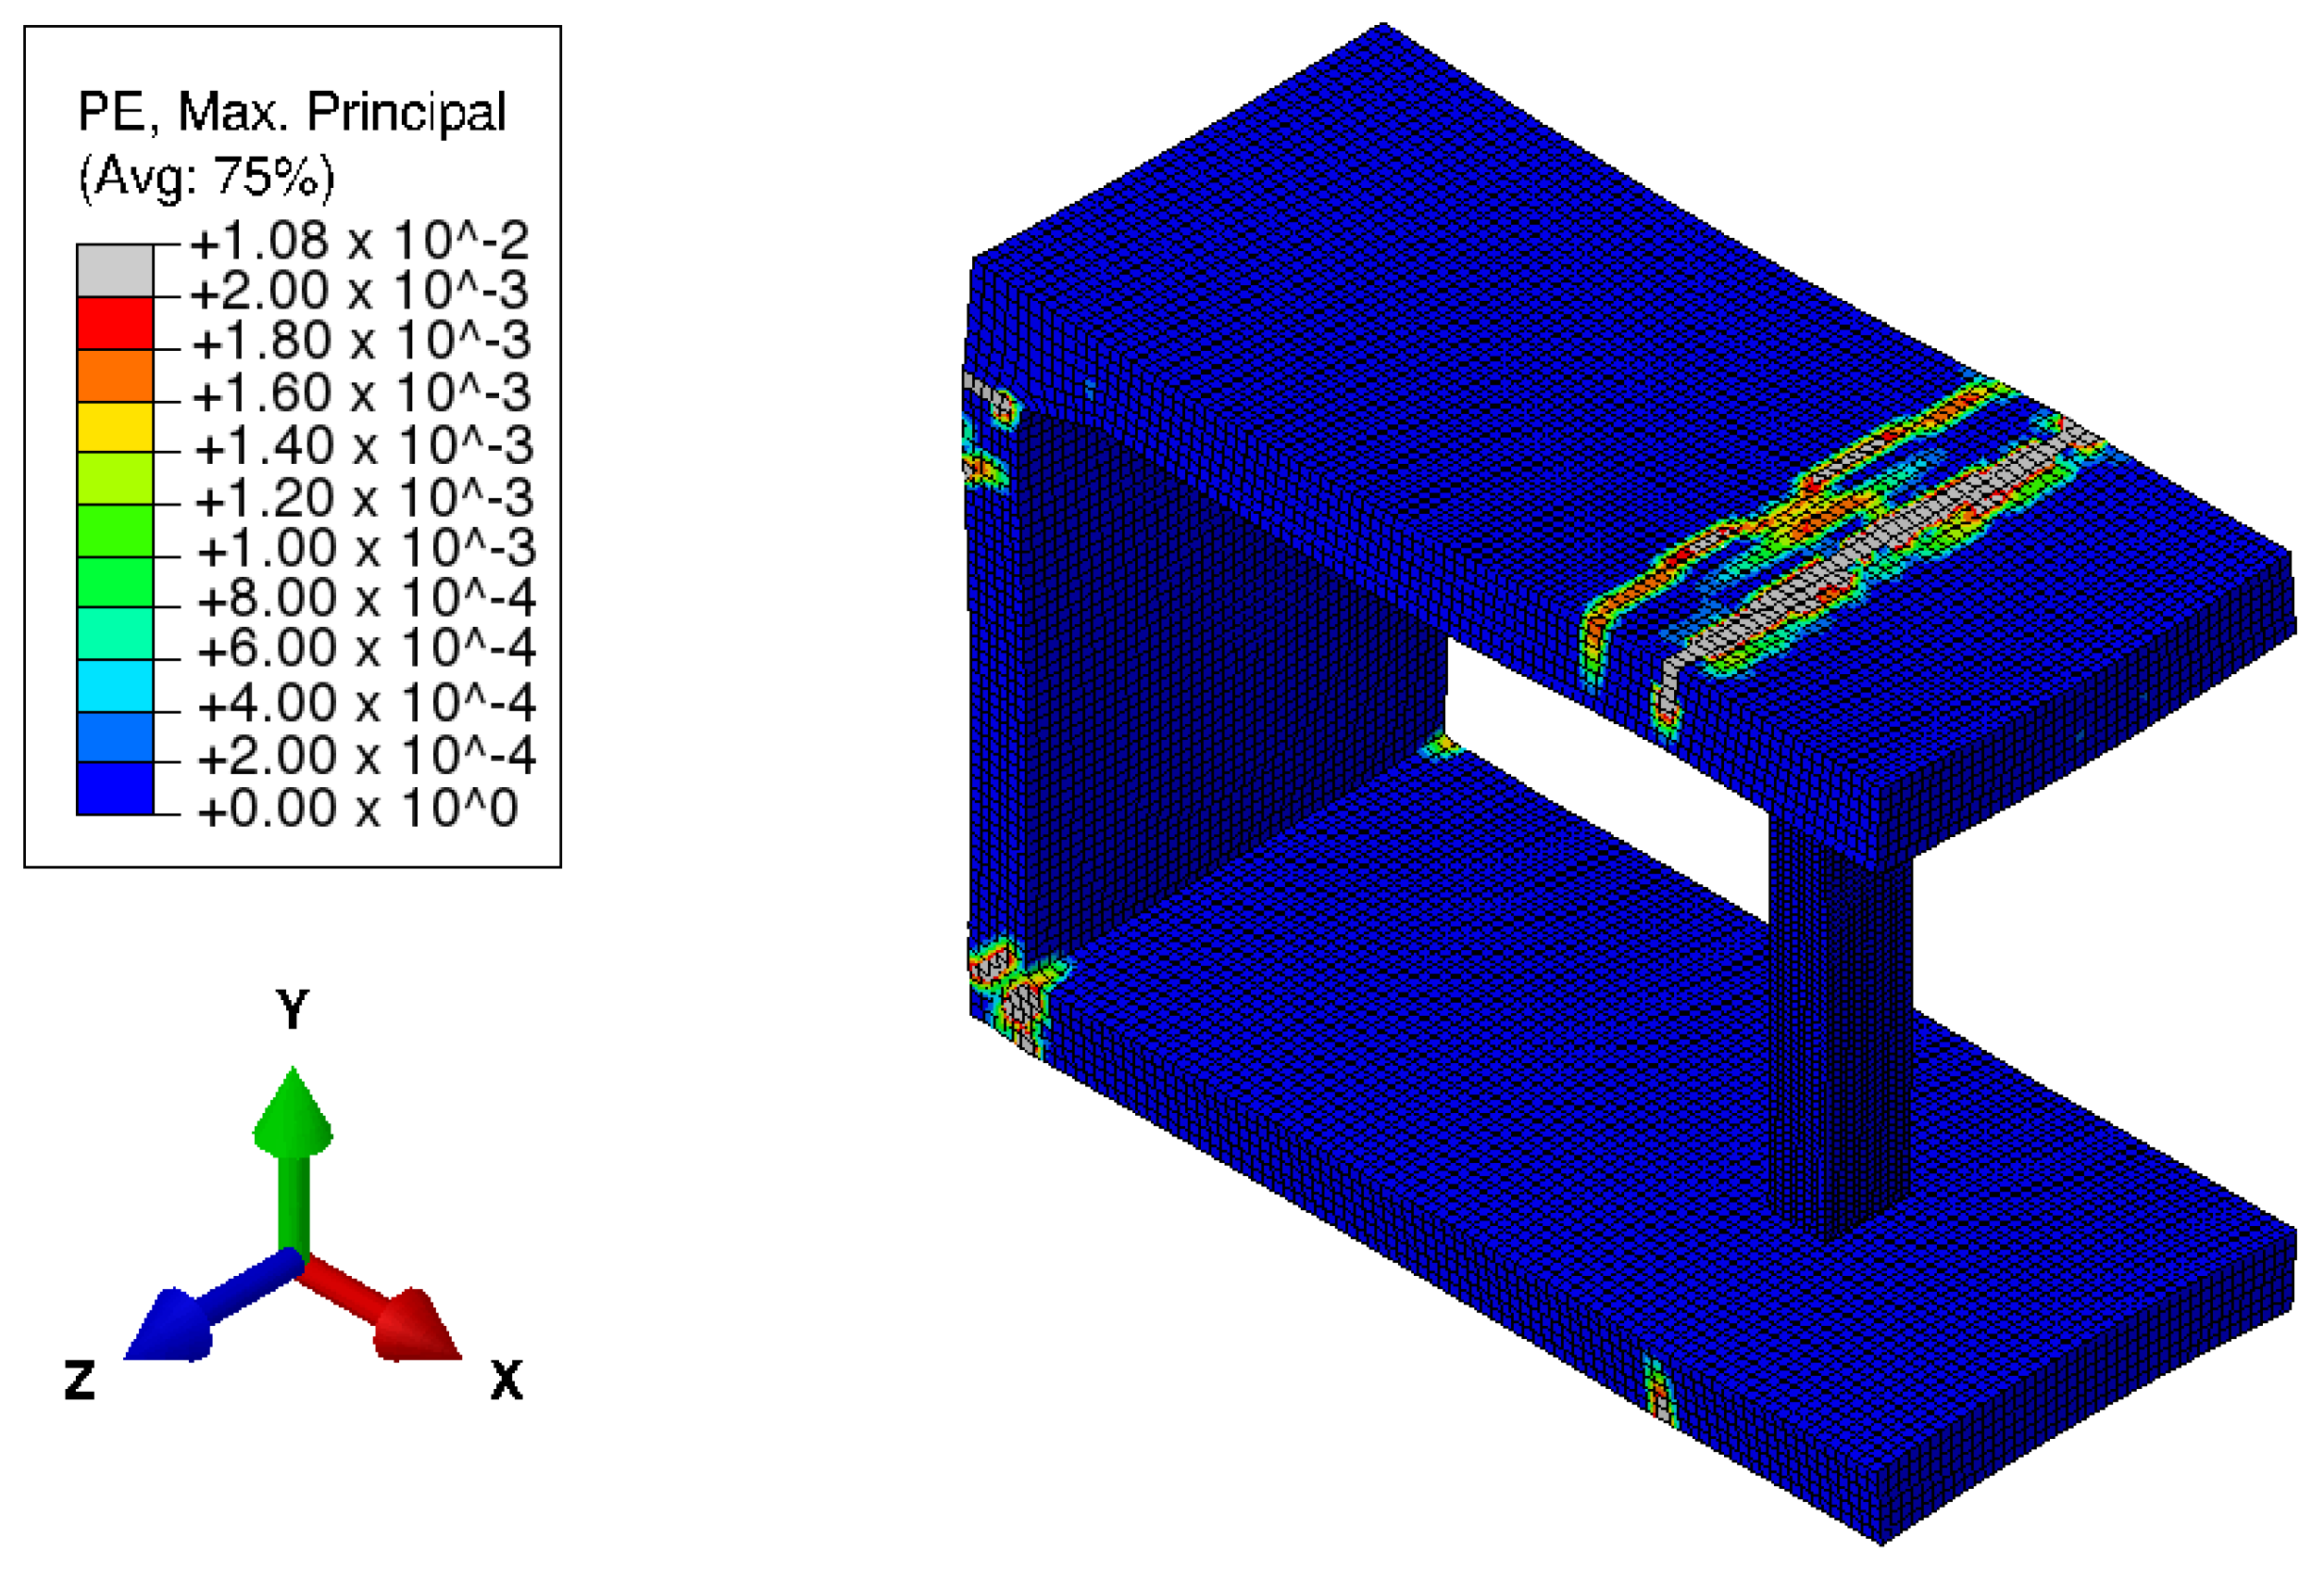
Figure 25.
Plastic strains, developed on the outer surface of the top slab at its connection to the column right before the onset of cracking, as obtained from a thermomechanical simulation based on the temperature-dependent and elasto-plastic material behavior, as well as on the prescription of one uniform surface temperature history; the results refer to the time instant 25 min and 1.0 s after the beginning of the fire test.
Figure 26.
Plastic strains, developed on the outer surface of the top slab at its connection to the column right after the onset of cracking, as obtained from a thermomechanical simulation based on temperature-dependent and elasto-plastic material behavior, as well as on the prescription of one uniform surface temperature history; the results refer to the time instant 25 min and 1.2 s after the beginning of the fire test.
Table 1.
Composition of the concrete used for the tested structure.
Table 1.
Composition of the concrete used for the tested structure.
| Raw Material | Content (kg/m) |
|---|
| Cement (42.5 PO) | 249 |
| Tap water | 176 |
| Sand 1 (middle size) | 306 |
| Sand 2 (middle size) | 458 |
| Gravel (5–25 mm) | 1013 |
| Fly ash (Level II) | 70 |
| Admixture (ZK 904-3) | 6 |
| Blast furnace slag S95 | 95 |
Table 2.
Stiffness and strength properties of concrete (age = 28 days) and steel at room temperature.
Table 2.
Stiffness and strength properties of concrete (age = 28 days) and steel at room temperature.
| Material | Compressive Strength (MPa) | Yield Stress (MPa) |
|---|
| Concrete | 36.5 | – |
| Steel (diameter = 12 mm) | – | 531.9 |
| Steel (diameter = 14 mm) | – | 530.2 |
Table 3.
Applied mechanical loads.
Table 3.
Applied mechanical loads.
| | P1 | P2 | P3 |
|---|
| Load () | 192.0 | 151.2 | 120.0 |
Table 4.
Thermal properties of concrete at room temperature.
Table 4.
Thermal properties of concrete at room temperature.
| Property | Value |
|---|
| Specific heat capacity | 900 |
| Thermal conductivity | 1.6 |
Table 5.
Mechanical properties of concrete and steel at room temperature.
Table 5.
Mechanical properties of concrete and steel at room temperature.
| Property | Concrete | Steel |
|---|
| Young’s modulus | 33.4 | 195 |
| Poisson’s ratio (-) | 0.2 | 0.3 |
| Thermal expansion coefficient | | |
Table 6.
Temperature-dependent thermoelastic properties of concrete.
Table 6.
Temperature-dependent thermoelastic properties of concrete.
| Temperature | Young’s Modulus | Compressive Strength | Coefficient of Thermal |
|---|
| T | | | Expansion |
|---|
| 20 | 1.00 | 1.00 | |
| 100 | 0.85 | 1.00 | |
| 200 | 0.72 | 0.95 | |
| 300 | 0.60 | 0.85 | |
Table 7.
Temperature-dependent thermoelastic properties of steel.
Table 7.
Temperature-dependent thermoelastic properties of steel.
| Temperature | Young’s Modulus | Yield Stress | Coefficient of Thermal |
|---|
| T | | | Expansion |
|---|
| 20 | 1.00 | 1.00 | |
| 100 | 1.00 | 1.00 | |
| 200 | 0.90 | 1.00 | |
| 300 | 0.80 | 1.00 | |
Table 8.
Measured and simulated strains of steel rebar, positioned at the inner and the outer reinforcement at midspan of the left cell of the top slab and at the outer reinforcement at the center of the right wall: additional strains, resulting from application of the mechanical loading, considering linear-elastic (LE) or elasto-plastic (EP) material behavior of concrete.
| Analysis Type | RW Outer Layer () | TS Outer Layer () | TS Inner Layer () |
|---|
| Measured | | | |
| LE | | | |
| EP | | | |


