Review

Correlation Plenoptic Imaging: An Overview

by
Francesco Di Lena
1,2,
Francesco V. Pepe
2,*,
Augusto Garuccio
1,2,3 and
Milena D’Angelo
1,2,3,*
1
Dipartimento Interateneo di Fisica, Università degli Studi di Bari, I-70126 Bari, Italy
2
INFN, Sezione di Bari, I-70126 Bari, Italy
3
Istituto Nazionale di Ottica (INO-CNR), I-50125 Firenze, Italy
*
Authors to whom correspondence should be addressed.
Appl. Sci. 2018, 8(10), 1958; https://doi.org/10.3390/app8101958
Submission received: 4 September 2018 / Revised: 10 October 2018 / Accepted: 14 October 2018 / Published: 17 October 2018
(This article belongs to the Special Issue Ghost Imaging)

Abstract

:
Plenoptic imaging (PI) enables refocusing, depth-of-field (DOF) extension and 3D visualization, thanks to its ability to reconstruct the path of light rays from the lens to the image. However, in state-of-the-art plenoptic devices, these advantages come at the expenses of the image resolution, which is always well above the diffraction limit defined by the lens numerical aperture (NA). To overcome this limitation, we have proposed exploiting the spatio-temporal correlations of light, and to modify the ghost imaging scheme by endowing it with plenoptic properties. This approach, named Correlation Plenoptic Imaging (CPI), enables pushing both resolution and DOF to the fundamental limit imposed by wave-optics. In this paper, we review the methods to perform CPI both with chaotic light and with entangled photon pairs. Both simulations and a proof-of-principle experimental demonstration of CPI will be presented.

1. Introduction

Plenoptic imaging is a recently established optical imaging technique, characterized by the possibility to simultaneously detect both the spatial distribution and the propagation direction of light in a given scene [1,2,3]. The ability to reconstruct light paths can be used, in post-processing, to refocus out-of-focus objects, change the point of view on the scene and extend the DOF. PI is also one of the simplest and fastest methods to obtain three-dimensional images with the current technology [4,5,6,7,8,9,10]; in particular, it is among the imaging methods able to achieve 3D imaging in a single shot [11,12,13,14,15]. PI does not require either multiple sensors for multiperspective acquisition, or scanning or interferometric methods; single-shot 3D imaging is instead accomplished by a simple modification of ordinary imaging devices (such as cameras and microscopes) that does not involve using multiple excitation beams [13], multifocus gratings combined with aberration corrections [14] or spatial light modulators [15]. The key component of state-of-the-art plenoptic cameras is a microlens array placed in front of the sensor to ensure that a twofold information is encoded in the intensity detected by each pixel: the distribution of light in the object plane, and the direction of light between the object and the imaging device [16,17,18,19,20]. In the first implemented configuration, the microlenses were inserted in the native image plane, and were employed to reproduce repeated images of the main camera lens on the sensor behind them [3,21]. Light rays could thus be traced by joining each image “point” (i.e., each microlens) with each pixel associated with the image of the camera lens. To this end, the camera lens is divided in N u portions per side; hence, each portion of the camera lens has linear size D / N u , with D the lens diameter, and reproduces a ”sub-image” of the scene. Sub-images are clearly endowed with a larger DOF than the ordinary image reproduced by the whole camera lens; this explains the physical origin of the improved DOF of plenoptic imaging. In addition, the sub-image formed by each portion of the camera lens offers a different perspective on the scene of interest, as required for 3D imaging. The drawback of these intriguing peculiarities of standard PI is the loss of spatial resolution, which is now defined by the transverse size of the microlenses: resolution worsens by the same factor N u that fixes directional resolution. Hence, the potentials of plenoptic imaging are strongly limited by the insertion of the microlens array and the use of a single sensor for retrieving both spatial and directional information.
Despite its limitation, PI is currently employed in the most diverse applications, including 3D imaging and sensing [5,22], stereoscopy [2,23,24], particle image velocimetry [25], particle tracking and sizing [26], wavefront sensing [6,27,28,29], microscopy [4,6,11,30] and digital cameras with refocusing capabilities [31]. Plenoptic imaging has also been employed in surgical robotics [32], endoscopic applications [33], and blood-flow visualization [34].
In a more recent scheme, called Plenoptic 2.0, the microlenses create redundant images of portions of the scene of interest, in order to somewhat smoothen the compromise between loss of resolution and increased DOF [16,17,18,19]. Attempts to weaken the resolution vs. DOF trade-off have been made by using signal processing and deconvolution [4,6,35,36,37], and other algorithms and analysis tools have been developed [8,38].
In this perspective, we have recently proposed a fundamentally different approach to PI, named correlation plenoptic imaging (CPI), which exploits the spatio-temporal correlation properties of light beams to physically decouple the image formation from the retrieval of the directional information [39]. We perform “spatial” and “directional” measurements on two separate sensors: one gives the image of the scene of interest, while the other one gives the image of the focusing element responsible for image formation (e.g., the camera lens of standard PI). The correlation measurement combines such structured information to provide the same kind of information acquired by a conventional plenoptic camera, but without losing image resolution. In fact, the retrieval of the directional information is exactly the same as in standard PI, namely, it is obtained by joining “points” of the image of interest with “points” of the image of the focusing element.
We have theoretically shown that CPI can be achieved by exploiting the correlation properties of both chaotic light [39,40] and entangled photons from spontaneous parametric down-conversion (SPDC) [41]. We have also performed the first experimental proof of CPI with chaotic light [42], and we are currently generalizing the experimental demonstration to entangled photons. The results suggest that CPI can improve the power of plenoptic imaging, opening the way to promising applications, especially in fields like microscopy and 3D imaging where fast acquisition must be combined with high resolution. In addition, entangled photons from SPDC provide the possibility to perform CPI by correlating photons of different wavelengths in the two arms of the setup: light illuminating the object in one arm is not required to have the same wavelength as light remotely detected in the other arm [43,44,45]. This feature is interesting both in view of applications requiring specific illumination wavelengths for the object and to optimize the detection efficiency. Entanglement has the further advantage of enabling high signal-to-noise ratio (SNR) images at low photon fluxes [46,47,48], which is particularly interesting when radiation damage of the sample is an issue (e.g., in biomedical microscopy).
Unlike previous fundamental demonstrations [49,50,51], CPI exploits the simultaneous momentum and position correlation of light to address intrinsic limitations affecting practical imaging system, such as the resolution versus DOF compromise. Compared to other 3D imaging techniques based on the simultaneous detection of both the spatial distribution and the propagation direction of light, CPI does not require either delicate interferometric techniques, as in digital holographic microscopy [52], or phase retrieval algorithms, as in Fourier ptychography [53]. Furthermore, similar to standard PI, CPI does not require fast pulsed light, as Time-Of-Flight (TOF) imaging [26,54,55,56,57,58,59], and, compared to confocal microscopy [60], offers the advantage of being a scanning-free imaging modality.
In this paper, we review the main aspects of CPI, and present different schemes we have so far developed. We start, in Section 2, with the first proposed CPI setup, where an adequate modification of lensless ghost imaging is employed to retrieve the plenoptic ghost image of the object. In Section 3, we report the first experimental realization of this CPI scheme. In Section 4, we present an alternative CPI scheme, where the image of the object is directly focused on one sensor, while ghost imaging (i.e., correlation measurements) is employed to image the focusing element in order to gain the required directional information; the practical advantages of this scheme will also be discussed. In Section 5, we present CPI based on entangled photon pairs generated by SPDC.

2. Correlation Plenoptic Imaging with Chaotic Light—First Scheme

The general working principle of correlation plenoptic imaging can be understood by considering the first setup we have developed and experimentally demonstrated.
As reported in Figure 1, light emitted by a chaotic (in our case, pseudothermal) source is divided in two arms by a beam splitter (BS): the reflected beam propagates in arm a for a distance z a from the source before being detected by the sensor array D a ; the transmitted beam travels in arm b, where light impinges on a transmissive object at a distance z b from the source, and is then collected by a lens L b (characterized by the focal length F) for reproducing on the sensor array D b the image of the source. The fluctuations of the intensity detected by each pixel of the two sensor arrays are monitored in time to reconstruct their spatio-temporal correlations. By correlating the total intensity on sensor D b with the one retrieved by each pixel of sensor D a , we obtain the “ghost image” (GI) of the object, which is perfectly focused when z a = z b [61,62,63,64,65]; here, the chaotic source is playing the role of a focusing element, as shown by the unfolded representation (“Klyshko-like picture”) of Figure 2a [61,62]. The high-resolution detector array D b is not required to perform ghost imaging, where a bucket detector with no spatial resolution behind the object is sufficient. However, in the present scheme, the detector array D b is crucial: by reproducing the image of the light source, it enables joining points of the object with points of the source plane, thus giving information on the direction of light, as required to perform plenoptic imaging. Both spatial and angular information are encoded in the correlation of intensity fluctuations; hence, correlation measurements provide the necessary information for performing the typical tasks of plenoptic imaging, such as refocusing out-of-focus details of the 3D object of interest (i.e., details placed outside the DOF of the standard image, at z a z b ).

2.1. Correlation Functions in CPI

The correlation between the fluctuations Δ I a and Δ I b of the intensities I a and I b , evaluated at the transverse coordinates ρ a and ρ b defined on the planes of detectors D a and D b , respectively, reads
Γ ( ρ a , ρ b ) = Δ I a ( ρ a ) Δ I b ( ρ b ) = I a ( ρ a ) I b ( ρ b ) I a ( ρ a ) I b ( ρ b ) ;
the symbol denotes the expectation value on the state of the source, and can be determined by taking into account the source statistics. For the setup represented in Figure 1, the computation in the case of a chaotic and quasi-monochromatic source with central frequency ω 0 , yields (see Appendix A for details)
Γ ( z a , z b ) ( ρ a , ρ b ) = d ρ o d ρ s A ( ρ 0 ) S ( ρ s ) e i ω 0 c φ ( ρ o , ρ s ; ρ a , ρ b ) 2 ,
with
φ ( ρ o , ρ s ; ρ a , ρ b ) = ρ s 2 2 1 z b 1 z a ρ o z b · ρ s + ρ b M + ρ s · ρ a z a ,
where ρ o is the transverse coordinate on the plane of the sample, ρ s is the transverse coordinate on the source plane, c is the speed of light, ω 0 is the pump frequency of the laser pump, A is the aperture function of the object, S is the transverse intensity profile of the source and M the absolute magnification of the image of the source on D b . The dependence of Γ on the distances z a and z b has been explicitly highlighted to enable easily checking whether focused or out-of-focus images are being considered.
Integration of Γ over the whole directional sensor D b yields an incoherent image of the object, whose point-spread function (PSF) is related with the Fourier transform of the function S ( ρ s ) e i ω 0 2 c ( z b 1 z a 1 ) ρ s 2 , which we shall indicate by S ˜ . The minimal point-spread thus occurs at z b = z a , where S ˜ coincides with the Fourier transform of S ; this is the typical PSF of ghost imaging with chaotic light. In particular, the focused ghost image reads
Σ foc ( ρ a ) = d ρ b Γ ( z a , z a ) ( ρ a , ρ b ) d ρ o | A ( ρ o ) | 2 S ˜ ω 0 c z a ρ o ρ a 2 ,
which entails a quasi one-to-one correspondence between points of the object ( ρ o ) and pixels of the sensor D a ( ρ a ), with an uncertainty Δ ρ a = λ 0 z a / D s defined by the effective diameter D s of the source. On the other hand, sensor D b collects the image of the source as given by Equation (2), thus enabling a correspondence between its pixels ( ρ b ) and points of the source plane ( ρ b = M ρ s ), with an uncertainty Δ ρ b = M λ 0 z b / a defined by the typical size a of the smallest detail of the object. The Klyshko-like pictures depicted in Figure 2 enables a comparison between the focusing effect of the source in lensless ghost imaging (a) [66] and correlation plenoptic imaging (b). In fact, the structure of the nontrivial term in Equation (2) indicates that, in a Klyshko-like unfolded setup, the source acts as a phase conjugate mirror, and the correlated modes in the two arms of the setup are characterized by similar transverse momenta.

2.2. Point-Spread Function and Plenoptic Properties

To better understand the physical meaning of the point-spread-function of CPI, and its consequences on the DOF enhancement, let us consider a light source with a Gaussian intensity profile
S ( ρ s ) = 1 2 π σ 2 exp ρ s 2 2 σ 2 .
In this case, the coherent PSF in Equation (2) reduces to
C ( ρ o α ρ a ) = d ρ s S ( ρ s ) e ω 0 c z b ρ s 2 2 ( 1 α ) e i ω 0 c z b ρ o α ρ a · ρ s exp 1 2 ω 0 σ c z b 2 | ρ 0 α ρ a | 2 1 i ω 0 σ 2 c z b ( 1 α ) ,
with α = z b / z a . The PSF of the incoherent image, as obtained by integrating Equation (2) over ρ b , comes out to be the square modulus of the result in Equation (6), namely,
J ( ρ o α ρ a ) exp ω 0 σ c z b 2 | ρ 0 α ρ a | 2 1 + ω 0 σ 2 c z b ( 1 α ) 2 .
The physics behind the wider depth of field of CPI with respect to standard ghost imaging comes out from the comparison of Equations (6) and (7). In fact, in geometrical optics ( ω 0 ), the variance of the incoherent PSF of Equation (7), typical of ghost imaging, approaches σ | 1 α | and is thus independent of frequency. In the same regime, the coherent PSF of Equation (6), associated with correlation plenoptic imaging, reduces to an imaginary quadratic exponential, with typical width 2 π λ 0 z b | 1 α | . Therefore, the width of the coherent PSF vanishes in the geometrical optics approximation. Most important, the dependence of the two PSFs on defocusing ( | 1 α | ) is such that the (imaginary) width of the coherent PSF scales much slower than the width of the incoherent PSF. This is the reason behind the wider DOF of (coherent) correlation plenoptic imaging, as compared to inchoerent imaging, whether standard or ghost. Now, to unveil the plenoptic properties encoded in Γ ( z a , z b ) , it is worth considering the limit of Equation (2) in the short-wavelength regime, when the integral is dominated by the stationary points of the phase. In particular, stationarity with respect to ρ o yields
ρ s + ρ b M = 0 ,
namely, the geometrical correspondence between points of the source and points of the sensor D b , with magnification M and inversion of the image, as already discussed. The stationarity condition with respect to ρ s yields a less trivial result, that, combined with Equation (8), identifies the object point ρ o that provides the dominant contribution to the integral, at the given detection positions ρ a and ρ b , which is:
ρ o = z b z a ρ a ρ b M 1 z b z a .
Hence, in the geometrical-optics limit, the intensity correlation function reads
Γ ( z a , z b ) ( ρ a , ρ b ) S ρ b M 2 A z b z a ρ a ρ b M 1 z b z a 2 ,
namely, it reproduces the magnified and displaced image of the object (A), multiplied by the source intensity profile, as shown in Figure 3a. When z b z a , integration over ρ b blurres the image of the aperture function of the object, thus giving an out of focus ghost image, as shown in Figure 3c. This indicates the crucial role played in CPI by the high-resolution detector D b , as opposed to the bucket detector of ghost imaging. In fact, magnified and displaced images obtained by the correlation measurements can be reshaped and realigned (i.e., refocused) by employing the following scaling property,
Γ ( z a , z b ) z a z b ρ a ρ b M 1 z a z b , ρ b S ρ b M 2 A ( ρ a ) 2 ,
as shown in Figure 3b. The independence of the image | A | 2 of ρ b guarantees that integration over ρ b does not compromise the image quality. In fact, as shown in Figure 3d, the final image
Σ ( z a , z b ) ref ( ρ a ) = d ρ b Γ ( z a , z b ) z a z b ρ a ρ b M 1 z a z b , ρ b Σ foc ( ρ a )
now approximates, up to an intensity rescaling, the focused incoherent image in Equation (4). The refocusing alghoritm of Equation (11) is formally identical to the one employed in standard plenoptic imaging [3]. In fact, in analogy with standard plenoptic imaging, the key for refocusing is the information on the direction of light propagating between the object and the focusing element. In our CPI scheme, by measuring correlations, we can reconstruct the path of light rays from the source to the object, as clarified in Figure 2b. Hence, once again, we find that the coherent images associated with any fixed value of ρ b , as described by Equations (10) and (11), have a wider depth of field with respect to the incoherent images obtained by a mere integration over ρ b . However, such images are formed by a very small fraction of light propagating through the object, and are thus affected by a low signal-to-noise ratio. The SNR highly improves when summing all the rescaled images of Equation (11) over D b , to get the final refocused image of Equation (12).
Finally, both the result in Equation (10) and the plot in Figure 3a indicate that, when the image is out of focus, each pixel on the sensor D b represents a different point of view from which the image of the object is projected onto the sensor D a . Hence, imaging the light source on the sensor D b , enables acquiring multi-perspective images of the scene of interest.
The change of viewpoint is a common feature of both PI and CPI, with the only difference that, in CPI, it is obtained with a single lens ( L b ) rather than by the microlens array of standard PI; therefore, potentially, it is significantly larger in CPI than in standard PI. Despite not using it in the present work, it is worth emphasizing the key role played by the wide change of perspective and its achievable resolution, for implementing 3D imaging.
Based on Equations (11) and (12), to get a refocused image, one should know with sufficient precision both the source-to-sensor distance z a and the source-to-object distance z b . In reality, while z a is determined by experimental settings, z b is generally unknown. In this case, the refocusing algorithm must be applied for different values of z b , until the optimal sharpness of the image is found. This is shown in Figure 4, where we present a simulation of different images of an out of-focus object [67]: (a) the blurred ghost image; (b) the refocused CPI image; (c) and (d) two refocusing attempts with the correct value of z a and an incorrect value of z b . The last two images are evidently less sharp than the one in (b). This also indicates that the refocusing capability of CPI can also be exploited for measuring distances.

2.3. Depth-of-Field Improvement

To analyze the fundamental limits defining the maximum achievable resolution and DOF of CPI, we shall compare the DOF of CPI and ghost imaging, which is in fact equivalent to any standard imaging (SI) obtained by a focusing element having the same numerical aperture as the chaotic source. For simplicity, we consider a 1D object A ( ρ o ) = A ( x 0 ) and a source with a Gaussian profile, as in Equation (5). In Figure 5 and Figure 6, we report the incoherent ghost image (left column)
Σ ( z a , z b ) z a z b x a = d x o | A ( x o ) | 2 J 1 ( x o x a ) ,
which, for z a = z b , coincides with Σ foc of Equation (4), the coherent image from CPI (central column)
Γ ( z a , z b ) z a z b x a , x b = 0 = d x o A ( x o ) C 1 ( x o x a ) 2
and the refocused image from CPI (right column)
Σ ( z a , z b ) ref x a = d x b Γ ( z a , z b ) z a z b x a x b M 1 z a z b , x b ,
with J 1 ( x ) = d y J ( x , y ) and C 1 ( x ) = d y C ( x , y ) , as defined in Equations (6) and (7). Single slits of different width a are considered in Figure 5, and a double-slit mask in Figure 6. The Gaussian profile of the source has width σ = 1.08 mm . In line with the experiment that will be discussed in the following section, we fix the distance z a between the source and the sensor D a , while changing the source-to-object distance z b . Comparison of panels (b)–(e)–(h) with panels (c)–(f)–(i) of Figure 5 indicates that the maximum achievable DOF in CPI is limited by diffraction at the object, which hinders the detection of directional information, and hence the ability to refocus. Such dependence can be understood in terms of Klyshko picture [68], as applied to ghost imaging with chaotic light [62]. In addition, Figure 6 shows that interference effects, typical of coherent imaging, also limit the maximum achievable DOF of the refocused image. On the other hand, the resolution of the focused image is only limited by the size of the focusing element. CPI thus reaches the fundamental limits imposed by the wave nature of light to both image resolution and DOF.
Correlation Plenoptic Imaging offers the unique opportunity to refocus without sacrificing diffraction-limited image resolution, as defined by the numerical aperture of the imaging system. In Figure 7c, the dashed line represents the estimate, based on geometrical optics, for the maximum range of “perfect” refocusing in CPI [39], which is obtained from the condition
1 z a z b < Δ x Δ u = d z a / z b max [ λ z b / a , 2 λ / ( M b NA b ) , 2 δ u / M ] ,
with Δ x the resolution on the spatial sensor D a and Δ u the resolution on the source plane. On the right-hand side of Equation (16), we have considered d as the distance between object points that we want to resolve (e.g., the centers of a double slit), while a is the typical size of the smallest details of the object (e.g., the slit width). The resolution limit Δ x = d z a / z b is defined by the geometrical projection of the image on the sensor plane. The resolution limit Δ u is defined by the largest contribution among the ones determined by diffraction at the object (i.e., λ z b / a ), the numerical aperture of L b , or the pixel size δ u ; the last two contributions enter into play only for objects very close to the light source (i.e., for z b = 2 a / ( M b NA b ) and z b = 2 δ u a / ( M λ ) , respectively). Hence, the physical quantities that generally define the directional and spatial resolution of correlation plenoptic imaging are the source-to-object distance z b and the quantities a and d that characterize the object transmission function. Figure 7c shows, in a density plot, the visibility of the images of double slits with center-to-center distance d and width a = d / 2 , evaluated in the experimental setting described in Section 3. The plot tests the reliability of the geometrical prediction in Equation (16), and also reveals the real (wave-optics) limits of resolution and depth of field in CPI. Oscillations that can be observed in the density plot are due to the coherent nature of correlation plenoptic imaging.
To compare CPI with both standard imaging and standard PI, we consider imaging devices having the same NA as the light source in our scheme, and report in Figure 7a,b the visibility they achieve. In such cases, the quantity z b z a is the difference between the actual position of the object and the position of the plane focused on the detector by the imaging lens. We have considered the case N u = 3 (namely, 3 × 3 resolution cells on the focusing element) in the case of standard PI, in order to gain directional information without hindering too much spatial resolution. Comparing the three plots in Figure 7, we can observe that CPI combines in an optimal way the advantages of standard imaging and plenoptic imaging, since diffraction-limited resolution is preserved and DOF is increased beyond the typical values achieved in standard PI. Moreover, the smaller object details that can be refocused at z b = z a / 2 ( d = 8 λ z a 2.8 Δ x f ) can always be refocused for close up z b < z a , no matter how misfocused they are. For z b > z a , the DOF associated with CPI is significantly larger than the ones characterizing standard imaging and standard PI.
It is worth emphasizing that the DOF of the standard image represents the axial resolution of CPI ( Δ z C P I = λ / NA 2 ); hence, the ratio between the depth of fields of CPI and standard imaging provides an estimate of the number of unique planes that can be refocused by CPI.

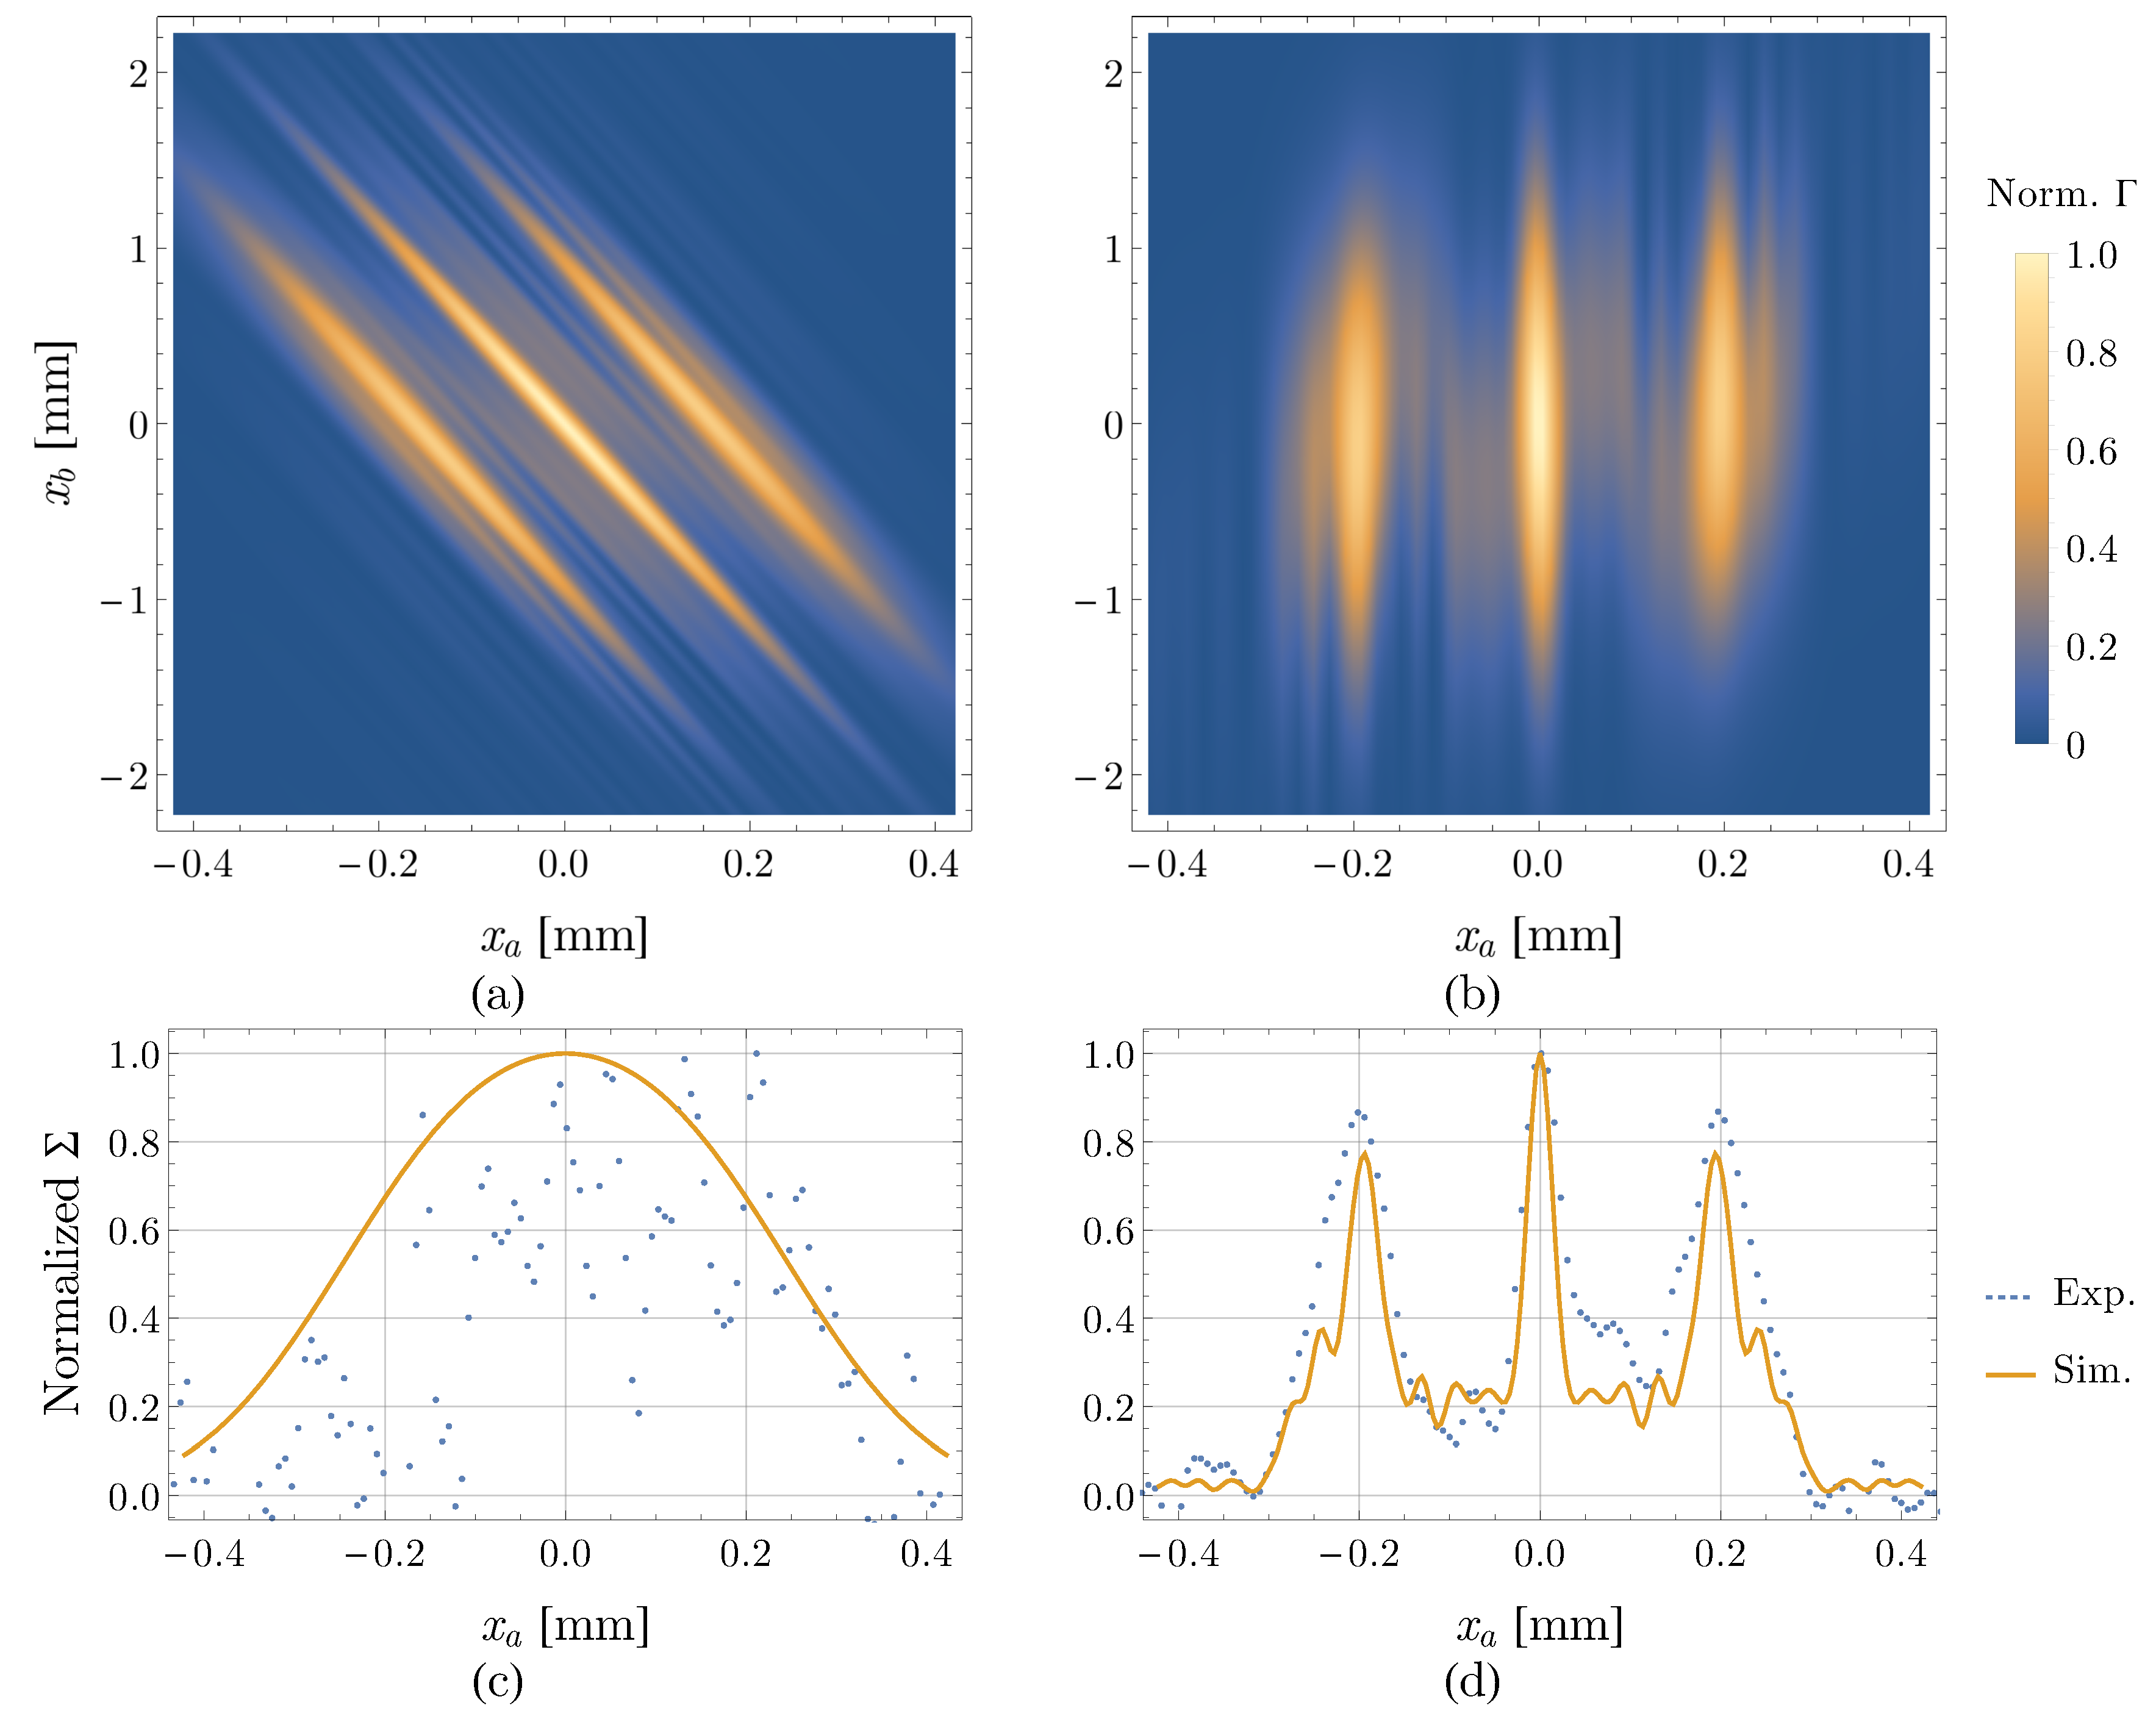
3. Experimental Demonstration of CPI

The experimental setup employed to demonstrate CPI is represented in Figure 10. The light source is a continuous-wave single-mode laser with wavelength λ = 532 nm and tunable power up to 5 W (Azur Light Systems ALS-532nm-SF, Azur Light Systems, Pessac, France). To obtain a controllable chaotic source, the laser beam is expanded to a spot size σ = 1.08 mm , is passed through a polarizer and impinges on a rotating ground glass disk, spinning at 0.05 Hz , at a distance of about 4 cm from its center. As depicted in Figure 10, light is then divided by a polarizing beam-splitter (PBS). The combination of polarizer and PBS enables optimizing the SNR by balancing the intensities at the sensors D a and D b , which are different areas of the same scientific complementary metal-oxide semiconductor (sCMOS) sensor (Hamamatsu ORCA-Flash 2.8 camera C11440-10C, Hamamatsu Corporation, Shizuoka Prefecture, Hamamatsu, Japan). The reflected beam passes through the object of interest (ThorLabs 1951 USAF Resolution Test Targets, Newton, NJ, USA), propagates toward a lens ( L b ) of focal length F = 300 mm , and reaches the angular sensor D b , which lies in the conjugate plane of the source (image has unitary magnification M = 1 ). The transmitted beam propagates toward a lens ( L a ) of focal length f a = 125 mm , that reproduces on the spatial sensor D a the image of the “ghost-imaging plane”, set at a distance z a = 92 mm from the source, with a magnification M a = 1 . In our case, the resolution at focus is Δ x f = λ / NA = 14 μ m , where NA is the smaller numerical aperture between the ones of the source and of L a . For objects at the resolution limit, DOF = λ / NA 2 = 0.37 mm . The camera is characterized by a pixel size of 3.6 μ m , which is much smaller than both the spatial and the directional resolution. We thus perform a binning of the camera pixels to match the effective pixels δ x and δ u with the spatial and directional resolutions, respectively. In particular, during data acquisition, we perform a 2 × 2 binning to get δ x = 7.2 μ m Δ x f / 2 . In post-processing, a further 10 × 10 binning is performed on the region of the camera sensor dedicated to the angular measurement, thus getting δ u = 72 μ m < Δ u / 2 , with Δ u = λ z b / a . The latter is determined, for the chosen values of z b and object size, by diffraction at the object. The test target mimics small details and allows for easily monitoring the image resolution, both in the out-of-focus and in the refocused image. We acquire 50,000 frames for all measurements at a frame rate of 45.4 s 1 , with an exposure time τ meas = 21 μ s approximately 100 times smaller than the chaotic source coherence time. The acquired frames are processed to evaluate the spatio-temporal intensity correlation, which is expected to converge to Equation (2). The CPI images are reported in Figure 8 and Figure 9a,b. In Figure 8, we report the experimental results obtained for element 3 of group 2 of the test target: the three slits have center-to-center distance d = 0.198 mm and slit width a = d / 2 (measurement B in Figure 7). In the left column, we report the out-of-focus image obtained on D a by measuring correlation with the whole detector D b , when the mask is placed significantly out of focus ( z b z a 20 mm ); this is equivalent to the blurred image that any conventional imaging system, characterized by the same NA as our CPI scheme, would retrieve with the same defocusing. In the right column, we report the same image after implementing the CPI refocusing algorithm in Equation (12). In Figure 9, we report the experimental refocused images obtained, respectively, for element 3 of group 2 (having d = 0.198 mm ) placed at z b z a = 46 mm (measurement A in Figure 7), and for element 4 of group 1 (having d = 0.354 mm ) placed at z b z a = 41 mm (measurement C in Figure 7). The corresponding standard ghost images are much more blurred than the one reported in Figure 8a, and therefore have not been reported. The SNR in Figure 9a is lower than in Figure 8b and Figure 9b because the displaced coherent images retrieved for z b = z a / 2 are two times larger than the object, and distributed over a region wider than the illuminated area; the coherent images are thus affected by a poor SNR, which reflects on the final refocused image. To avoid this issue, the divergence of the light source should be designed to account for such displacement and enlargement.
The experimental parameters used to obtain the results in Figure 8 and Figure 9 are identified by points A, B and C in Figure 7. In all three experiments, correlation plenoptic imaging provides a relevant DOF advantage: CPI enables refocusing the object associated with A and B in a 7 times larger range than in standard imaging, and in a 2.5 times larger range than with standard PI having N u = 3 . For the object associated with point C, the refocusing range of CPI is four times larger than the DOF of standard imaging and two times larger than the DOF of a standard PI device characterized by a spatial resolution that is three times worse (i.e., N u = 3 ).

4. A Different Architecture of CPI with Chaotic Light

We are now going to discuss the possibility of performing correlation plenoptic imaging in a setup that also enables standard imaging, namely, where the image of the object is available from ordinary intensity measurements. The advantage is the possibility to directly monitor the object while plenoptic imaging is performed. The proposed setup is represented in Figure 11; it is characterized by the same components as the scheme discussed in Section 2, but the light source and the lens now play opposite roles. Actually, the lens L b now focuses the object on detector D b , while the chaotic source enables for reproducing the ghost image of the lens by intensity correlation measurements [69]. For the ghost image of the lens to be focused on D b , we set
z a = z b + S 1 .
The choice of imaging the lens L b is motivated by the need to gain directional information on light propagating from the object to D b . In fact, in the present scenario, L b is the focusing element, responsible for reproducing the image of the object of interest. The object is focused on D b when the lens-to-sensor distance is S 2 = S 2 f , with
1 S 1 + 1 S 2 f = 1 f ;
however, since we are interested in demonstrating the refocusing power of this scheme, we shall not fix the value of S 2 .
The correlation function is determined by an integral involving the source intensity profile S ( ρ s ) , the object aperture function A ( ρ o ) and the lens pupil function P ( ρ ) . However, in line with realistic experimental conditions, we shall assume that the source is large enough not to affect propagation of light in arm b of the setup; in this case, the value of Γ is determined with good approximation by the object features and the lens aperture, namely (up to irrelevant constants),
Γ ( S 1 , S 2 ) ( ρ a , ρ b ) = d ρ o d ρ A ( ρ o ) P ( ρ ) e i ω 0 c ψ ( ρ o , ρ ; ρ a , ρ b ) 2 ,
where
ψ ( ρ o , ρ ; ρ a , ρ b ) = 1 S 2 1 S 2 f ρ 2 2 ρ o S 1 + ρ b S 2 · ρ + ρ o · ρ a S 1 .
With respect to the result obtained for the scheme of Figure 1, the source intensity profile is replaced here by the pupil function of the lens, and the focusing condition z a = z b is replaced by S 2 = S 2 f .
Similar to the previous scheme, the incoherent image of the object is recovered by integrating the correlation function over the whole angular detector D a
Σ foc ( ρ b ) = d ρ a Γ ( S 1 , S 2 ) ( ρ a , ρ b ) d ρ o A ( ρ o ) 2 d 2 ρ P ( ρ ) e i ω 0 c ρ o S 1 + ρ b S 2 f · ρ 2 ,
where the focusing condition is related with the disappearance of the quadratic phase in Equation (19). As expected, the width of the PSF is determined by the lens diameter ( D ), which is, Δ ρ b λ 0 S 2 f / D ; hence, the object resolution is Δ ρ o λ 0 S 1 / D . On the other hand, the incoherent ghost image of the lens is retrieved by integrating the correlation function over ρ a , to get
d ρ b Γ ( S 1 , S 2 ) ( ρ a , ρ b ) d ρ P ( ρ ) 2 A ˜ ω 0 c S 1 ( ρ ρ a ) 2 .
The PSF of this image is represented by the Fourier transform of the object transmission function A ˜ ; the resolution Δ ρ a λ 0 S 1 / a is thus fixed by the typical size a of the smallest details of the object. In addition, in this case, the angular resolution is thus only hindered by diffraction at the object, provided if the source is large enough not to play the role of a limiting pupil.
The plenoptic properties of the correlation function can be unveiled by imposing the stationary phase condition in the integral of Equation (19). The most relevant term in the geometrical optics regime reads
Γ ( S 1 , S 2 ) ( ρ a , ρ b ) P ( ρ a ) 2 A S 1 S 2 ρ b + 1 S 2 S 2 f ρ a 2 .
As in the previous setup, the dependence of the retrieved correlation function on the coordinates ( ρ a ρ ) of the focusing element provides different viewpoints on the object, as required for 3D imaging. In addition, when the sensor D b retrieves an out-of-focus image ( S 2 S 2 f ), refocusing can be achieved through a simple rescaling procedure, and the final image is given by
Σ ( S 1 , S 2 ) ref ( ρ b ) = d ρ a Γ ρ a , S 1 S 2 f ρ b + S 1 S 2 f ρ a A S 1 S 2 f ρ a 2 Σ foc ( ρ b ) ,
which approximates the focused image with an accuracy that improves as the geometrical-optics limit is approached.

Comparison between the Two Schemes

The present CPI setup, where the object is directly imaged by a lens L b , ensures a larger control on the image resolution, which is now defined by the lens diameter rather than by the intensity profile of the chaotic source, as in the previous scheme. Another advantage of the new scheme is that the correlation function Γ depends on the square of the lens pupil function P ( ρ ) , which is usually a binary object; on the contrary, in the previous case, the dependence on the squared intensity profile of the source leads to a reduction of the signal in correspondence of dimmer areas. Still, this alternative scheme requires a source that is large enough as not to affect the resolution of the ghost image of the lens, which is thus only limited by diffraction at the object. An interesting follow-up of this research is the extension of the discussed methods to microscopy, one of the most intriguing applications of plenoptic imaging.

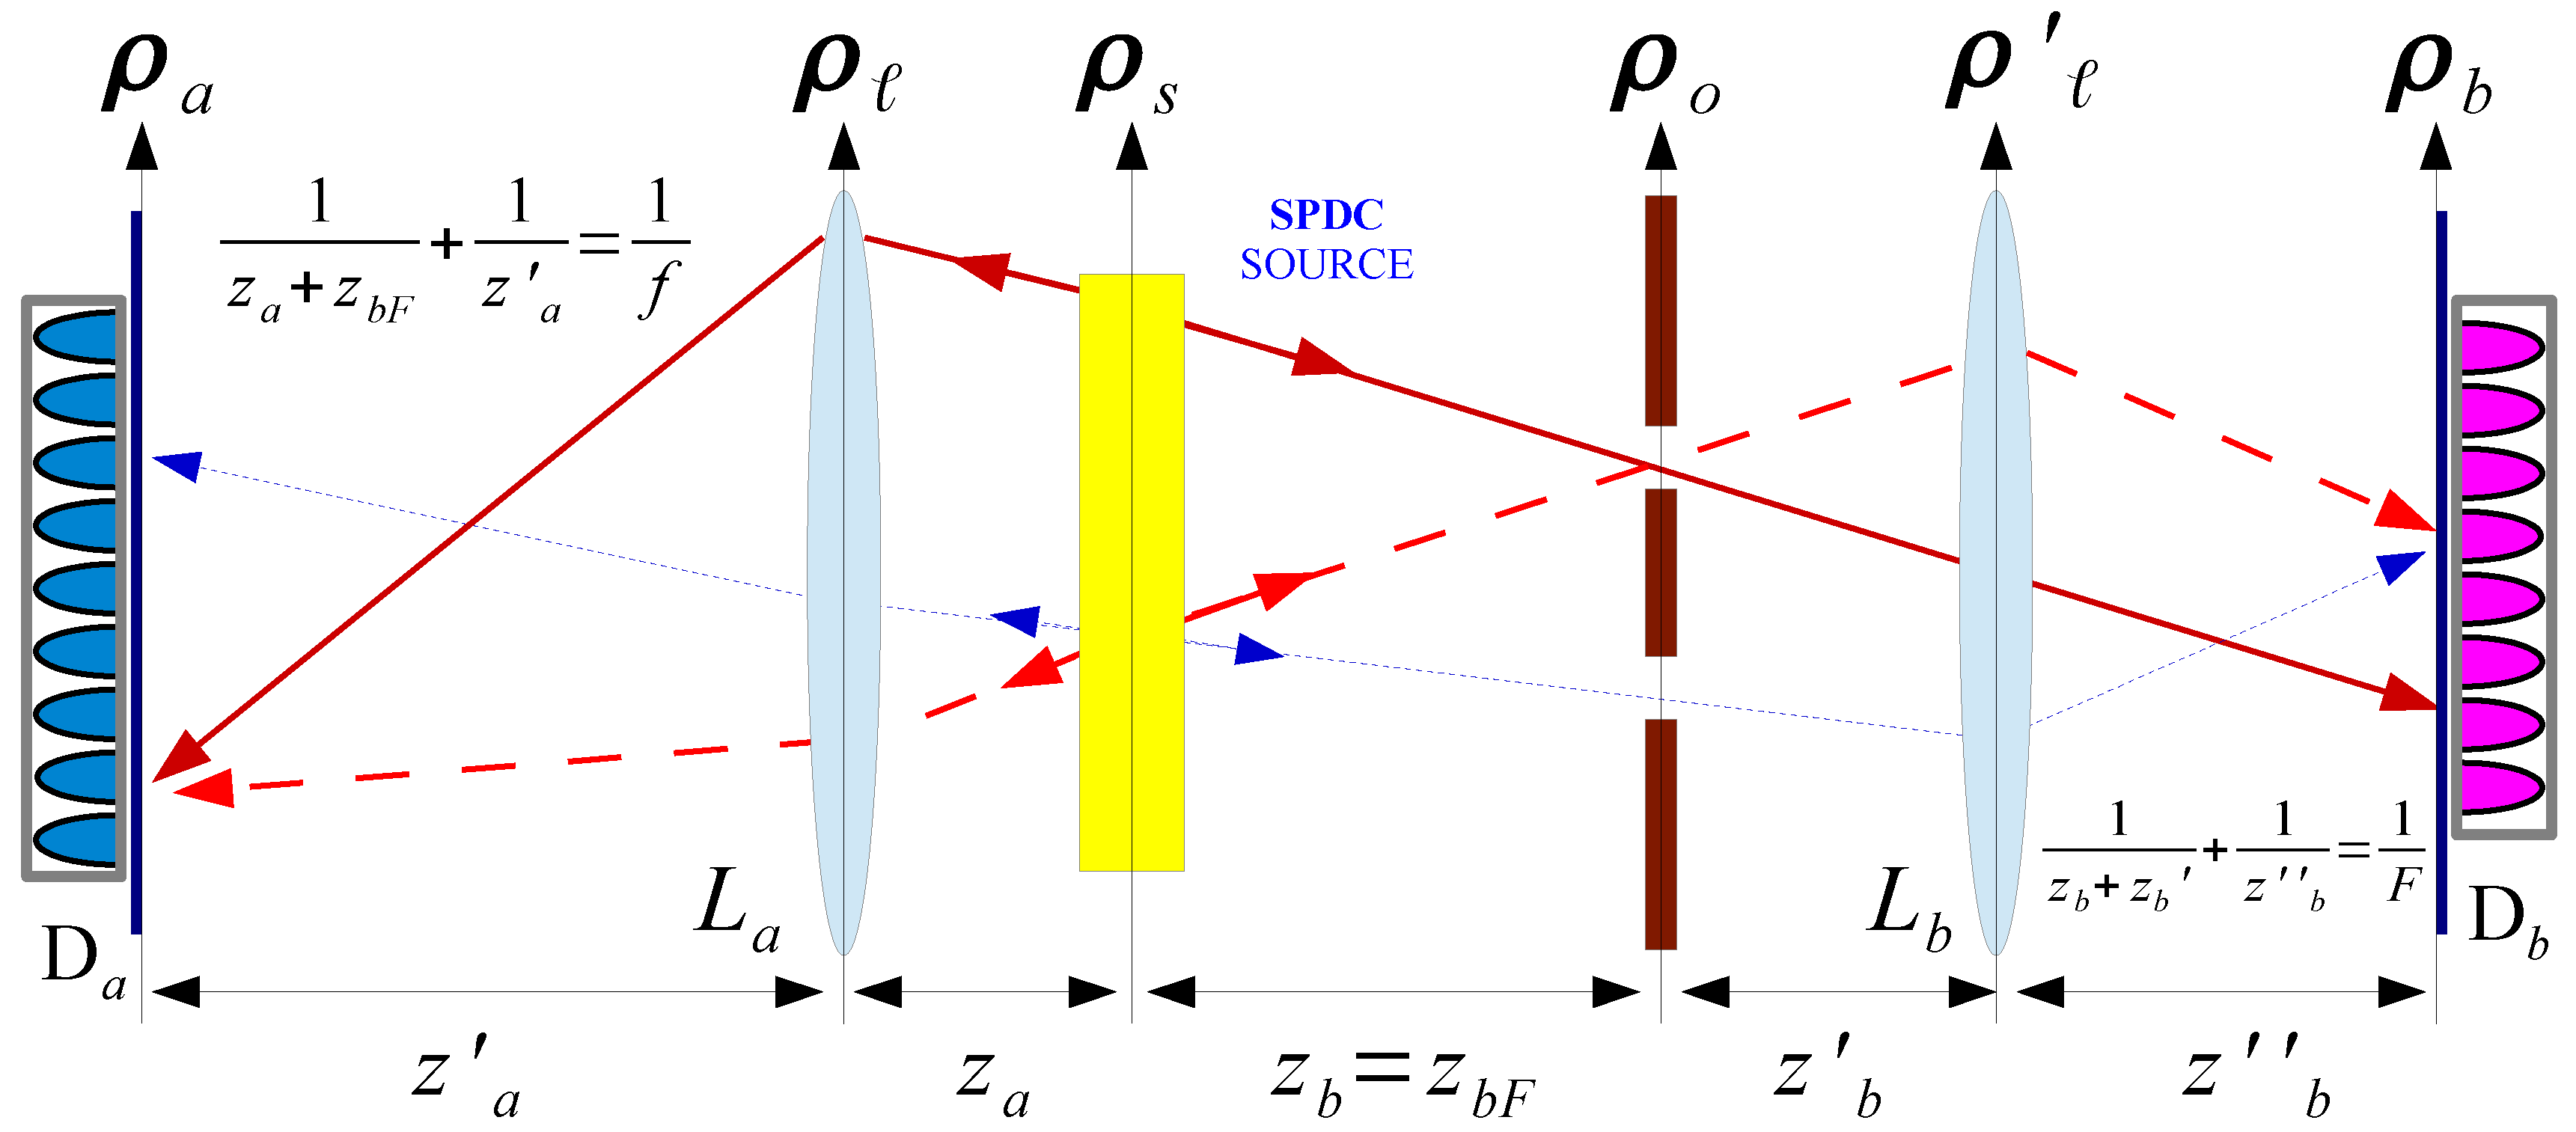
5. CPI with Entangled Photons

Up to now, we have discussed CPI setups based on chaotic light intensity correlations. Actually, the scheme can be generalized to any kind of correlated beam, provided that their properties are correctly taken into account. An outstanding example is given by entangled photon pairs, as produced by SPDC. Here, we will discuss the setup reported in Figure 12. In view of plenoptic imaging, this setup must enable the parallel acquisition of several images of the given scene, one for each propagation direction of light. We shall soon demonstrate that, also in this case, the sensor D a retrieves N coherent ghost images of the object by means of correlation measurements with the N pixels of D b , each one giving a different viewpoint on the desired scene. This is quite intuitive if one considers that, similar to the first CPI setup in Figure 1, D b reproduces the image of the light source. Like both previous CPI schemes, the lens L b alone replaces the microlens array required in standard plenoptic imaging.
As in the case of chaotic light, the intensity correlation measurement and, in the photon-counting regime, the coincidence detection, are described by the second order Glauber correlation function (see Equation (A1)). The expectation value is now taken over the two-photon signal-idler state produced by SPDC [70,71,72]
| Ψ = N d ν s ( L D ν ) d κ i d κ s h tr ( κ i + κ s ) a k i a k s | 0 ,
where ν is the detuning of the signal and idler beams compared to their central frequencies Ω s = Ω i = ω p / 2 , related with the pump laser frequency ω p by the phase-matching conditions, L is the longitudinal size of the SPDC crystal, D is the group velocity difference between the two beams, the function s ( L D ν ) is the SPDC biphoton spectrum [73,74], N is an irrelevant normalization, and h tr is the Fourier transform of the transverse amplitude profile of the pump laser:
F ( ρ ) = d κ e i κ · ρ h tr ( κ )
and the a k i , s + ’s are the operators that create photons with a definite momentum out of the vacuum | 0 . The computation of the second order Glauber correlation function, reported in the Appendix B, provides the following result:
Γ ( z a , z b ) ( ρ a , ρ b ) d ρ o A ( ρ o ) d ρ s F ( ρ s ) e i Ω c φ ( ρ o , ρ s ; ρ a , ρ b ) 2 ,
with
φ ( ρ o , ρ s ; ρ a , ρ b ) = 1 z b + 1 z a 1 ζ ( z a , z a ) z a | ρ s | 2 2 ζ ( z a , z a ) z a z a ρ s · ρ a 1 z b ρ s + ρ b M · ρ o ,
where ζ ( z a , z a ) = ( z b F + z a ) z a / z b F .

5.1. Plenoptic Properties of the Correlation Function

The typical refocusing capability of PI characterized also the the CPI protocol due to the spatial and angular information encoded in the correlation function of Equation (27). To explicitly see this point, let us start by considering the simple case of a focused image, as obtained when the distance between the object and the source z b = z b F satisfies the two-photon thin lens equation [61,75]
1 z a + z b F + 1 z a = 1 f .
In this situation, the correlation function of Equation (27) gives the (incoherent) ghost image of the object, upon integration over the detection plane of D b [61,75]:
Σ foc ( ρ a ) = d ρ b Γ ( z a , z b F ) ( ρ a , ρ b ) d ρ o | A ( ρ o ) | 2 h tr Ω c z b F ρ o + ρ a m 2 ,
where m = z a / ( z a + z b F ) is the image magnification. This result holds if h tr is more peaked around the origin than the Fourier transform of the imaging lens L a ; otherwise, it would be affected by the finite size of the lens. Such image is formally equivalent to the incoherent image obtained in an ordinary imaging system, were the PSF h tr is given by the Fourier transform of the imaging lens pupil. However, as in the case of chaotic light, the correlation function of Equation (27) contains much more information than the ghost image: the main physical differences are once again related with the coherent nature of the images it encodes.
Coherence is the immediate consequence of measuring coincidences between the spatial sensor D a and any pixel of the angular sensor D b . This can be better understood in terms of the Klyshko picture [75] reported in Figure 13: light illuminating the object and contributing to the coincidence detection between any two pairs of pixels ρ a and ρ b has a well defined propagation direction; hence, it is responsible for the formation of a coherent image.
Now, to explicitly demonstrate both the refocusing and three-dimensional imaging capabilities of this scheme, and to better highlight the plenoptic properties of the correlation function of Equation (27), we shall consider the more general out-of-focus situation ( z b z b F ). The stationary points of the phase defined in Equation (28) enable to determine the geometrical correspondence between points on the object and the source with points on sensors D a and D b , respectively. In particular, the stationarity of φ with respect to ρ s determines the object point that gives the predominant contribution to the integral of Equation (27), which is
ρ o = z b z b F ρ a m ρ b M 1 z b z b F .
When the focusing condition of Equation (29) is satisfied, this object point becomes independent of the specific sensor pixel ρ b ; hence, the focused ghost image is not sensitive anymore to the change of perspective enabled by the high resolution of the angular sensor D b . On the other hand, the stationarity of φ with respect to ρ o yields the focusing of the source on the sensor D b :
ρ s = ρ b M .
Therefore, in the geometrical optics limit, the correlation function of Equation (27) reduces to the product of the tilted and rescaled geometrical image of the object with the source profile
Γ ( z a , z b ) ( ρ a , ρ b ) A z b z b F ρ a m ρ b M 1 z b z b F 2 F ρ b M 2 .
By properly rescaling the variable ρ a , the correlation function gives the perfectly aligned geometrical images of the desired scene, one for each value of ρ b , namely
Γ ( z a , z b ) ref z b F z b ρ a + ρ b M m 1 z b F z b , ρ b F ρ b M 2 A ρ a m 2 .
Such rescaling is formally identical to the one employed both in standard plenoptic imaging [3] and in correlation plenoptic imaging with chaotic light (see Equation (11)). Similar to standard plenoptic imaging, the signal-to-noise ratio is highly improved by integrating the result of Equation (34) over the whole sensor array ρ b , thus employing light coming from the whole light source. The result
Σ ( z a , z b ) ref ( ρ a ) = d ρ b Γ ( z a , z b ) ref z b F z b ρ a + ρ b M m 1 z b F z b , ρ b
represents the refocused incoherent ghost image of an object placed at a generic distance z b from the source.
The accuracy of the quasi one-to-one correspondence of object and source points with their images on D a and D b , respectively, is at the basis of the resolution properties of CPI with entangled photons. On one hand, the object PSF in Equation (30) is characterized by a spot size Δ ρ a m c z b F / ( Ω D s ) , with D s the typical transverse size (effective diameter) of the pump profile. On the other hand, the PSF of the source image is determined by the size a of the smallest object details, through Δ ρ b M c z b / ( Ω a ) . Hence, for pixel size above the resolution limits, spatial and directional resolutions are decoupled, as in chaotic light CPI. Therefore, also CPI with entangled photons overcomes the intrinsic limitations of standard plenoptic imaging and achieves a larger depth of field (as defining by the angular resolution), with diffraction-limited resolution.

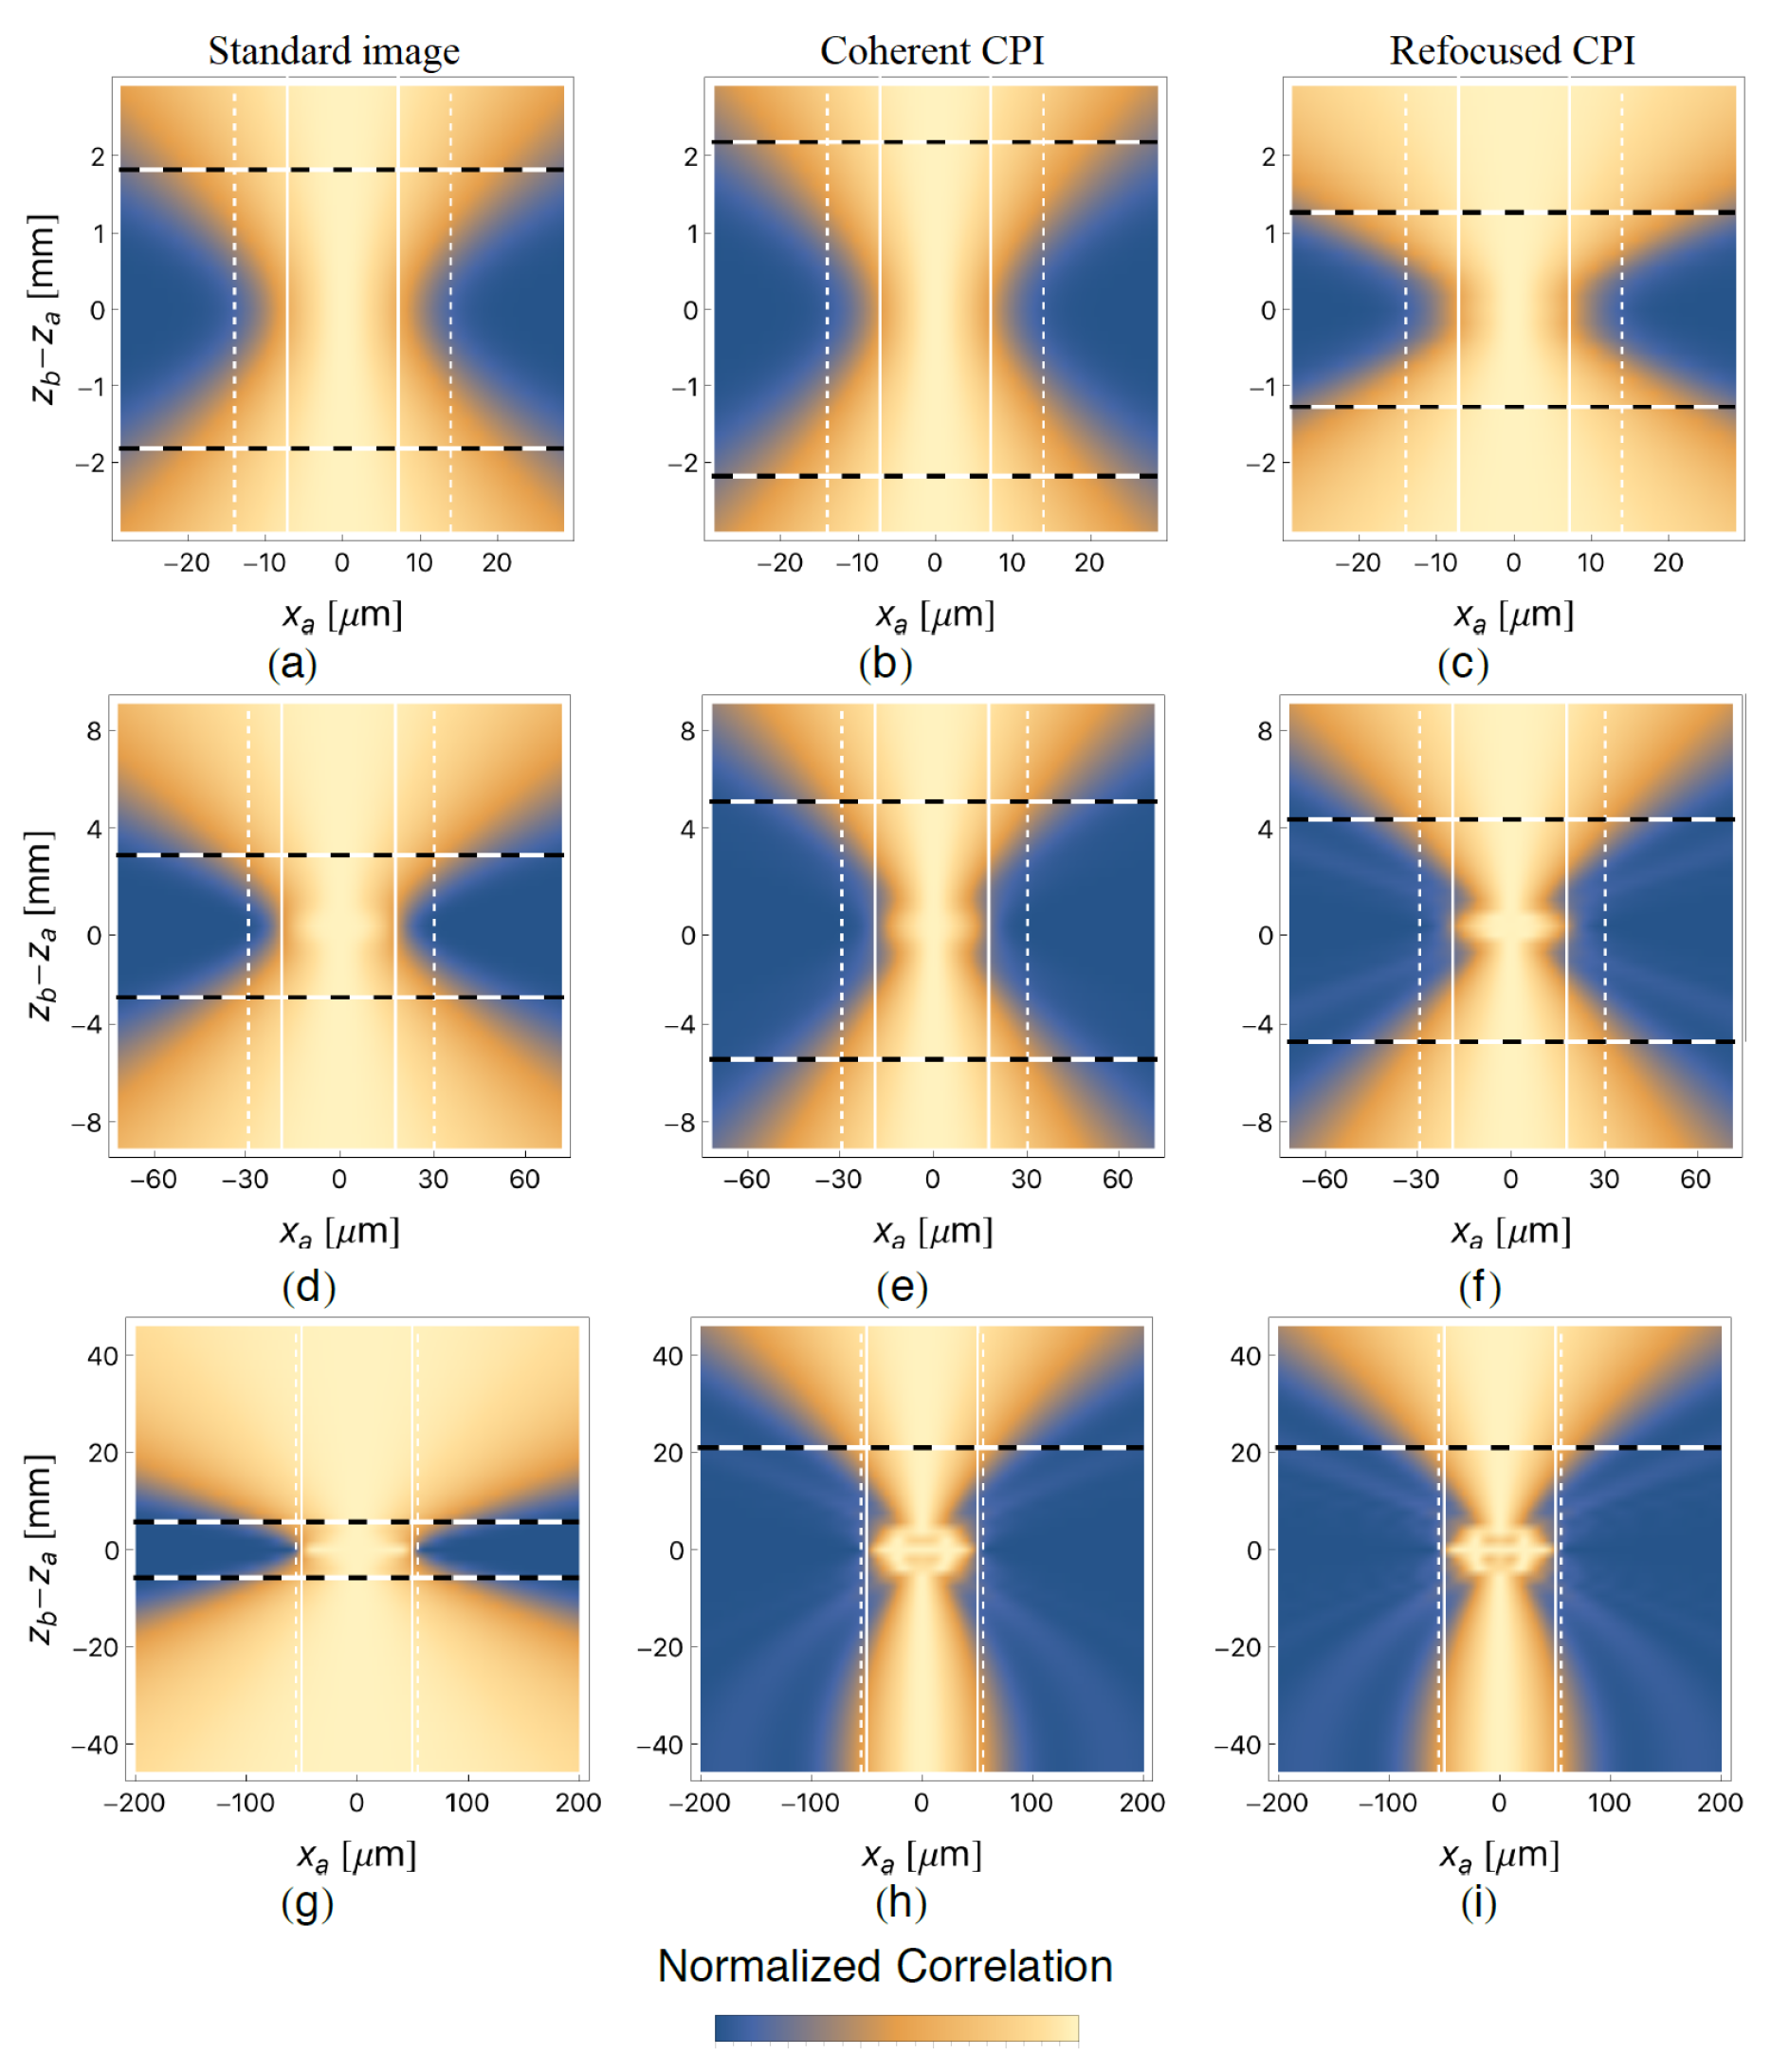
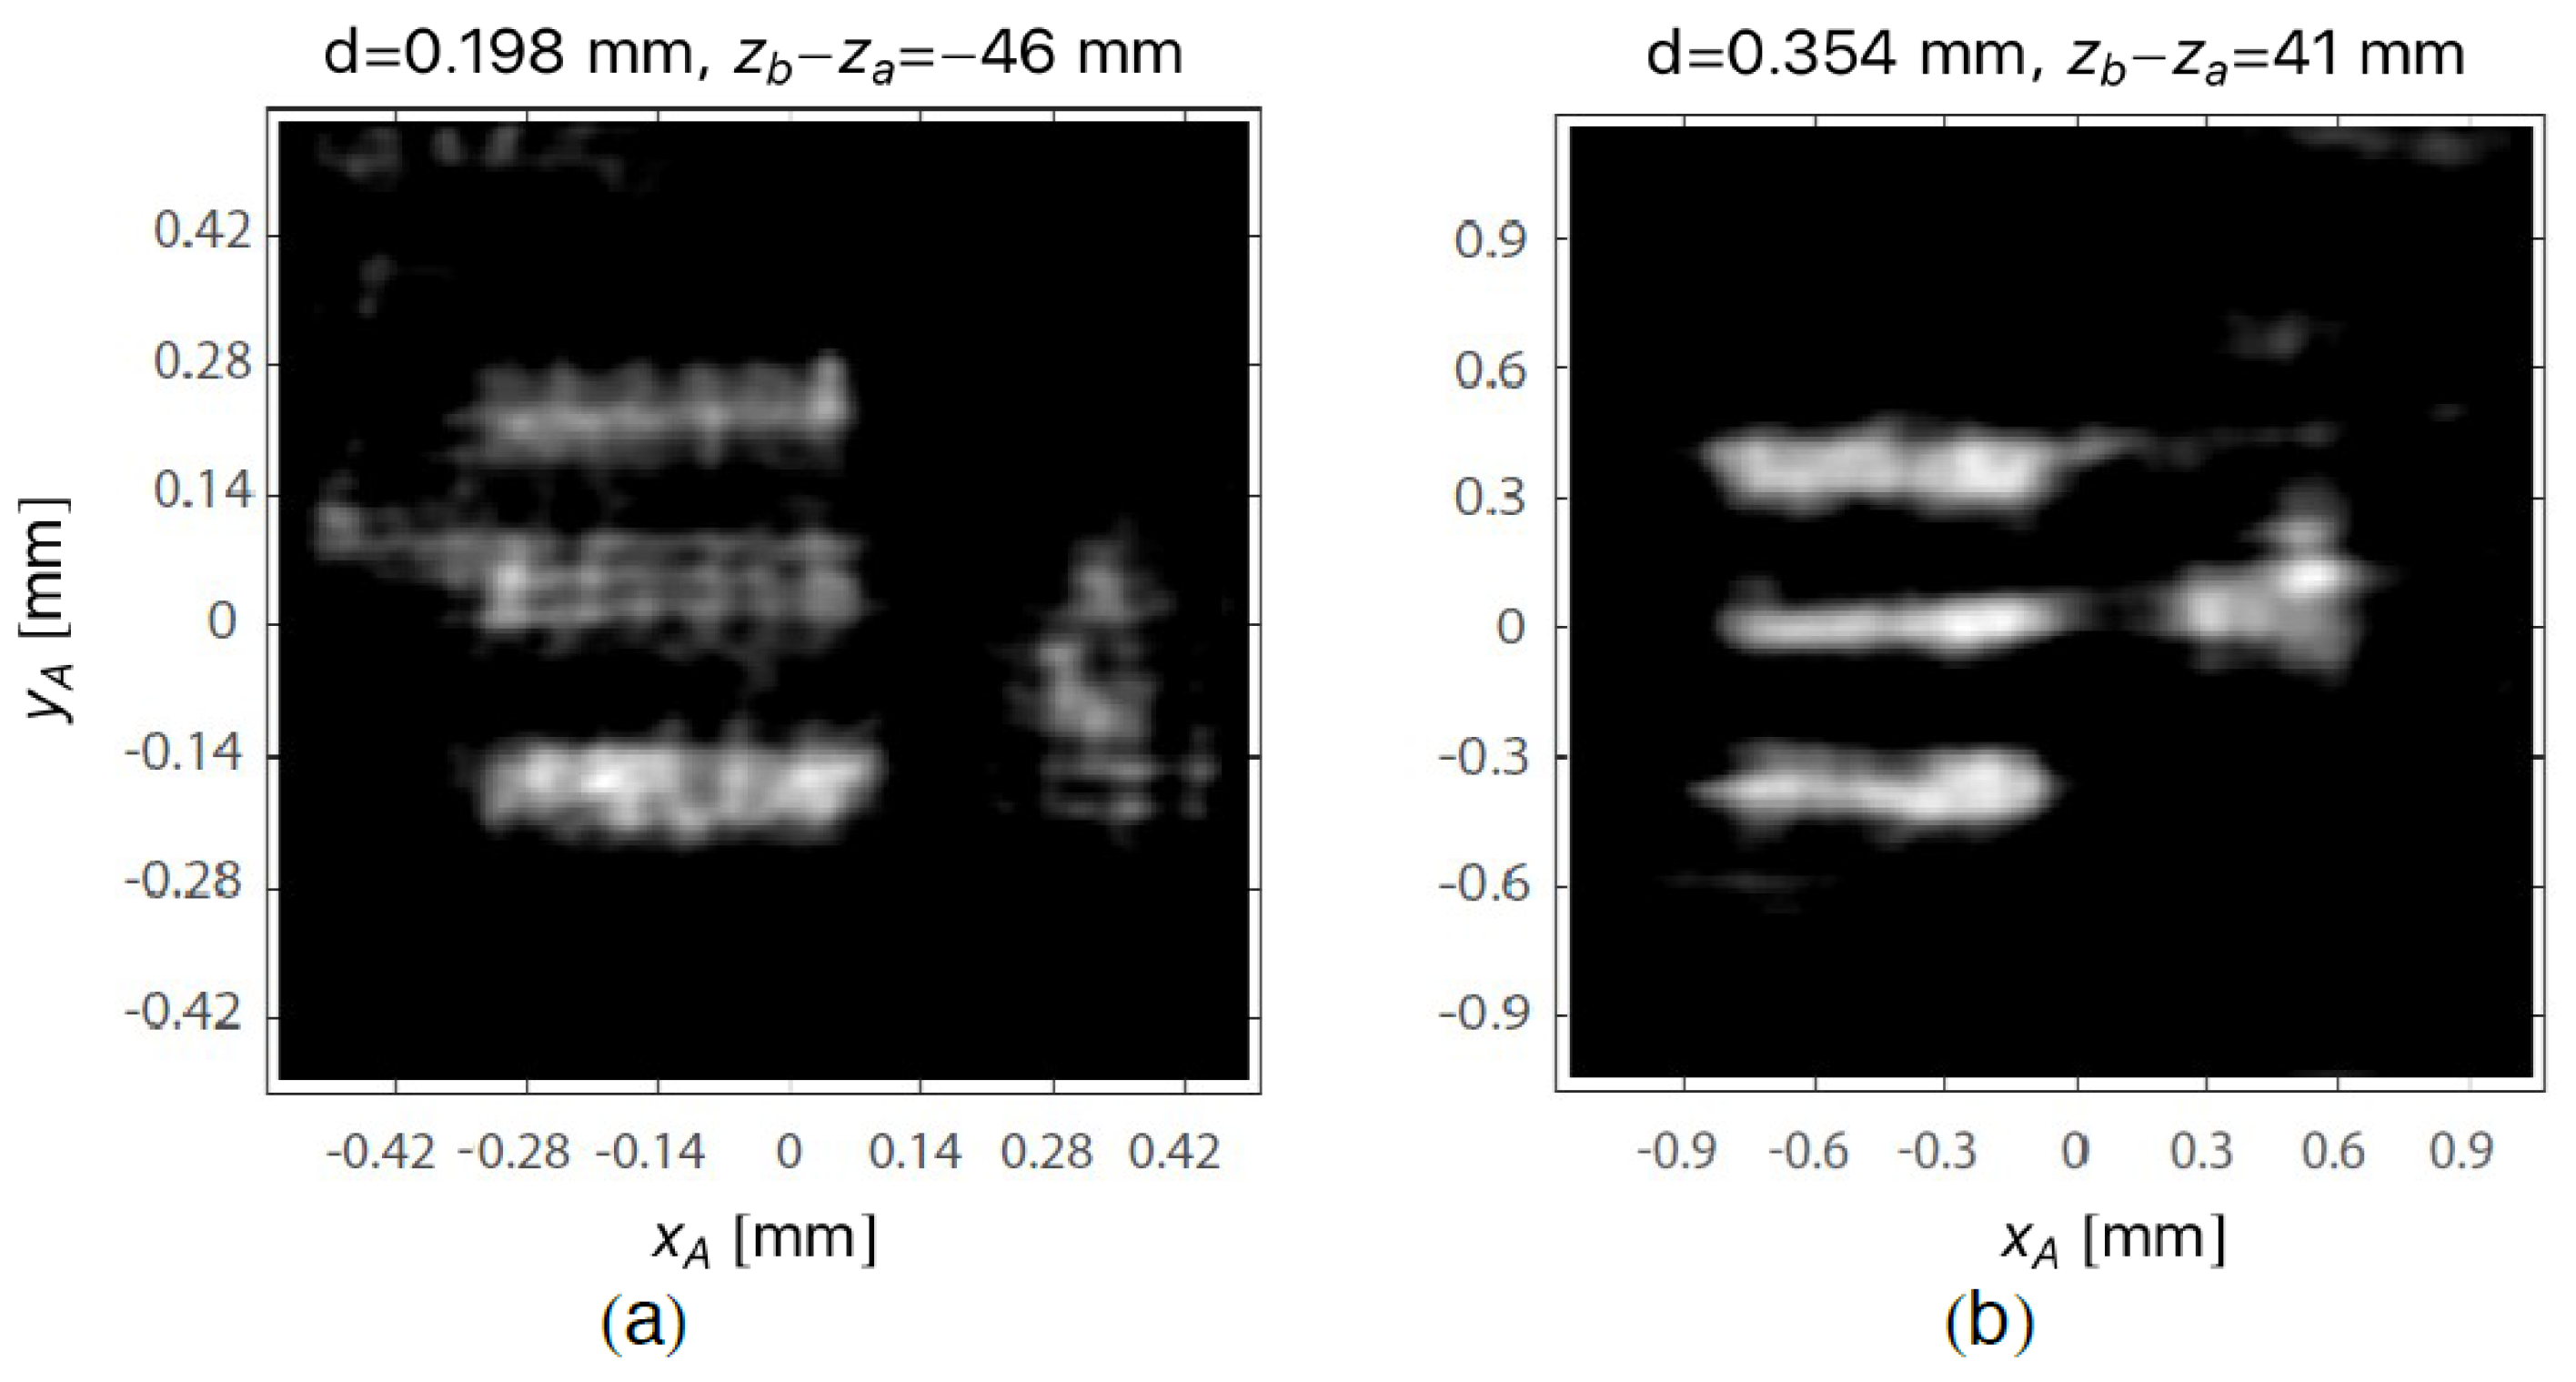
5.2. Depth-of-Field Improvement

Let us compare the depth of field of CPI with entangled photons with the one of PI and SI devices, following the same strategy as in Section 2.3, namely by evaluating the visibility of the images of a double-slit mask having width a and center-to-center distance d = 2 a , as retrieved at different axial positions z b , The minimum resolved distance d is defined as the one at which the visibility of the slits image falls below 10%.
In Figure 14a, we plot the minimum resolved distance d, as a function of the defocusing parameter z b z b F , for ghost imaging (orange), plenoptic imaging with N u = 3 (green) and CPI (blue). In all cases, we choose the same numerical aperture ( NA = 0.3 ). CPI clearly enables refocusing in a wider range than both standard imaging (SI) and standard plenoptic imaging (PI) without losing the high resolution of the focused image. Points A and B correspond to the examples shown in Figure 14b. In case A, the slit distance and z b are chosen to be very close to the boundary of the CPI refocusing range: both SI and PI are completely out-of-focus, while CPI still partially resolves the object. Point B lies outside the PI refocusing range but well below the CPI limits, and the refocused image thus appears to be well-resolved. Interference effects in the simulated results of Figure 14b are due to the coherent nature of CPI.

6. Conclusions

We have reviewed the basic principles and most relevant implementations of correlation plenoptic imaging, while focusing both on the improvement with respect to standard plenoptic imaging and the comparison among different CPI strategies. Unlike standard plenoptic imaging, CPI has no constraints on image resolution, which stays diffraction limited as in standard imaging systems. At the same time, CPI enables increasing the DOF well beyond the typical values of standard imaging, as reported in Figure 7 and Figure 14. The results are unchanged for reflective and transmissive samples. CPI is also expected to work with different kinds of sources, of either photons or particles [77], provided they are characterized by correlation in both position and momentum [61,78].
CPI is promising for both microscopy and 3D imaging, due to its ability to decouple transverse and axial resolutions, to achieve high DOF, and to acquire multiperspective images with a single device. In the future, we will employ both hardware (fast CMOS, smart sensors [79]) and software (compressed-sensing and sparse measurement techniques [80]) solutions to optimize the acquisition time and regain the single-shot advantage of conventional plenoptic imaging. Moreover, we will investigate the potential of the intrinsically coherent nature of CPI, to achieve superresolution and perform tasks, like wavefront sensing, in which quantum state estimation techniques [81,82], based on the reconstruction of the coherence function of light, have already proved to be effective.

7. Patents

  • Device and process for the plenoptic capture of images, request n. 102016000027106 of 15 March 2016 to the Italian Patent Office (approved); extension request n. EP17160543.9 of 13 March 2017 to the European Patent Office (pending); inventors: Milena D’Angelo, Augusto Garuccio, Francesco V. Pepe, Teresa Macchia, Ornella Vaccarelli.
  • Device and process for the contemporary capture of standard and plenoptic images, request n. PCT/IB2017/055842 of 26 September 2017 to the International Searching Authority (pending); inventors: Milena D’Angelo, Augusto Garuccio, Francesco V. Pepe, Ornella Vaccarelli.
  • Device and process for the acquisition of microscopic plenoptic images with turbulence mitigation, request n. 102018000007857 of 3 August 2018 to the Italian Patent Office (pending); inventors: Milena D’Angelo, Francesco Di Lena, Augusto Garuccio, Francesco V. Pepe, Alessio Scagliola.

Author Contributions

F.V.P. and F.D.L. have written the paper; F.V.P. has reviewed it based on comments from Editors and referees. A.G. and M.D. have reviewed and integrated the paper. All authors are co-authors of the research articles on which this review is based.

Funding

This activity is funded by an Istituto Nazionale di Fisica Nucleare (INFN) through the project PICS and QUANTUM, and Italian Ministry of Education, University and Research (MIUR), Projects No. PONa3_00369 and No. PON02-00576-3333585.

Acknowledgments

We thank Giuliano Scarcelli for contributing to the research papers on which this review is based. We thank Aldo Mazzilli and Eitan Edrei for collaboration on the experimental data collection and analysis, and Ornella Vaccarelli for contribution to the theory of the setup described in Section 4.

Conflicts of Interest

The authors declare no conflict of interest.

Abbreviations

The following abbreviations are used in this manuscript:
PIplenoptic imaging
DOFdepth of field
NANumerical Aperture
CPIcorrelation plenoptic imaging
SPDCspontaneous parametric down-conversion
SNRsignal-to-noise ratio
GIghost imaging
BSbeam splitter
PSFpoint-spread function
SIstandard imaging
FWHMfull width at half-maximum
SymbolMeaning
Γ Transverse correlation function
AAperture function of the object
S Transverse intensity profile of the chaotic light source
Σ Incoherent image function
PLens pupil function
F Transverse amplitude profile of the laser pump in SPDC

Appendix A. Theoretical Background of of CPI with Chaotic Light

The second-order correlation between the intensities at two points of sensors D a and D b , is described by the Glauber four-point correlation function [83]
G ( 2 ) ( ρ a , ρ b ; t a , t b ) = E a ( ) ( ρ a , t a ) E b ( ) ( ρ b , t b ) E b ( + ) ( ρ b , t b ) E a ( + ) ( ρ a , t a ) ,
where ρ i = ( x i , y i ) is the coordinate on the detector D i (with i = a , b ), t i is the time at which the signal at D i is detected, and E i ( ± ) are the components of the electric field, related by E ( + ) = ( E ( ) ) , with positive and negative frequencies, respectively. We use the scalar approximation for the electric field because, in our setup, light has either a spatial structure independent of polarization or a fixed polarization. In Equation (A1), the expectation value is taken over the quantum state of the source (i.e., O = Tr ( ϱ O ) ). The transfer functions g i ( ρ , k ) relates the fields at ρ i to the modes k of the field emitted by the source [84], which is
E i ( + ) ( ρ i , t i ) = C d ω d κ a k e i ω t i g i ( ρ i , k ) .
In the above equation, ω = c | k | is the frequency of the mode k , κ its transverse momentum, and a k is the mode annihilation operator, which, together with the creation operator a k , satisfies the canonical commutation relation [ a k , a k ] = δ k , k ; C is an irrelevant constant. In the paraxial approximation, the longitudinal component k z of the wave vector is such that ω c k z . For stationary and quasi-monochromatic sources, characterized by a central frequency ω 0 , the combination of Equations (A2) and (A1) leads to non-vanishing expectation values a k 1 a k 2 a k 3 a k 4 only if | k g | ω 0 / c for i = 1 , , 4 . In this case, the Glauber four-point function in Equation (A1) depends only on the time difference τ = t a t b . Moreover, the correlation function becomes the product of a time-dependent and a space-dependent part. If the source is chaotic, the correlation function is made of two terms [62]
a k 1 a k 2 a k 3 a k 4 δ ( k 1 k 4 ) δ ( k 2 k 3 ) + δ ( k 1 k 3 ) δ ( k 2 k 4 ) ,
which are related to the bosonic symmetrization of two-photon states. Notice that the above result strictly holds for an indefinitely extended and flat chaotic source. If the source is characterized by a nontrivial amplitude profile, we can still keep the result (3) and insert the information on the spatial modulation in the propagators. Hence, if one neglects the time dependence by only considering detection time differences ( τ ) which are much smaller than the source coherence time, the correlation function in Equation (A1), as evaluated for a stationary, quasi-monochromatic and chaotic source, reads
G ( 2 ) ( ρ a , ρ b ) = I a ( ρ a ) I b ( ρ b ) + Γ ( ρ a , ρ b ) ,
where the first term is the product average of intensities:
I i ( ρ i ) = d κ | g i ( ρ i , κ ) | 2
at the pixel located in ρ i of the sensor D i ; notice that the frequency dependence has been dropped in the transfer functions g i . The second term
Γ ( ρ a , ρ b ) = d κ g a ( ρ a , κ ) * g b ( ρ b , κ ) 2
represents the nontrivial part of the second-order correlation, which can be used to encode either standard or plenoptic imaging properties.
In order to unveil such properties, we first need to compute the transfer functions g a and g b . To this end, we use the paraxial Gaussian propagator [84].
G ( ρ , z ; ω ) = G ( ρ ) ω c z h ( ω , z ) ,
with
G ( ρ ) [ β ] = exp i 2 β ρ 2 , h ( ω , z ) = i ω 2 π c z e i ω c z ,
and treat the source as an emitter of paraxial waves. In arm a, light propagates in free space from the source to the detector D a . Hence, the corresponding transfer function is
g a ( ρ a , κ ) = h ( ω 0 , z a ) d ρ s f ( ρ s ) e i κ · ρ s G ( ρ a ρ s ) ω 0 c z a = C a ( ρ a , z a ) d ρ s f ( ρ s ) e i κ ω 0 c z a ρ a · ρ s G ( ρ s ) ω 0 c z a ,
where f ( ρ s ) is the source amplitude profile, and
C a ( ρ a , z a ) = h ( ω 0 , z a ) G ( ρ a ) ω 0 c z a .
Computation of the field propagator g b requires additional integration on both the object and the lens plane, namely:
g b ( ρ b , κ ) = h ( ω 0 , z b ) h ( ω 0 , S o z b ) h ( ω 0 , S i ) d ρ s f ( ρ s ) e i κ · ρ s d ρ o G ( ρ o ρ s ) ω 0 c z b A ( ρ o ) × d ρ G ( ρ ρ o ) ω 0 c ( S o z b ) L ( ρ ) G ( ρ b ρ ) ω 0 c S i ,
where A ( ρ o ) and L ( ρ ) are the transmission functions of the object and the lens, respectively. Henceforth, we shall assume that the finite size of the lens L b is irrelevant for propagation in arm b, and approximate its transmission function with the Gaussian phase shift G ( ρ ) [ ω 0 / c F ] , thus neglecting the pupil function. This assumption is justified by the fact that the spot on the lens is limited by the size of both the source and the transmissive part of the object. If light falls outside the lens pupil, the finite size of L b must be taken into account. Assuming that the distance from the source to the lens ( S o ) and from the lens to the detector ( S i ) are conjugate (i.e., 1 / S i + 1 / S o = 1 / F ), the propagator in arm b reads
g b ( ρ b , κ ) = C b ( ρ b , z b ) d ρ s d ρ o f ( ρ s ) A ( ρ o ) G ( ρ s ) ω 0 c z b e i κ · ρ s i ω 0 c z b ρ o · ρ s + ρ b M ,
where M = S i / S o is the lens magnification and
C b ( ρ b , z b ) : = h ( ω 0 , z b ) h ( ω 0 , S i ) S o z b e i ω 0 c ( S o z b ) G ( ρ a ) ω 0 c S i 1 S o z b M z b .
Given the propagators of Equations (A9) and (A12), it is now straightforward to compute the correlation function of Equation (A4). In particular, the intensities at the detectors, as defined in Equation (A5), are given by:
I a ( ρ a ) = K a ( z a ) d ρ s S ( ρ s ) ,
with S = | f | 2 the intensity profile of the source, K j = | 2 π C j | 2 , and
I b ( ρ b ) = K b ( z b ) d ρ s S ( ρ s ) A ˜ ω 0 c z b ρ s + ρ b M 2
with A ˜ ( κ ) = d ρ o A ( ρ o ) e i κ · ρ o . Therefore, none of the intensity profiles retrieved by each sensor, encode the image of the object; actually, I a is constant in space, while the spatial distribution of I b reproduces the incoherent image of the source, with a PSF given by the squared Fourier transform of the object transmission function. The interesting part of the intensity correlation function (A6), which determines the plenoptic properties of the setup, reads
Γ ( z a , z b ) ( ρ a , ρ b ) = K a ( z a ) K b ( z b ) d ρ o d ρ s A ( ρ 0 ) S ( ρ s ) G ( ρ s ) ω 0 c 1 z b 1 z a e i ω 0 c z b ρ o z b z a ρ a · ρ s + ρ o · ρ b M 2 ;
here, the notation has been slightly enhanced to highlight the dependence of Γ on the distances z a and z b .

Appendix B. Theoretical Background of CPI with Entangled Photos

Let us consider the quantum state of radiation described by the wave function in Equation (25). Here, for the sake of simplicity, we are assuming that SPDC radiation to be degenerate. However, the result that will be discussed in this section admit an immediate generalization to the non-degenerate case [43,44]. Without loss of generality, we will also approximate the source as monochromatic, and consequently neglect the time dependence of the correlation function. The commutation relations [ a k , a k ] = 0 and [ a k , a k ] = δ ( k k ) and the inversion symmetry h tr ( κ ) = h tr ( κ ) are useful to evaluate the spatial part of the two-photon correlation function, yielding
Γ ( ρ a , ρ b ) = d κ a d κ b g a ( ρ a , κ a ) g b ( ρ b , κ b ) h tr ( κ a + κ b ) 2 ,
up to irrelevant constants. This result entails a strong coupling between the two distant sensors D a and D b , deriving from by the entanglement in momentum characterizing SPDC biphotons.
Let us now evaluate the propagators in the two arms of the setup depicted in Figure 12; we shall assume for simplicity the lenses to be diffraction-limited and propagation is paraxial. The propagator associated with arm a of the setup reads
g a ( ρ a , κ a ) = C a ( z a , z a ) d ρ s d ρ e i κ a · ρ s G ( ρ ρ s ) Ω c z a G ( ρ ) Ω c f G ( ρ a ρ ) Ω c z a = C a ( z a , z a ) G ( ρ a ) Ω c 1 z a ζ ( z a , z a ) z a 2 d ρ s e i κ a · ρ s G ( ρ s ) Ω c z a 1 ζ ( z a , z a ) z a e i Ω ζ ( z a , z a ) c z a z a ρ s · ρ a ,
where
ζ ( z a , z a ) = 1 z a + 1 z a 1 f 1 .
ρ s and ρ are transverse coordinates on the source and the L a planes, respectively, and C a , C a contain irrelevant constants. By indicating with A the aperture function of the object, and assuming the focusing condition of the source on D b (namely, 1 / ( z b + z b ) + 1 / z b = 1 / F ) to be satisfied, the propagator associated with arm b of the setup reads
g b ( ρ b , κ b ) = C b ( z b , z b ) d ρ s d ρ o d ρ e i κ a · ρ s A ( ρ o ) G ( ρ o ρ s ) Ω c z b G ( ρ ρ o ) Ω c z b × G ( ρ ) Ω c F G ( ρ b ρ ) Ω c z b = C b ( z b , z b ) G ( ρ b ) Ω c z b 1 1 z b 1 z b + 1 z b 1 F 1 d ρ s d ρ o e i κ a · ρ s G ( ρ s ) Ω c z b A ( ρ o ) e i Ω c z b ρ s + ρ b M · ρ o ,
where ρ o and ρ are transverse coordinates on the object and the lens L b planes, respectively, M = z b / ( z b + z b ) is the magnification of the image of the source on the sensor D b , and C b , C b contain irrelevant constants.
By inserting in Equation (A17) the Green functions given by Equations (A18)–(A20), and the laser pump profile on the SPDC crystal, as defined in Equation (26), one finds that the second order correlation function associated with signal-idler pairs from SPDC is given by the plenoptic correlation function:
Γ ( z a , z b ) ( ρ a , ρ b ) = K ( z a , z a , z b , z b ) | d ρ o A ( ρ o ) d ρ s F ( ρ s ) G ( ρ s ) Ω c 1 z b + 1 z a 1 ζ ( z a , z a ) z a e i Ω ζ ( z a , z a ) c z a z a ρ s · ρ a e i Ω c z b ρ s + ρ b M · ρ o | 2 ,
where the constant K is not relevant for imaging.

References

  1. Lippmann, G. Épreuves réversibles donnant la sensation du relief. J. Phys. Theor. Appl. 1908, 7, 821–825. [Google Scholar] [CrossRef]
  2. Adelson, E.H.; Wang, J.Y. Single lens stereo with a plenoptic camera. IEEE Trans. Pattern Anal. Mach. Intell. 1992, 14, 99–106. [Google Scholar] [CrossRef] [Green Version]
  3. Ng, R.; Levoy, M.; Brédif, M.; Duval, G.; Horowitz, M.; Hanrahan, P. Light field photography with a hand-held plenoptic camera. Comput. Sci. Tech. Rep. 2005, 2, 1–11. [Google Scholar]
  4. Broxton, M.; Grosenick, L.; Yang, S.; Cohen, N.; Andalman, A.; Deisseroth, K.; Levoy, M. Wave optics theory and 3-D deconvolution for the light field microscope. Opt. Express 2013, 21, 25418–25439. [Google Scholar] [CrossRef] [PubMed]
  5. Xiao, X.; Javidi, B.; Martinez-Corral, M.; Stern, A. Advances in three-dimensional integral imaging: Sensing, display, and applications. Appl. Opt. 2013, 52, 546–560. [Google Scholar] [CrossRef] [PubMed]
  6. Prevedel, R.; Yoon, Y.G.; Hoffmann, M.; Pak, N.; Wetzstein, G.; Kato, S.; Schrödel, T.; Raskar, R.; Zimmer, M.; Boyden, E.S.; et al. Simultaneous whole-animal 3D imaging of neuronal activity using light-field microscopy. Nat. Methods 2014, 11, 727–730. [Google Scholar] [CrossRef] [PubMed] [Green Version]
  7. Ren, M.; Liu, R.; Hong, H.; Ren, J.; Xiao, G. Fast Object Detection in Light Field Imaging by Integrating Deep Learning with Defocusing. Appl. Sci. 2017, 7, 1309. [Google Scholar] [Green Version]
  8. Dansereau, D.G.; Pizarro, O.; Williams, S.B. Decoding, calibration and rectification for lenselet-based plenoptic cameras. In Proceedings of the IEEE Conference on Computer Vision and Pattern Recognition, Washington, DC, USA, 23–28 June 2013; pp. 1027–1034. [Google Scholar]
  9. Adhikarla, V.K.; Sodnik, J.; Szolgay, P.; Jakus, G. Exploring direct 3D interaction for full horizontal parallax light field displays using leap motion controller. Sensors 2015, 15, 8642–8663. [Google Scholar] [CrossRef] [PubMed]
  10. Wanner, S.; Goldluecke, B. Globally consistent depth labeling of 4D light fields. In Proceedings of the IEEE Conference on Computer Vision and Pattern Recognition (CVPR), Providence, RI, USA, 16–21 June 2012; pp. 41–48. [Google Scholar]
  11. Levoy, M.; Ng, R.; Adams, A.; Footer, M.; Horowitz, M. Light field microscopy. ACM Trans. Gr. 2006, 25, 924–934. [Google Scholar] [CrossRef]
  12. Levoy, M.; Zhang, Z.; McDowall, I. Recording and controlling the 4D light field in a microscope using microlens arrays. J. Microsc. 2009, 235, 144–162. [Google Scholar] [CrossRef] [PubMed] [Green Version]
  13. Cheng, A.; Gonçalves, J.T.; Golshani, P.; Arisaka, K.; Portera-Cailliau, C. Simultaneous two-photon calcium imaging at different depths with spatiotemporal multiplexing. Nat. Methods 2011, 8, 139–142. [Google Scholar] [CrossRef] [PubMed] [Green Version]
  14. Abrahamsson, S.; Chen, J.; Hajj, B.; Stallinga, S.; Katsov, A.Y.; Wisniewski, J.; Mizuguchi, G.; Soule, P.; Mueller, F.; Darzacq, C.D.; et al. Fast multicolor 3D imaging using aberration-corrected multifocus microscopy. Nat. Methods 2012, 10, 60–63. [Google Scholar] [CrossRef] [PubMed] [Green Version]
  15. Quirin, S.; Peterka, D.S.; Yuste, R. Instantaneous three-dimensional sensing using spatial light modulator illumination with extended depth of field imaging. Opt. Express 2013, 21, 16007–16021. [Google Scholar] [CrossRef] [PubMed]
  16. Georgiev, T.G.; Lumsdaine, A.; Goma, S. High Dynamic Range Image Capture with Plenoptic 2.0 Camera. In Proceedings of the Frontiers in Optics 2009/Laser Science XXV/Fall 2009 OSA Optics & Photonics Technical Digest, San Jose, CA, USA, 11–15 October 2009; Optical Society of America: Washington, DC, USA, 2009; p. SWA7P. [Google Scholar] [CrossRef]
  17. Georgiev, T.G.; Lumsdaine, A. Focused plenoptic camera and rendering. J. Electron. Imaging 2010, 19, 021106. [Google Scholar]
  18. Georgiev, T.; Lumsdaine, A. The multifocus plenoptic camera. In Proceedings of the Digital Photography VIII, Burlingame, CA, USA, 24 January 2012; International Society for Optics and Photonics: Washington, DC, USA, 2012; Volume 8299, p. 829908. [Google Scholar]
  19. Goldlücke, B.; Klehm, O.; Wanner, S.; Eisemann, E. Plenoptic Cameras. In Digital Representations of the Real World: How to Capture, Model, and Render Visual Reality; Magnor, M., Grau, O., Sorkine-Hornung, O., Theobalt, C., Eds.; CRC Press: Boca Raton, FL, USA, 2015. [Google Scholar]
  20. Jin, X.; Liu, L.; Chen, Y.; Dai, Q. Point spread function and depth-invariant focal sweep point spread function for plenoptic camera 2.0. Opt. Express 2017, 25, 9947–9962. [Google Scholar] [CrossRef] [PubMed]
  21. Ng, R. Fourier slice photography. ACM Trans. Gr. 2005, 24, 735–744. [Google Scholar] [CrossRef]
  22. Liu, H.Y.; Jonas, E.; Tian, L.; Zhong, J.; Recht, B.; Waller, L. 3D imaging in volumetric scattering media using phase-space measurements. Opt. Express 2015, 23, 14461–14471. [Google Scholar] [CrossRef] [PubMed]
  23. Muenzel, S.; Fleischer, J.W. Enhancing layered 3D displays with a lens. Appl. Opt. 2013, 52, D97–D101. [Google Scholar] [CrossRef] [PubMed]
  24. Levoy, M.; Hanrahan, P. Light field rendering. In Proceedings of the 23rd Annual Conference on Computer Graphics and Interactive Techniques, New Orleans, LA, USA, 4–9 August 1996; pp. 31–42. [Google Scholar]
  25. Fahringer, T.W.; Lynch, K.P.; Thurow, B.S. Volumetric particle image velocimetry with a single plenoptic camera. Meas. Sci. Technol. 2015, 26, 115201. [Google Scholar] [CrossRef]
  26. Hall, E.M.; Thurow, B.S.; Guildenbecher, D.R. Comparison of three-dimensional particle tracking and sizing using plenoptic imaging and digital in-line holography. Appl. Opt. 2016, 55, 6410–6420. [Google Scholar] [CrossRef] [PubMed]
  27. Lv, Y.; Wang, R.; Ma, H.; Zhang, X.; Ning, Y.; Xu, X. SU-G-IeP4-09: Method of Human Eye Aberration Measurement Using Plenoptic Camera Over Large Field of View. Med. Phys. 2016, 43, 3679. [Google Scholar] [CrossRef]
  28. Wu, C.; Ko, J.; Davis, C.C. Using a plenoptic sensor to reconstruct vortex phase structures. Opt. Lett. 2016, 41, 3169–3172. [Google Scholar] [CrossRef] [PubMed]
  29. Wu, C.; Ko, J.; Davis, C.C. Imaging through strong turbulence with a light field approach. Opt. Express 2016, 24, 11975–11986. [Google Scholar] [CrossRef] [PubMed]
  30. Glastre, W.; Hugon, O.; Jacquin, O.; de Chatellus, H.G.; Lacot, E. Demonstration of a plenoptic microscope based on laser optical feedback imaging. Opt. Express 2013, 21, 7294–7303. [Google Scholar] [CrossRef] [PubMed]
  31. Raytrix GmbH. Available online: https://raytrix.de/ (accessed on 4 September 2018).
  32. Shademan, A.; Decker, R.; Opfermann, J.; Leonard, S.; Kim, P.; Krieger, A. Plenoptic cameras in surgical robotics: Calibration, registration, and evaluation. In Proceedings of the 2016 IEEE International Conference on Robotics and Automation (ICRA), Stockholm, Sweden, 16–21 May 2016. [Google Scholar]
  33. Le, H.N.; Decker, R.; Opferman, J.; Kim, P.; Krieger, A.; Kang, J.U. 3-D endoscopic imaging using plenoptic camera. In Proceedings of the Conference on Lasers and Electro-Optics, San Jose, CA, USA, 5–10 June 2016. [Google Scholar] [CrossRef]
  34. Carlsohn, M.; Kemmling, A.; Petersen, A.; Wietzke, L. 3D real-time visualization of blood flow in cerebral aneurysms by light field particle image velocimetry. Proc. SPIE 2016, 9897, 989703. [Google Scholar]
  35. Waller, L.; Situ, G.; Fleischer, J.W. Phase-space measurement and coherence synthesis of optical beams. Nat. Photonics 2012, 6, 474. [Google Scholar] [CrossRef]
  36. Georgiev, T.; Zheng, K.C.; Curless, B.; Salesin, D.; Nayar, S.K.; Intwala, C. Spatio-angular resolution trade-offs in integral photography. Rendering Tech. 2006, 2006, 263–272. [Google Scholar]
  37. Pérez, J.; Magdaleno, E.; Pérez, F.; Rodríguez, M.; Hernández, D.; Corrales, J. Super-Resolution in plenoptic cameras using FPGAs. Sensors 2014, 14, 8669–8685. [Google Scholar] [CrossRef] [PubMed]
  38. Li, Y.; Sjöström, M.; Olsson, R.; Jennehag, U. Scalable coding of plenoptic images by using a sparse set and disparities. IEEE Trans. Image Process. 2016, 25, 80–91. [Google Scholar] [CrossRef] [PubMed]
  39. D’Angelo, M.; Pepe, F.V.; Garuccio, A.; Scarcelli, G. Correlation plenoptic imaging. Phys. Rev. Lett. 2016, 116, 223602. [Google Scholar] [CrossRef] [PubMed]
  40. Pepe, F.V.; Scarcelli, G.; Garuccio, A.; D’Angelo, M. Plenoptic imaging with second-order correlations of light. Quantum Meas. Quantum Metrol. 2016, 3, 20–26. [Google Scholar] [CrossRef]
  41. Pepe, F.V.; Di Lena, F.; Garuccio, A.; Scarcelli, G.; D’Angelo, M. Correlation Plenoptic Imaging with Entangled Photons. Technologies 2016, 4, 17. [Google Scholar] [CrossRef]
  42. Pepe, F.V.; Di Lena, F.; Mazzilli, A.; Edrei, E.; Garuccio, A.; Scarcelli, G.; D’Angelo, M. Diffraction-limited plenoptic imaging with correlated light. Phys. Rev. Lett. 2017, 119, 243602. [Google Scholar] [CrossRef] [PubMed]
  43. Rubin, M.H.; Shih, Y. Resolution of ghost imaging for nondegenerate spontaneous parametric down-conversion. Phys. Rev. A 2008, 78, 033836. [Google Scholar] [CrossRef]
  44. Karmakar, S.; Shih, Y. Two-color ghost imaging with enhanced angular resolving power. Phys. Rev. A 2010, 81, 033845. [Google Scholar] [CrossRef]
  45. Aspden, R.S.; Gemmell, N.R.; Morris, P.A.; Tasca, D.S.; Mertens, L.; Tanner, M.G.; Kirkwood, R.A.; Ruggeri, A.; Tosi, A.; Boyd, R.W.; et al. Photon-sparse microscopy: Visible light imaging using infrared illumination. Optica 2015, 2, 1049–1052. [Google Scholar] [CrossRef]
  46. Brida, G.; Genovese, M.; Berchera, I.R. Experimental realization of sub-shot-noise quantum imaging. Nat. Photonics 2010, 4, 227–230. [Google Scholar] [CrossRef]
  47. Meda, A.; Losero, E.; Samantaray, N.; Scafirimuto, F.; Pradyumna, S.; Avella, A.; Ruo-Berchera, I.; Genovese, M. Photon-number correlation for quantum enhanced imaging and sensing. J. Opt. 2017, 19, 094002. [Google Scholar] [CrossRef] [Green Version]
  48. Samantaray, N.; Ruo-Berchera, I.; Meda, A.; Genovese, M. Realization of the first sub-shot-noise wide field microscope. Light Sci. Appl. 2017, 6, e17005. [Google Scholar] [CrossRef] [PubMed] [Green Version]
  49. Bennink, R.S.; Bentley, S.J.; Boyd, R.W.; Howell, J.C. Quantum and classical coincidence imaging. Phys. Rev. Lett. 2004, 92, 033601. [Google Scholar] [CrossRef] [PubMed]
  50. D’Angelo, M.; Kim, Y.H.; Kulik, S.P.; Shih, Y. Identifying entanglement using quantum ghost interference and imaging. Phys. Rev. Lett. 2004, 92, 233601. [Google Scholar] [CrossRef] [PubMed]
  51. Scarcelli, G.; Zhou, Y.; Shih, Y. Random delayed-choice quantum eraser via two-photon imaging. Eur. Phys. J. D 2007, 44, 167–173. [Google Scholar] [CrossRef] [Green Version]
  52. Kim, M.K. Principles and techniques of digital holographic microscopy. SPIE Rev. 2010, 1, 018005. [Google Scholar] [CrossRef]
  53. Zheng, G.; Horstmeyer, R.; Yang, C. Wide-field, high-resolution Fourier ptychographic microscopy. Nat. Photonics 2013, 7, 739. [Google Scholar] [CrossRef] [PubMed]
  54. Albota, M.A.; Aull, B.F.; Fouche, D.G.; Heinrichs, R.M.; Kocher, D.G.; Marino, R.M.; Mooney, J.G.; Newbury, N.R.; O’Brien, M.E.; Player, B.E.; et al. Three-dimensional imaging laser radars with Geiger-mode avalanche photodiode arrays. Lincoln Lab. J. 2002, 13, 351–370. [Google Scholar]
  55. Marino, R.M.; Davis, W.R. Jigsaw: A foliage-penetrating 3D imaging laser radar system. Lincoln Lab. J. 2005, 15, 23–36. [Google Scholar]
  56. Hansard, M.; Lee, S.; Choi, O.; Horaud, R.P. Time-of-Flight Cameras: Principles, Methods and Applications; Springer Science & Business Media: Berlin, Germany, 2012. [Google Scholar]
  57. McCarthy, A.; Krichel, N.J.; Gemmell, N.R.; Ren, X.; Tanner, M.G.; Dorenbos, S.N.; Zwiller, V.; Hadfield, R.H.; Buller, G.S. Kilometer-range, high resolution depth imaging via 1560 nm wavelength single-photon detection. Opt. Express 2013, 21, 8904–8915. [Google Scholar] [CrossRef] [PubMed]
  58. McCarthy, A.; Ren, X.; Della Frera, A.; Gemmell, N.R.; Krichel, N.J.; Scarcella, C.; Ruggeri, A.; Tosi, A.; Buller, G.S. Kilometer-range depth imaging at 1550 nm wavelength using an InGaAs/InP single-photon avalanche diode detector. Opt. Express 2013, 21, 22098–22113. [Google Scholar] [CrossRef] [PubMed]
  59. Altmann, Y.; McLaughlin, S.; Padgett, M.J.; Goyal, V.K.; Hero, A.O.; Faccio, D. Quantum-inspired computational imaging. Science 2018, 361, eaat2298. [Google Scholar] [CrossRef] [PubMed]
  60. Mertz, J. Introduction to Optical Microscopy; Roberts and Company Publishers: Englewood, CO, USA, 2010; Volume 138. [Google Scholar]
  61. D’Angelo, M.; Shih, Y. Quantum imaging. Laser Phys. Lett. 2005, 2, 567–596. [Google Scholar] [CrossRef]
  62. Valencia, A.; Scarcelli, G.; D’Angelo, M.; Shih, Y. Two-photon imaging with thermal light. Phys. Rev. Lett. 2005, 94, 063601. [Google Scholar] [CrossRef] [PubMed]
  63. Ferri, F.; Magatti, D.; Gatti, A.; Bache, M.; Brambilla, E.; Lugiato, L.A. High-resolution ghost image and ghost diffraction experiments with thermal light. Phys. Rev. Lett. 2005, 94, 183602. [Google Scholar] [CrossRef] [PubMed]
  64. Scarcelli, G.; Berardi, V.; Shih, Y. Can two-photon correlation of chaotic light be considered as correlation of intensity fluctuations? Phys. Rev. Lett. 2006, 96, 063602. [Google Scholar] [CrossRef] [PubMed]
  65. Brida, G.; Chekhova, M.; Fornaro, G.; Genovese, M.; Lopaeva, E.; Berchera, I.R. Systematic analysis of signal-to-noise ratio in bipartite ghost imaging with classical and quantum light. Phys. Rev. A 2011, 83, 063807. [Google Scholar] [CrossRef] [Green Version]
  66. Klyshko, D.N. Photons and Nonlinear Optics; Gordon and Breach Science Publishers Inc.: London, UK, 1988. [Google Scholar]
  67. Pepe, F.V.; Di Lena, F.; Garuccio, A.; D’Angelo, M. Correlation plenoptic imaging. Proc. SPIE 2017, 10333. [Google Scholar] [CrossRef]
  68. Klyshko, D.N. Effect of focusing on photon correlation in parametric light scattering. Zh. Eksp. Teor. Fiz 1988, 94, 82–90. [Google Scholar]
  69. Pepe, F.V.; Vaccarelli, O.; Garuccio, A.; Scarcelli, G.; D’Angelo, M. Exploring plenoptic properties of correlation imaging with chaotic light. J. Opt. 2017, 19, 114001. [Google Scholar] [CrossRef] [Green Version]
  70. Rubin, M.H.; Klyshko, D.N.; Shih, Y.; Sergienko, A. Theory of two-photon entanglement in type-II optical parametric down-conversion. Phys. Rev. A 1994, 50, 5122. [Google Scholar] [CrossRef] [PubMed]
  71. Rubin, M.H. Transverse correlation in optical spontaneous parametric down-conversion. Phys. Rev. A 1996, 54, 5349. [Google Scholar] [CrossRef] [PubMed]
  72. Burlakov, A.; Chekhova, M.; Klyshko, D.; Kulik, S.; Penin, A.; Shih, Y.; Strekalov, D. Interference effects in spontaneous two-photon parametric scattering from two macroscopic regions. Phys. Rev. A 1997, 56, 3214. [Google Scholar] [CrossRef]
  73. Kim, Y.H. Quantum interference with beamlike type-II spontaneous parametric down-conversion. Phys. Rev. A 2003, 68, 013804. [Google Scholar] [CrossRef]
  74. Baek, S.Y.; Kim, Y.H. Spectral properties of entangled photon pairs generated via frequency-degenerate type-I spontaneous parametric down-conversion. Phys. Rev. A 2008, 77, 043807. [Google Scholar] [CrossRef]
  75. Pittman, T.; Shih, Y.; Strekalov, D.; Sergienko, A. Optical imaging by means of two-photon quantum entanglement. Phys. Rev. A 1995, 52, R3429. [Google Scholar] [CrossRef] [PubMed]
  76. Di Lena, F.; Pepe, F.V.; Avella, A.; Ruo-Berchera, I.; Scarcelli, G.; Garuccio, A.; D’Angelo, M. Correlation plenoptic imaging with entangled photons. In Proceedings of the SPIE Quantum Technologies, Strasbourg, France, 21 May 2018; Volume 10674, p. 106740H. [Google Scholar]
  77. D’Angelo, M.; Garuccio, A.; Romano, F.; Di Lena, F.; D’Incecco, M.; Moro, R.; Regano, A.; Scarcelli, G. Toward “Ghost Imaging” with Cosmic Ray Muons. In Frontiers of Fundamental Physics and Physics Education Research; Springer: Berlin, Germany, 2014; pp. 237–247. [Google Scholar]
  78. Gatti, A.; Brambilla, E.; Bache, M.; Lugiato, L. Correlated imaging, quantum and classical. Phys. Rev. A 2004, 70, 013802. [Google Scholar] [CrossRef] [Green Version]
  79. Remondino, F.; Stoppa, D. TOF Range-Imaging Cameras; Springer: Berlin, Germany, 2016; Volume 68121. [Google Scholar]
  80. Katz, O.; Bromberg, Y.; Silberberg, Y. Compressive ghost imaging. Appl. Phys. Lett. 2009, 95, 131110. [Google Scholar] [CrossRef] [Green Version]
  81. Hradil, Z.; Řeháček, J.; Sánchez-Soto, L. Quantum reconstruction of the mutual coherence function. Phys. Rev. Lett. 2010, 105, 010401. [Google Scholar] [CrossRef] [PubMed]
  82. Stoklasa, B.; Motka, L.; Rehacek, J.; Hradil, Z.; Sánchez-Soto, L. Wavefront sensing reveals optical coherence. Nat. Commun. 2014, 5, 3275. [Google Scholar] [CrossRef] [PubMed] [Green Version]
  83. Scully, M.O.; Zubairy, M.S. Quantum Optics; Cambridge University Press: Cambridge, UK, 1997. [Google Scholar]
  84. Goodman, J.W. Introduction to Fourier Optics; Roberts and Company Publishers: Englewood, CO, USA, 2005. [Google Scholar]
Figure 1. First setup for achieving plenoptic imaging by intensity correlation measurements. Adapted with the permission from [41], copyright MDPI, 2016. The lens L b in the transmission arm of the beam splitter collects on D b the image of the chaotic source, which plays the role of the focusing element. A ghost image of the object is retrieved on the detector array D a by means of correlation measurements between the intensity fluctuations at D a and D b .
Applsci 08 01958 g001
Figure 2. Unfolded setups (Klyshko-like pictures) of ghost imaging (a) and correlation plenoptic imaging (b) with chaotic light, as referred to the focused case z a = z b . Adapted with the permission from [40], copyright Walter de Gruyter GmbH, 2016. In ghost imaging, a bucket detector collects light transmitted by the object, with neither spatial nor directional resolution. In CPI, the high-resolution detector D b enables measuring point-by-point intensity correlations between the two sensors and simultaneously reconstruct both the transmission profile of the object and the propagation direction of light from the source to the object.
Applsci 08 01958 g002
Figure 3. (a) Theoretical prediction of the correlation between the intensity fluctuations retrieved by D a and D b , as given by both Equation (2) and, in the geometrical optics limit, Equation (10). Plots have been obtained by considering the setup reported in Figure 1, with the parameters characterizing the experimental setup, in the case of a triple slit of width a and center-to-center distance d = 2 a as a transmissive object; (b) application to the data in panel (a) of the refocusing algorithm of Equation (11); (c,d) the solid (yellow) lines represent theoretical predictions obtained by integration of the data of panel (a,b), respectively, over the detector D b . In (c), we report the ghost image, while (d) shows the CPI refocused image, as obtained by Equation (12). The (blue) points represent experimental data obtained in the setup that will be discussed in Section 3 after integration of the two-dimensional images over the coordinate y a . Reproduced with the permission from [42], copyright American Physical Society, 2017.
Applsci 08 01958 g003
Figure 4. Comparison between the out-of focus ghost image of a transmissive mask (a) and three attempts (bd) of refocusing it by applying Equation (12). The distance between the source and sensor D a is z a = 50 mm , while the object is placed at z b = 75 mm , namely at 25 mm from the object plane. The source is characterized by a Gaussian intensity profile with standard deviation σ = 1 mm and wavelength λ = 500 nm . We show an image (b) refocused by using the correct value of z b , and two images (c,d) refocused at wrong distances z b = 60 mm and z b = 90 mm , respectively. Reproduced with the permission from [67], copyright 2017 Society of Photo-Optical Instrumentation Engineers.
Applsci 08 01958 g004
Figure 5. Comparison between the incoherent images (a,d,g), the coherent images from CPI (b,e,h), and the refocused images from CPI (c,f,i), for three different single-slit masks of width: a = 14 μ m = Δ x f (top panels), a = 36 μ m 2.5 Δ x f (central panels), and a = 99 μ m 7.2 Δ x f (bottom panel), where Δ x f is the diffraction-limited resolution in the focused image plane. The density plots report the correlation functions of Equations (13)–(15), normalized to their peak value. The solid (white) lines represent the size of the object, while the (white) dashed lines represent the tolerance on the blurring of the images, namely the resolution limit. The (black) dotted lines indicate the DOF limits, defined as values of the longitudinal distance at which the full width at half-maximum (FWHM) of the image increases with respect to the slit width a by the FWHM of the focused point-spread function. The setup employed for the simulation is the experimental one of Figure 10. The variations in the profile of large objects (e,f,h,i) are due to interference effects, related with the coherent nature of such images (from supplementary material of Ref. [42]). Reproduced with the permission from [42], copyright American Physical Society, 2017.
Applsci 08 01958 g005
Figure 6. Comparison between: (a) the incoherent image, (b) the coherent image from CPI, and (c) the refocused image from CPI, for a double-slit mask of width a = 14 μ m = Δ x f and slit separation d = 2 a . The density plots report the correlation functions of Equations (13)–(15), normalized to their value in x a = 0 , for any value of z b z a . The solid (white) lines represent the edges of the slits. The (black) dotted lines indicate the DOF, defined as the limits of z b z a where the visibility drops below 10 % . The images are from supplementary material, Ref. [42]. Reproduced with the permission from [42], copyright American Physical Society, 2017.
Applsci 08 01958 g006
Figure 7. Visibility of double-slit masks in the case of standard imaging (a), standard plenoptic imaging with N u = 3 (b) and CPI (c). The compared devices are characterized by the same numerical aperture of the focusing element employed in the experiment reported in Section 3. The distance d = 2 a between slits is measured in units of the focused image resolution Δ x f . Points labeled by A, B and C identify the scenarios implemented in the experiment, and the corresponding results are reported in Figure 8 and Figure 9a,b. In (c), the (white) dashed line indicates the limit of perfect refocusing, according to the geometrical prediction of Equation (16) [42]. Reproduced with the permission from [42], copyright American Physical Society, 2017.
Applsci 08 01958 g007
Figure 8. Experimental demonstration of CPI as obtained in the setup of Figure 10. The out of focus image of the object (element 3 of group 2 of a positive USAF-1951 test target) is reported in the left panel, while the refocused image is represented in the right panel. This experimental scenario, labelled by B in Figure 7, is characterized by z b z a = 21 mm . The experimental data are retrieved with a pixel size δ x = 7.2 μ m , coinciding with the resolution limit, as determined by diffraction; the effective pixel size of the refocused image is scaled by a factor z b / z a , in line with Equation (12). After correlation measurement, the uncorrelated background has been removed by combining a Gaussian low-pass filter with thresholding in the Fourier domain (experimental results originally published in Ref. [42]). Reproduced with the permission from [42], copyright American Physical Society, 2017.
Applsci 08 01958 g008
Figure 9. CPI images obtained in the experimental settings A and C of Figure 7, with the setup reported in Figure 10. The experimental data are taken with a pixel size at the diffraction limit ( δ x = 7.2 μ m ), while the refocused images are characterized by an effective pixel size scaled by a factor z b / z a , in line with Equation (12). After correlation measurement, low-pass Gaussian filtering and thresholding in the Fourier domain was applied to remove an uncorrelated background. Experimental results were originally published in supplementary material of Ref. [42]. Reproduced with the permission from [42], copyright American Physical Society, 2017.
Applsci 08 01958 g009
Figure 10. Experimental setup for the proof-of-principle demonstration of correlation plenoptic imaging with chaotic light. Adapted with the permission from [42], copyright American Physical Society, 2017. The spatial ( D a ) and the angular ( D b ) sensors are part of the same scientific complementary metal-oxide semiconductor camera (sCMOS). The additional lens L a reproduces the “ghost image plane” on sensor D a .
Applsci 08 01958 g010
Figure 11. Alternative scheme to perform CPI with chaotic light, while monitoring the object by standard imaging. The lens L b reproduces the image of the object on detector D b , thus playing the role of the focusing element. The (ghost) image of this lens is retrieved on D a by correlation measurements. Information on the direction of light from the object plane to the lens, as given by the correlation of intensity fluctuations, enables refocusing objects placed out of the conjugate plane of the object, namely at S 2 S 2 f .
Applsci 08 01958 g011
Figure 12. Scheme to perform CPI by exploiting the quantum correlations of entangled photon pairs emitted by spontaneous parametric down conversion (SPDC). Adapted with the permission from [41], copyright MDPI, 2016. The emitted photon beam is divided by a beam splitter. The reflected beam is collected, in arm a, by the lens L a of focal length f, before being detected by the high-resolution detector D a . The transmitted beam, in arm b, impinges on an object at a distance z b from the source, and is then refracted by a lens L b of focal length F toward the high-resolution detector D b . The distances z b , z b , z b between components in path b are chosen in such a way that an image of the source is formed on detector D b by the lens L b . The distances z a and z a are such that a ghost image of the object is retrieved on D a when intensity correlations with D b are measured; the ghost image is focused when the “two-photon thin-lens equation” 1 / ( z b + z a ) + 1 / z a = 1 / f is satisfied. Correlations between the intensities at the two sensors are retrieved either by coincidence counting or by software correlation of the registered intensity patterns.
Applsci 08 01958 g012
Figure 13. The unfolded version (Klyshko picture) of the setup represented in Figure 12 shows the combined focusing effect on the basis of CPI with entangled photons: on one hand, the lens L a focuses the ghost image of the object (by correlation measurement) on the detector D a ; on the other hand, the lens L b reproduces on D b the image of the source, filtered by the object transmission function. Adapted with the permission from [41], copyright MDPI, 2016. The solid and dashed lines represent two-photon amplitudes transmitted by the same object point, and eventually focused on the same pixel of D a . The dashed and dotted lines are emitted by the same source point and focused in the same pixel of D b .
Applsci 08 01958 g013
Figure 14. In (a), we plot the resolution of standard ghost imaging (SI), classical plenoptic imaging (PI) with 3 × 3 pixels for each microlens, and CPI with entangled photons, as a function of the longitudinal displacement z b z b F of the sample from the focused object plane. In (b), we simulate the images of triple slit, placed in the points A (top row) and B (bottom row) in the case of SI, PI and CPI. Reproduced with the permission from [76], copyright 2018 Society of Photo Optical Instrumentation Engineers.
Applsci 08 01958 g014

