Article

Ghost Spectroscopy with Classical Correlated Amplified Spontaneous Emission Photons Emitted by An Erbium-Doped Fiber Amplifier

by
Patrick Janassek
,
Andreas Herdt
,
Sébastien Blumenstein
and
Wolfgang Elsäßer
*
Institute of Applied Physics, Technische Universität Darmstadt, Schlossgartenstrasse 7, Darmstadt 64289, Germany
*
Author to whom correspondence should be addressed.
Appl. Sci. 2018, 8(10), 1896; https://doi.org/10.3390/app8101896
Submission received: 31 August 2018 / Revised: 27 September 2018 / Accepted: 1 October 2018 / Published: 13 October 2018
(This article belongs to the Special Issue Ghost Imaging)

Abstract

:
We demonstrate wavelength-wavelength correlations of classical broad-band amplified spontaneous emission (ASE) photons emitted by an erbium-doped fiber amplifier (EDFA) in a wavelength regime around 1530 nm. We then apply these classical correlated photons in the framework of a real-world ghost spectroscopy experiment at a wavelength of 1533 nm to acetylene ( C 2 H 2 ) reproducing the characteristic absorption features of the C-H stretch and rotational bands. This proof-of-principle experiment confirms the generalization of an ASE source concept offering an attractive light source for classical ghost spectroscopy. It is expected that this will enable further disseminating ghost modality schemes by exploiting classical correlated photons towards applications in chemistry, physics and engineering.

1. Introduction

Ghost Modalities (GM) as Ghost Imaging [1,2,3,4,5,6,7,8], Temporal Ghost Imaging [9,10,11,12], Ghost Spectroscopy [13,14,15] and Ghost Polarimetry [16] are photon correlation metrology techniques and they represent an interesting topic in quantum optics. Ghost Imaging (GI) was the first ghost modality, realized for the first time in 1995 with entangled photons generated by Spontaneous Parametric Down Conversion (SPDC) [6,13], thus twin photons in the quantum mechanical sense [6]. This quantum imaging modality exploits photon correlations for the image construction or reconstruction, where one photon of an (entangled) pair interacts with the object to be imaged and the experimentally determined correlation with the second photon yields the image, therefore it is called correlated two-photon imaging. Thus, a ghost image is obtained by correlating the light beam reflected or transmitted by an object with a highly correlated reference beam, which itself, however, had never interacted with the object [17,18]. After the experimental demonstration of classical GI in 2004 [7,19,20] it became clear that GI cannot be understood as an exclusive quantum effect based on the two-photon interference capability of entangled light. In contrast to the experimentally rather sophisticated entanglement source concept, classical GI was originally based on so-called pseudo-thermal light, generated by a spatially randomly modulated coherent laser beam (the so-called Arecchi or Martienssen lamp: a combination of a rotating diffuser and laser light) [21,22,23]. This light beam is subsequently divided by a beam splitter into two beams which are mutually highly correlated and exhibit high spatial intensity-intensity correlations with two-photon interference capability, a fact well known since the fundamental Hanbury-Brown & Twiss experiment [24]. The capability of classical thermal light to mimic entanglement properties led to numerous experimental and theoretical investigations [4,25,26,27,28,29]. Later, GI was realized with a so-called true thermal light source, a filtered neon discharge lamp [30], or even with the sun [31] as light source. In 2017, an ultra-miniaturized semiconductor-based broad-area superluminescent diode (BA-SLD) was proposed and introduced to the field as a new compact light source for classical ghost imaging having intrinsically all requirements of a GI light source [32].
Very recently, the classical GI concept based on the exploitation of spatial correlations was transferred into the spectral wavelength domain [14], thus realizing for the first time a ghost spectroscopy (GS) experiment with classical thermal photons by exploiting spectral wavelength-wavelength correlations of spectrally broad-band amplified spontaneous emission (ASE) light [33] emitted by an ultra-compact, miniaturized, optoelectronic, semiconductor-based Quantum Dot Superluminescent Diode (SLD) [14]. In the spirit of the Hanbury-Brown & Twiss experiment [24], this light showed up to exhibit a spectral second-order correlation coefficient of two, thus spectral photon bunching, one of the key requirements of GS. For the demonstration of the applicability of this SLD light source for GS with classical light, a “real-world“ absorption spectroscopy experiment had been conceived at liquid chloroform, resulting in the central second-order correlations coefficient g ( 2 ) ( τ = 0 , λ r e f ) as a function of the reference wavelength λ r e f , thus the ghost spectrum, which exhibited all the characteristic absorption fingerprints S ( λ ) of chloroform at 1214 nm [14]. This so-obtained ghost absorption spectrum has been consequently interpreted as the analogue to the ghost image, but there in the spatial domain. This first demonstration of GS with classical thermal light in analogy to GI closed a gap in the experimental photon correlation modalities. The realization of GS with thermal light has been enabled by solving the challenges of having an extremely high time resolution τ measure ( τ measure τ coherence ) for the measurements of intensity correlations of spectrally broad-band light emitted by SLDs with a coherence time τ coherence = 1 / Δ ν . Only by exploiting interferometric Two-Photon Absorption (TPA) detection [34,35] has it been possible to access the ultra-short correlation time scales in the 10-femtosecond range. The second challenge has been the difficulty to find a light source, emitting broad-band light and exhibiting the requested wavelength correlations to enable GS.
Here, we demonstrate that this concept of the exploitation of classical correlated photons in the spectral domain can be generalized to amplified spontaneous emission sources in general [36,37]. We prove this by performing a GS experiment at acetylene ( C 2 H 2 ) with amplified spontaneous emission light from a continuous-wave erbium-doped fiber amplifier (EDFA) at 1530 nm. We would like to emphasize that it is not our intention to compete with high resolution spectroscopy [38,39] but rather to demonstrate GS by exploiting spectrally correlated photons from an ASE source, thus contributing to the application and dissemination of correlated photon spectroscopy in the framework of GM or quantum technologies with classically correlated photons [40]. One advantage of our classical GS concept can be in spectroscopic applications in turbulent or turbid media in full analogy to the postulated and proven advantages of GI in turbulent media [25].
We remark that actual developments in quantum control and their applications in metrology and imaging including quantum enhanced measurements [41,42,43,44,45] reflect the topics of quantum science and technology as represented by the European flagship “Quantum manifesto” [46].

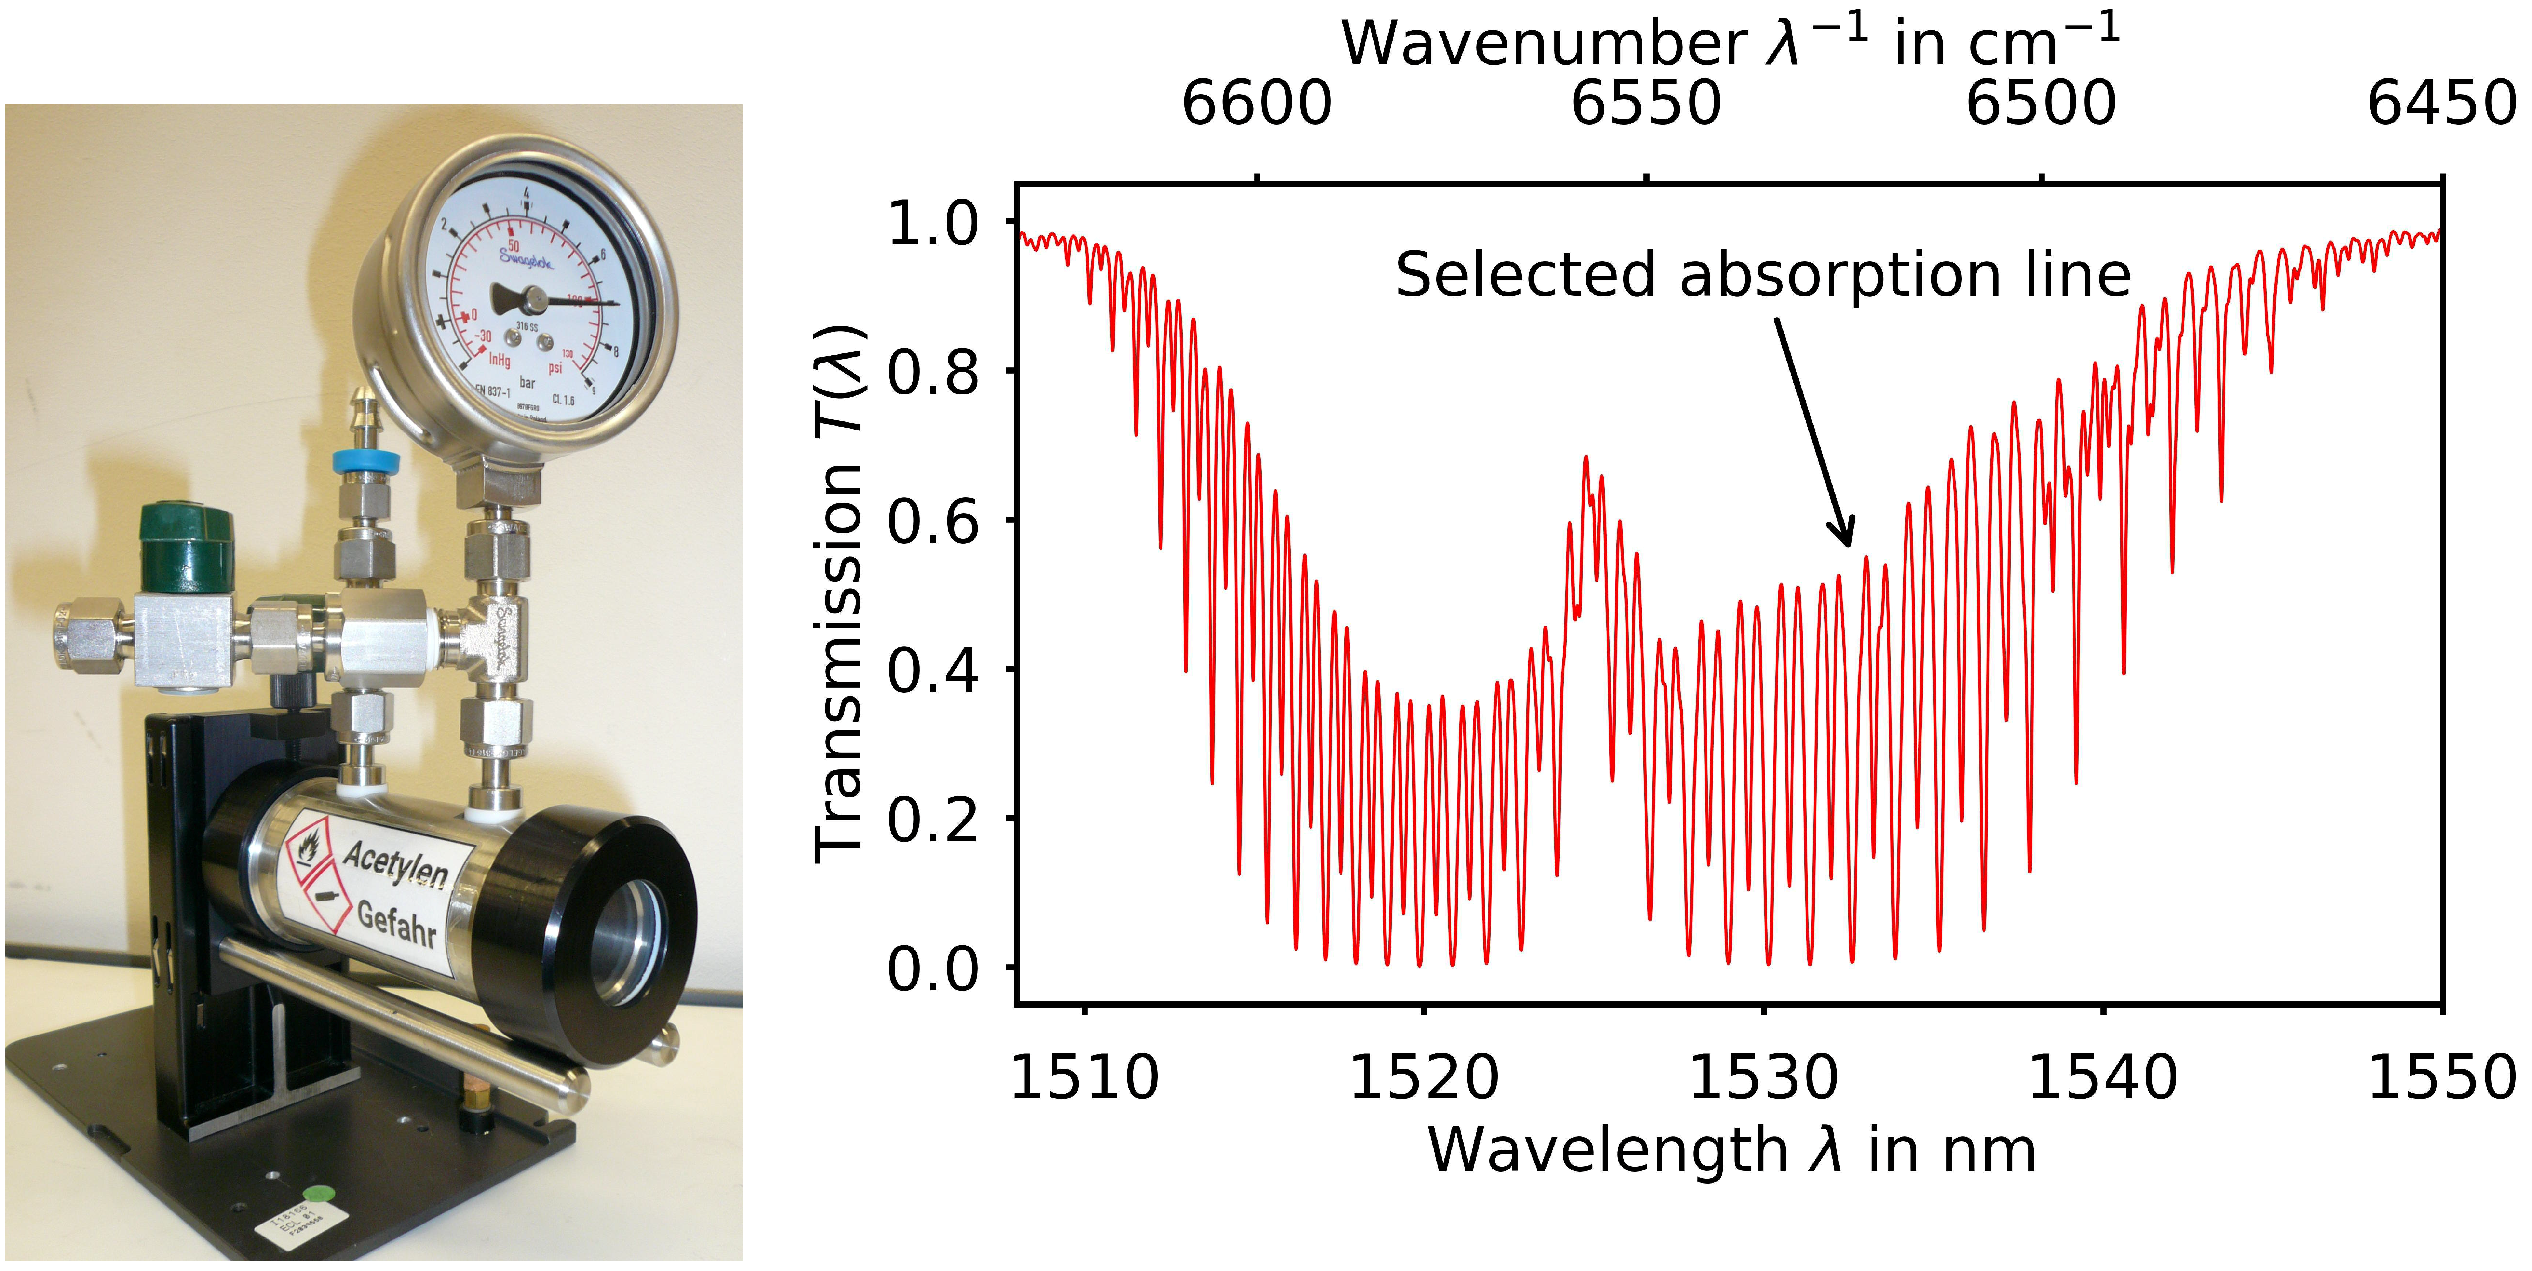
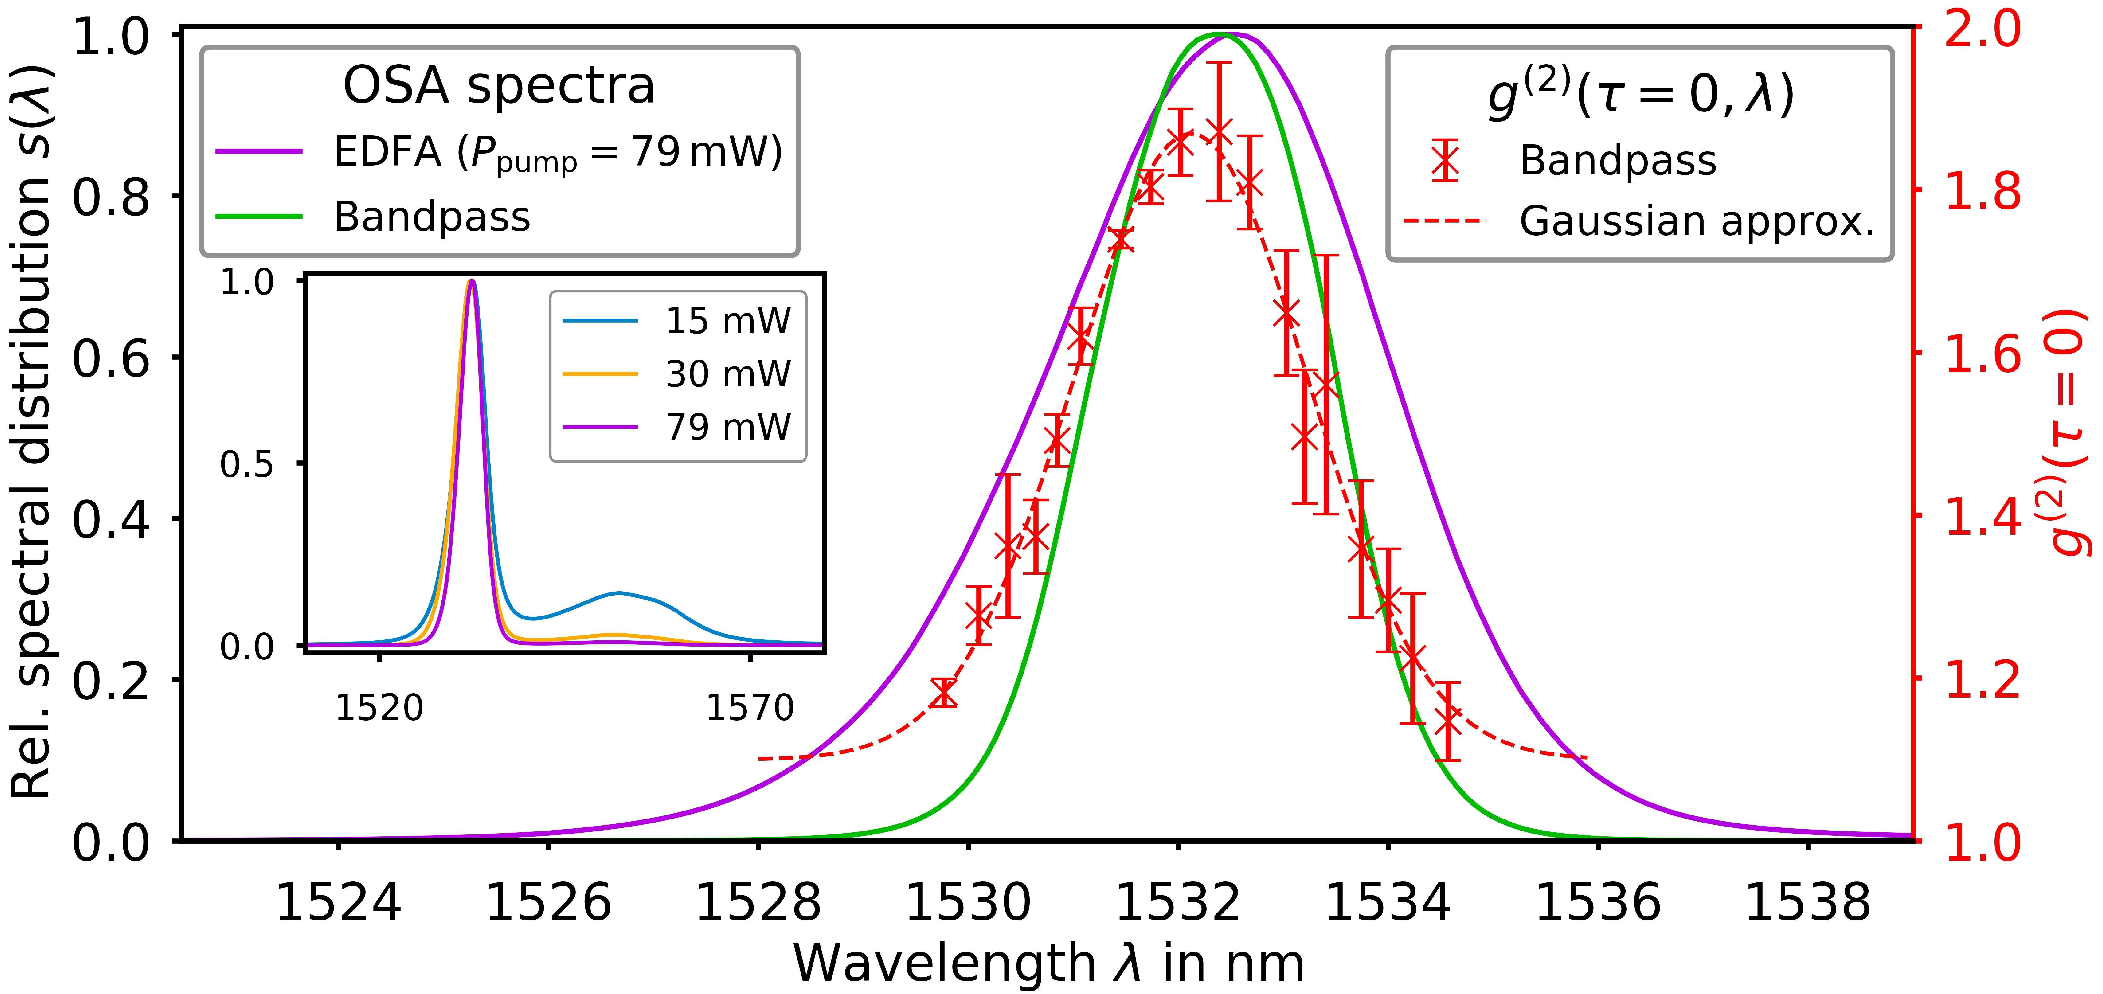
2. Experimental Setup

Figure 1 shows a schematic drawing of the experimental setup with the EDFA on the bottom right side as the GS continuous-wave (CW) light source. After collimation of its fiber output, the unpolarized light beam is subsequently linear polarized by a Glan–Thompson prism resulting in a linear horizontal polarization state. Through a beam splitter, a reference beam and an object beam are generated, respectively. The object beam light passes a gas sample cell and the total transmitted light is coupled into a single-mode fiber (SMF) serving as the spectral bucket detection branch, i.e., without any spectral resolution. In the reference beam spectral resolution can either be achieved by various, in wavelength variable tunable interference bandpass filters with a full width at half maximum (FWHM) of approximately 10 nm or by an Échelette grating if even higher resolution of up to 0.5 nm is requested. Also the reference beam is then fiber-coupled and both beams are superimposed by a fiber combiner forming an overall Mach-Zehnder-like interferometer configuration. Finally, the light is focused onto the semiconductor photocathode of a photomultiplier (PMT). The photomultiplier in use incorporates a GaAsP photocathode ( E g 2.04 eV) which has been selected regarding the source wavelengths in order to guarantee pure TPA detection. The here-employed TPA interferometry technique for the determination of g ( 2 ) ( τ ) goes back to the work of Boitier et al. [34] who demonstrated for the first time the photon bunching effect for black body sources with multiple THz wide optical spectra. The nonlinear TPA process requires two photons to be absorbed within a time frame given by the Heisenberg uncertainty. Hence ultra-fast intensity-intensity correlation detection I ( t ) I ( t ) is enabled. By implementing a time delay τ in the object arm via a variable optical delay line intensity auto-correlation measurements I ref ( t , λ ref ) I obj ( t + τ ) are performed. By reading out the photon counts from the detector output while varying the optical path of one interferometer arm using a high precision motorized linear translation stage, a TPA interferogram I T P A ( τ ) is recorded. According to theory [47], I T P A ( τ ) comprises four terms: a constant one, the non-normalized second-order auto-correlation function G ( 2 ) ( τ ) = I ( t ) I ( t + τ ) and two fast oscillating terms F 1 ( τ ) and F 2 ( τ ) following the center angular frequency ω 0 = 2 π ν 0 and the frequency duplication 2 ω 0 of the emitted light, respectively. Low-pass filtering of I TPA subsequently to an FFT allows determining G ( 2 ) ( τ ) according to
I T P A l o w p a s s ( τ ) I ref + I obj = 1 + 2 · G ( 2 ) ( τ )
Finally, the key value for GM g ( 2 ) ( τ ) , being GI or GS, respectively, is obtained according to g ( 2 ) ( τ ) = G ( 2 ) ( τ ) / G ( 2 ) ( τ τ c ) where τ c is the first order coherence time.
In order to proof the concept of correlated photon spectroscopy by exploiting amplified spontaneous emission from the EDFA source [33,36,37], we selected acetylene ( C 2 H 2 ), also called ethyne as sample gas due to the match between the emission spectrum of the EDFA and the absorption features of acetylene having an absorption band from approx. 1510 to 1540 nm based on a simultaneous excitation of symmetric and asymmetric stretch bands within the CH-groups of the molecule [48] complemented by differently strong rotational excitations leading to a total of approx. 50 strong absorption lines. Under standard pressure conditions they exhibit a FWHM smaller than 0.5 nm. By increasing the gas pressure, broadening can be achieved either by self broadening or by cross broadening, e.g., by nitrogen. For the experiment we used a gas cell also suitable for high pressure experiments as shown in Figure 2(left).
Its volume amounts to 50 mL with an optical aperture of 25 mm and an absorption length of 100 mm. The optical windows consist of calcium fluoride ( CaF 2 ) suitable for spectroscopic investigations from UV to MIR with a pressure adopted thickness of 7 mm. Standard spectroscopy investigations up to a pressure of 800 kPa showed that with increasing pressure the cross broadening leads to broader lines, however, with also decreasing absorption strength. As a compromise between absorption strength and linewidth, we have finally chosen pure acetylene with an absolute pressure of 200 kPa. This selection has been also supported by HITRAN modeling [49] (see later under GS result discussion). A typical absorption spectrum measured by a Fourier Transform Interferometer (Bruker Vertex 80v) for these conditions is shown in Figure 2 (right) depicting the complex stretch and rotational vibration spectrum with more than 50 lines including the line at 1532.84 nm finally selected to be in the center of the investigations for the GS.

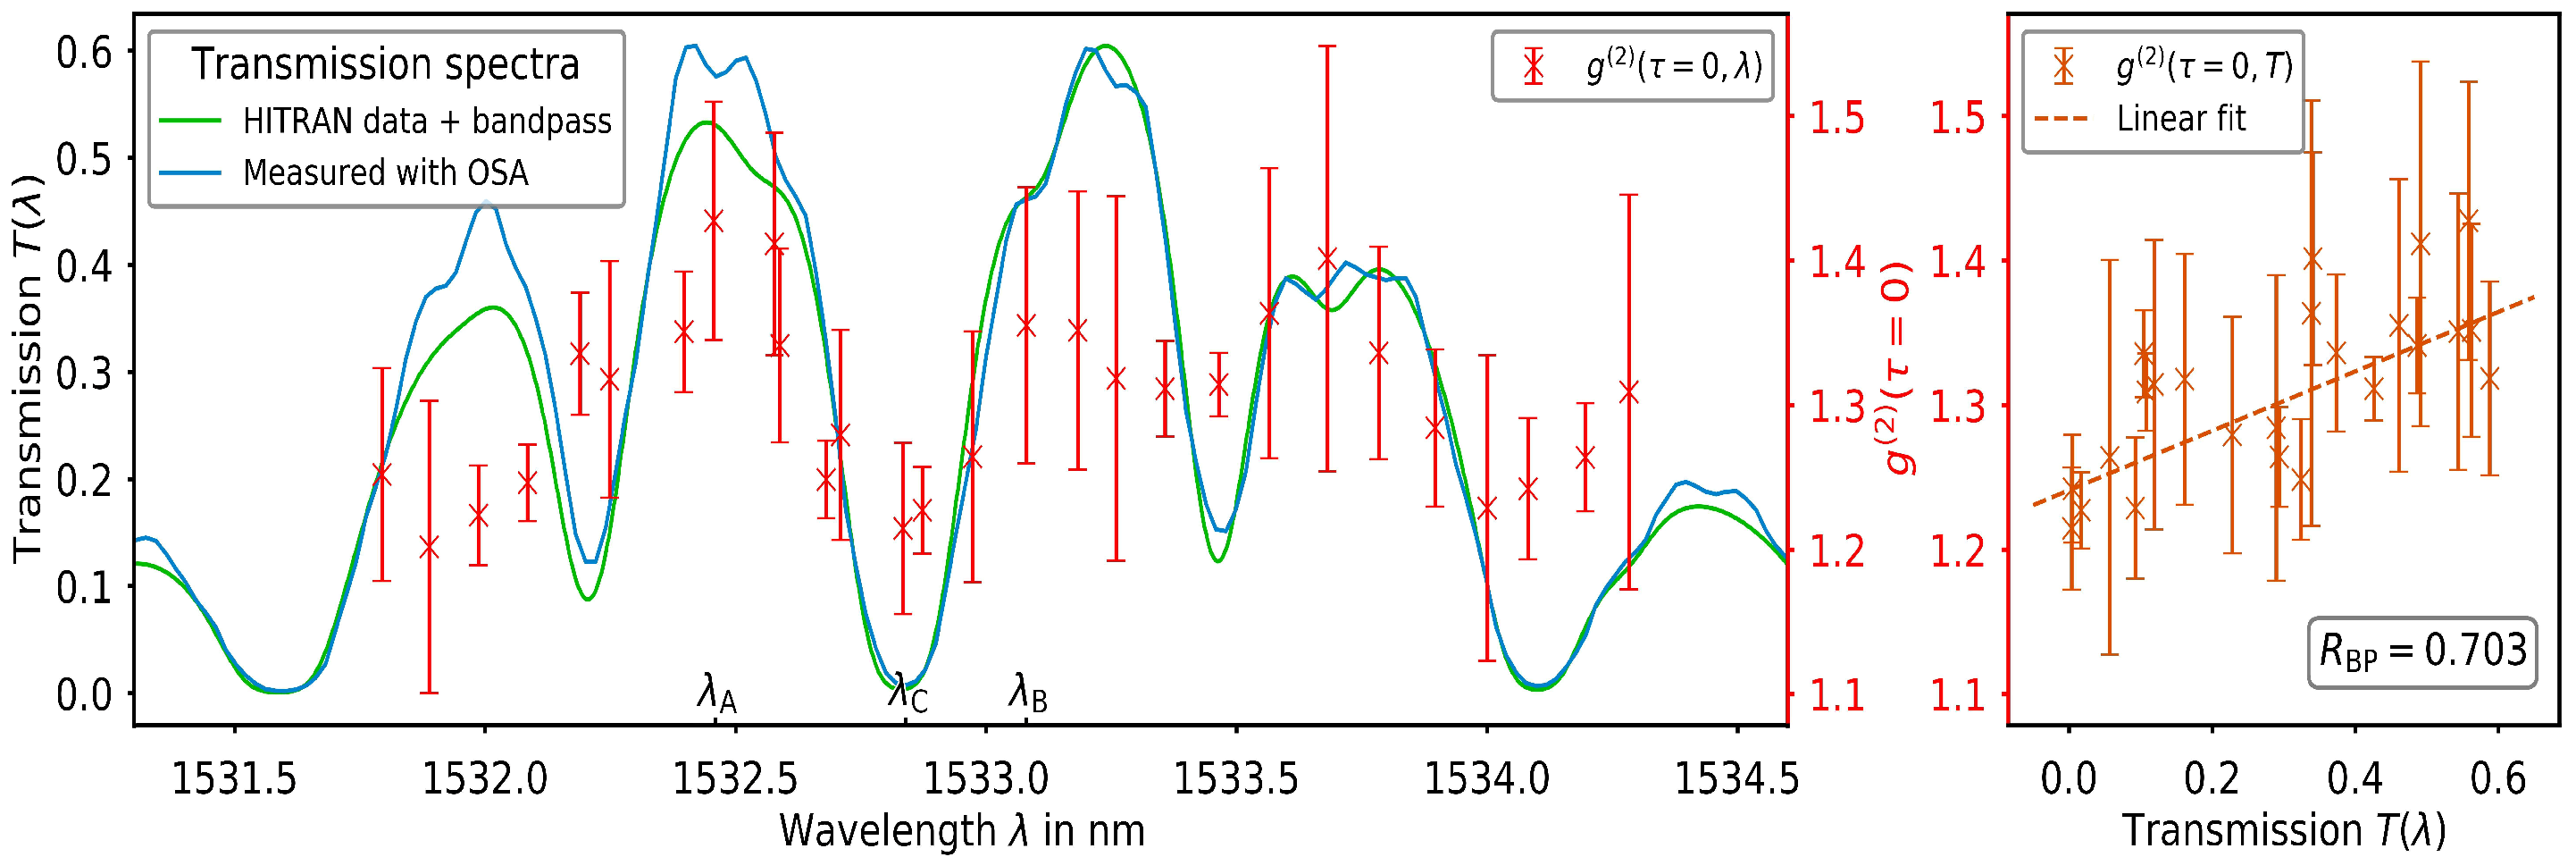
3. Experimental Results and Discussions: Frequency Correlations of Light Emitted by the EDFA and Ghost Spectrum of Acetylene

In first place, the basic requirement for a GS modality is quantified, namely the wavelength-wavelength correlations of the light source. Therefore, we exploit the broad-band ASE operation of the EDFA at an optical output power of 20 mW (corresponding to a pump power of 79 mW) resulting in a broad-band spectrum with a central wavelength of λ EDFA = 1533 nm, a FWHM of 3.8 nm and an obvious smaller tail up to 1570 nm (see Figure 3, magenta solid line).
For the investigations of the wavelength-wavelength correlations a spectral band in one interferometer arm (here the object arm) is selected by utilizing a fiber-based fixed bandpass filter with a spectral transmission as depicted by the green line in Figure 3. Its central wavelength has been set to the maximum of the ASE spectrum of λ BPF = 1532.3 nm and the spectral transmission is Gaussian-like with a FWHM of 2.5 nm. With an additional variable fiber-based band pass filter with a FWHM of 1.4 nm in the reference arm, the reference signal has been realized and wavelength-wavelength intensity correlations have been determined. These wavelength-wavelength intensity correlations g ( 2 ) ( τ = 0 , λ ) are depicted as red data points in Figure 3. A dashed red line shows a Gaussian fit to the data.
When the wavelengths of reference and object beam coincide, a maximum g ( 2 ) ( τ = 0 ) value of 1.87 is found. We find a rapid decrease of the observed g ( 2 ) ( τ ) values with increasing wavelength separation with a FWHM of 2.6 nm assuming a Gaussian shape. The g ( 2 ) ( τ = 0 ) values are going down to 1.10 in the wings at wavelengths far off by more than 4 nm with respect to the center. The characteristic FWHM of the g ( 2 ) ( τ = 0 , λ ) values is nearly equal to the convolution of the FWHM of the used interference filters. Therefore, we are convinced that the observed characteristic wavelength-wavelength correlation decay values and thus the GS resolution are not intrinsic to the exploited ASE but are actually due to the FWHM of the chosen interference filters used for the selection of the wavelengths. A theoretical description of spectral photon bunching in ASE is currently still not available [33,50,51].
For the GS experiments with the acetylene sample, the light in the object arm has been also additionally spectrally narrowed by a fiber-based spectral filter with a FWHM of 2.5 nm in order to restrict the rather broad ASE spectrum as already shown in the inset of Figure 3 for three different optical pump power conditions. The realization of a requested higher spectral resolution in the reference arm (see discussion above) has been achieved by an Échelette grating with 600 grooves / mm and a blaze wavelength of λ Blaze = 1.6 μ m (Thorlabs GR25-0616). The beam incident onto the grating has been enlarged by two cylinder lenses with focal length of f 1 = 5 cm and f 2 = 9 cm in order to achieve a higher spectral resolution by increasing the number of illuminated grating grooves yielding finally a variable Gaussian-like wavelength reference spectrum with medium F W H M = 0.49 ± 0.02 nm. In accordance with the analogy between GI and GS, we define and exploit a GS detection protocol for our experimental GS setup by starting with the GI terminology and replacing the spatial coordinate x by the spectral variable λ , such that the intensity cross-correlation coefficients are now a function of the reference-arm wavelength. By varying this reference-arm wavelength, the wavelength-dependent intensity correlations, thus the ghost spectrum has been determined according to Equation (2) in the framework of a detection protocol based on GI terminology.
g ( 2 ) ( τ = 0 , λ ref ) = I ref ( t , λ ref ) I obj ( t + τ ) t I ref ( t , λ ref ) t I obj ( t + τ ) t
We note that this detection protocol is based on the classical definition of the second-order Glauber correlation function which represents the most basic GI signal detection modality, now adapted in full analogy of GI towards GS.
Figure 4 (left) shows the ghost spectrum in terms of g ( 2 ) ( τ = 0 , λ ref ) (red data points) together with a standard absorption spectrum of acetylene (in blue). The standard spectrum as measured by a grating spectrometer (MS9710C OSA, Anritsu, Atsugi, Kanagawa Prefecture, Japan) clearly shows the central absorption feature of acetylene at λ C = 1532.84 nm. Towards larger and smaller wavelengths additional absorption lines are visible, however, with decreasing absorption strength according to the Gaussian envelope behavior due to the additional bandpass filter in the object arm as discussed above. The central g ( 2 ) ( τ = 0 , λ ) values exhibit a maximum of 1.43 at λ A = 1532.46 nm and a local maximum of 1.36 at λ B = 1533.08 nm. In between these two maximum values, i.e., at the position of the central absorption line the normalized intensity correlations decrease to a minimum value of g ( 2 ) ( τ = 0 , λ ) = 1.21 . The overall reduced second order correlation values from the maximum achievable value of two here in the spectroscopy experiment in comparison with the pure wavelength-wavelength correlation measurements (c.f. Figure 3), which there have been nearly fully observed are due to the fact that the object arm contains a wide range of uncorrelated wavelengths resulting in an overall spectral contrast reduction. This is in analogy to the spatial contrast reduction in ghost imaging when uncorrelated spatial multi-speckle contributions are superimposed in the bucket detection thus reducing the correlation signal contrast [20,52,53].
In order to evaluate the quality of the ghost spectrum and its coincidence with the real-world absorption spectroscopy results more quantitatively, the obtained GS values of g ( 2 ) τ = 0 , λ i are underlined with data from the HITRAN database [49] shown in green in Figure 4 (left). The HITRAN transmission spectrum of pure acetylene has been modeled at a pressure of 200 kPa, a temperature of 296 K and for an absorption length of 10 cm. A corrected HITRAN spectrum T ( λ ) is then obtained by multiplying the normalized emission spectrum of the EDFA with the spectral bandpass. In order to quantify the quality of the linear correlation between the values g ( 2 ) τ = 0 , λ i and the corrected HITRAN transmission strength T λ i , we make use of the Bravais-Pearson correlation coefficient R BP as defined according to [54]
R BP = i = 1 n g ( 2 ) τ = 0 , λ i g mean ( 2 ) · T λ i T ¯ i = 1 n g ( 2 ) τ = 0 , λ i g mean ( 2 ) 2 i = 1 n T λ i T ¯ 2 .
It gives a reliable measure on the confidentiality of a fit with 1 < R BP < 1 and R BP = 1 representing full correlation. The variable n represents the total number of g ( 2 ) τ = 0 , λ i values, while g mean ( 2 ) and T ¯ represent the arithmetic means of all g ( 2 ) τ = 0 , λ i and T λ i respectively. The values T λ i are the HITRAN transmission strengths for each wavelength of the corresponding g 2 0 , λ i value. The evaluation of the Bravais-Pearson correlation coefficient in our case yields R BP = 0.703 , demonstrating a good linear relationship between transmission T and g ( 2 ) , which is also visualized with the linear fit curve in the right part of Figure 4.
It can be seen that the central absorption line is nicely reproduced by the intensity correlations of the ghost spectrum. On the other hand, the weaker absorption lines and spectrally narrower side lines away from the central λ C = 1532.84 nm line are less well reproduced. Their FWHM is in the order of 0.15 nm which cannot be resolved by the 0.5 nm broad reference beams. Furthermore, towards the periphery location of the spectral distribution ( < 1532.5 nm and > 1533.5 nm) the intensity correlations show an overall decreasing tendency due to the bandpass filter (compare with Figure 3 and Ref. [14]). This deterioration of the intensity correlations is due to optical power limitations reflected in an increase in the error bars of the g ( 2 ) values exceeding 0.1, thus restricting the measurable wavelength region. A high-performance telecommunication-mature state-of-the-art EDFA with sufficiently high output power (in our case we only used a rather conservative power of up to 20 mW) would clearly much better perform in the GS investigations.
Still, the main features of the ghost spectrum clearly show the successful spectroscopic identification of a narrow absorption line of acetylene, thus demonstrating the spectrally correlated photon concept from amplified spontaneous emission from an EDFA for GS with classical photons.

4. Summary

We generalized the applicability of the amplified spontaneous emission concept of classical correlated photons from an erbium-doped fiber amplifier to GS. After the proof of the pre-requisite of wavelength-wavelength correlations in the emitted CW broad-band ASE we succeeded in performing GS with a gas sample reproducing the characteristic absorption feature of acetylene at 1532.84 nm. This is the first time that a fiber-based ASE source has been applied to GS. We expect that the highlights of the realized innovative scheme in the spirit of the ingredients of GS with classical light with particular emphasis on the conceived source and detection schemes will further stimulate new applications of GM [15] thus further fertilizing the field and allowing to develop an even deeper understanding of the experimental scheme and ghost protocols. However, we emphasize that our GS concept is still a classical one with all its benefits due to simplicity, but also its trade-offs. We truly believe that our findings will open perspectives for disseminating the ghost modality idea to enter further real-world applications [27,28] in chemistry, physics and engineering.

Author Contributions

Conceptualization, W.E., S.B. and P.J.; Methodology, W.E., S.B. and P.J.; Software, S.B. and P.J.; Validation, W.E. and A.H.; Formal Analysis, W.E.; Investigation, P.J.; Resources, W.E.; Data Curation, P.J. and A.H.; Writing-Original Draft Preparation, W.E. and A.H.; Writing-Review and Editing, all; Visualization, P.J.; Supervision, S.B.; Project Administration, W.E.; Funding Acquisition, W.E.

Funding

Deutsche Forschungsgemeinschaft (DFG) (EL105/21); Deutscher Akademischer Austauschdienst (DAAD) (Breakthroughs in Ghost Imaging).

Acknowledgments

We thank Ari T. Friberg and Goery Genty for discussions about GI modalities. We acknowledge support by the German Research Foundation and the Open Access Publishing Fund of Technische Universität Darmstadt.

Conflicts of Interest

The authors declare no conflict of interest. The founding sponsors had no role in the design of the study; in the collection, analyses or interpretation of data; in the writing of the manuscript and in the decision to publish the results.

References

  1. Simon, D.S.; Jaeger, G.; Sergienko, A.V. Quantum Metrology, Imaging, and Communication; Springer: Berlin, Germany, 2017; Chapter 6. [Google Scholar]
  2. Shapiro, J.H.; Boyd, R.W. The physics of ghost imaging. Quantum Inf. Process 2012, 11, 949–993. [Google Scholar] [CrossRef] [Green Version]
  3. Padgett, M.; Aspden, R.; Gibson, G.; Edgar, M.; Spalding, G. Ghost Imaging. Opt. Photon. News 2016, 27, 38–45. [Google Scholar] [CrossRef]
  4. Erkmen, B.I.; Shapiro, J.H. Ghost imaging: From quantum to classical to computational. Adv. Opt. Photon. 2010, 2, 405–450. [Google Scholar] [CrossRef]
  5. Padgett, M.J.; Boyd, R.W. An introduction to ghost imaging: Quantum and classical. Philos. Trans. R. Soc. A 2017, 375, 20160233. [Google Scholar] [CrossRef] [PubMed]
  6. Pittman, T.B.; Shih, Y.H.; Strekalov, D.V.; Sergienko, A.V. Optical imaging by means of two-photon quantum entanglement. Phys. Rev. A 1995, 52, R3429–R3432. [Google Scholar] [CrossRef] [PubMed]
  7. Bennink, R.S.; Bentley, S.J.; Boyd, R.W. “Two-Photon” Coincidence Imaging with a Classical Source. Phys. Rev. Lett. 2002, 89, 113601. [Google Scholar] [CrossRef] [PubMed]
  8. Zhang, D.; Zhai, Y.H.; Wu, L.A.; Chen, X.H. Correlated two-photon imaging with true thermal light. Opt. Lett. 2005, 30, 2354–2356. [Google Scholar] [CrossRef] [PubMed]
  9. Ryczkowski, P.; Barbier, M.; Friberg, A.T.; Dudley, J.M.; Genty, G. Ghost imaging in the time domain. Nat. Photon. 2016, 10, 167–170. [Google Scholar] [CrossRef]
  10. Devaux, F.; Moreau, P.A.; Denis, S.; Lantz, E. Computational temporal ghost imaging. Optica 2016, 3, 698–701. [Google Scholar] [CrossRef]
  11. Devaux, F.; Huy, K.P.; Denis, S.; Lantz, E.; Moreau, P.A. Temporal ghost imaging with pseudo-thermal speckle light. J. Opt. 2017, 19, 024001. [Google Scholar] [CrossRef]
  12. Denis, S.; Moreau, P.A.; Devaux, F.; Lantz, E. Temporal ghost imaging with twin photons. J. Opt. 2017, 19, 034002. [Google Scholar] [CrossRef] [Green Version]
  13. Scarcelli, G.; Valencia, A.; Gompers, S.; Shih, Y. Remote spectral measurement using entangled photons. Appl. Phys. Lett. 2003, 83, 5560–5562. [Google Scholar] [CrossRef]
  14. Janassek, P.; Blumenstein, S.; Elsäßer, W. Ghost Spectroscopy with Classical Thermal Light Emitted by a Superluminescent Diode. Phys. Rev. Appl. 2018, 9, 021001. [Google Scholar] [CrossRef]
  15. Amiot, C.; Ryczkowski, P.; Friberg, A.T.; Dudley, J.; Genty, G. Broadband continuous spectral ghost imaging for high resolution spectroscopy. arXiv, 2018; arXiv:1805.12424v1. [Google Scholar]
  16. Janassek, P.; Blumenstein, S.; Elsäßer, W. Recovering a hidden polarization by ghost polarimetry. Opt. Lett. 2018, 43, 883–886. [Google Scholar] [CrossRef] [PubMed]
  17. D’Angelo, M.; Shih, Y. Quantum imaging. Laser Phys. Lett. 2005, 2, 567–596. [Google Scholar] [CrossRef]
  18. Shih, Y. Quantum imaging. IEEE J. Sel. Top. Quant. Electron. 2007, 13, 1016–1030. [Google Scholar] [CrossRef]
  19. Ferri, F.; Magatti, D.; Gatti, A.; Bache, M.; Brambilla, E.; Lugiato, L.A. High-Resolution Ghost Image and Ghost Diffraction Experiments with Thermal Light. Phys. Rev. Lett. 2005, 94, 183602. [Google Scholar] [CrossRef] [PubMed] [Green Version]
  20. Gatti, A.; Bache, M.; Magatti, D.; Brambilla, E.; Ferri, F.; Lugiato, L.A. Coherent imaging with pseudo-thermal incoherent light. J. Mod. Opt. 2006, 53, 739–760. [Google Scholar] [CrossRef] [Green Version]
  21. Martienssen, W.; Spiller, E. Coherence and Fluctuations in Light Beams. Am. J. Phys. 1964, 32, 919–926. [Google Scholar] [CrossRef]
  22. Arecchi, F. Measurement of the statistical distribution of Gaussian and laser sources. Phys. Rev. Lett. 1965, 15, 912–916. [Google Scholar] [CrossRef]
  23. Arecchi, F.; Gatti, E.; Sona, A. Time distribution of photons from coherent and Gaussian sources. Phys. Lett. 1966, 20, 27–29. [Google Scholar] [CrossRef]
  24. Hanbury Brown, R.; Twiss, R.Q. Correlation between photons in two coherent beams of light. Nature 1956, 177, 27–29. [Google Scholar] [CrossRef]
  25. Meyers, R.E.; Deacon, K.S.; Shih, Y. Turbulence-free ghost imaging. Appl. Phys. Lett. 2011, 98, 111115. [Google Scholar] [CrossRef]
  26. Aspden, R.S.; Gemmell, N.R.; Morris, P.A.; Tasca, D.S.; Mertens, L.; Tanner, M.G.; Kirkwood, R.A.; Ruggeri, A.; Tosi, A.; Boyd, R.W.; et al. Photon-sparse microscopy: Visible light imaging using infrared illumination. Optica 2015, 2, 1049–1052. [Google Scholar] [CrossRef]
  27. Lugiato, L.A. Ghost Imaging: Fundamental and applicative Aspects. Istituto Lombardo (Rend. Scienze) 2013, 147, 139–148. [Google Scholar]
  28. Genovese, M. Real applications of quantum imaging. J. Opt. 2016, 18, 073002. [Google Scholar] [CrossRef] [Green Version]
  29. Brida, G.; Chekhova, M.V.; Fornaro, G.A.; Genovese, M.; Lopaeva, E.D.; Berchera, I.R. Systematic analysis of signal-to-noise ratio in bipartite ghost imaging with classical and quantum light. Phys. Rev. A 2011, 83, 063807. [Google Scholar] [CrossRef] [Green Version]
  30. Chen, X.H.; Liu, Q.; Luo, K.H.; Wu, L.A. Lensless ghost imaging with true thermal light. Opt. Lett. 2009, 34, 695. [Google Scholar] [CrossRef] [PubMed]
  31. Liu, X.F.; Chen, X.H.; Yao, X.R.; Yu, W.K.; Zhai, G.J.; Wu, L.A. Lensless ghost imaging with sunlight. Opt. Lett. 2014, 39, 2314. [Google Scholar] [CrossRef] [PubMed]
  32. Hartmann, S.; Elsäßer, W. A novel semiconductor-based, fully incoherent amplified spontaneous emission light source for ghost imaging. Sci. Rep. 2017, 7, 41866. [Google Scholar] [CrossRef] [PubMed] [Green Version]
  33. Abraham, N.; Huang, J.C.; Kranz, D.; Rockower, E.B. Amplified-spontaneous-emission intensity fluctuations. Phys. Rev. Lett. 1981, 24, 2556. [Google Scholar] [CrossRef]
  34. Boitier, F.; Godard, A.; Rosencher, E.; Fabre, C. Measuring photon bunching at ultrashort timescale by two-photon-absorption in semiconductors. Nat. Phys. 2009, 5, 267–270. [Google Scholar] [CrossRef]
  35. Hartmann, S.; Molitor, A.; Elsäßer, W. Ultrabroadband ghost imaging exploiting optoelectronic amplified spontaneous emission and two-photon detection. Opt. Lett. 2015, 40, 5770–5773. [Google Scholar] [CrossRef] [PubMed]
  36. Desurvire, E.; Simpson, J. Amplification of spontaneous emission in erbium-doped single-mode fibers. J. Lightw. Technol. 1989, 7, 835–845. [Google Scholar] [CrossRef]
  37. Desurvire, E. Erbium-Doped Fiber Amplifiers: Principles and Applications; John Wiley and Sons: New York, NY, USA, 1994. [Google Scholar]
  38. Arita, Y.; Ewart, P. Infra-red multi-mode absorption spectroscopy of acetylene using an Er/Yb:glass micro-laser. Optics Express 2008, 16, 4437–4442. [Google Scholar] [CrossRef] [PubMed]
  39. Wagner, S.; Fisher, B.; Fleming, J.; Ebert, V. TDLAS-based in situ measurement of absolute acetylene concentrations in laminar 2D diffusion flames. Proc. Combust. Inst. 2009, 32, 839–846. [Google Scholar] [CrossRef]
  40. Kalashnikov, D.A.; Paterova, A.V.; Kulik, S.P.; Krivitsky, L.A. Infrared spectroscopy with visible light. Nat. Photon. 2016, 10, 98–101. [Google Scholar] [CrossRef] [Green Version]
  41. Giovannetti, V.; Lloyd, S.; Maccone, L. Quantum-enhanced measurements: Beating the standard quantum limit. Science 2004, 306, 1330–1336. [Google Scholar] [CrossRef] [PubMed]
  42. Lee, H.; Lougovski, P.; Dowling, J. Quantum computing, metrology, and imaging. In Proceedings of the Fluctuations and Noise in Photonics and Quantum Optics III, Austin, TX, USA, 24–26 May 2005; International Society for Optics and Photonics: Bellingham, WA, USA, 2005; Volume 5842, pp. 21–32. [Google Scholar]
  43. Sete, E.A.; Svidzinsky, A.A.; Rostovtsev, Y.V.; Eleuch, H.; Jha, P.K.; Suckewer, S.; Scully, M.O. Using quantum coherence to generate gain in the XUV and X-ray: Gain-swept superradiance and lasing without inversion. IEEE J. Sel. Top. Quantum Electron. 2012, 18, 541–553. [Google Scholar] [CrossRef]
  44. Genovese, M.; Adenier, G.; Calonico, D.; Degiovanni, I.; Micalizio, S.; Berchera, I.R.; Traina, P. Overcoming classical measurement limits through entanglement in photon number: An introduction. In Proceedings of the EPJ Web of Conferences, Crete, Greece, 28 July–6 August 2014; EDP Sciences: Les Ulis, France, 2015; Volume 95, p. 03011. [Google Scholar]
  45. Degen, C.L.; Reinhard, F.; Cappellaro, P. Quantum sensing. Rev. Mod. Phys. 2017, 89, 035002. [Google Scholar] [CrossRef]
  46. De Touzalin, A.; Marcus, C.; Heijman, F.; Cirac, I.; Murray, R.; Calarco, T. Quantum Manifesto. A New Era of Technology; European Comission: Luxembourg, 2016. [Google Scholar]
  47. Boitier, F.; Godard, A.; Dubreuil, N.; Delaye, P.; Fabre, C.; Rosencher, E. Two-photon-counting interferometry. Phys. Rev. A 2013, 87, 013844. [Google Scholar] [CrossRef]
  48. Barrow, G.M. Introduction to Molecular Spectroscopy; McGraw-Hill: New York, NY, USA, 1962; Chapter 7. [Google Scholar]
  49. Gordon, I.; Rothman, L.; Hill, C.; Kochanov, R.; Tan, Y.; Bernath, P.; Birk, M.; Boudon, V.; Campargue, A.; Chance, K.; et al. The HITRAN2016 molecular spectroscopic database. J. Quant. Spectrosc. Radiat. Transf. 2017, 203, 3–69. [Google Scholar] [CrossRef]
  50. Kira, M.; Hoyer, W.; Koch, S.; Brick, P.; Ell, C.; Hübner, M.; Khitrova, G.; Gibbs, H. Quantum correlations in semiconductor microcavities. Semicond. Sci. Technol. 2003, 18, 405. [Google Scholar] [CrossRef]
  51. Friedrich, F.; Walser, R. Emission spectrum of quantum dot superluminescent diode. to be published.
  52. Kuhn, S.; Hartmann, S.; Elsäßer, W. Photon-statistics-based classical ghost imaging with one single detector. Opt. Lett. 2016, 41, 2863–2866. [Google Scholar] [CrossRef] [PubMed]
  53. Hartmann, S.; Kuhn, S.; Elsäßer, W. Characteristic properties of the spatial correlations and visibility in mixed light ghost imaging. Appl. Opt. 2016, 55, 7972–7979. [Google Scholar] [CrossRef] [PubMed]
  54. Hauke, J.; Kossowski, T. Comparison of values of Pearson’s and Spearman’s correlation coefficients on the same sets of data. Quaest. Geogr. 2011, 30, 87–93. [Google Scholar] [CrossRef]
Figure 1. Schematic diagram of the experimental setup for the ghost spectroscopy (GS) experiment: The setup comprises the amplified spontaneous emission continuous-wave light source of an erbium-doped fiber amplifier (EDFA), collimating and focusing achromatic lenses (L), a fixed linear polarizer (LP), a non-polarizing beamsplitter (BS), a fixed reflective diffraction grating (GR) followed by a movable fiber coupling unit in the reference arm, thus enabling wavelength resolution, a high pressure gas cell filled with C 2 H 2 within the object arm, again followed by a fiber coupling unit, a single-mode fiber-based combiner (FC), a motorized linear translation stage (MS), polarization controlling elements (POL), lenses for focusing the light onto the photocathode of the PMT ( H7421-50, Hamamatsu Photonics, Hamamatsu, Japan) operated in Two-Photon-Absorption (TPA) mode and a longpass filter (LPF Schott RG1000, Schott, Mainz, Germany) preventing visible light from entering the detector.
Applsci 08 01896 g001
Figure 2. Left: High pressure absorption cell for the measurements; right: Conventionally measured standard absorption spectrum of acetylene around 1530 nm with an absorption length of 10 cm and an absolute pressure of 200 kPa.
Applsci 08 01896 g002
Figure 3. Measured wavelength-wavelength correlations of light emitted by the EDFA: The full optical spectrum of the EDFA (magenta solid line) has been measured by a standard optical spectrum analyzer. The selected wavelength band is also depicted (green solid line) for direct comparison with the second-order correlation data (red crosses with a dashed line based on a Gaussian fit). The error bars correspond to the standard deviation for a set of 5 measurements. The inset shows the unfiltered EDFA spectrum for three different optical pump conditions of the EDFA.
Applsci 08 01896 g003
Figure 4. Left: Ghost spectrum of an absorption feature of acetylene ( C 2 H 2 ) at a pressure of 200 kPa around 1533 nm measured with the setup of Figure 1. Conventionally measured standard absorption spectrum of acetylene (blue, left scale), corrected HITRAN transmission (green, left scale) and ghost spectrum (red, right scale) obtained via the spectral intensity correlations. The error bars correspond to the standard deviation of a set of 5 measurements. Right: Correlation between g ( 2 ) τ = 0 , λ i and T λ i evaluated in terms of the BP correlation coefficient according to Equation (3).
Applsci 08 01896 g004

