Article

Green Synthesis of Iron Nanoparticles by Acacia nilotica Pods Extract and Its Catalytic, Adsorption, and Antibacterial Activities

1
Department of Chemistry, King Faisal University, Alahsa 31982, Saudi Arabia
2
Department of Chemistry, Faculty of Science and Technology, Al-Neelain University, Khartoum 11121, Sudan
3
Department of Biological Sciences, College of Science, King Faisal University, Alahsa 31982, Saudi Arabia
4
Department of Botany and Microbiology, College of Science, Bani-Suef University, Beni-Suef 62514, Egypt
*
Author to whom correspondence should be addressed.
Appl. Sci. 2018, 8(10), 1922; https://doi.org/10.3390/app8101922
Submission received: 7 August 2018 / Revised: 1 October 2018 / Accepted: 2 October 2018 / Published: 15 October 2018
(This article belongs to the Section Chemical and Molecular Sciences)

Abstract

:

Featured Application

The green synthesis of iron nanoparticles studied in this work could have potential environmental applications via adsorption and catalytic degradation of many pollutants such as organic dyes. Furthermore, it could be particularly suitable for applications in synthesis of antimicrobial nanoparticles.

Abstract

Iron nanoparticles (FeNP) were synthesized using Acacia nilotica seedless pods extract. The synthesized FeNP were characterized by Fourier transform infrared (FTIR), UV/Vis spectroscopy, dynamic light scattering (DLS), electron microscopy (TEM), scanning electron microscopy (SEM), energy dispersive spectroscopy (EDS), and X-ray diffraction (XRD). The XRD pattern confirmed the synthesis of crystalline phase of α-Fe2O3. EDS spectroscopy showed the presence of elemental iron and oxygen, indicating that the nanoparticles are essentially present in oxide form. UV absorption in the range of 450–550 nm confirmed the formation of FeNP. DLS indicated an average FeNP particle size of 229 nm. The synthesized FeNP was tested for adsorption and oxidation degradation of methyl orange (MO) under different conditions and found to be effective in both degradation and adsorption processes. Furthermore, the synthesized FeNP has the potential to terminate the pathogenicity of several human opportunistic pathogens; belongs to gram-negative and gram-positive bacteria and one species of Candida as well.

Graphical Abstract

1. Introduction

Iron nanoparticles have recently gained great research interest in environmental applications since it offers high surface reactivity due to high the surface area [1]. Removal of organic pollutants [2,3,4], inorganic pollutants [5,6], and pathogenic bacteria [6,7,8,9] are among the most important applications. Moreover, iron nanoparticles have been applied for the catalytic degradation of chlorinated hydrocarbons such as trichloroethene, tetrachloroethene, and carbon tetrachloride from aqueous solutions [10,11,12].
Many approaches have been reported for iron nanoparticles syntheses such as ball milling, sol-gel, high-energy electro-deposition [13], coprecipitation laser–induced gas phase pyrolysis, chemical vapor condensation, and freeze-drying [14]. Chemically, the formation of iron nanoparticles can be attained through the reduction of iron organic or inorganic salt or via reduction of an iron oxide. Iron nanoparticles have been synthesized by sodium borohydride or lithium triethylborohydride as a reducing agent [14].
Green synthesis of iron nanoparticles has attracted much attention from researchers as it decreases nanoparticles aggregation and thus improves stability. In addition, it is an environmentally friendly method of eliminating the use of sodium borohydride as a reducing agent, which is very corrosive and flammable [10]. Furthermore, using plant extracts as reducing agent offer suitability for biomedical and pharmaceutical applications since no toxic chemicals are used during synthesis [8]. Green Iron nanoparticles synthesis using plant extract is a very effective synthesis process at a very reasonable cost. Recently, many reports have discussed the successful synthesis of iron nanoparticles via green chemistry [3,4,5,8,9,11,14,15,16,17,18].
The work aims to explore the use of seedless pods of Acacia nilotica extract (ANE), shown in Figure 1a as a reducing agent for iron nanoparticles synthesis using appropriate precursors such as FeSO4·7H2O. Acacia nilotica is a tropical and subtropical tree related to Leguminosae-Mimosoideae family. It can be found in Sri Lank, Pakistan, India, Egypt, Sudan, and tropical Africa [19]. Its bark, flowers, pods, and leaves have been traditionally used to cure many diseases such as cancer, cold, cough, diarrhea, fever, dysentery, hypertension, and bleeding piles [20]. Its young seedless pods contain 18–27% of tannins, flavonoids, and minerals. It was hypothesized that the young seedless pods of Acacia nilotica may have reduction and stabilization effect during iron nanoparticles synthesis due to the presence of flavonoids and tannins [19,20]. Acacia nilotica leaves extract has been used for the synthesis of iron nanoparticles for Congo red dye degradation [21]. Furthermore, gold nanoparticles have been synthesized using leaves extract [22]. However, the seedless pods of the plant have not been reported for the synthesis of nanoparticles so far. Thus, the main goal of this study was to investigate the reduction and the stabilization effect of the seedless pods of Acacia nilotica extract (ANE) in the synthesis of iron nanoparticles (FeNP) and to investigate the FeNP in adsorption, degradation, and antibacterial applications.

2. Materials and Methods

2.1. Chemicals

Ferrous sulfate (FeSO4·7H2O) and Methyl Orange (C14H14N3SO3Na, C.I.13025) were purchased from Sigma-Aldrich, St. Louis, MO, United States. All the primary chemicals used in this work were of analytical grade. All solutions were made with deionized water. Peptone, yeast extract, and agar powder were purchased from Merk KGaA, Darmstadt, Germany. Pathogenic bacteria for antimicrobial testes was supplied by faculty of Medicine, king Faisal University, Saudi Arabia.

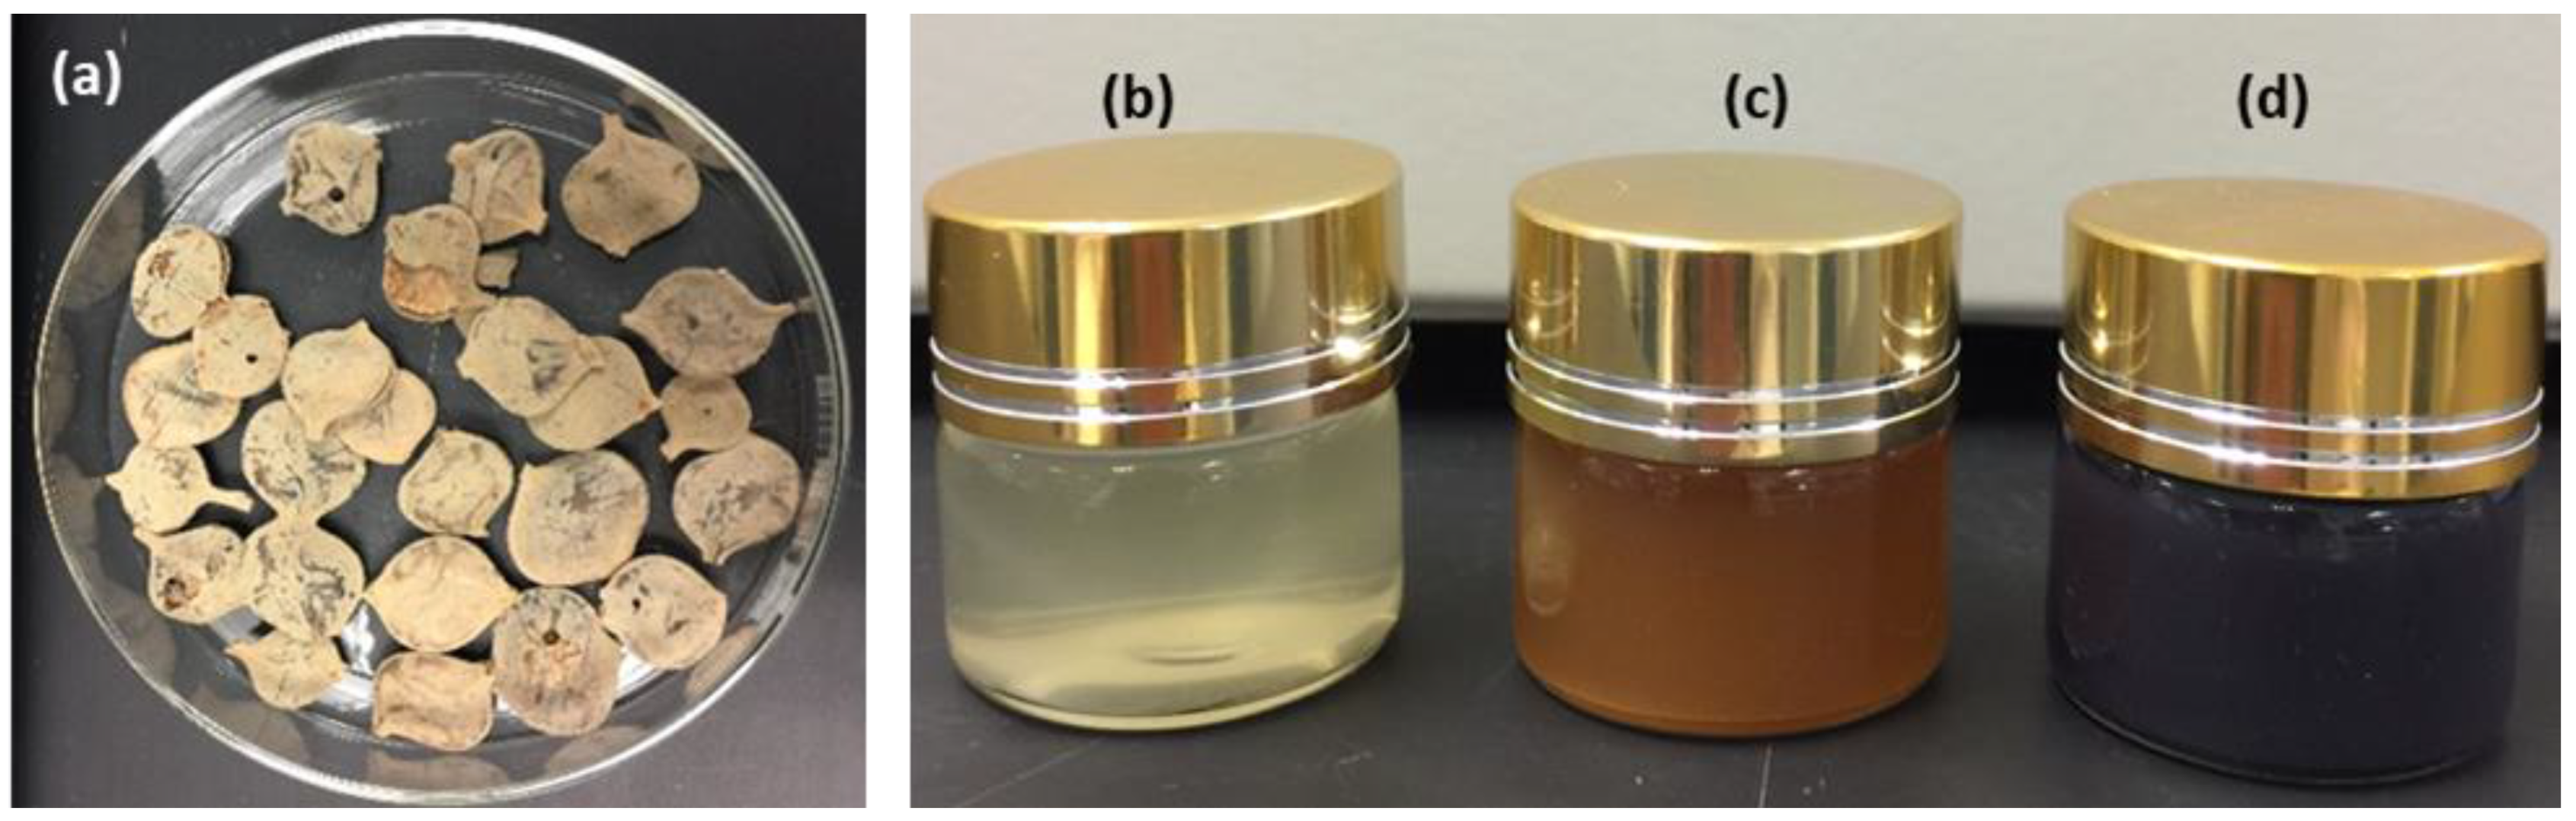
2.2. Preparation of Acacia nilotica Extract (ANE)

Acacia nilotica pods were obtained from local markets, Hofuf, Saudi Arabia. The pods were washed several times using deionized water to remove any dust, rinsed and air-dried at room temperature. 10 g of Acacia nilotica pods was taken and boiled in deionized water at 100 °C for 10 min. The extract was left overnight and then filtered using Whatman filter paper.

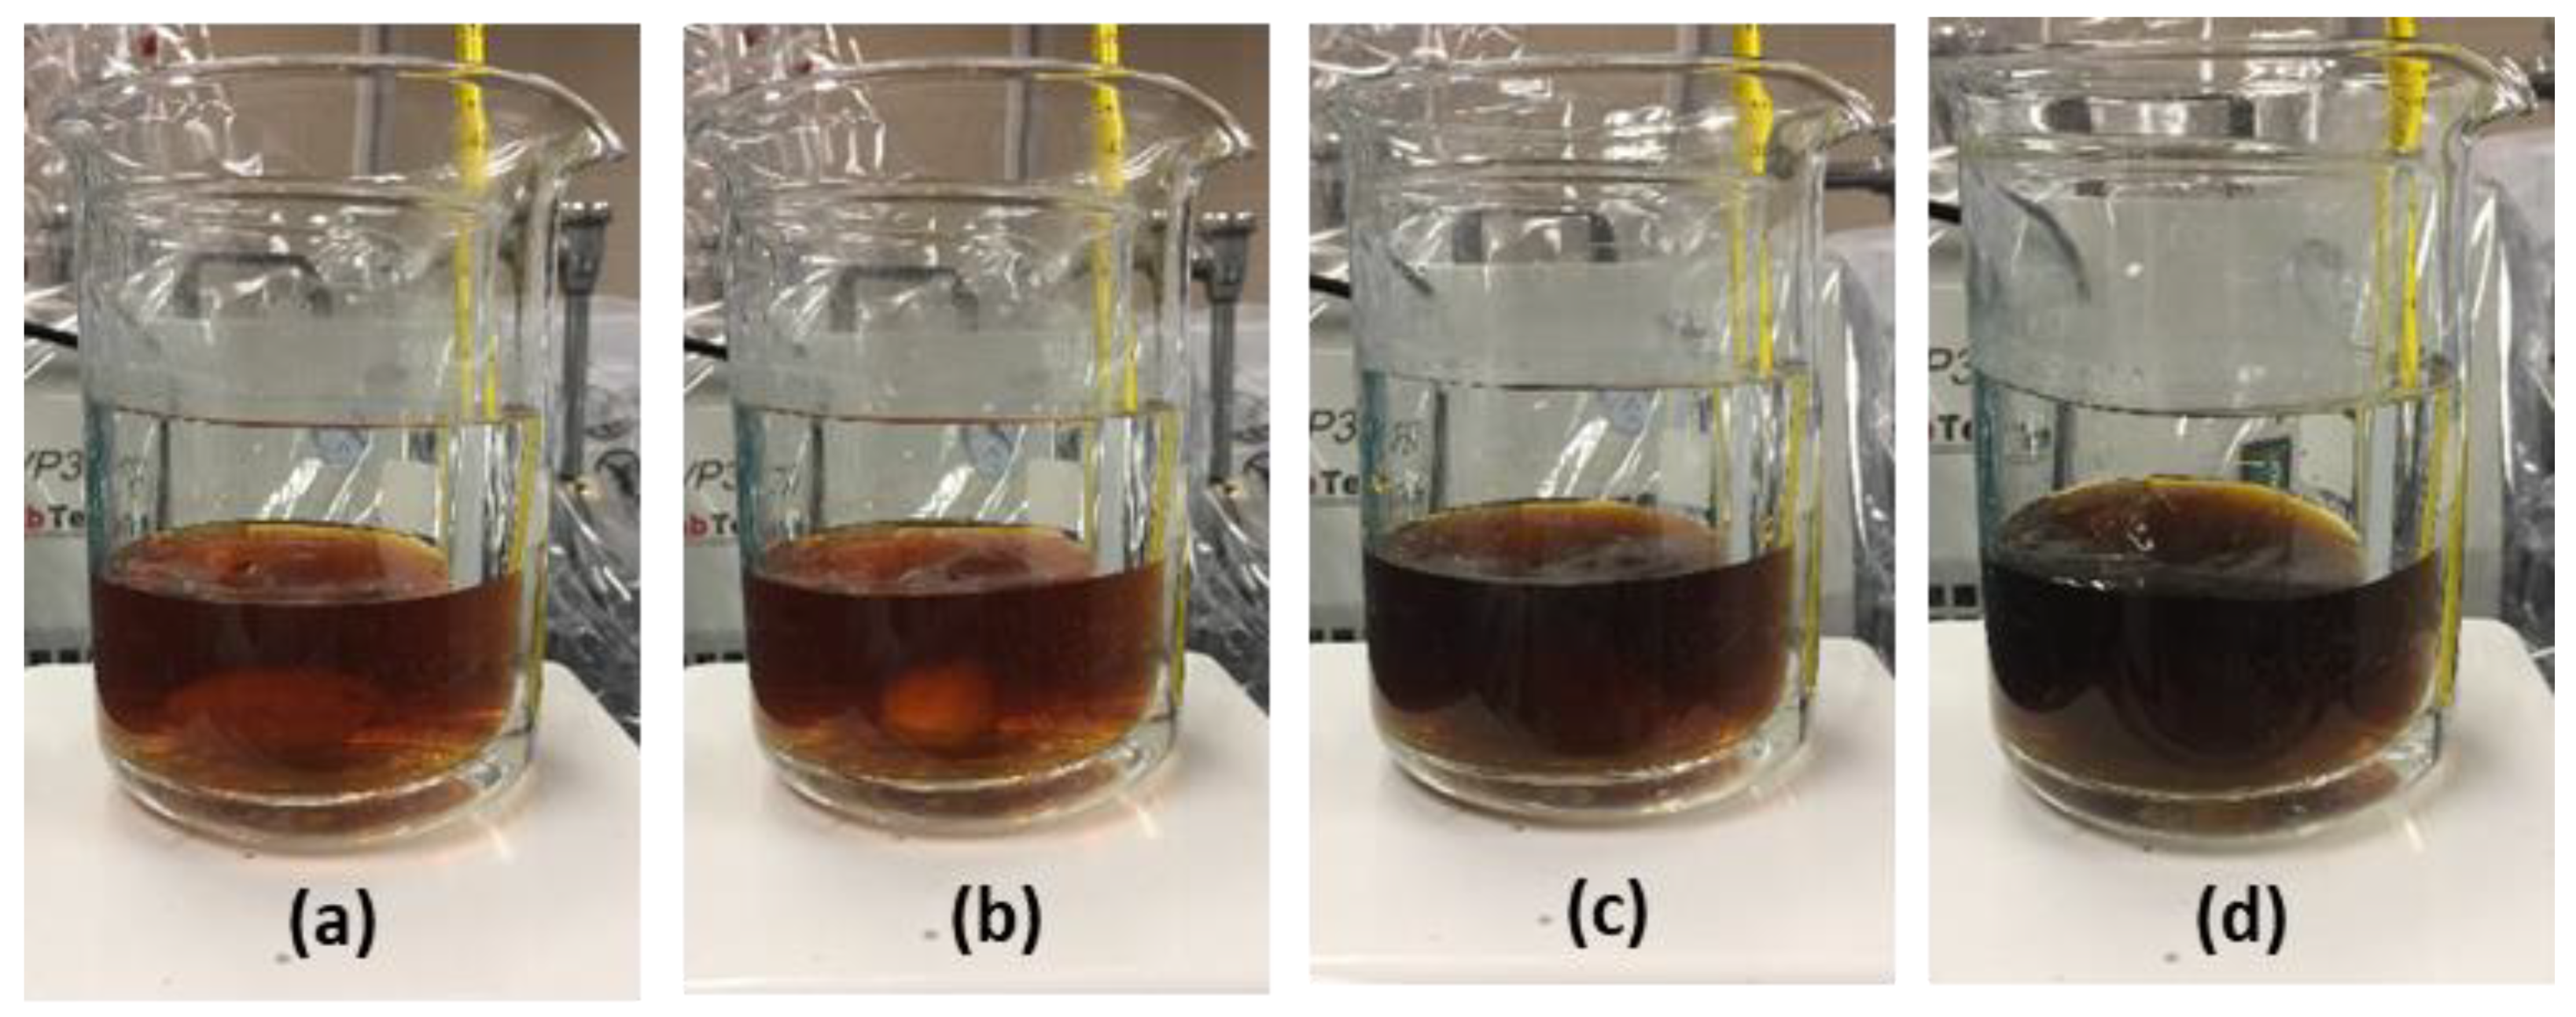
2.3. Green Synthesis of FeNP

FeNP was synthesized by adding 0.1 M of FeSO4·7H2O solution to the ANE at a volume ratio 2:3 at room temperature. This was followed by the addition of 0.1 M NaOH solution to adjust the pH to 6.0. Formation of FeNP was confirmed by the appearance of a black precipitation. The FeNP was separated by the evaporating of water on a hot plate and collected by washing several times using deionized water and drying in a fume hood overnight [10].

2.4. Methyl Orange (MO) Solutions Preparation

The stock MO solution was obtained by weighing 40 mg of MO and dissolving it in 1 L of double distilled water. The stock solution was then successively diluted to get 30, 20, 10, and 5 ppm. Solution pH was adjusted with HNO3 and/or NaOH by means of Orion 2 Star, pH meter, thermo fisher scientific (Waltham, MA, United States).

2.5. Catalytic Degradation Experiments

Catalytic degradation of MO was achieved by mixing 20 mL of 5, 10, 20, 30, and 40 ppm MO solution with 1, 2, 3, 4, or 5 mL H2O2 for 5 min at 140 rpm, then 0.01 g of FeNP was added and stirred at 140 rpm for 0.5, 1, 2, 3, or 4 h, as shown in Table 1. The remaining MO in the filtrate was detected with UV-1800 spectrophotometer (Shimadzu, Kyoto, Japan), at λmax of 467 nm.

2.6. Characterization

Scanning electron microscopy (SEM) was made via JEOL (Akishima, Tokyo, Japan) JSM-7600F high-resolution Field, emission electron microscope. Transmission electron microscopy (TEM) was made using a high resolution, JEOL, Akishima, Tokyo, Japan, JEM-1011 Transmission Electron Microscope. FeNP was dispersed in ethanol and sonicated for 30 min. A single drop of nanoparticle solution was placed onto the carbon-coated copper grid (400 mesh) then dried at room temperature. TEM imaging was then performed at an acceleration voltage of 90 KV. FT-IR spectra were collected for plant extract (ANE) and FeNP using Cary, South San Francisco, United States of America, 630 FT-IR spectrophotometer. Dynamic light scattering (DLS) was performed using Cilas, Orléans, France, dual scattering particle size analyzer Nano DS. The sample was prepared by sonication of FeNP in double distilled, deionized water using power sonic 405 at 20 °C for 1 h. Dispersion of nanomaterial suspension was performed in a 10 ml of demineralized water and the tube was immersed in a cold water bath during sonication with an ultrasonic system (power sonic 405). X-ray diffraction (XRD) was used to investigate the material structure of iron nanoparticles. The XRD analysis was conducted with a Philips XRD 3100 diffractometer (Amsterdam, Netherlands) at 45 kV and 30 mA. It used copper Kα radiation and a graphite monochromator to produce X-rays with a wavelength of 1.54060 Å. Iron nanoparticles were placed in a glass holder and scanned from 10° to 60° with a scanning rate of 2.0 °/min.

2.7. pH of Zero Charge (pHZC)

The pHZC of the synthesized FeNP was measured via batch equilibration routine described by Da’na and Sayari, 2011 [23]: 200 mL of NaCl solution with a concentration of 0.1 M was prepared then poured into eight beakers, 20 mL in each. Then HNO3 and NaOH were used to set the initial pH (pHi) of each beaker at a specified value within the range 2.0 to 11.0 using Orion 2 Star pH meter. Next, 0.1 g of the FeNP was added to each beaker and stirred at 140 rpm, and 293 K for 24 h. Finally, the equilibrium pH (pHe) of each sample filtrate was measured.

2.8. Adsorption Tests
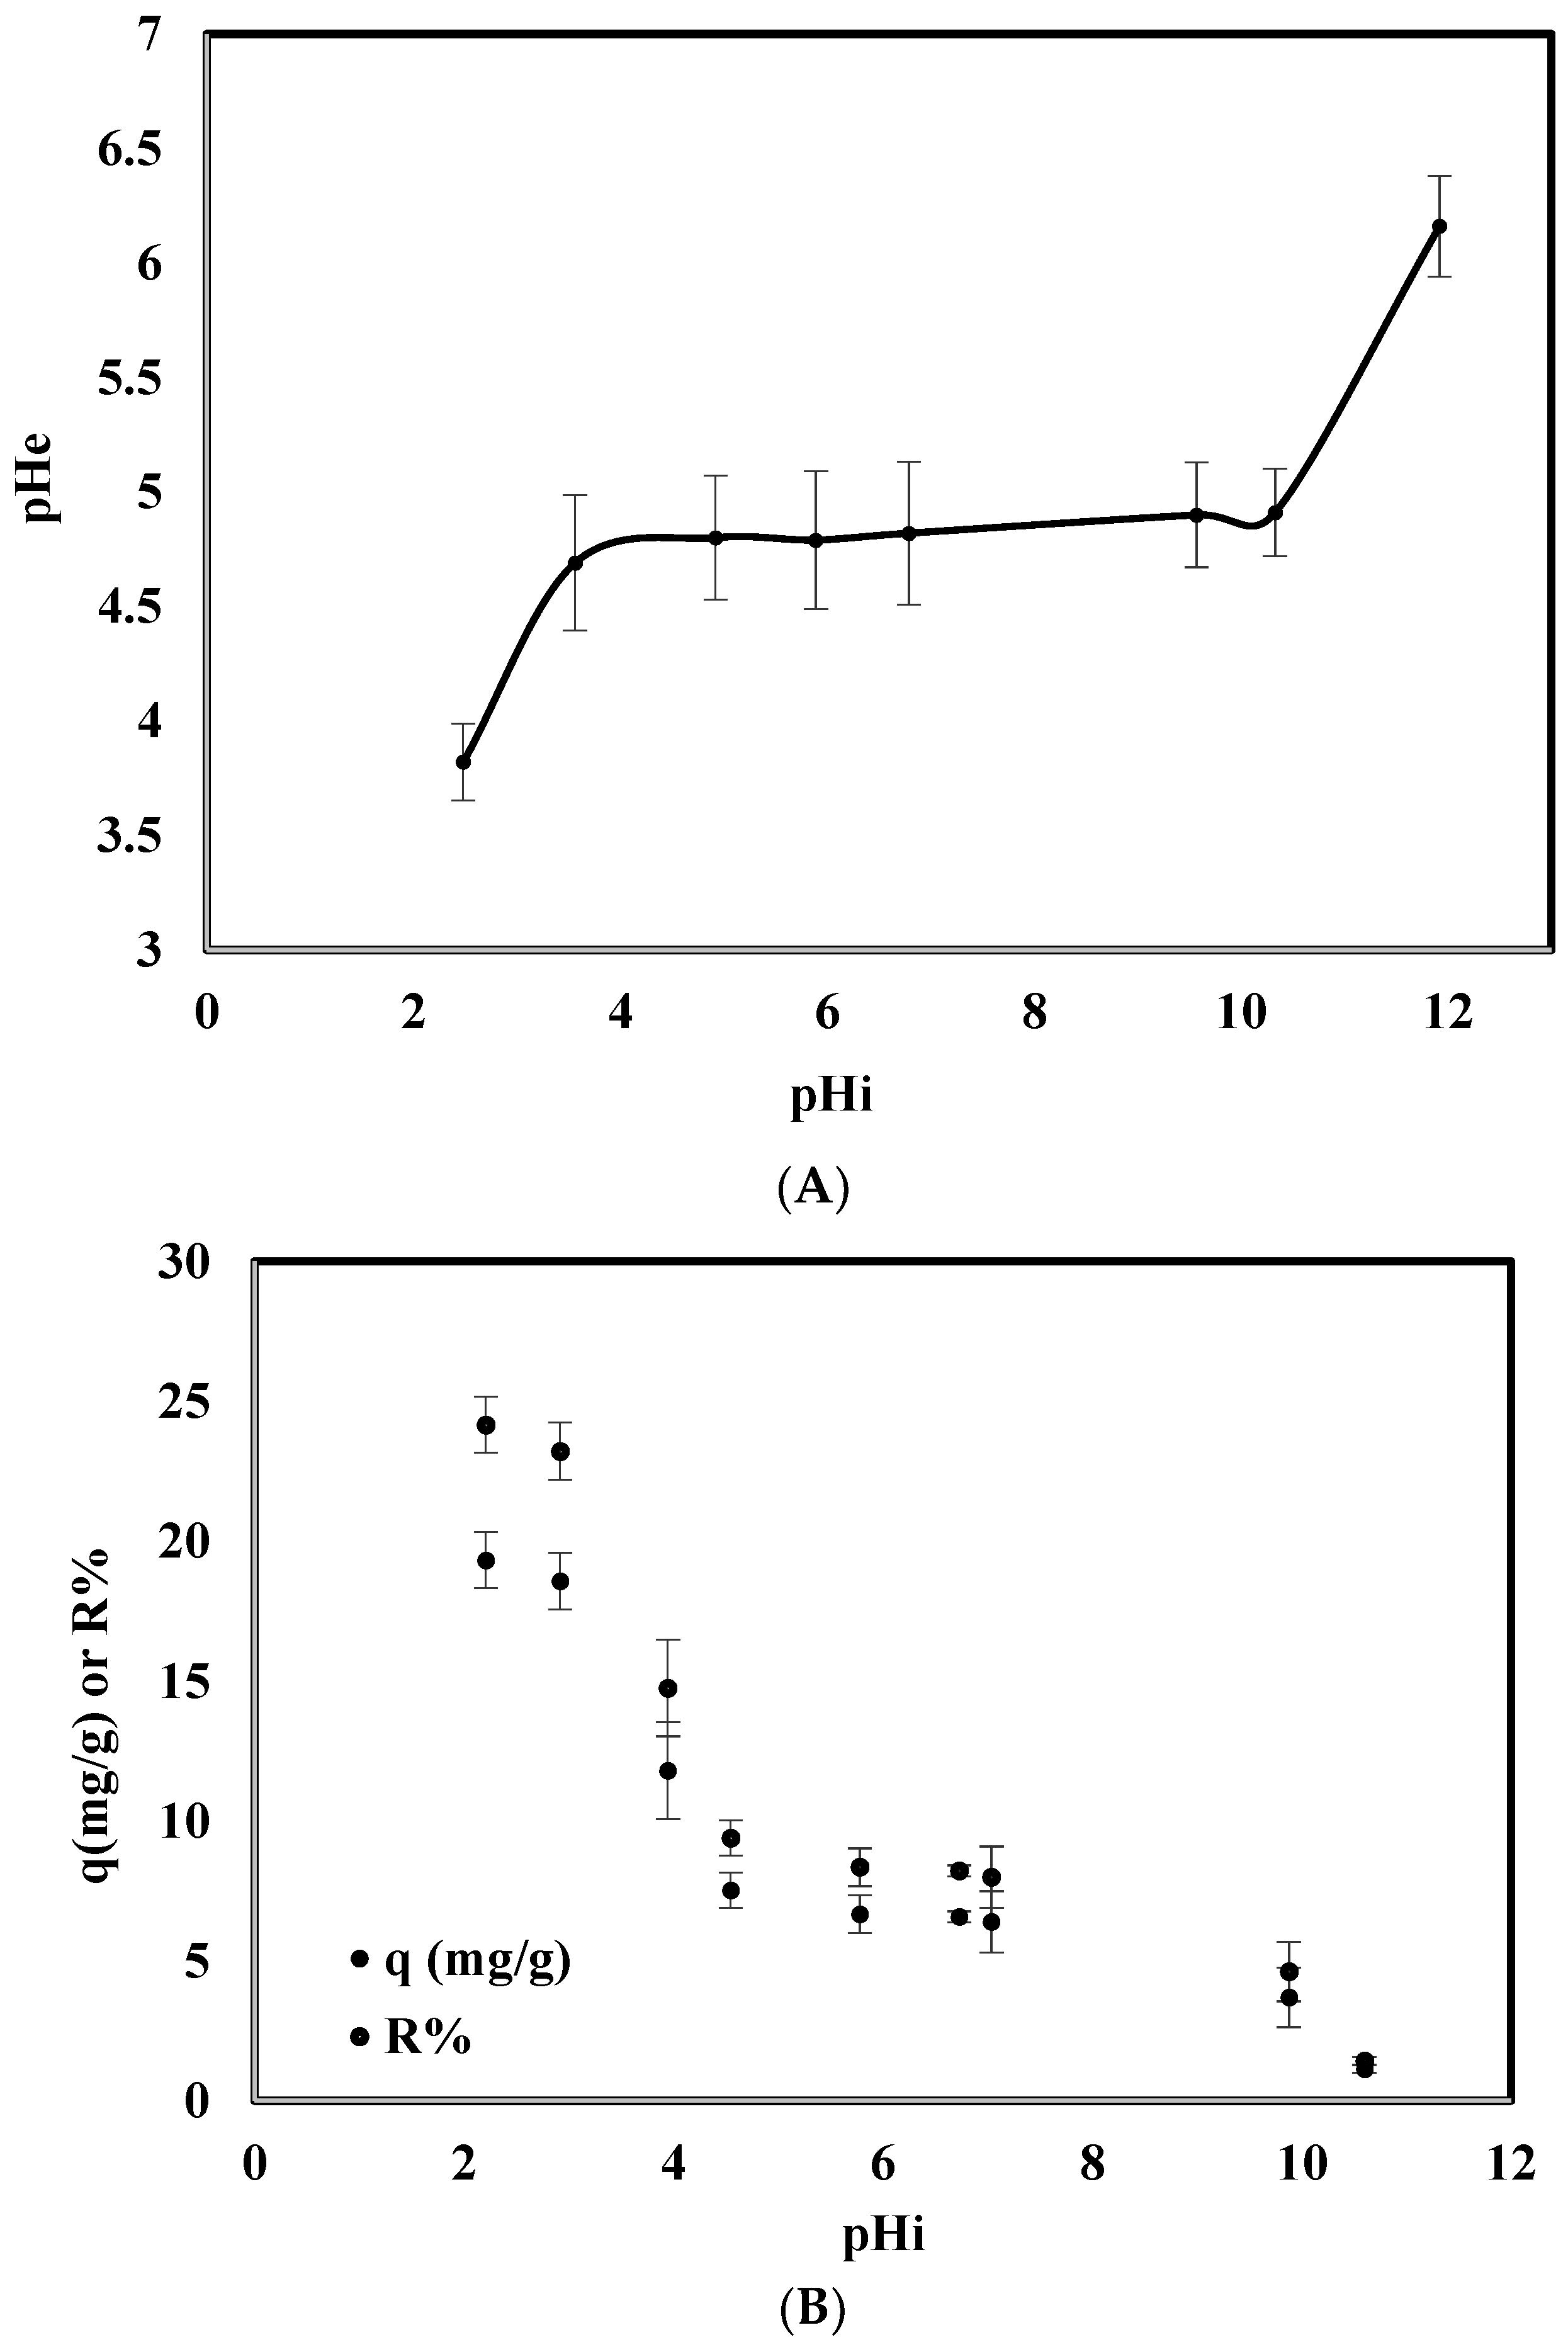
Adsorption of MO was achieved by mixing 20 mL of 5–40 ppm MO solution with 0.01 g of FeNP at 140 rpm for 24 h, to make sure equilibrium was reached. The same set of the experiment was repeated at three different temperatures of 293, 303, and 313 K using SI-300 lab companion shaker (GMI Inc., United states of America). The remaining MO in the filtrate was detected with UV-1800 spectrophotometer (Shimadzu, Kyoto, Japan) at λmax of 467nm.

2.9. Effect of pH

FeNP surface charge is greatly affected by solution pH because of protonation or deprotonation of functional groups on the surface by changing pH. Moreover, hydrolysis and ionization of species existing in the solution significantly influenced by solution pH. Thus, a number of tests were made under similar conditions (0.01 g FeNP, 20 mL MO solution, 40 ppm, 293 K, 24 h, 140 rpm) and different pH values (2–11) to investigate the dependence of the adsorption process on pH.

2.10. Kinetics Experiment

Kinetics study was achieved by stirring 1.0 g of FeNP in 1 L of 40 ppm MO solution at 293 K, 303 K, and 313 K for different periods of time ranging from 5 min to 24 h.

2.11. Antimicrobial Activity of FeNP Acacia nilotica Seedless Pods Extract

The antimicrobial activity of FeNP was tested against five species of pathogenic bacteria (belongs to Gram positive and Gram negative); these are: Escherichia coli (E. coli), Staphylococcus aureus (S. aureus), Salmonella, Marsa, and one pathogenic fungal species; Candidia. The regular protocol of gel diffusion assay was applied according to the protocol described by Sambrook and Russell, 2011 [24]. Nutrient agar plates prepared to contain the following constituents (10 peptone, 10 NaCl, 5 yeast extract, 15 agar powder g/L). Pure cultures of the tested organisms were activated on nutrients broth medium (LB, containing the same constituents of nutrient agar without adding the agar powder) at 30 °C for 20 h before running the assay. An aliquot of 0.3 mL of each organism was taken at the log phase and seeded aseptically on to nutrient agar plates. The seeded agar plates were allowed to solidify at room temperature. Three wells were designed in each agar plate by sterile borer to hold the 100 µL solution of FeNP. Three different concentrations (10, 40, and 60 µg/L) solution of FeNP were used in the assay were introduced to the gel wells on the agar plates. The inoculated agar plate incubated at 30 °C for 24 h. The ability of Acacia nilotica ferric nanoparticles to inhibit the growth of the tested organisms was captured and recorded and the diameter of inhibition zones was measured.

2.12. Monitoring the Inhibitory Effect of FeNP on Pathogenic Microorganisms

A series of different concentrations of freshly prepared FeNP was used to measure the inhibitory effect of FeNP gradually on pathogenic microorganisms. The same pathogenic species mentioned in the experiment described above were used for this test. All pathogenic microorganisms inoculated aseptically in 5 mL NB containing various amounts of FeNP (0, 5, 10, 20, 40, and 60 µg), and one set of negative control containing only FeNP plus NB medium without the microorganism. All treatments were incubated at 30 °C for 24 h. and the absorbance at 600 nm was recorded using Shimadzu UV-1800 spectrophotometer.

3. Results and Discussion

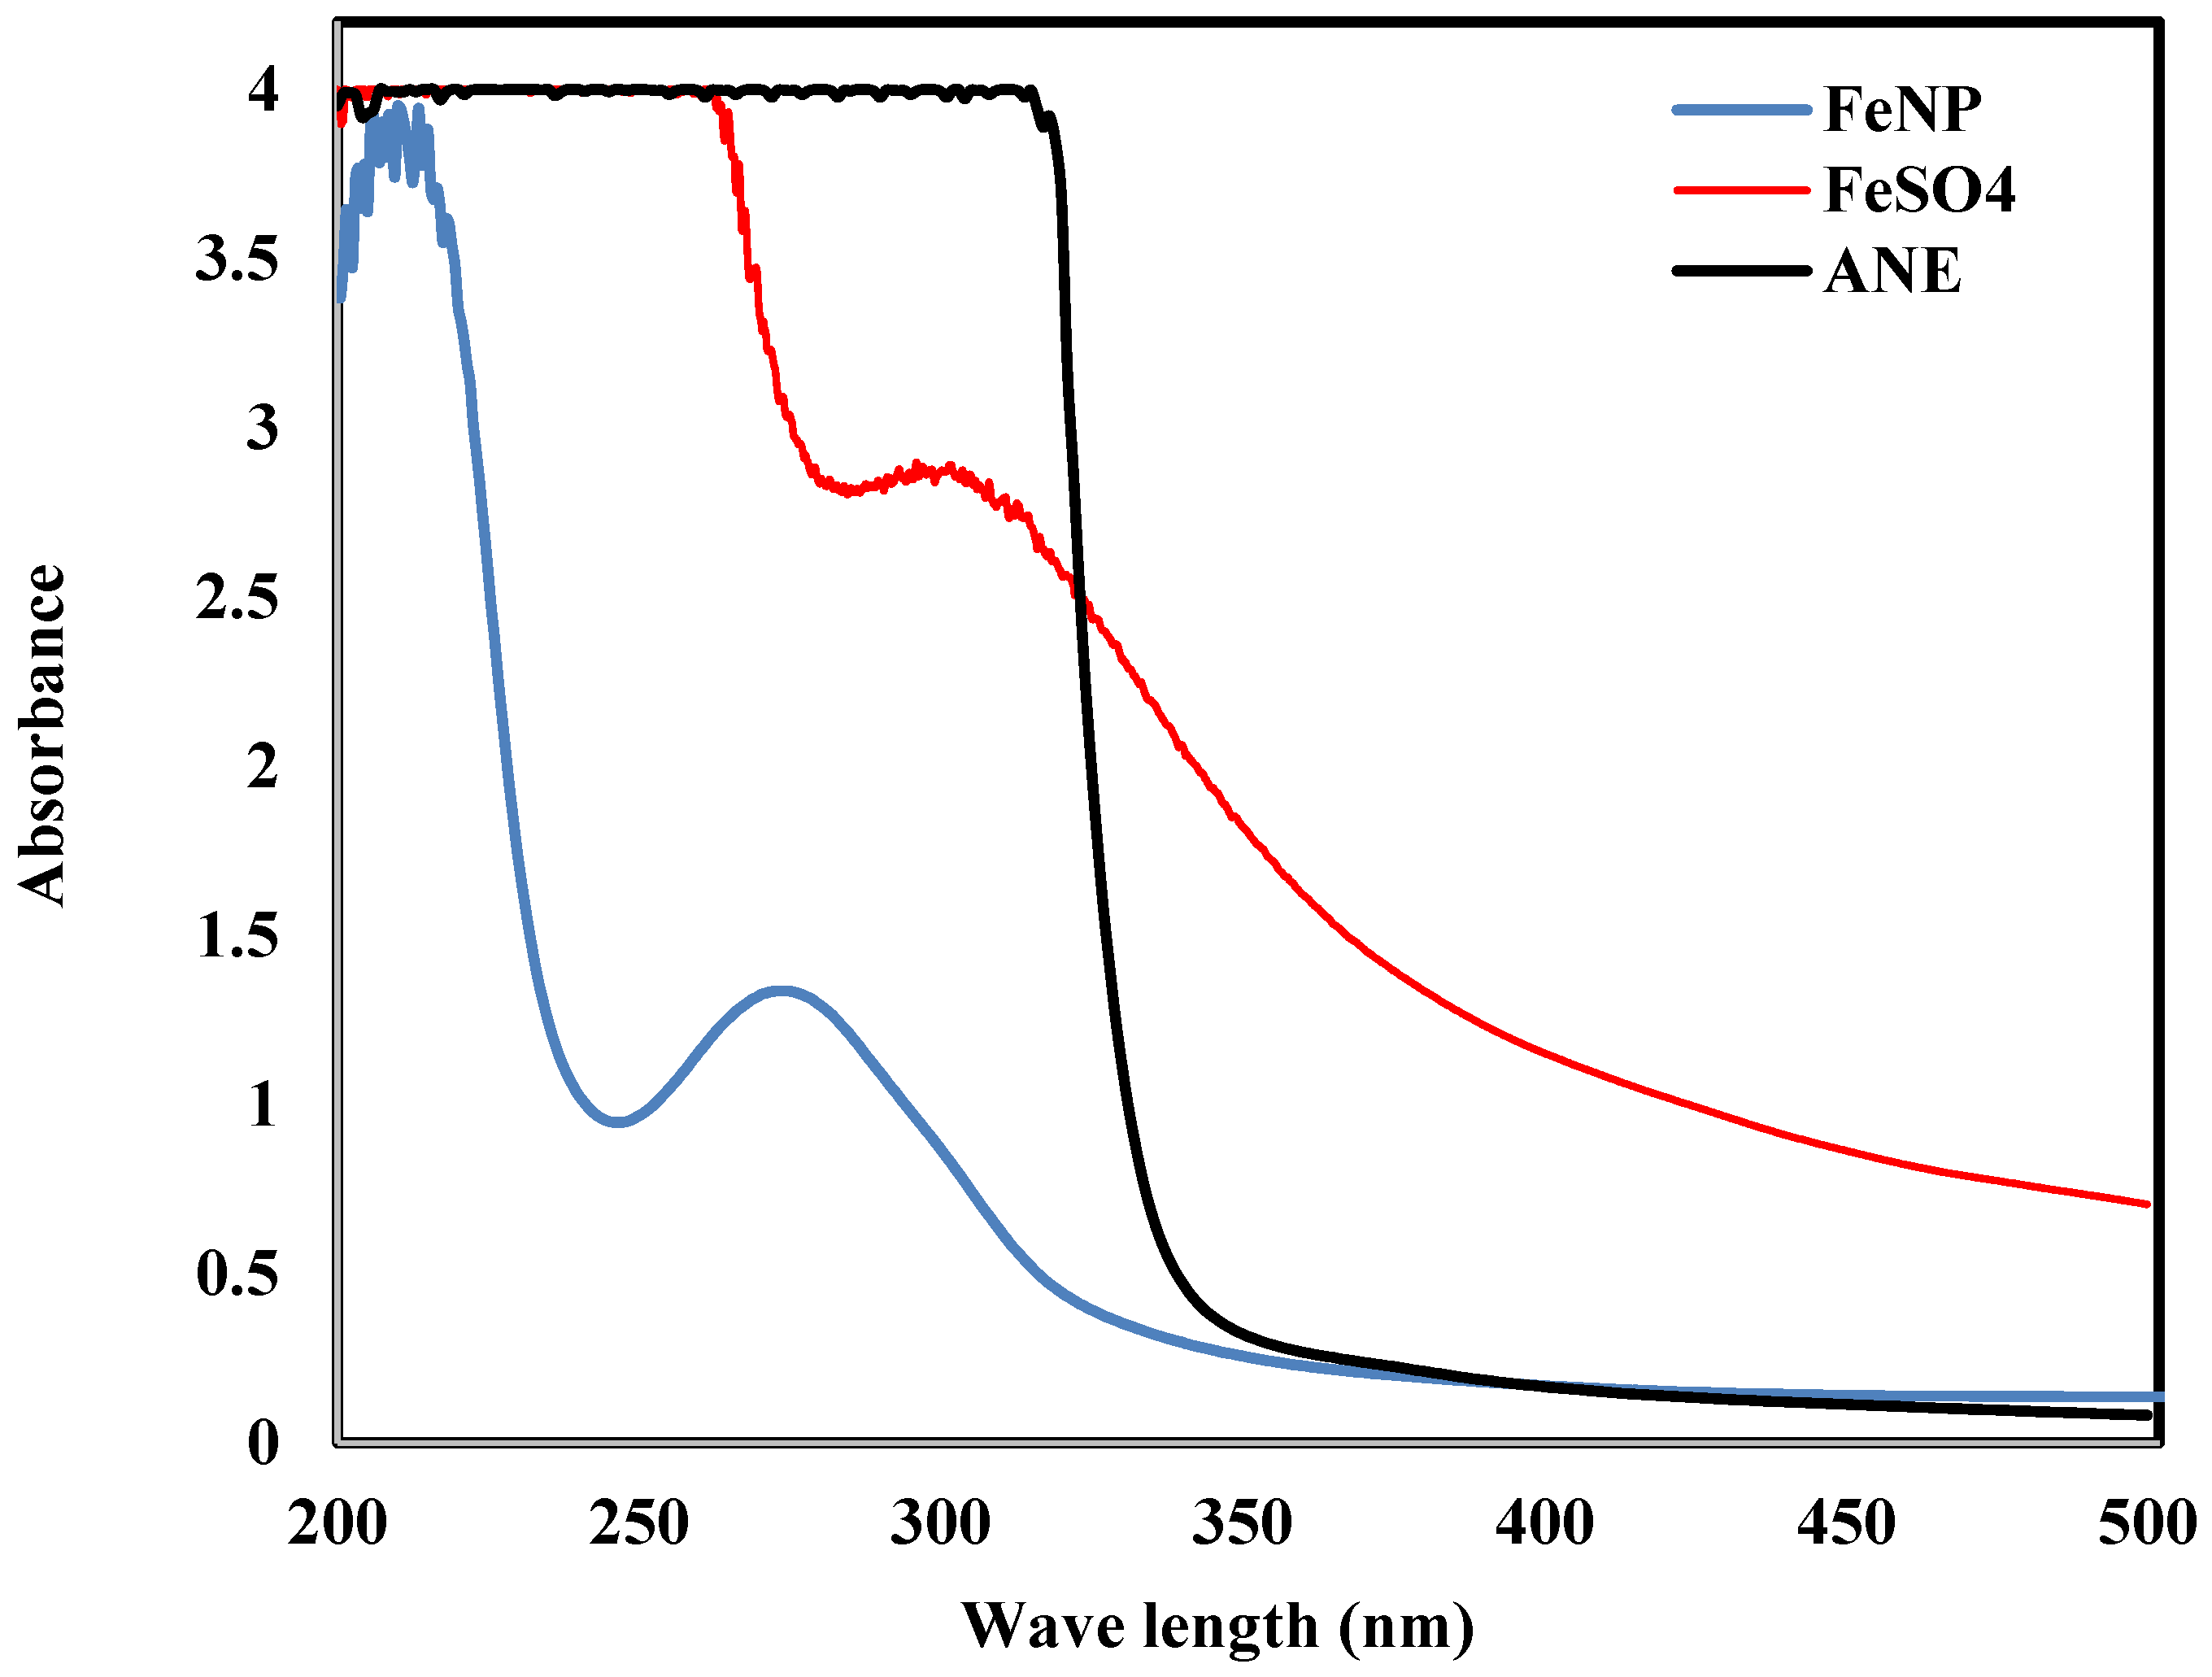
3.1. UV-Vis Spectroscopic Analysis
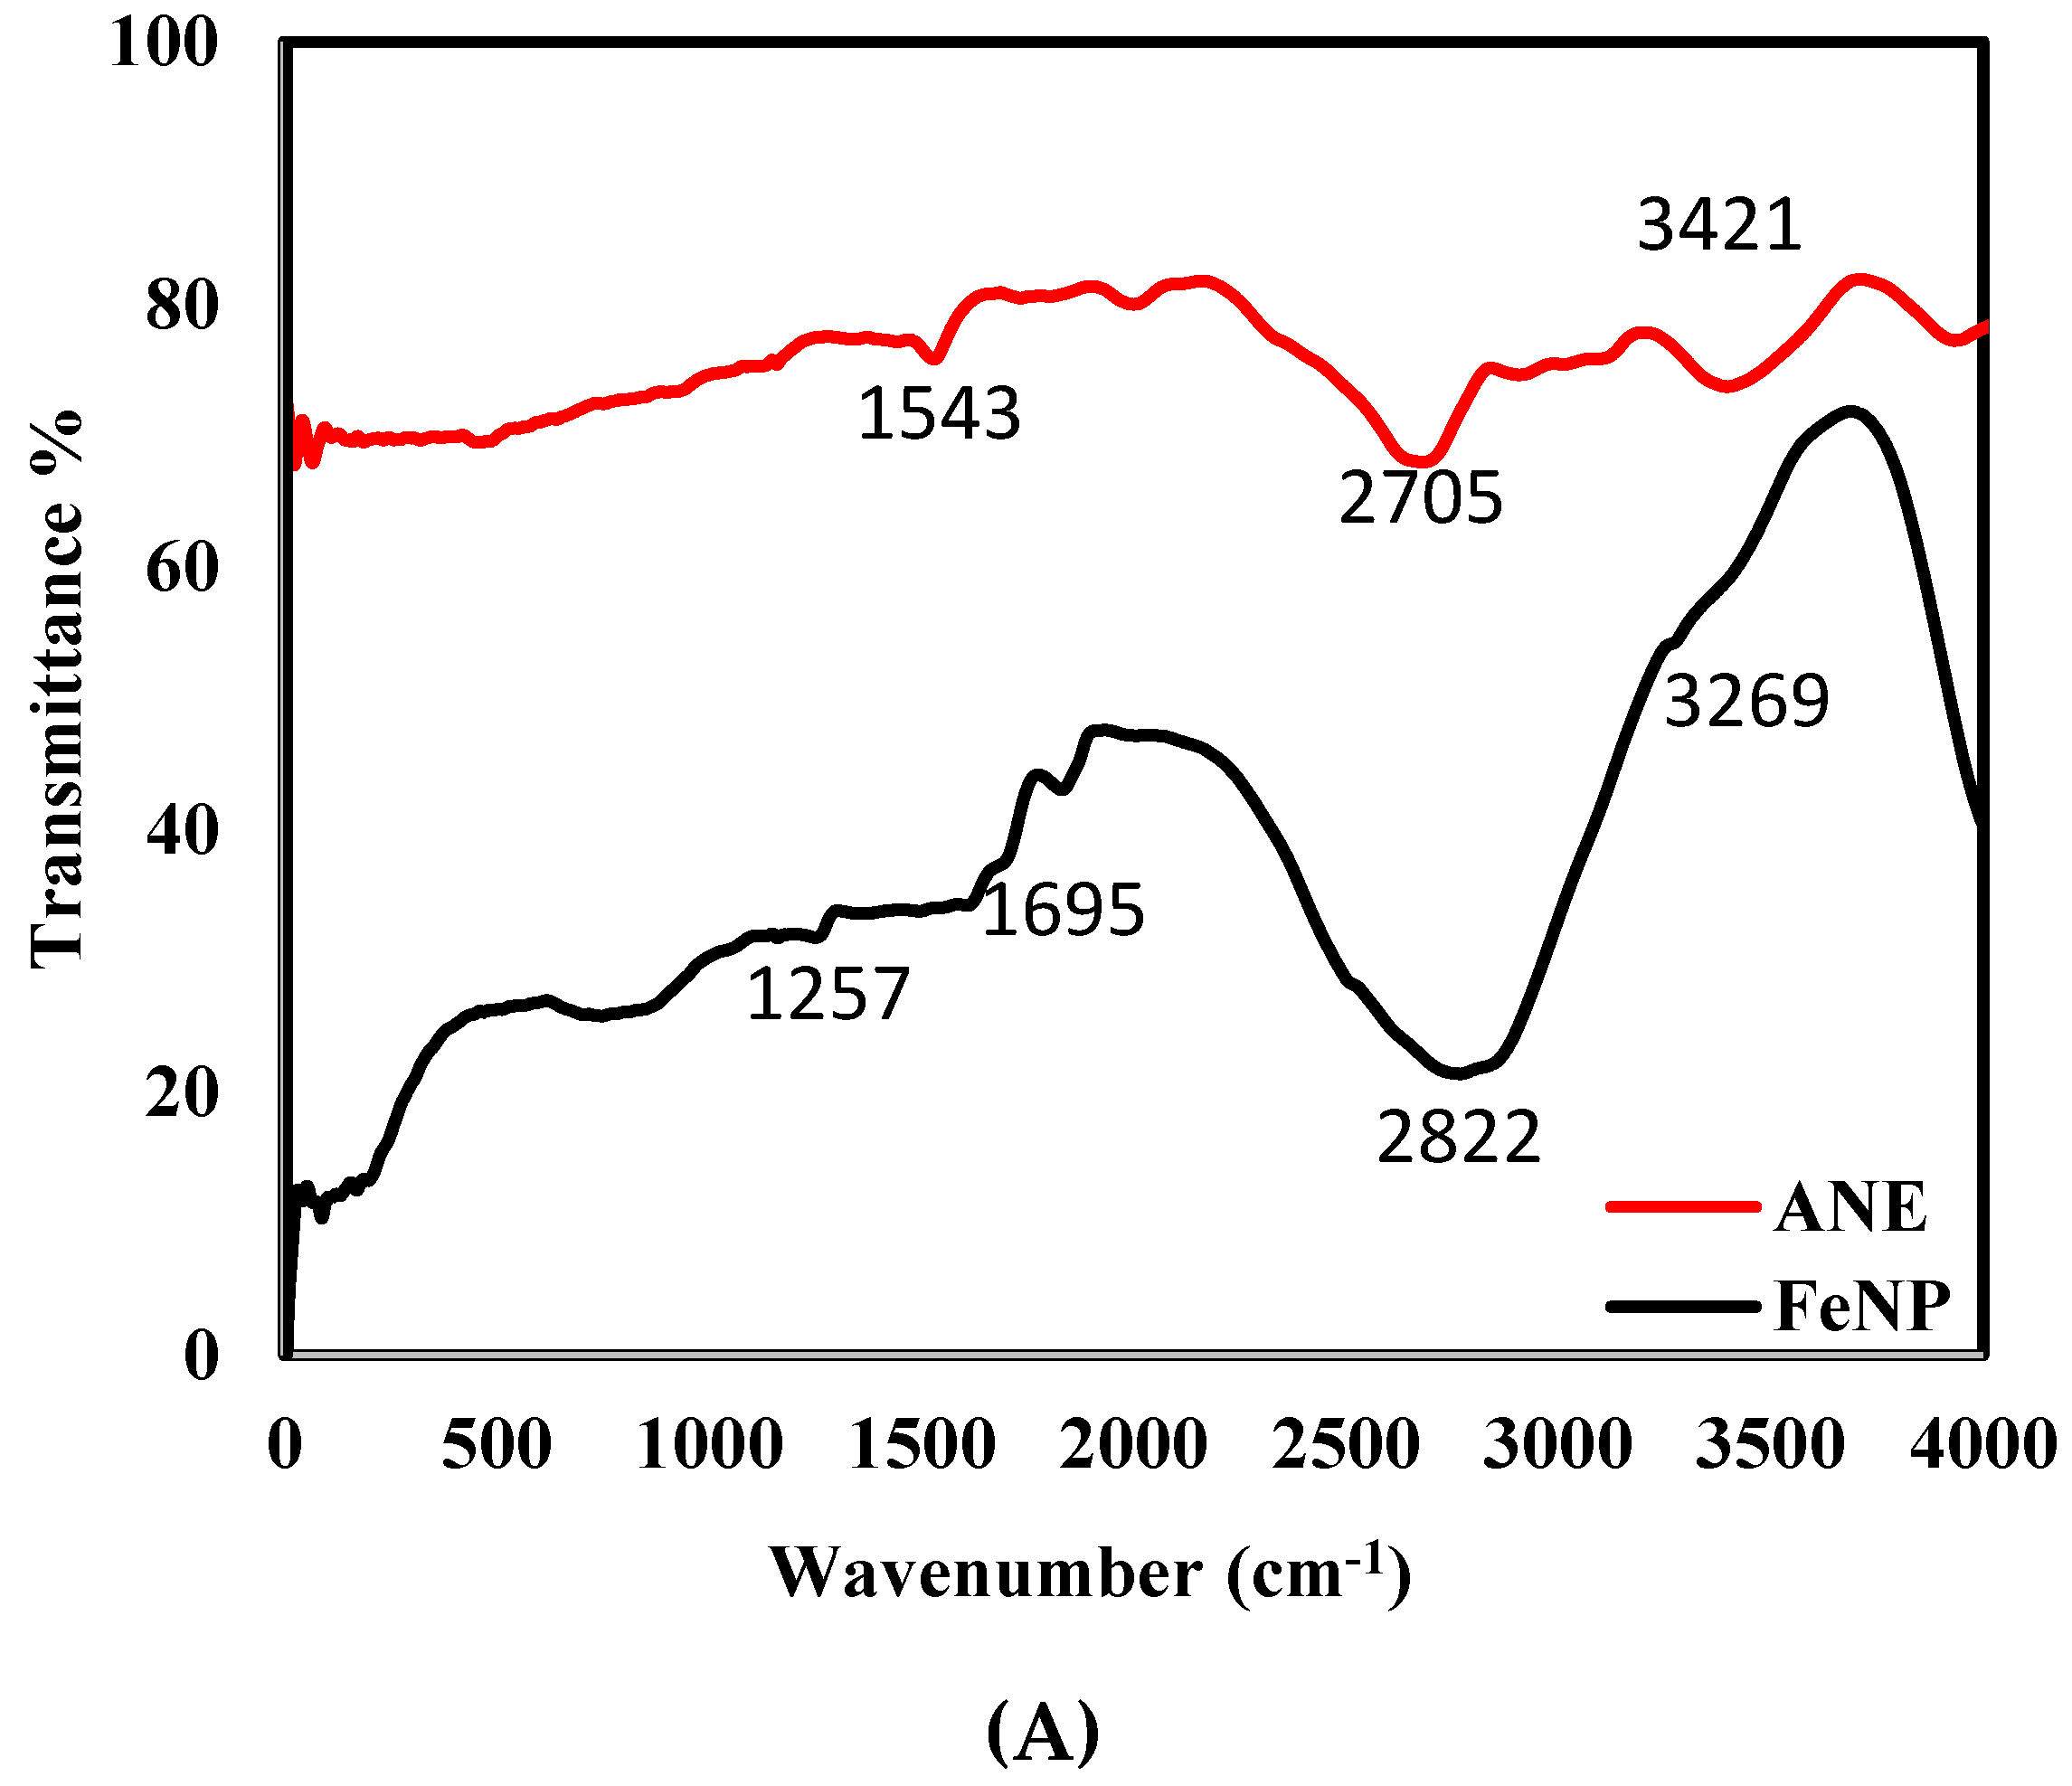
FeNP formation was confirmed by the color change immediately occurred after the addition of the plant extract to FeSO4 solution. The mixture color immediately converted from transparent yellow to black in a few seconds demonstrating the synthesis of iron nanoparticles (Figure 1). The dark color was a result of surface plasmon excitation vibrations in the Fe nanoparticles [25]. This was confirmed by the appearance of two absorption bands around 217 nm and around 283 nm (Figure 2). The formation of FeNP is known to take place through complexation of Fe salts followed by capping of Fe with phenolic compounds [3,18,25]. These findings are in good agreement with results reported elsewhere [3,26].

3.2. FT-IR Analysis

FTIR analysis was used for identification of the biomolecules that may be responsible for the reducing of metal precursor ions and stabilization agent for nanoparticles. FT-IR spectrum of the Acacia nilotica extract were collected in the range of 400 to 4000 cm−1, as shown in Figure 3A. The band at 3420 cm−1 in FT-IR spectrum of Acacia nilotica extract is related to the O-H bond stretching of phenolic group. It was suggested to be responsible for Ferrous Sulfate reduction. In addition, the peaks at 2705 cm−1, and 1543 cm−1 can be attributed to C-H bending and N-H bending, respectively. On the other hand, most of the peaks in the plant extract present in FeNP that improve the responsibility of plant extract as capping agent. The stretching, vibration frequency of OH group was shifted to 3269 cm−1, the broad peaks at 2822 cm−1 attributed to methyl C-H stretching [21]. The presence of a new peak at 1695 cm−1 attributed to carbonyl groups (C=O) [22]. The appearance of new frequency peak at >700 cm−1 in the FeNP spectra is corresponding to the vibrations of Fe-O bonds of iron oxide, as reported by Kumar et al. [27].

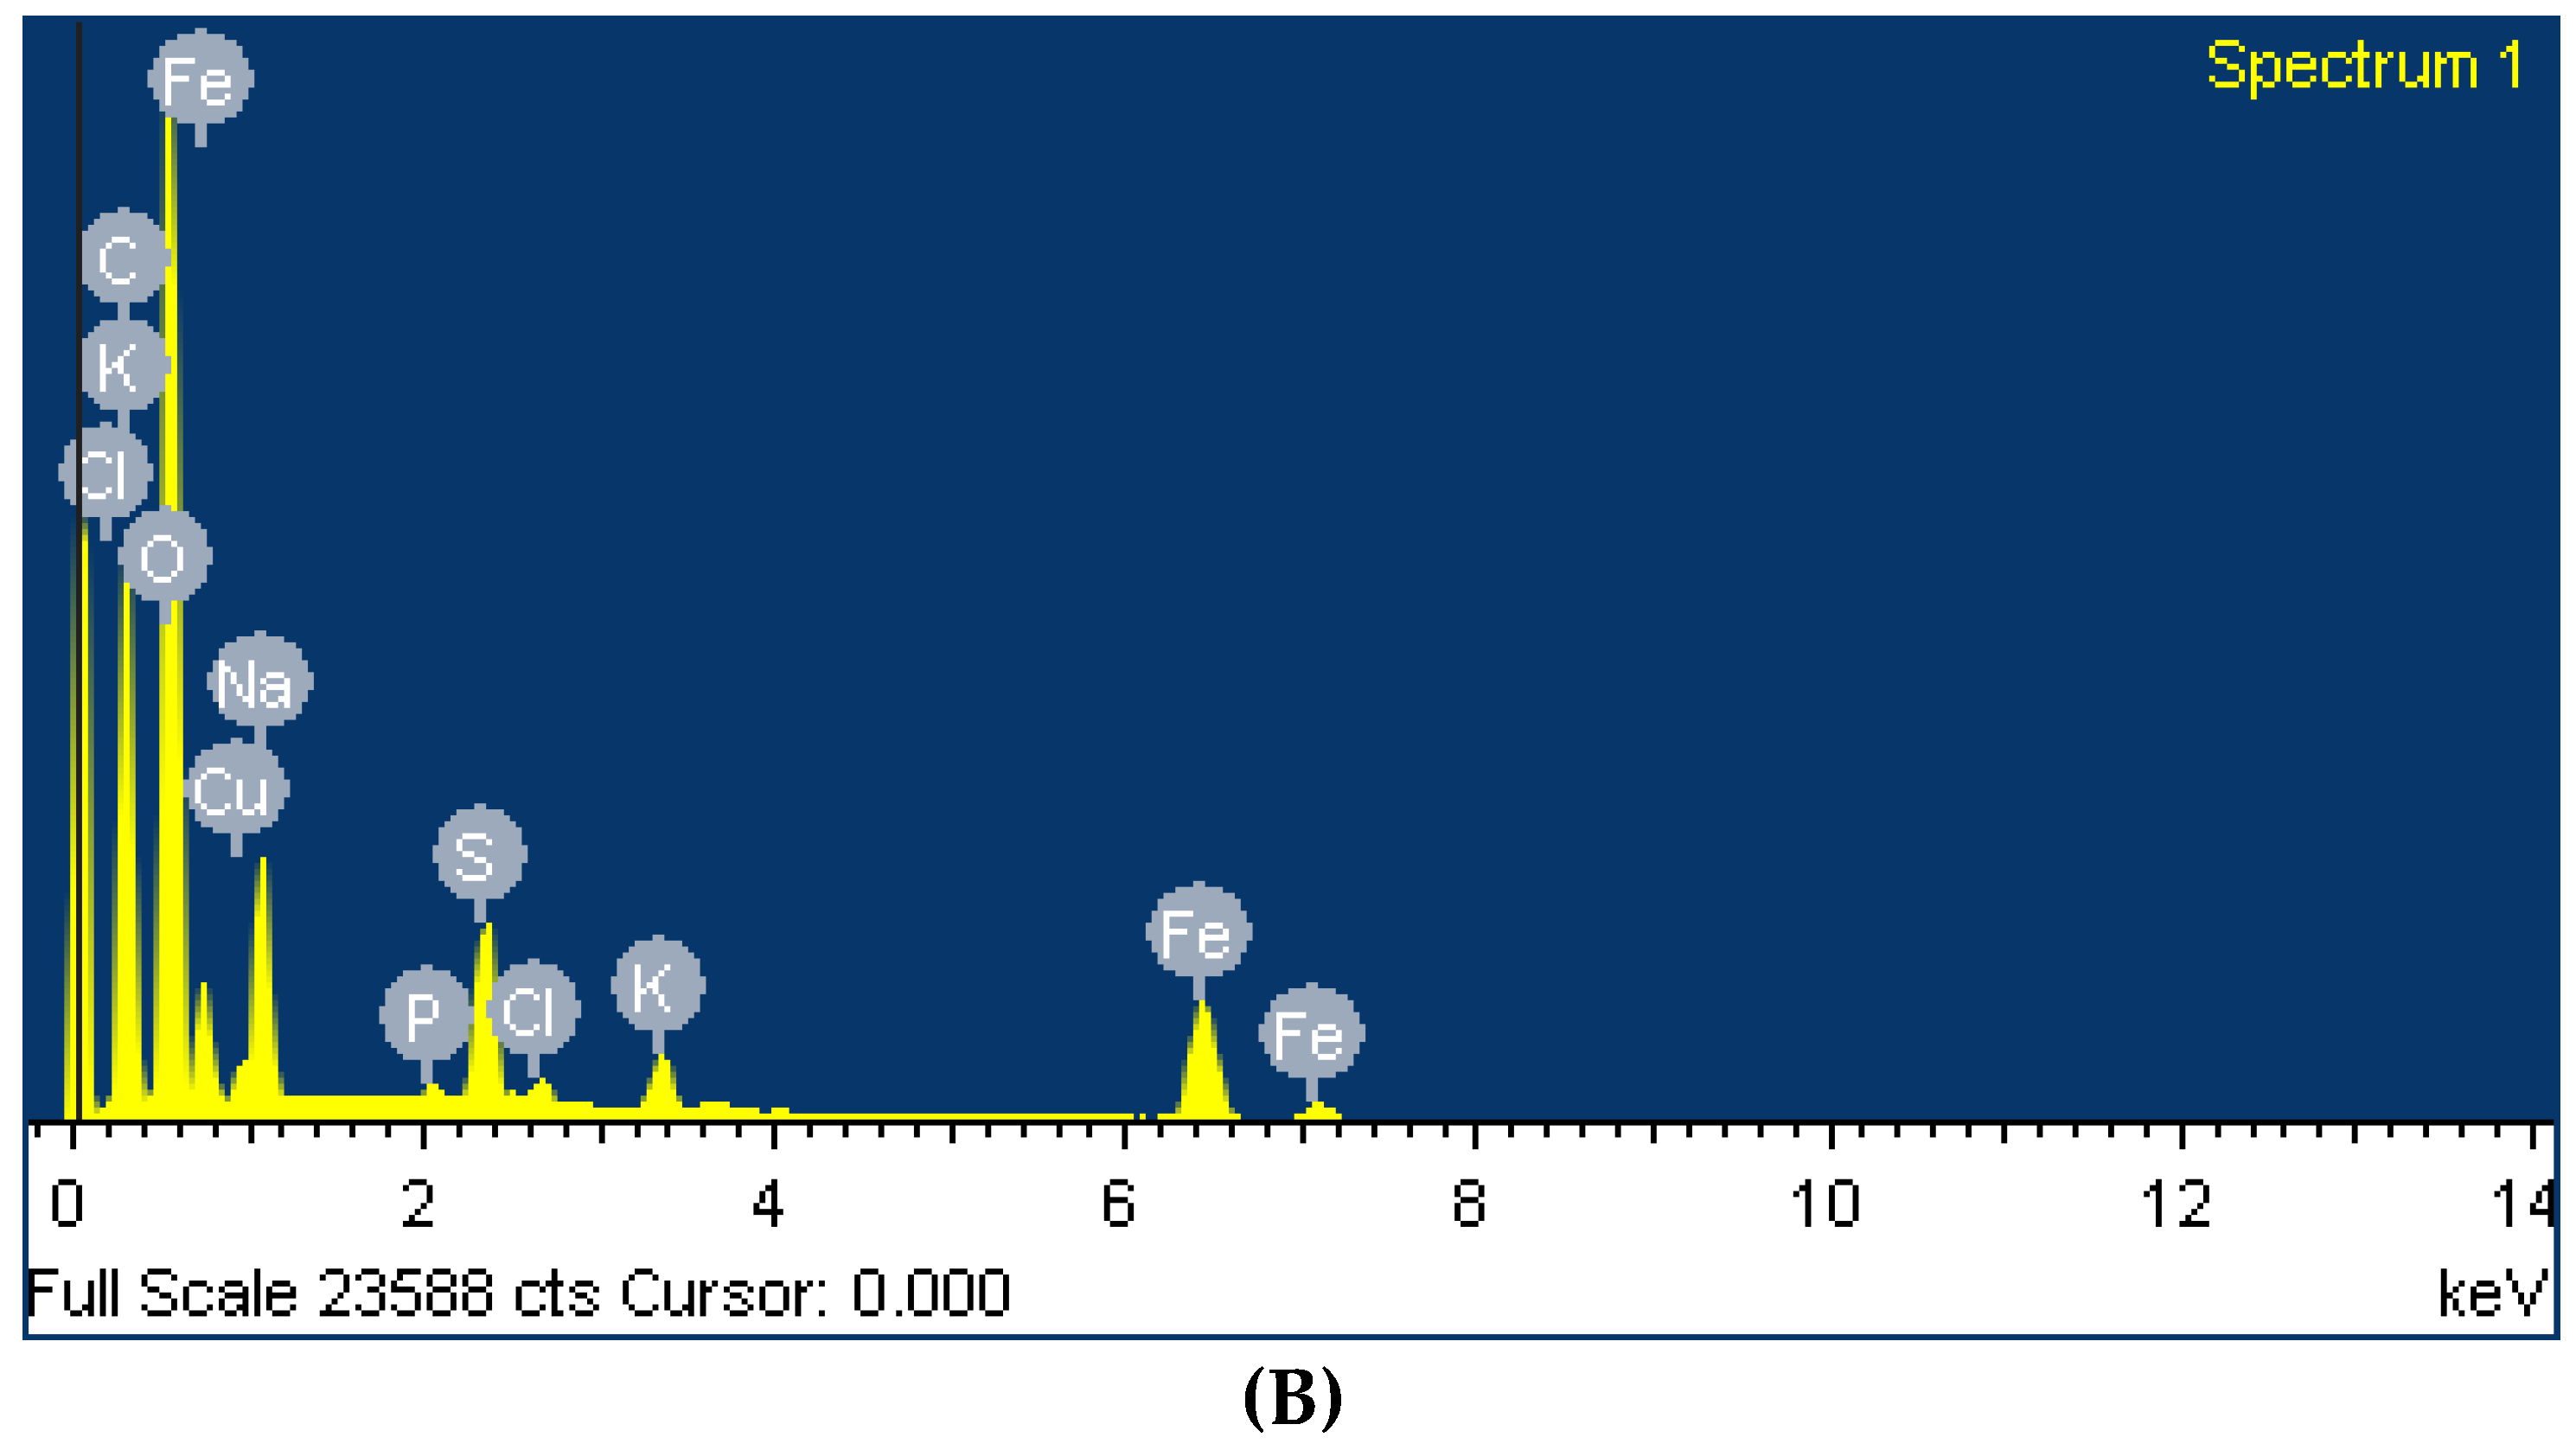
3.3. Energy Dispersive Spectroscopy (EDS) Analysis
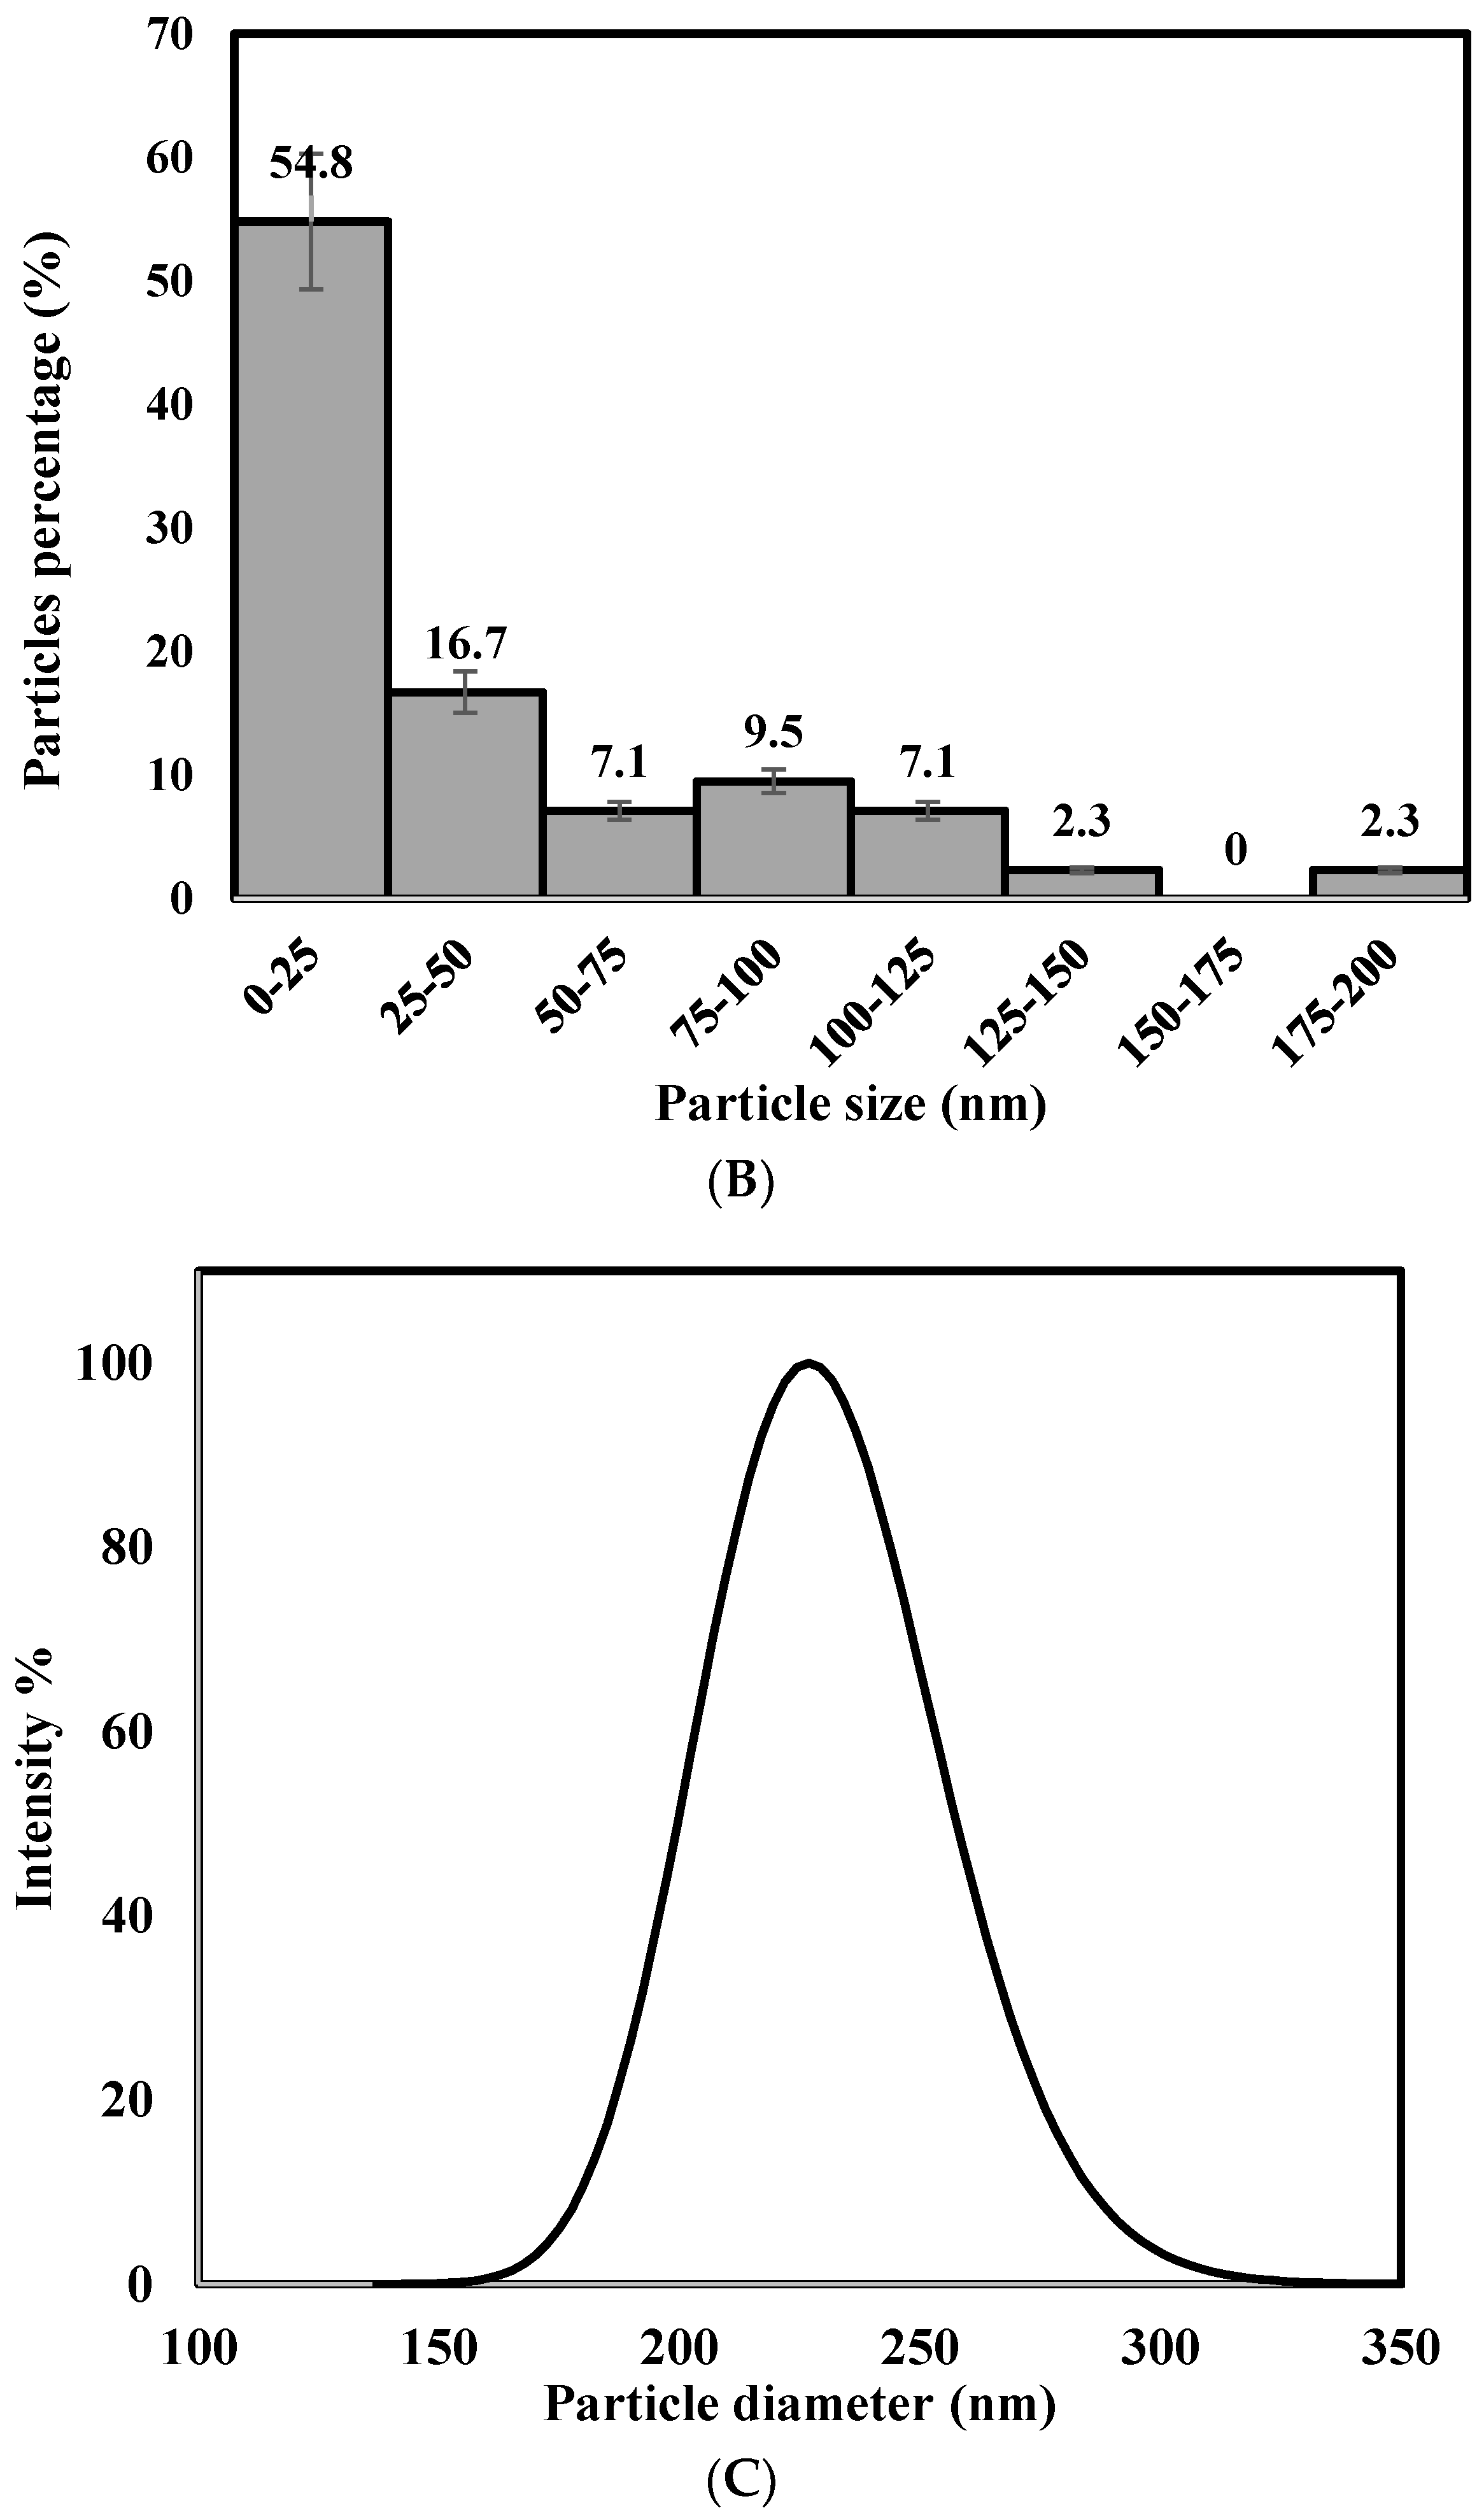
Figure 3B shows the energy dispersive spectroscopy (EDS) analysis, which reveals the elemental composition of the prepared nanoparticles. These EDS values are useful in reflecting the nuclear content on the surface regions of the FeNP. The EDS profile shows intense peak signals of iron with a Kα peak at 6.400 keV, a Kβ peak at 7.059 keV, and an Lα at 0.75. Other signals observed include that of chlorine, oxygen, carbon, and copper. EDS quantification gives atomic percentages of 34.64% C, 39% O, 15.33% Fe, 4.13% Na, 3.48% S, 1.27% Cu, 0.48% Cl, and 0.13% P. Copper signal is due to the copper grid onto which the sample was placed during the analysis. The existence of elemental iron and oxygen demonstrating that the nanoparticles are essentially present in oxide form [25]. Furthermore, the presence of C and O peaks are related to polyphenols or any other C and O containing a compound in Acacia nilotica pods extract [10]. The S peak is an indication of the presence of a sulfate group from the FeSO4 precursor used. The appearance of K is related to the complex of plant extract. It was reported that potassium plays an important role in enzyme activity. In addition, it neutralizes organic anions within the plant extract and stabilizes pH between seven and eight, which is optimized for enzyme activity [8]. Very similar results were reported for Fe nanoparticles prepared with other leaf extracts [11,18].

3.4. SEM Scanning

Figure 4(Aa,Ab) shows the SEM image of FeNP prepared. The FeNP appear to have a particle size within a range of around 200 nm. The observed SEM images in Figure 4(Aa,Ab) clearly reveal FeNP aggregation, which is caused by magnetic dipole–dipole interactions of the isolated iron nanoparticles.
Figure 4(Ac,Ad) shows the TEM image of FeNP. It is clear that FeNP tends to aggregate into irregular morphology. However, Figure 4(Ad) shows some dispersions of the particles with an average particle size around 39 nm as obtained by TEM analysis via Image j software—shown in Figure 4B. It is apparent from the figure that 54.8% of the particles have a size less 25 nm and 2.3% have a size greater than 100 nm. On the other hand, the particle size distribution of the prepared iron nanoparticles obtained by the dynamic light scattering method is shown in Figure 4C. The results indicate that the particle size distribution of the iron nanoparticles prepared is with an average size of 230 nm. It is known that the particle size distribution obtained by TEM is more realistic than that obtained by DLS. Since TEM measures the actual size, DLS measures the hydrodynamic size. Cheera et al. [21] reported an average iron particle diameter of 16–20 nm using leaf extract of this plant. The above results indicate that the iron nanoparticles are entirely within the nanoscale domain.
The XRD technique was used to identify the structure of the prepared iron nanoparticles. The observed XRD pattern shown in Figure 5 revealed the exitstance of diffraction peaks with 2θ values of 24.14, 33.14, 40.86, and 39.28 corresponding to the hkl values of 012, 104, 113, and 006, respectively that denotes crystalline phase of α-Fe2O3-NP (JCPDS card No. 01-1030).

3.5. Catalytic Degradation of MO

The synthesized FeNP was used to catalyze MO degradation in the presence of H2O2 as an oxidizing agent according to Table 1. MO degradation using a different amount of H2O2, different contact time and different initial MO concentration was observed by UV V is spectroscopy and the results are shown in Figure 6.
In the absence of FeNP, degradation of MO was not noticed even after 24 h, indicating that the oxidation pathway of MO by peroxide does not occur. However, degradation of MO occurred only when FeNP was introduced into the reaction mixtures indicating essentiality of the FeNP for promoting the degradation, which probably occurred through free radicals pathway [28]. The introduction of the FeNP may facilitate the formation of OH• radical through which the degradation of the MO proceeds. Degradation was relatively slow, 90% removal was achieved within the first two hours. Almost complete removal of the dye can be reached after three hours within the studied conditions. The kinetic data were found to follow a pseudo first order kinetic model given in Equation (1):
  l n   ( C t C e )   =   l n   ( C e )     K p 1 t
where Ce, Ct, t, and Kp1 are MO concentration at equilibrium and at time t (mg/L), time (min), and Pseudo first-order constant (mg/L·min). The R2 and the rate constants Kp1 were calculated by plotting ln(Ct − Ce) vs. t, as shown in Figure 6B. The rate constant Kp1 for MO degradation was found to be 0.0219 mg·L−1·min−1.
To examine the effect of MO initial concentration on the degradation efficiency a set of experiments were conducted under the same conditions with only MO concentration varied within the range 5–40 ppm according to Table 1. It can be seen from Figure 6C that increasing MO concentration from 5 ppm to 30 ppm increased the degradation efficiency gradually from 93.7% to 98.7%. When the concentration was 40 ppm, the degradation activity decreased to 98.1. This could be explained based on the saturation of all active sites on the surface. Thus, increase in MO concentration will not increase the rate, as the active sites of the FeNB become the limiting factor for the reaction. Interestingly, Figure 6D shows the negative effect of the volume of H2O2 added to the reaction mixture. Increasing H2O2 from 1 mL to 5 mL resulted in decreasing degradation from 99.5% to 98.1%. This could be related to some competition effect between H2O2 and MO for the active adsorption sites on the FeNP, and thus affects as an inhibitor for the catalyst at high concentrations.
Figure 7A shows the effect of 0.1 g of FeNP on the pH of 20 mL of 0.1 M NaCl solution with an initial pH within 2–12. The Figure clearly shows the buffering effect of the FeNP within this pH range. Accordingly, for any solution pHi within this range, the pHe will be constant and equal to pHZC. Figure 7A shows that the FeNP has a pHZC of 4.8, which indicates that this FeNP would be a good candidate for removing MO by adsorption only if the solution pH was set at a value less than 4.8 since the FeNP surface is expected to have a positive charge in any solution with pH value lower than 4.8 and since MO is an anionic dye, it is expected to be attracted to the positive surface.
Figure 7B shows the dependence of FeNP adsorption performance on the solution pH. Both MO adsorption percentage (R%) and capacity (q) decrease by increasing solution pH from 2 to 12. Very week adsorption was observed when the solution pH was higher than 10. This is mainly because this high pH will deprotonate the FeNP surface and thus it will bear a negative charge. Accordingly, MO anions will suffer strong repulsive forces with the negative surface, and consequently, hinder MO reaching to the surface. At pH of 10 about 4.6% removal was attained equivalent to 3.7 mg/g adsorption capacity. In contrast, by decreasing solution pH from 10 to 2, the FeNP surface gains a positive charge and will attract the negative MO anions leading to a higher adsorption capacity. Figure 7B shows that the maximum MO adsorption capacity (19.3 mg/g) was achieved at a pH of 2.2 with 24.2% removal efficiency corresponding to 19 mg/g adsorption capacity.

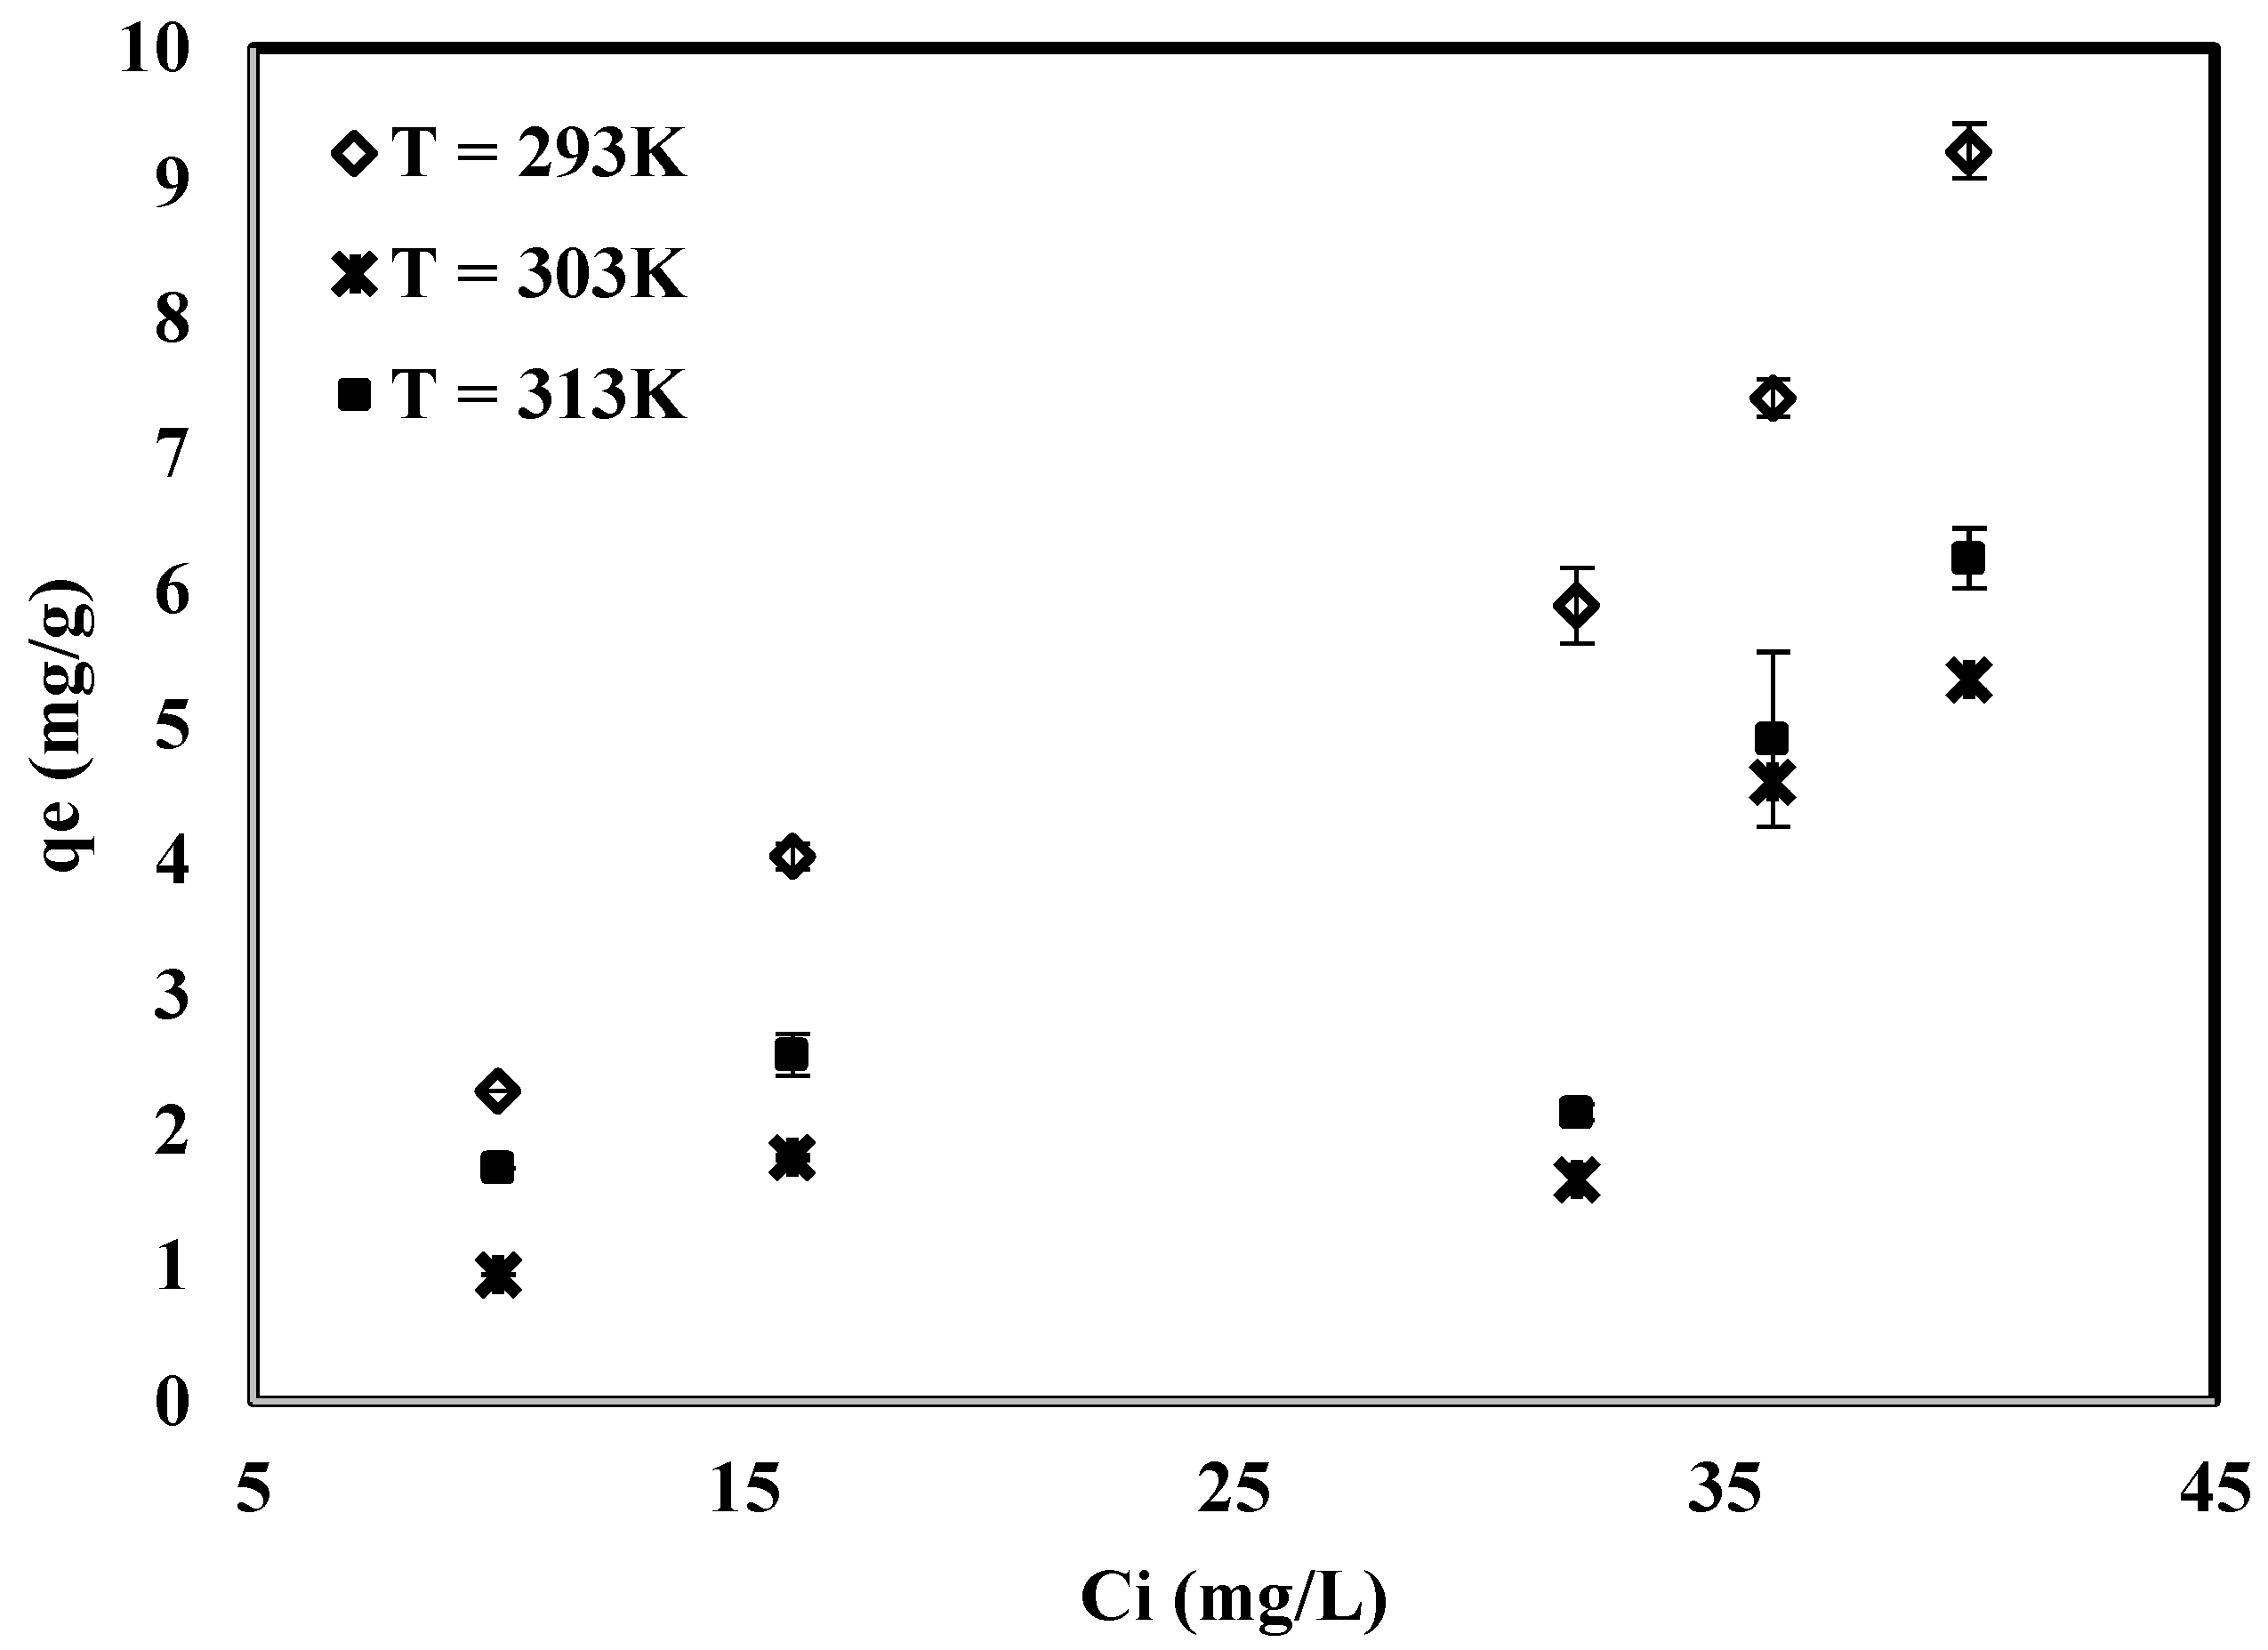
3.6. Effect of Temperature and MO Concentration on Adsorption

To examine the dependence of adsorption efficiency on MO concentration, FeNP was used to adsorb MO from solutions with different concentrations. The adsorption capacity was determined from the following equation:
  q e = ( C i C e ) V m
where qe, Ci, and V, and m are for equilibrium adsorption capacity (mg/g), initial concentration (mg/L), solution volume (L), and FeNP mass (g), respectively.
Figure 8 shows that, for the three temperatures studied, higher MO adsorption capacity was achieved by increasing initial MO concentration. This is mainly because diffusion of MO molecules from bulk solution to the FeNP surface increases by increasing MO concentration, and thus, more MO approach active sites on FeNP surface leading to higher adsorption capacity. Moreover, Figure 8 shows that increasing temperature resulted in lower adsorption efficiency. That is, MO adsorption on FeNP is an exothermic process, with a higher possibility of physical adsorption to occur. The maximum adsorption capacities reported in this work are 9.24 mg/g, 6.23 mg/g, and 5.33 mg/g at 293 K, 303 K, and 313 K, respectively.

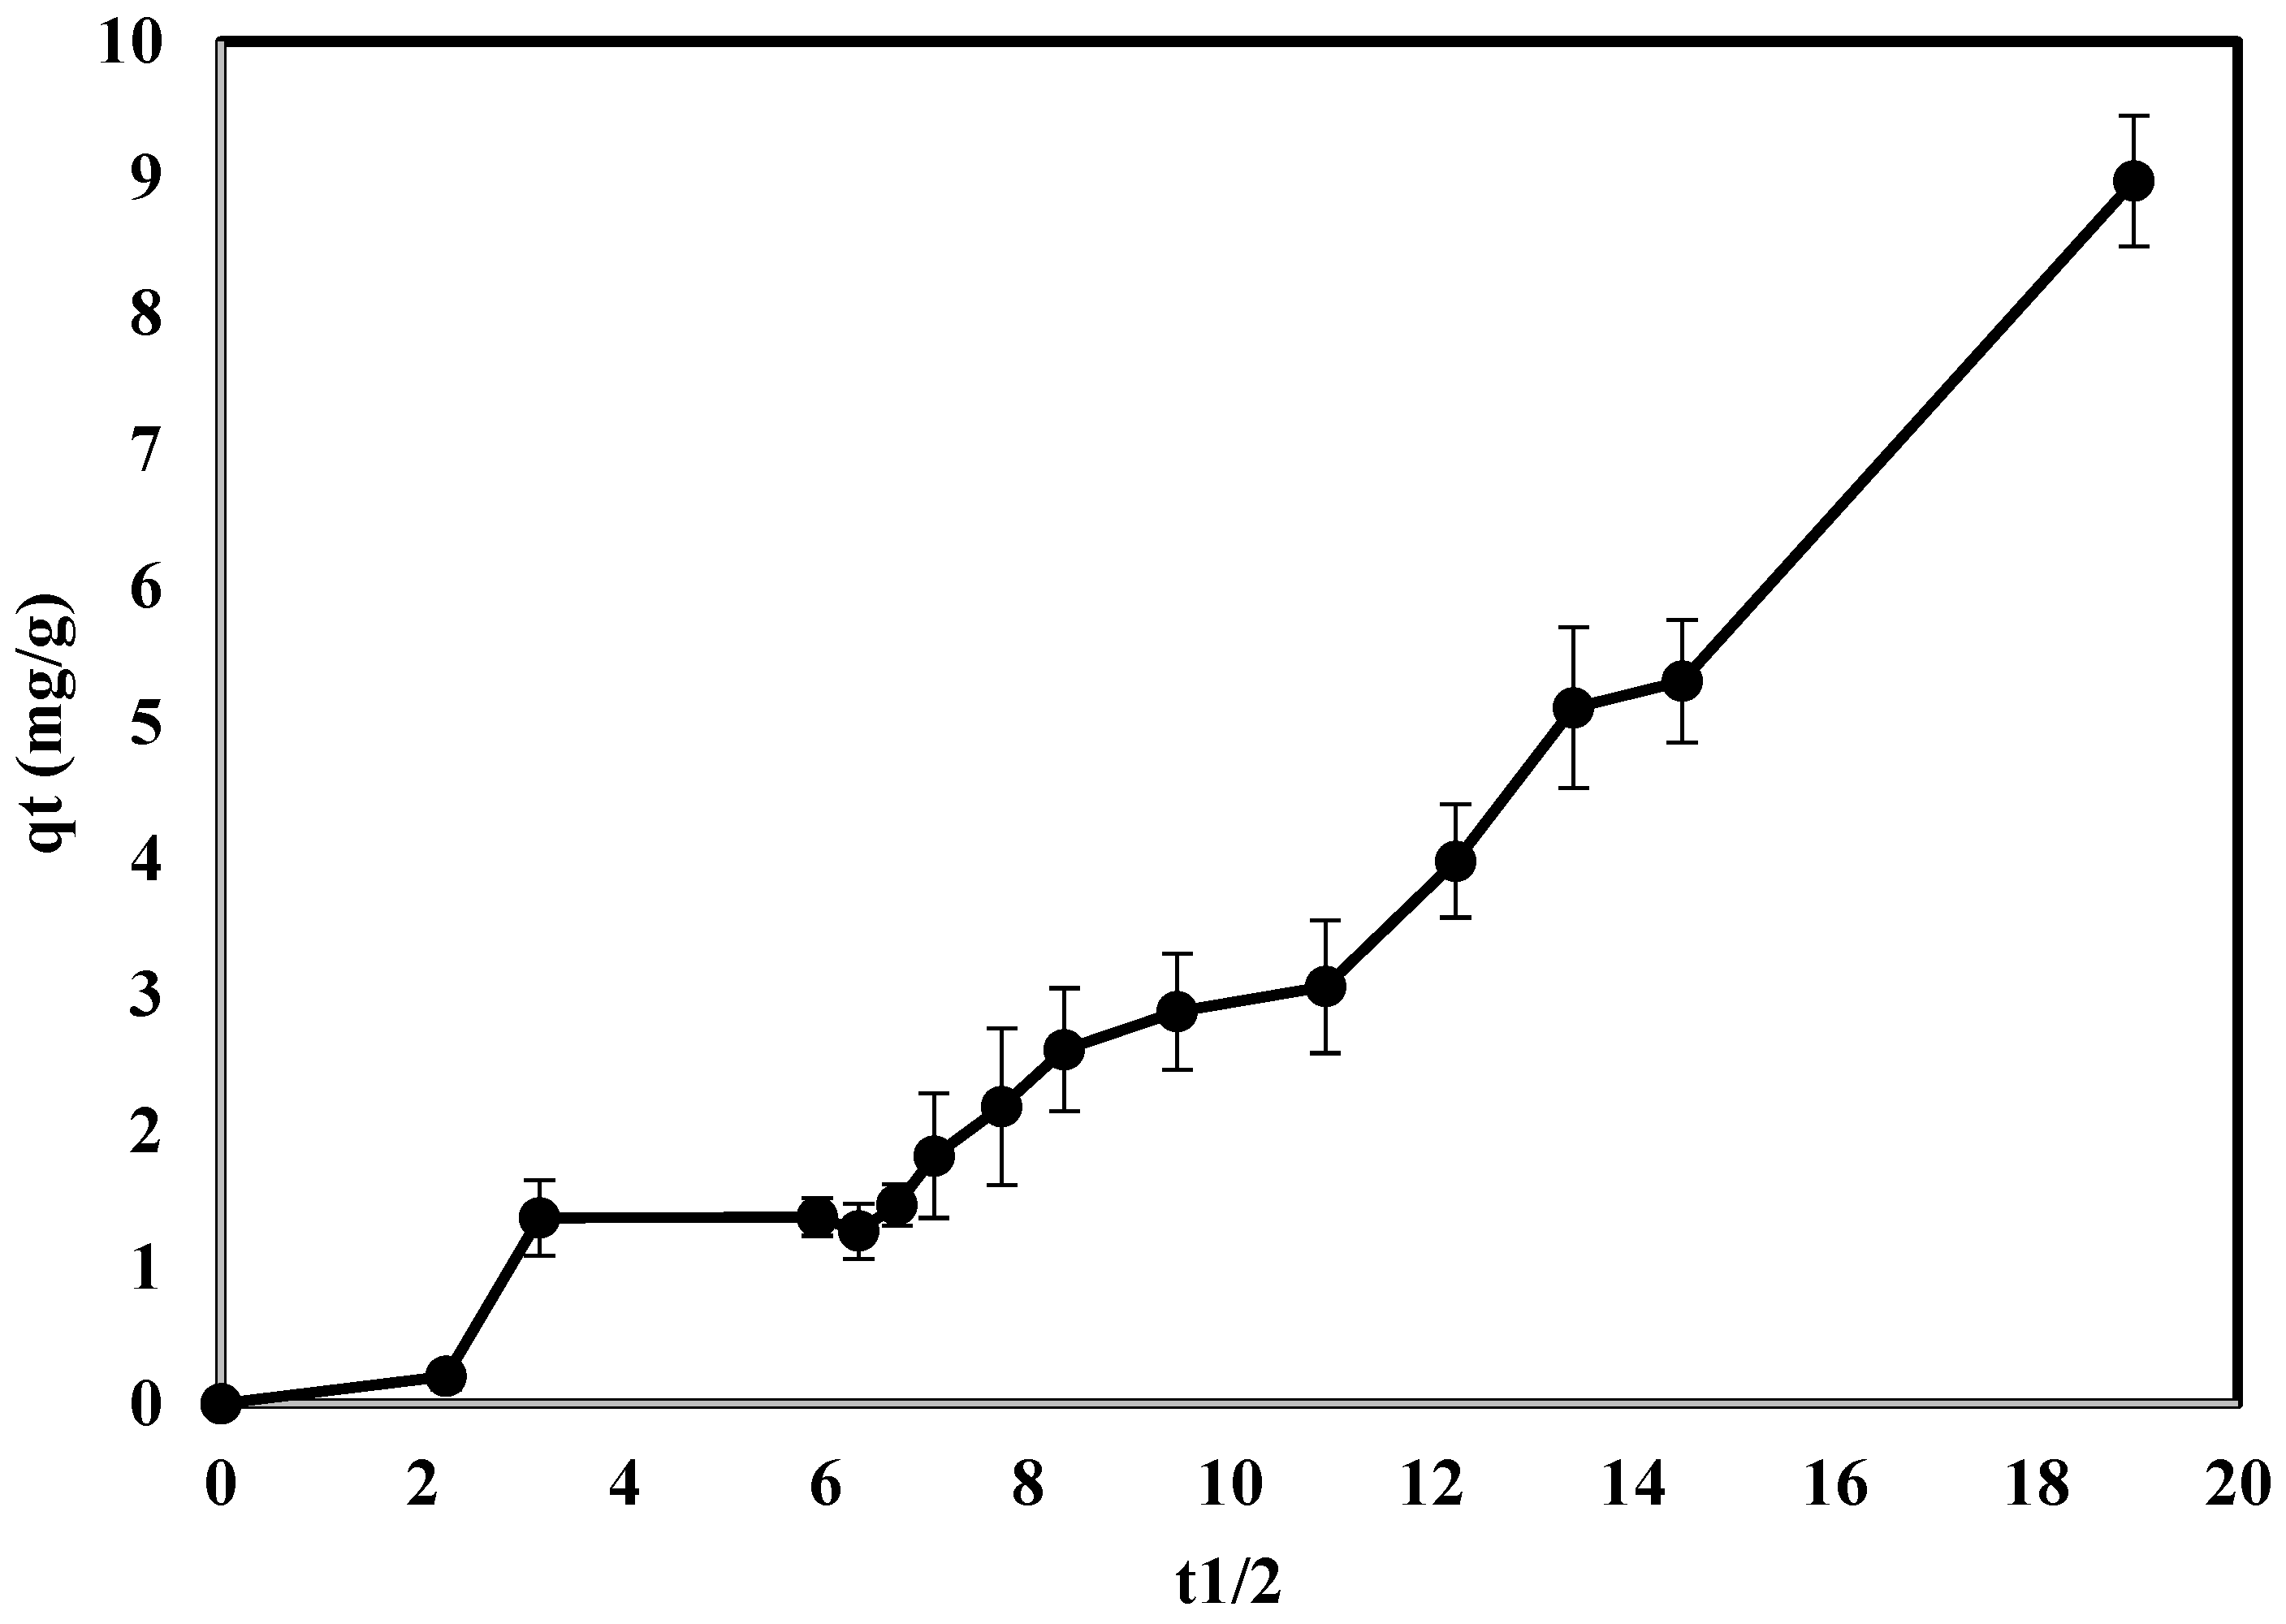
3.7. Kinetic Analysis

MO uptake versus the time at 293, 303, and 313 K was investigated for MO concentration of 40 ppm. Figure 9 shows that the adsorption capacity was very low at 303, and 313 K with less than 2% MO removal in 6 h. On the other hand, 12% removal after 6 h with an uptake capacity of 9 mg/g, and about 22% removal after 24 h (not shown in the graph) corresponding to 17 mg/g was achieved when operating at 293 K. This indicates an exothermic nature of MO adsorption on FeNP. The relatively slow MO uptake at 293 K is mainly because of the FeNP agglomeration. Therefore, the availability and the easily accessible adsorption sites were very limited. After a time of stirring the FeNP in the acidic solution of MO (pH = 4), the nanoparticles started to be separated under the peptization effect of the acidic medium as the surface will gain a positive charge. Accordingly, particles will repel each other, preventing agglomeration and increasing the available adsorption sites and that is why adsorption capacity did not stabilize during adsorption time. This was visually evidenced from the conversion of coarse FeNP agglomerated particles into colloidal solution with very small particle size as shown in Figure 10, which shows the change of solution color during the adsorption process from orange to black because of black FeNP dispersion.
Figure 11 displays the intraparticle model, specifically: q (mg/g) vs. t1/2. It is obvious from the figure that the adsorption of MO happens in multi-stages. The rate of adsorption in each stage depends on the diffusion of MO from the bulk solution to the FeNP surface. At the beginning, the FeNP were aggregated due to a known nanoparticles phenomenon, which is a challenging in the applications of these materials as it leads to a huge loss of active surface area. Aggregation occurs directly as particles are created as a result of the direct mutual attraction between particles via van der Waals forces, chemical bonding, or magnetic properties in FeNP [28]. Approaches for avoiding aggregation includes modifying the surface with a charge to separate particles by electrostatic repulsions or particle coating with capping agents. Figure 11 clearly indicates the importance surface charge in the control of the aggregation of nanoparticles and accordingly on its adsorption capacity.
The slope of qt vs. t1/2 plot change significantly because of the occupation of easily accessible adsorption sites on the external FeNP surface. At this stage, particles started to gain a positive charge since it is placed in a medium with pH < pHzc, and thus, started to be separated from each other, once again the adsorption rate increase as the new surface area has been created by peptization effect of the acidic medium. Accordingly, more MO can be adsorbed. As stirring in acidic medium continue for a longer time, more peptization occurs and more active adsorption sites become available for adsorption, this may explain not reaching equilibrium even after 24 h of stirring.

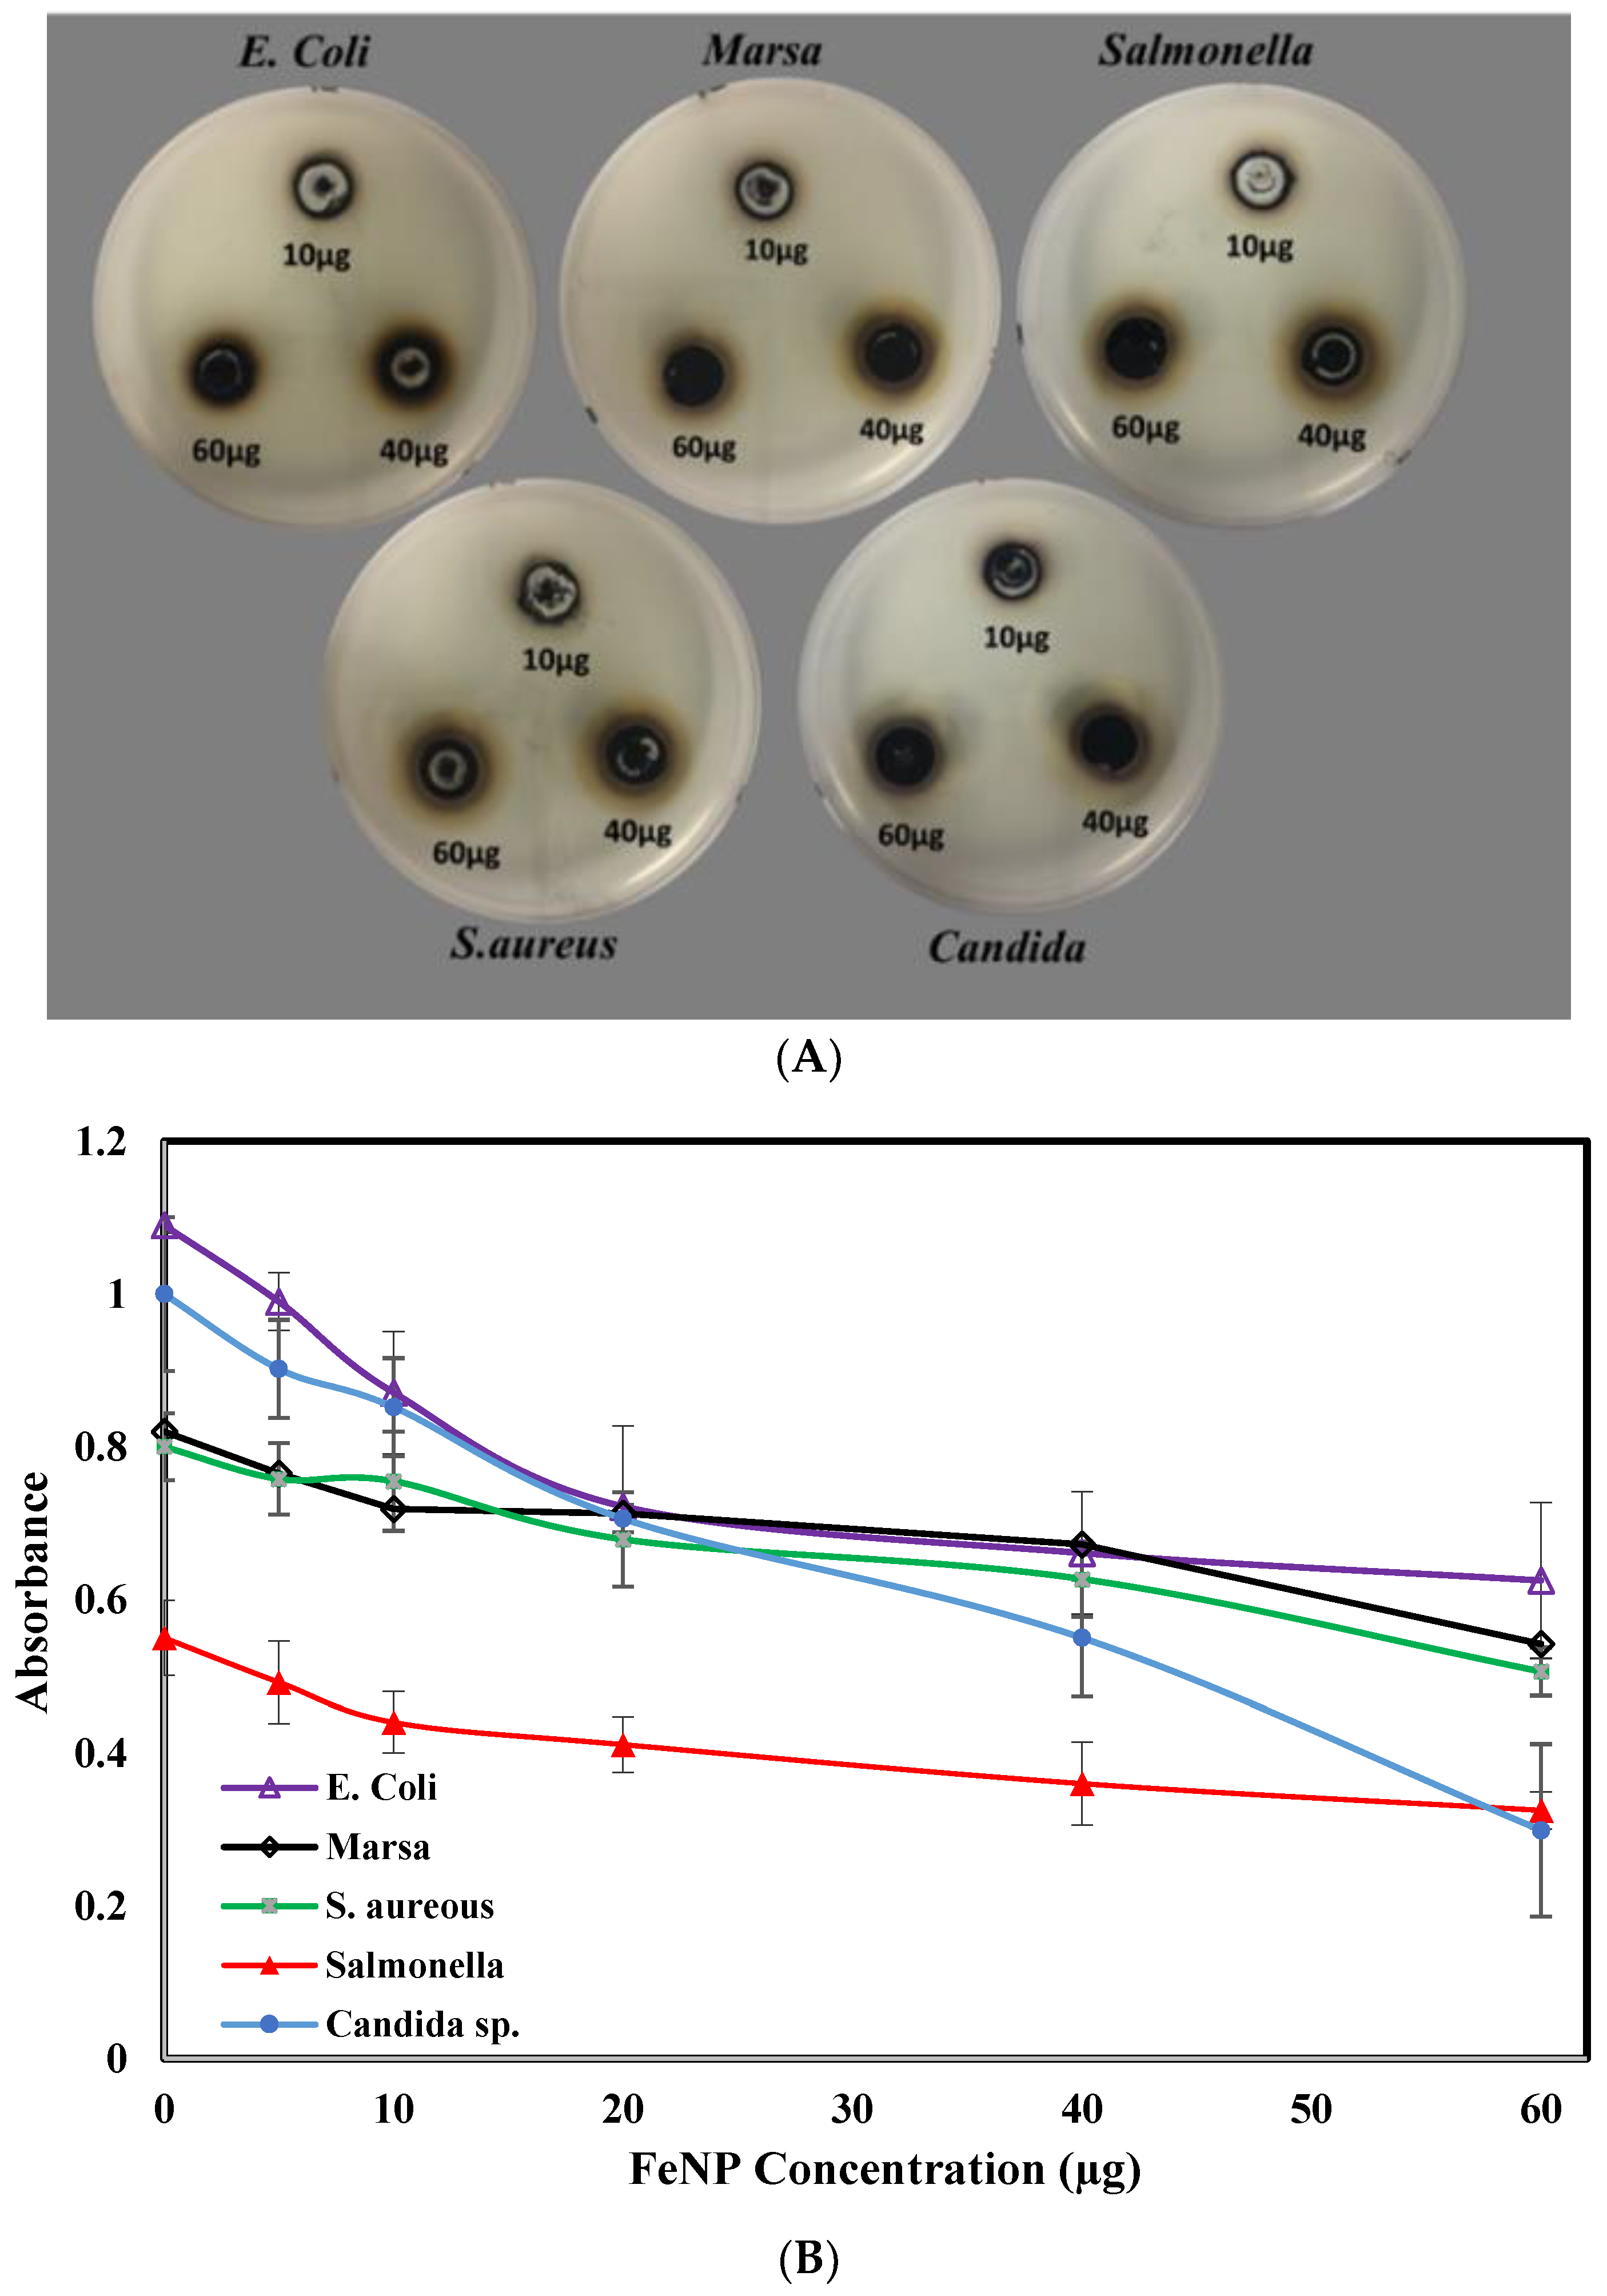
3.8. FeNP Antimicrobial Activity

FeNP produced from Acacia nilotica seedless pods extract antimicrobial activity was examined against four species of human pathogenic bacteria, and these are; Escherichia coli, Staphylococcus aureus, Salmonella, Marsa, and Candidia. It was interesting to observe the great ability of FeNP to inhibit the growth of the test organisms. Most of the tested microorganisms affected severely by FeNP; the inhibitory potentials of FeNP can be expressed in a descending order as follow; Candida, Staphylococcus aureus, Salmonella, Marsa, and Esherichia coli based on the diameter of the inhibition zone and the absorption at 600 nm (Table 2, Figure 12). It worth to mention that FeNP antimicrobial propensity observed clearly at higher concentration (20, 40, and 60 µg), while at lower concentrations weak activity was detected. This is inconsistent with other studies on iron nanoparticles antimicrobial activity reported that iron nanoparticles have antibacterial activity at higher concentrations, and this activity can be further moderated by changing the surface potential and accessible surface functional groups. The changes cause a change in the interaction pattern at the FeNP bacteria interface, hence play a crucial role in determining the antimicrobial propensity of FeNP [29].

4. Conclusions

Acacia nilotica seedless pods extract was used as reduction and stabilization agent for the synthesis of iron nanoparticles (FeNP). Formation of FeNP was confirmed by different characterization techniques such as EDS, UV, FT-IR, and XRD. SEM and TEM imaging reveal that FeNP tends to aggregate into irregular morphology with an average particle size of 230 nm as obtained by DLS. The XRD pattern of the FeNP revealed a crystalline structure of the nanoparticles α-Fe2O3-NP. The synthesized FeNP was tested for oxidation degradation and adsorption of MO. Degradation efficiency was found to increase by increasing amount of MO and decrease by increasing the H2O2 added. Degradation was effective with 90% removal within the first two hours and complete removal of the dye after three hours within the studied conditions. On the other hand, the maximum MO adsorption capacity was achieved at a pH of 2.2 with 24.2% removal efficiency corresponding to 19 mg/g adsorption capacity. Furthermore, MO adsorption on FeNP is an exothermic process, with higher possibility of physical adsorption to occur with a maximum adsorption capacity achieved at 293 K. The synthesized FeNP has the potential to effectively terminate the pathogenicity of several human opportunistic pathogens and belong to gram-negative and gram-positive bacteria and one species of Candida as well.

Author Contributions

Da’na E. and Taha A. conceived and designed the experiments; Da’na E. and Taha A. performed the experiments; Da’na E. and Taha A. analyzed the data; Afkar E. contributed in the experimental and analysis of the antimicrobial activity part; Da’na E. wrote the paper.

Acknowledgments

Authors acknowledge King Faisal University for the support of this research. Furthermore, would like to thank Syed Ahmed Ghazanfar (Physics department, King Faisal University) for performing SEM and EDS analysis, Walid N. Al Melhem and Hany Alrasasi (College of Medicine, King Faisal University) for performing TEM analysis.

Conflicts of Interest

The authors declare no conflict of interest.

References

  1. Saif, S.; Tahir, A.; Chen, Y. Green synthesis of iron nanoparticles and their environmental applications and implications. Nanomaterials 2016, 6, 209. [Google Scholar] [CrossRef] [PubMed]
  2. Bharadwaj, M.S.; Prem, K.; Satyanandam, K.; Engg, C. Green synthesis of iron nanoparticles using albizia lebbeck leaves for synthetic syes decolorization. Int. J. Sci. Eng. Technol. Res. 2016, 5, 3429–3434. [Google Scholar]
  3. Badmapriya, D.; Asharani, I.V. Dye degradation studies catalysed by green synthesized iron oxide nanoparticles. Int. J. ChemTech Res. 2016, 9, 409–416. [Google Scholar]
  4. Shih, Y.; Tso, C.; Tung, L. Rapid degradation of methyl orange with nanoscale zerovalent iron particles. J. Environ. Eng. Manag. 2010, 20, 137–143. [Google Scholar]
  5. Ci, M.; Kich, Ę.Ż. Controlled synthesis of iron oxide nanoparticles used as an efficient heavy metal ions adsorbent. Proc. ECOpole 2015, 9, 14–16. [Google Scholar] [CrossRef]
  6. Saranya, S.; Vijayarani, K.; Pavithra, S. Green synthesis of iron nanoparticles using aqueous extract of musa ornate flower sheath against Pathogenic Bacteria. Indian J. Pharm. Sci. 2017, 79, 688–694. [Google Scholar] [CrossRef]
  7. Veeramanikandan, V.; Madhu, G.C.; Pavithra, V.; Jaianand, K.; Balaji, P. Green synthesis, characterization of iron oxide nanoparticles using leucas aspera leaf extract and evaluation of antibacterial and antioxidant studies. Int. J. Agric. Innov. Res. 2017, 6, 242–250. [Google Scholar]
  8. Kanagasubbulakshmi, S.; Kadirvelu, K. Green synthesis of iron oxide nanoparticles using lagenaria siceraria and evaluation of its antimicrobial activity. Def. life Sci. J. 2017, 2, 422–427. [Google Scholar] [CrossRef]
  9. Behera, S.S.; Patra, J.K.; Pramanik, K.; Panda, N.; Thatoi, H. Characterization and evaluation of antibacterial activities of chemically synthesized iron oxide nanoparticles. World J. Nano Sci. Eng. 2012, 02, 196–200. [Google Scholar] [CrossRef]
  10. Shahwan, T.; Abu Sirriah, S.; Nairat, M.; Boyaci, E.; Eroĝlu, A.E.; Scott, T.B.; Hallam, K.R. Green synthesis of iron nanoparticles and their application as a fenton-like catalyst for the degradation of aqueous cationic and anionic dyes. Chem. Eng. J. 2011, 172, 258–266. [Google Scholar] [CrossRef]
  11. Wang, C.; Liu, H.; Sun, Z. Heterogeneous photo-fenton reaction catalyzed by nanosized iron oxides for water treatment. Int. J. Photoenergy 2012, 2012, 1–10. [Google Scholar] [CrossRef]
  12. Machala, L.; Zboril, R.; Gedanken, A. Review articles. J. Phys. Chem. B 2007, 111, 4003–4018. [Google Scholar] [CrossRef] [PubMed]
  13. Maliar, T.; Bozenko, J.; Cesiulis, H.; Prosycevas, I. Electrochemical aspects of the synthesis of iron particles. Mater. Sci. 2012, 18, 223–227. [Google Scholar] [CrossRef]
  14. Rashmi, S.; Madhu, G.; Kittur, A.; Suresh, R. Synthesis, characterization and application of zero valent iron nanoparticles for the removal of toxic metal hexavalent chromium from aqueous solution. Int. J. Curr. Eng. Technol. 2013, 37–42. [Google Scholar]
  15. Dhuper, S.; Panda, D.; Nayak, P.L. Green synthesis and characterization of zero valent iron nanoparticles from the leaf extract of mangifera indica. Nano Trends A J. Nanotechnol. Its Appl. 2012, 13, 16–22. [Google Scholar] [CrossRef]
  16. Saif, S.; Tahir, A.; Chen, Y. Green synthesis of Iron nanoparticles and their environmental applications and implications. Nanomaterials 2016, 6, 209. [Google Scholar] [CrossRef] [PubMed]
  17. Ray, Ph.Z.; Shipley, H.J. Introduction. RSC Adv. 2015, 2, 1–60. [Google Scholar]
  18. Ge, Y.; Zhang, Y.; Xia, J.; Ma, M.; He, S.; Nie, F.; Gu, N. Effect of surface charge and agglomerate degree of magnetic iron oxide nanoparticles on KB cellular uptake in vitro. Colloids Surf., B. 2009, 73, 294–301. [Google Scholar] [CrossRef] [PubMed]
  19. Bansal, V.K.; Goel, R.K. Gastroprotective effect of Acacia nilotica young seedless pod extract: Role of polyphenolic constituents. Asian Pac. J. Trop. Med. 2012, 5, 523–528. [Google Scholar] [CrossRef]
  20. Kaur, G.; Sharma, A.K.; Karnwal, A. Antimicrobial activity of Acacia nilotica against Various Clinical Isolates. Elixir Appl. Botany 2016, 97, 42260–42262. [Google Scholar]
  21. Cheera Prasad, K.; Sreenivasulu, V.; Govinda, S.; Himageerish kumar, K.; Deepa, T.; Vasantha Jyothi, N.V.V.; Venkateswarlu, P. Biosynthesis of the Fe3O4 nanoparticles using Acacia nilotica leaf extract and their effect on degradation of congo red dye in aqueous solution. Trends Text. Eng. Fash. Technol. 2018, 1, 1–4. [Google Scholar]
  22. Majumdar, R.; Bag, B.G.; Maity, N. Acacia nilotica (Babool) leaf extract mediated size-controlled rapid synthesis of gold nanoparticles and study of its catalytic activity. Int. Nano Lett. 2013, 3, 53–59. [Google Scholar] [CrossRef]
  23. Da’na, E.; Sayari, A. Adsorption of copper on amine-functionalized SBA-15 prepared by co-condensation: Equilibrium properties. Chem. Eng. J. 2011, 166, 445–453. [Google Scholar] [CrossRef]
  24. Percival, S.L.; Bowler, P.G.; Russell, D. Bacterial resistance to silver in wound care. J. Hosp. Infect. 2005, 60, 1–7. [Google Scholar] [CrossRef] [PubMed]
  25. Devatha, C.P.; Kumar, A.; Katte, S.Y. Green synthesis of iron nanoparticles using different leaf extracts for treatment of domestic waste water. J. Clean. Prod. 2016, 139, 1425–1435. [Google Scholar] [CrossRef]
  26. Vadivel, N.; Rajendran, V.; Suriyaprabha, R.; Yuvakkumar, R. Catalytic effect of iron nanoparticles on heterocyst, protein and chlorophyll content of catalytic effect of iron nanoparticles on heterocyst. Int. J. Green Nanotechnol. 2012, 4, 326–338. [Google Scholar] [CrossRef]
  27. Kumar, B.; Smita, K.; Cumbal, L.; Debut, A. Biogenic synthesis of iron oxide nanoparticles for 2-arylbenzimidazole fabrication. J. Saudi Chem. Soc. 2014, 18, 364–369. [Google Scholar] [CrossRef]
  28. Li, D.; Kaner, R.B. Shape and aggregation control of nanoparticles: Not shaken, not stirred. J. Am. Chem. Soc. 2006, 128, 968–975. [Google Scholar] [CrossRef]
  29. Arakha, M.; Pal, S.; Samantarrai, D.; Panigrahi, T.K.; Mallick, B.C.; Pramanik, K.; Mallick, B.; Jha, S. Antimicrobial activity of iron oxide nanoparticle upon modulation of nanoparticle-bacteria interface. Sci. Rep. 2015, 5, 1–12. [Google Scholar] [CrossRef] [PubMed]
Figure 1. Seedless pods of Acacia nilotica (a); FeSO4 solution (b); Acacia nilotica extract (ANE) (c); and the mixture of both (d).
Applsci 08 01922 g001
Figure 2. UV-Vis spectrum of iron nanoparticles (FeNP), ANE, and FeSO4.
Applsci 08 01922 g002
Figure 3. (A) FTIR spectrum of FeNP and ANE; and (B) Energy Dispersive Spectroscopy (EDS) analysis of the synthesized FeNP.
Applsci 08 01922 g003aApplsci 08 01922 g003b
Figure 4. (A) Scanning electron microscopy (SEM) image at a magnification of 15 × 104 (a), and 25 (b), transmission electron microscopy (TEM) image at a magnification of 4 × 10⁵ (c), and 2 × 10⁵ (d) for FeNP; (B) FeNP particles size distribution obtained by Image j analysis of TEM images, and (C) FeNP particles size distribution obtained by dynamic light scattering (DLS) analysis.
Applsci 08 01922 g004aApplsci 08 01922 g004b
Figure 5. X-Ray diffraction (XRD) pattern of FeNP.
Applsci 08 01922 g005
Figure 6. (A)The degradation of MO as a function of time; (B) Pseudo first-order kinetic model of the degradation reaction; (C) The degradation of MO as a function of initial MO concentration; and (D) The degradation of MO as a function of a volume of H2O2.
Applsci 08 01922 g006
Figure 7. (A) Effect of pHi on pHe for a 20 mL solution of 0.1 M NaCl containing 0.01 g of FeNP; and (B) effect of solution pH on adsorption capacity (q) and removal efficiency (R).
Applsci 08 01922 g007
Figure 8. Effect of MO initial concentration on adsorption capacity (q).
Applsci 08 01922 g008
Figure 9. Effect of time on MO removal efficiency (R%) at different temperatures.
Applsci 08 01922 g009
Figure 10. FeNP in MO solution after stirring at for: 5 min (a); 30 min (b); 60 min (c); and 120 min (d).
Applsci 08 01922 g010
Figure 11. Intraparticle diffusion model.
Applsci 08 01922 g011
Figure 12. (A) Ability of the synthesized FeNP to inhibit the bacterial growth; and (B) growth profile of various pathogenic species inoculated against different concentrations of FeNP.
Applsci 08 01922 g012
Table 1. Oxidation degradation of methyl orange conditions used and results.
ExperimentCi (ppm)VH2O2 (mL)Time (h)Ce (ppm)Removal Efficiency (R %)
14050.512.90067.6
240516.04984.9
340523.39991.5
440530.75598.1
540540.23999.4
640130.21699.5
740230.34199.1
840330.36899.1
940430.47198.8
1030530.37698.7
1120530.43197.8
1210530.46595.4
135530.31793.7
Table 2. Antimicrobial effect of Acacia nilotica FeNP on human pathogens.
FeNP (µg)Escherichia coliMarsaSalmonellaStaphylococcus aureusCandida
1011 ± 0.2 mm17 ± 0.2 mm19 ± 0.2 mm17 ± 0.1 mm17 ± 0.3 mm
4015 ±0.1 mm20 ± 0.2 mm22 ± 0.1 mm22 ± 0.1 mm25 ± 0.1 mm
6017 ± 0.1 mm24 ± 0.1 mm23 ± 0.1 mm25 ± 0.1 mm25 ± 0.1 mm

