Article

Towards a Reliable Identification of Deficient Code with a Combination of Software Metrics

Faculty of Electrical Engineering and Computer Science, University of Maribor, Koroška cesta 46, 2000 Maribor, Slovenia
*
Author to whom correspondence should be addressed.
Appl. Sci. 2018, 8(10), 1902; https://doi.org/10.3390/app8101902
Submission received: 26 September 2018 / Revised: 8 October 2018 / Accepted: 11 October 2018 / Published: 12 October 2018

Abstract

:

Featured Application

The paper presents a novel approach for the identification of deficient source code, based on applying a majority function upon the combination of software metrics.

Abstract

Different challenges arise while detecting deficient software source code. Usually a large number of potentially problematic entities are identified when an individual software metric or individual quality aspect is used for the identification of deficient program entities. Additionally, a lot of these entities quite often turn out to be false positives, i.e., the metrics indicate poor quality whereas experienced developers do not consider program entities as problematic. The number of entities identified as potentially deficient does not decrease significantly when the identification of deficient entities is carried out by applying code smell detection rules. Moreover, the intersection of entities identified as allegedly deficient among different code smell detection tools is small, which suggests that the implementation of code smell detection rules are not consistent and uniform. To address these challenges, we present a novel approach for identifying deficient entities that is based on applying the majority function on the combination of software metrics. Program entities are assessed according to selected quality aspects that are evaluated with a set of software metrics and corresponding threshold values derived from benchmark data, considering the statistical distributions of software metrics values. The proposed approach was implemented and validated on projects developed in Java, C++ and C#. The validation of the proposed approach was done with expert judgment, where software developers and architects with multiple years of experiences assessed the quality of the software classes. Using a combination of software metrics as the criteria for the identification of deficient source code, the number of potentially deficient object-oriented program entities proved to be reduced. The results show the correctness of quality ratings determined by the proposed identification approach, and most importantly, confirm the absence of false positive entities.

1. Introduction

Delivering a high-quality product should be the main goal of every software project. The quality of software depends on activities within the software development process [1], part of which is the quality assessment phase, including source code analysis. Quality in software engineering is usually understood as an absence of errors within the software [2]. In addition to this, it is also important to consider deficient source code. Fowler et al. [3] list several smells within a source code. Code smell is a structural characteristic of software that can indicate code or design problems and can have an impact on software maintenance and growth [3,4]. Additionally, it indicates the presence of anti-patterns and the use of inappropriate development practices [5]. Though code smells do not cause an interruption in execution, they can present a challenge at a certain step of further evolution. Additionally, when ignored, it can result in the occurrence of defects [6].
Since deficient code impacts different parts of the development process, it is important that we treat it properly. This starts with the reliable identification of a deficient code, which, as a result, offers a manageable number of potentially deficient program entities. Different strategies for detecting code smells exist, among others it can be detected with software metrics [7]. However, only a single dimension of quality is evaluated when using an individual software metric or criterion within the identification. This usually results in a large number of potentially deficient program entities and many of them turn out to be false positives [7,8,9], meaning, software metrics indicate a deficient quality in the evaluated program entity but developers do not perceive the entity as problematic.
Code smell detection rules are an attempt at combining different software metrics. In related work [8,10], these rules present a prevailing way of identifying deficient code, aimed at finding different types of code smells. Although many studies are available, it is hard to detect a generally accepted composition and validation of detection rules. This presents a challenge for the reliable identification of deficient entities. Also, different interpretations of detection rules exist [11] and a comparison between potentially deficient entities identified with different code smell detection tools reveals very small intersections in resulting sets of potentially deficient program entities [12].
A very large number of allegedly deficient program entities are identified [12] using existing code smell detection tools. This represents a challenge, especially within the context of the manual review that follows. To be precise, the automatic validation of identified entities is not possible as confirmed by Fontana et al. [8]. Therefore, the inclusion of experts to perform a manual review is necessary. It is crucial to develop an approach that would provide a manageable number of detected potentially deficient program entities and would reduce false positive cases to a minimum.
To address the above-mentioned challenges, we propose a novel approach for the identification of deficient source code, that is based on applying a majority function upon the combination of software metrics. Although attempts at combining multiple software metrics within software evaluation can be found within the context of code smell detection rules, the use of majority functions for the quality evaluation of program entities has not been used yet. The proposed identification is based on the assumption that the overall quality of a program entity that exceeds the threshold value of an individual software metric is not necessarily deficient. However, when the assessed program entities exceed threshold values for more software metrics, evaluating different quality aspects, the probability that an evaluated program entity really contains a deficient code, increases. The presented research study was guided by the following research question: Does the identification approach based on the majority function applied on the combination of software metrics identify a deficient source code in a reliable way? The aim is to identify program entities with deficient overall quality and not on identifying particular types of code smells or even faulty classes. The proposed approach was implemented and evaluated on the three major object-oriented programming languages Java, C++ and C#. The process of identifying deficient source code and the quality rating of detected software classes was performed with the proposed approach. Expert judgment was used in order to validate the proposed approach. For this purpose, software developers and software architects with multiple years of experience assessed selected program entities within a performed study. Their evaluation was compared to the results, obtained by the proposed novel approach for the identification of deficient source code based on a combination of software metrics using a majority function. The comparison confirmed the correctness of the proposed approach.
The rest of the paper is organized as follows. The research background and related work are presented first. Next, the proposed novel approach is described in detail, followed by its implementation on object-oriented programming languages. The division of software metrics within different quality aspects for evaluating object-oriented software classes are proposed next. Afterwards, the identification of deficient classes is illustrated and the results of the validation of the performed identification based on expert judgment is presented. Furthermore, a reliability analysis of the proposed approach is provided. Finally, limitations and threats to validity are presented.

2. Research Background and Related Works

Software metrics are functions that use software data as an input, provide independent numeric values as an output and can be interpreted as the level at which software suits the chosen quality attribute [13]. The measurement of software metrics is carried out within a quality assurance process [14] and constitutes a key component in successful software engineering [15]. In the latter case, it is recommended to follow the prescribed guidelines and by using software metrics it is possible to control the achieved level of software product quality [16].
Different types of metrics quantify different aspects of software development [16]. Misra et al. [17] list several object-oriented software metrics collections, like Chidamber and Kemerer (CK) metrics, Lorenz and Kidd metrics and MOOD software metrics. A variety of software metrics is used in practice and it is essential to know the connection between each metric and different software quality aspects. Furthermore, the meaningful use of software metrics is possible only with reliable threshold values [16,18]. The more reliable the thresholds are, the more accurately the quality can be evaluated.
Evaluating quality with software metrics thresholds is a known and accepted strategy [19]. The main motivation of deriving threshold values is to identify those program entities that can represent a potential risk [20,21,22]. In the literature, many different approaches are proposed for deriving metrics thresholds. The majority of studies identify threshold values with the goal of finding errors, such as in [23,24,25,26,27]. Only some of them, like the study by Fontana et al. [8], focus on finding code smells. Among methods that are used for calculating metrics thresholds there are also approaches that derive thresholds based on software metrics values acquired from benchmark data. Those approaches are used in [8,10,16,20,28,29,30] and as a result offer concrete threshold values that can be used in the process of software quality evaluation. Furthermore, with derived threshold values, it is possible to find and evaluate code smells adequately [8].
The detection of deficient program entities is a commonly discussed topic, but usually in the context of finding errors, like in [23,24,25,31]. Studies that identify code smells based on exceeding threshold values of software metrics can be found; however, they mostly detect code smell types presented by Lanza and Marinescu [16] with the use of code smell detection rules. Code smells are detected in a study by Fontana et al. [8], where also the calculation of threshold values for selected software metrics is presented. Identification is done with detection rules which are presented in [16] and no validation of acquired results is presented. Vale and Figueiredo [10] present the detection of code smells for software product lines. Ferreira et al. [18] identify poor classes within the context of experimental validation of the proposed threshold values. They also combine derived metrics within identification and point to a decreasing number of detected classes. However, no rules or more detailed proposal are available. Other papers presenting code smell detection strategies are listed by Sharma and Spinellis [7]. Among the classified detection methods there are also strategies based on software metrics, like [32,33,34,35]. However, again, studies focus on the identification of code smells using manually defined code smell detection rules.
Among the most known code smells are Brain Class, God Class, Brain Method and Feature Envy presented by Lanza and Marinescu [16]. They also present identification rules and some of them are implemented in Jdeodorand [36] and JSpIRIT [34]. The results of the conducted identification presented in [12], shows that the intersection between identified entities, using different detection methods and/or tools, is very small. The intersection within Jdeodorand, JSpIRIT and SonarQube was 2.70% when identifying God Class/Brain Class code smell and 6.08% when detecting Long Method/Brain Method. This can be the case due to the varying and nontransparent implementation of detection rules, which occurs despite the provided definitions. A study about code smell detection tools was also done by Paiva et al. [37]. It concluded that the comparison between tools is difficult, since each is based on a different but similar informal definition of code smells made by researchers or developers. This is the main reason an identification based on rules at this point does not present a reliable method for identifying code smells .
To the previously outlined problems we can also add challenges related to expert perceptions of defined code smells, which was a research domain in [11,38]. Therefore, our research moves away from frequently used types of code smells presented by Fowler et al. [3] and Lanza and Marinescu [16], and focuses on detecting deficient entities as program entities with a deficient overall quality. By examining an overall quality evaluated with a set of software metrics that assess different quality aspects and using a majority function, true positive program entities that indeed contain deficient code should be detected in a more reliable way, and, consequentially, the identification of false positive examples should be significantly reduced.

3. Proposed Theoretical Framework for the Identification of Deficient Source Code

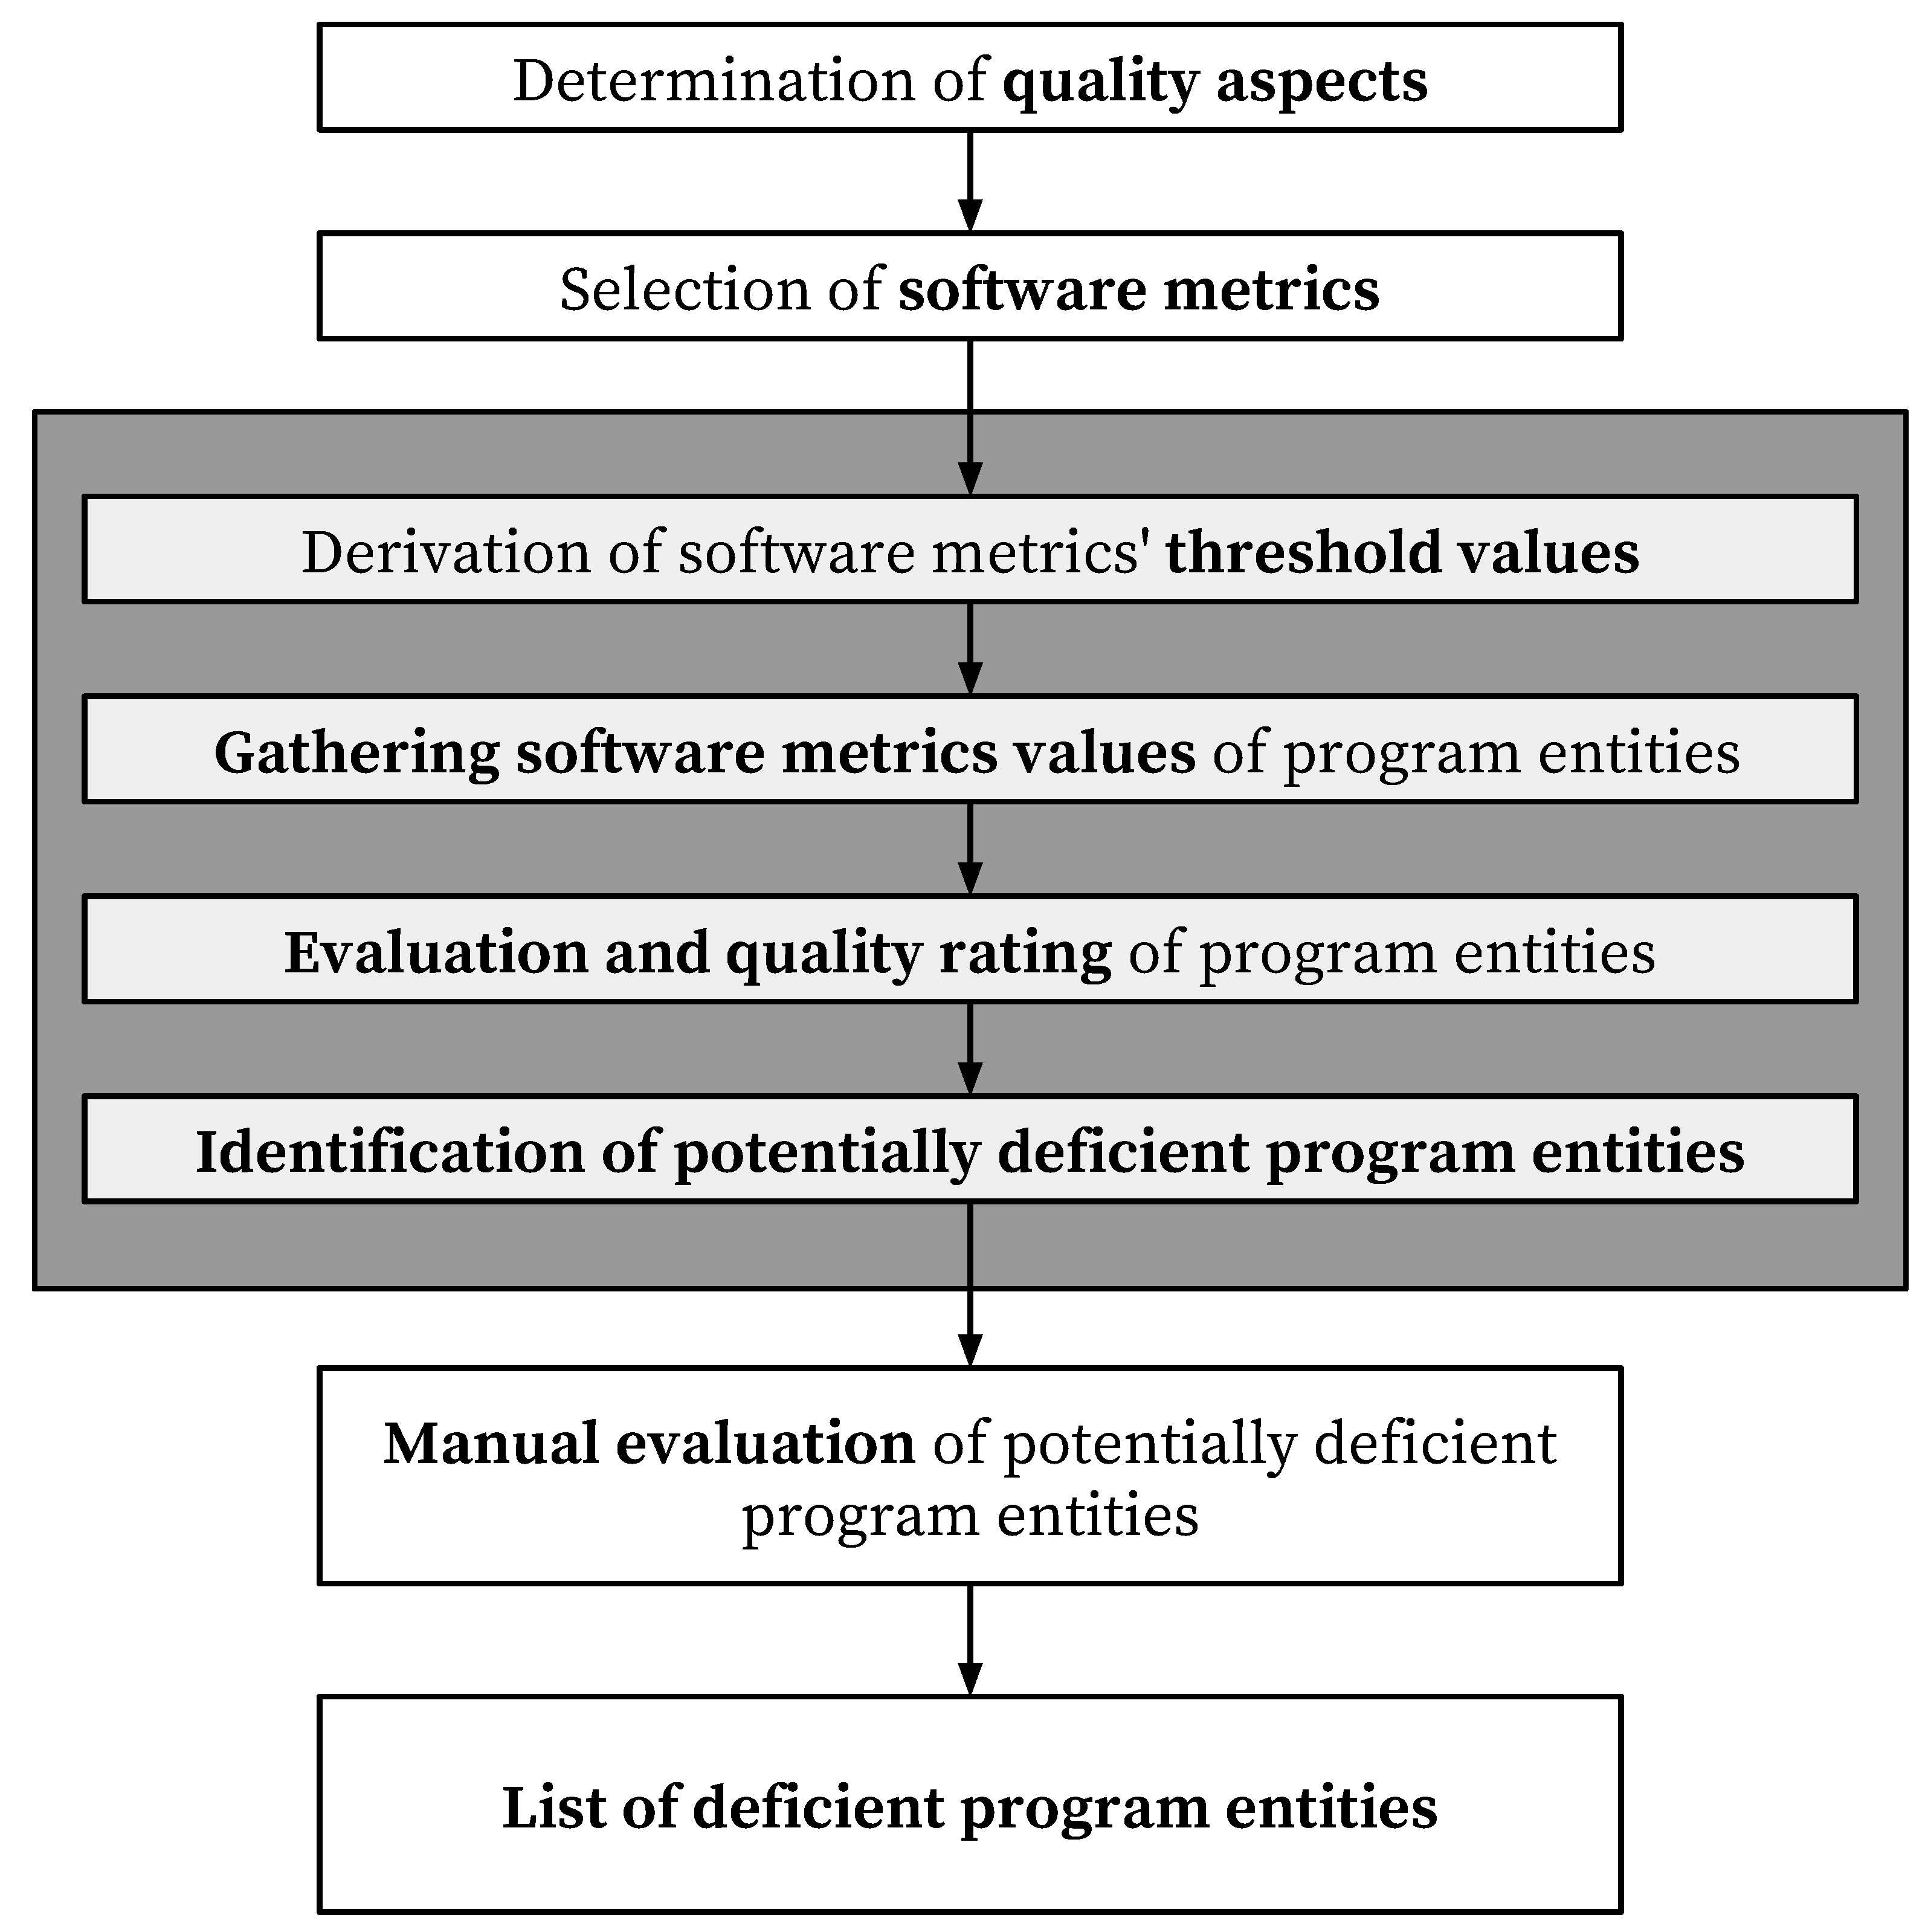
Based on the presented challenges we propose a novel approach for identifying deficient source code with a combination of software metrics and by applying the majority function. The main steps of the proposed approach are presented in Figure 1 in the colored shape, joined with other commonly used activities performed within the identification of deficient source code.
After setting the criteria, i.e., determining the quality aspects and selecting the individual software metrics, the proposed approach starts by deriving the threshold values for the selected software metrics. Then the actual values of selected software metrics are gathered for all the program entities. The evaluation and quality rating of program entities is done next, based on the gathered software metrics values and the derived thresholds. The last step of our proposed approach is the identification of entities that potentially include deficient source code, after which the identification of deficient entities may continue by manually reviewing the identified potentially deficient entities, providing a final list of assuredly deficient program entities. Although the first two and the last two steps are not a part of the proposed approach itself, they contribute to overall understanding of the identification approach.
The proposed approach arises from challenges connected to the identification of deficient program entities based on an individual software metric. The challenge was also recognized by Bouwers et al. [39] and Lanza and Marinescu [16]. If software metrics are used in isolation, it is difficult to characterize the software as a whole since each metric evaluates only a certain aspect of software [16]. As they noted, a balanced overview of the current state of software can be achieved by combining multiple metrics [39]. Consequently, it makes sense to combine related single metrics into categories, expressing different quality aspects. Finally, all these categories, each representing a special quality aspect of a software, can be combined into a single quality score.
This division constitutes a starting point for the proposed approach. After the determination of quality aspects that need to be covered during the evaluation, the appropriate software metrics are selected and assigned to each aspect. In general, the selection of software metrics and their division into quality aspects are not fixed and can be tailored to one’s needs. Specific software metrics could be added and/or existing metrics could be changed for the purpose of evaluating different aspects of software. After a set of specific software metrics is determined, their threshold values are derived which serve as a measure of whether a program entity can be considered as potentially deficient regarding a specific metric.
With the selected set of software metrics, divided into certain quality aspects, the identification of deficient source code can begin. After gathering software metrics values for program entities we want to evaluate, they are compared to the derived thresholds. If an actual value of a single software metric for a program entity exceeds the derived threshold, the entity is considered to be potentially deficient with regard to this single metric. The combined quality rate of each quality aspect, which is composed of several single metrics, is determined by the use of the majority function, based on the majority voting principle.
The majority function is defined by Equation (1):
M a j o r i t y y j = ( i = 1 n x i ) n , x i ( 0 , 1 )
where x i stands for a single component value, contributing to a combined measure y j .
When the majority function is used for calculating the majority within a certain quality aspect, y j stands for that quality aspect, and x i stands for a single software metric within the respected aspect. If the software metric value exceeds the threshold value, the x i is 1, otherwise x i is 0.
Based on the calculated majority measure, the quality rate of a single quality aspect is determined by Equation (2), and can be evaluated as either 1 or 0:
Q u a l i t y R a t e y i = { 1 ; M a j o r i t y y i > 0 . 5 0 ; M a j o r i t y y i 0 . 5 ,
where y i stands for the quality aspect. In this manner, the quality rate 1 represents a poor and 0 represents a good quality aspect. If the calculated value of the majority function is more than 0.5 the final quality rate is evaluated as 1 (poor) and if the value is less than or equal to 0.5, the quality rate is evaluated as 0 (good).
Similarly, for determining an overall quality of a program entity, which includes all different quality aspects, the same majority function (Equation (1)) and quality rate (Equation (2)) equations are used. In this manner, when the majority function (Equation (1)) is used for calculating the overall quality of program entities, y j stands for the specific program entity and x i stands for the quality rate of an evaluated quality aspect, as determined based on Equation (2). In the end, the overall quality of the program entity is determined as poor if the quality rate of the program entity is 1 and as good if the quality rate of the program entity is 0.
The detailed steps of the proposed approach are summarized by Algorithm 1. As proposed with the approach, the identification of potentially deficient program entities is done based on the calculated majority function and determined quality rate. First, for each program entity the majority function is applied within every quality aspect, considering single software metric values, and afterwards , the majority function is calculated for the program entity considering quality ratings of all quality aspects. Each evaluated program entity, the overall quality rate of which is determined as poor, is identified as potentially deficient. The list of such potentially deficient program entities constitutes a final output of the proposed identification approach.
Algorithm 1 Detailed structure of the proposed approach for the identification of deficient program entities
1:
derive thresholds for selected software metrics M 1 . . . j
2:
for each program entity E 1 . . . k do
3:
gather software metrics
4:
execute evaluation
5:
for each quality aspect Q 1 . . . i do
6:
  calculate majority function based on software metrics M 1 . . . j
7:
  define quality rate
8:
end for
9:
calculate majority function based on quality aspect Q 1 . . . i
10:
define quality rate
11:
if quality rate equals poor then
12:
  add program entity E 1 . . . k to list of potentially deficient program entities
13:
end if
14:
end for

4. Identification of Deficient Classes Within Object-Oriented Programming Languages

The novel identification approach, presented in Section 3, was implemented and evaluated within the context of three major object-oriented programming languages. The main goal was to detect deficient classes within the software developed in Java, C++ and C#. Following the steps of the approach presented in Figure 1 and with Algorithm 1, the identification of deficient classes is presented in three parts. Within the Section 4.1, the criteria for evaluation was set, whereas the evaluation and identification of potentially deficient classes is presented in Section 4.2, and the manual assessment of potentially deficient classes with expert judgment, that also validates the proposed identification approach, is presented in Section 5.

4.1. Determination of Quality Aspects, Selection of Software Metrics and Derivation of Corresponding Threshold Values

The evaluation of software classes was done based on four different categories reflecting different quality aspects within object-oriented software. Lanza and Marinescu [16] proposed an overview pyramid that includes three quality aspects: size and complexity, coupling and inheritance. We expanded and adjusted the proposed aspects and evaluated software classes based on (1) source code size; (2) class complexity; (3) coupling with other classes and (4) class cohesion.
Each of the presented quality aspects was evaluated with one or more software metrics. The software metrics used to evaluate each aspect were chosen from the list of available metrics supported by the Understand tool [40], which was used to collect software metrics values. The Understand tool [40] enables the collection of software metrics values for multiple programming languages. With the use of a single tool we eliminated the risk arising from the challenge presented by Lincke et al. [41], claiming that different software metric tools provide inconsistent values of the same software metric. This can be attributed to different implementations of the same software metric [30]. Therefore, we used a tool that allows collecting software metrics values for Java, C++ and C#. Among the available software metrics in the Understand tool [40], eight of them were chosen.
Quality aspects of size and complexity combine three metrics each, whereas coupling and cohesion were each evaluated by a single software metric. The chosen metrics are presented in Table 1. The table lists software metrics as named within the used tool together with the abbreviation for each metric that is used later in the paper.
Source code size and complexity are probably the most frequently used aspects when evaluating software quality [16]. The easiest way to determine the size of software is by counting lines [42]. Different software metrics count different types of lines, like the total number of lines, blank lines or comment lines. We decided to use the most expressive type: lines of code. Therefore, CountLineCode (SLOC) is the first metric within our study that evaluates the quality aspect of source code size. Since just a large number of lines of code does not mean that the program entity is problematic, we also assessed the average size of methods in the evaluated class. This is rated with a software metric AvgLineCode (AMS). As claimed by Lorenz and Kidd [43], when large methods prevail in a class, this can be a sign of deficiency. Therefore, with a combination of metrics CountLineCode and AvgLineCode, large classes which appropriately distribute source code into methods do not represent risky entities and are not identified as potentially problematic. The size of a program entity can also be evaluated with the software metric CountDeclMethodAll (NOM) which represents several methods in a class, including inherited ones. A large number of methods is usually reflected in a large number of source code lines.
Another basic aspect of quality is the complexity of the program entities. One of the most frequently used software metrics that measures complexity is cyclomatic complexity [16]. To evaluate the aspect of class complexity we use the metric SumCyclomatic (WMC) that expresses the sum of cyclomatic complexities of all the methods in a class and the metric AvgCyclomatic (ACC) that represents the average value of cyclomatic complexities of all methods. Again, with the use of the average value, only the software classes that have a large number of very complex methods are identified. The sum alone is not a reliable measure by itself, since we do not know how the complexity is distributed in the methods. Another aspect that has an impact on complexity is nesting level [44], which is measured by the software metric MaxNesting (NS).
An aspect that represents how methods and variables of a certain class are used in other classes [45] is coupling. High coupling causes extensive dependencies among classes and prevents reuse. Within our research, it is measured by the metric CountClassCoupled (CBO) that counts the classes coupled to a treated class. Another object-oriented quality aspect is class cohesion. It is evaluated with the metric PercentLackOfCohesion (LCOM) that measures the lack of cohesion in a class. A large number means that methods and variables cooperate and form a logical whole [46]. If the class lacks cohesion it means that it should be reorganized in a way that the parts, which do not fit, become a separate entity. Within the Understand tool [40] the metrics is expressed in a percentage, where a higher percentage indicates lower cohesion and vice-versa [47].

Derivation of Threshold Values

In our study, we calculated threshold values using the derivation approach proposed by Ferreira et al. [18]. The approach takes into account a statistical distribution of software metric values [48] and derives thresholds based on the most common value of a software metric [18]. To provide repeatability and objectivity, we designed a reusable suite of software products in three selected programming languages: Java, C++ and C#. For each language we gathered 100 open source software products from the SourceForge [49] online repository, chosen systematically from different domain categories. Software metrics were collected for all 300 software products and a repository of software metrics values for each of the three selected programming languages was composed.
The used derivation approach consider frequency of occurrence of specific software metric value [18]. By starting with an analysis of the statistical distributions of the gathered values, the appropriate way for deriving threshold values is determined. As the majority of software metrics values follow a power law distribution [18,28,50], we cannot derive thresholds using approaches that apply to normal distribution; in this manner, the mean and standard deviation cannot represent a reliable threshold value. When we fitted the data to the most suitable distribution, the calculation of thresholds was performed.
For seven out of eight selected metrics, the thresholds were determined with the 90th percentile, since they followed a power law distribution. The only exception was the metric PercentLackOfCohesion, which measures the lack of cohesion within a software class. As its values followed a normal statistical distribution, the threshold was derived using an arithmetic mean and standard deviation. Interestingly, this metric received a lot of attention in the literature and consequently many variations of the metric exist [51]. Within the study we used the definition where the value can be between 0 and 100, expressing a lack of cohesion within the class in terms of percentages.
All the derived threshold values are presented in Table 1. The thresholds were determined for eight software metrics in three different programming languages. For example, the C++ classes, in which the sum of cyclomatic complexity of all methods exceed 45, express a very high risk for containing deficient source code according to the complexity aspect. Whereas in Java the threshold value for the same metric is 33 and within C# it is 36. On the other hand, a class in C# that contains more than 278 lines of source code means that there is a high risk that a class is too big in terms of the size quality aspect. Within Java, the threshold for this same metric is determined at 197 and within C++ at 235 lines of code. As indicated by the numbers in Table 1, the threshold values among programming languages differ.

4.2. Evaluation and Quality Rating of Deficient Classes

The evaluation of software classes was done using the criteria composed of different quality aspects and corresponding software metrics with their threshold values. The aim of the evaluation was finding program entities with deficient overall quality and not on finding particular types of code smells or even faulty classes.
The evaluation of classes within object-oriented programming languages started by gathering the values of selected software metrics using the Understand tool [40]. We evaluated the software solutions developed in Java, C++ and C#, since object-orientation is nowadays a widely adopted approach in software engineering [17]. Table 2 lists the evaluated software. Participating software projects are open source and are available in the SourceForge [49] online source code repository. They have been chosen using the most frequently used criteria and following best practices used in related work; the prevailing criterion was software size, whereby the participating projects vary in size and the number of classes.
After the values of the software metrics were collected, the evaluation of software classes was conducted. The thresholds of the considered software metrics are presented in Section 4.1 in Table 1. The evaluation of software classes was performed in three steps, with each step combining related criteria. First, software classes were evaluated based on an individual software metric and the results can be seen in Table 3, Table 4 and Table 5. In the second and third steps, the classes were evaluated using selected combinations of software metrics, wherein the third step covers combinations of criteria that result in poor quality rate according to the proposed approach using the majority function. The results are presented in Table 6, Table 7 and Table 8.
Within the evaluation, seven different software products in Java were analyzed. The size of the analyzed software varies. The JasperReports Library consists of 2720 classes, Alfresco Repository has 6879 classes, Apache Tomcat 3314 classes, Gradle consist of 8647 classes, Liferay Portal includes 19,297 classes, Jenkins 3160 classes and JHotDraw has 627 classes. The latter software was included in the evaluation since it is known as a practical example of using design patterns [52], and therefore is expected to be well designed. Additionally, it was also used in other studies, like in [18,53,54]. Table 3 presents the number and percentage of potentially deficient classes evaluated with each of the eight selected software metrics independently. This evaluation step presents the number of identified potentially deficient software classes using an individual software metric as a criterion. For example, it can be seen that JasperReports Library includes 9.9% of classes that exceed the threshold value of metric SLOC (counting lines of code) and 10.9% of classes that exceed the threshold value of metric AMS (representing an average number of lines of code in a method within a class). These entities represent the highest risk that identified classes include problematic source code regarding their size. The identified value coincides with the average values of used benchmark data, since the used methodology for deriving thresholds identifies the top 10% of identified classes as the most risky ones. Within the Table 3, Table 4 and Table 5, values greater that 10% are bold, meaning that they exceed the average number of identified classes set by a benchmark data. For example, when evaluating the Liferay Portal, the number of classes exceeds 10% in five out of eight software metrics, whereas within Gradle the number of identified classes exceeds 10% of all classes only for the metric LCOM (measuring the lack of cohesion).
The evaluation with an individual metric was also done for software in the programming languages C++ and C#. The analyzed software in C++ results in more potentially deficient classes when compared to Java software. As shown in Table 4, within Money Manager 22.3% of classes exceed the threshold value of metric counting lines of code. Also, within the same software, 18.5% classes exceed the threshold of the metric expressing the sum of cyclomatic complexity of all methods within a class. In 7-Zip there are 15.4% of classes that exceed the threshold value measuring coupling with other classes and within Notepad++, 25.6% of classes exceed the threshold of metric evaluating nesting level. In the context of C# we analyzed in detail five software products: KeePass with 523 classes, iTextSharp with 2815 classes, OpenCBS with 920 classes, Only Office with 5410 classes and Git Extensions with 767 classes. The results of the evaluation are presented in Table 5. When identifying classes based on an individual metric, OpenCBS results in 14.8% of classes that exceed the threshold value of metric counting lines of code, whereas only 6.3% of classes exceed the same threshold within iTextSharp and OnlyOffice. KeePass has 21.8% of classes that exceed the threshold value of metric measuring coupling with other classes and 20.1% of classes that have the sum of cyclomatic complexities of all methods within a class higher then specified with the threshold.

Evaluation of Software Classes With a Combination of Software Metrics and by Applying the Majority Function

When we evaluate software according to an individual software metric, as presented with Table 3, Table 4 and Table 5, this quite often results in a large number of potentially deficient program entities. For example, if we want to identify classes that are big and complex within the JasperReports Library, assuming we evaluate it with an individual metric, we would have to assess 271 classes that exceed threshold values measuring SLOC (number of lines) and 241 classes that exceed the threshold value according to the metric WMC (representing the sum of cyclomatic complexities of all the methods within a class). 512 classes would have to be assessed manually for the purpose of determining their relevance, which represents a very large volume of input data in the review phase.
Regarding a very large number of potentially problematic classes, we can assume that the quality of the majority of identified classes is adequate, meaning that when evaluating program entities using criterion based on an individual software metric, a lot of false positive cases are identified. Therefore, by combining different software metrics to evaluate the same quality aspect and, in the next phase, by combining different quality aspects in one overall quality rate, we can reduce the number of incorrectly identified classes, resulting in a significant reduction of false positive entities. With the combination of software metrics and by applying the majority function when determining quality ratings of evaluated program entities, the number of identified classes should thus be reduced, while the reliability that an identified entity indeed includes a deficient source code should increase. In this manner, if we identify a class that is big, complex, coupled with a lot of other classes and has bad cohesion, it is very likely that it in fact contains a deficient source code and represents a real candidate for refactoring.
Since the main goal of the proposed identification approach is to determine whether a program entity contains a deficient source code or not, it is crucial that we are able to rate the quality of every program entity within an evaluated software project. Each class quality can be determined as good or poor. This is done based on the majority function applied on the used combination of software metrics. Table 6, Table 7 and Table 8 present the number of identified classes when an evaluation is done using different combinations of software metrics, and according to the proposed approach each of these combinations can be determined as good or poor by applying the majority function.
When the quality of all the quality aspects are evaluated, the overall class quality has to be determined. If the majority of quality aspects are evaluated as poor, the class quality is poor, otherwise the quality is classified as good. For example, if we have four quality aspects, size, complexity, cohesion and coupling and three of those quality aspects are evaluated as poor, the class is classified as poor. If we want to calculate the majority function of the evaluated aspect, e.g., class complexity, we have to consider three software metrics evaluating the quality aspect, SumCyclomatic, AvgCyclomatic and MaxNesting. If software metric values are 30 for SumCyclomatic, 5 for AvgCyclomatic and 6 for MaxNesting, the calculation of the majority function and quality rate is presented by Equation (3):
M a j o r i t y C o m p l e x i t y = ( 0 + 1 + 1 ) 3 = 0 , 67 Q u a l i t y R a t e C o m p l e x i t y = 1
In the example, the value of the metric SumCyclomatic does not exceed the threshold value, so the input into the majority function is 0. The other two metrics exceed the threshold, so the input is 1 for both metrics. When we sum the input values, 2 is divided by 3, where 3 represents the number of all metrics that evaluate the quality aspect. The result is 0.67. Because the calculated value is greater than 0.5, the quality rate of the complexity aspect is 1. The value is prepared for the calculation of the majority function and quality rate of the evaluated program entity. The example is presented by Equation (4):
M a j o r i t y J a v a 0 - 0 = ( 0 + 1 + 1 + 1 ) 4 = 0 , 75 Q u a l i t y R a t e J a v a 0 - 0 = 1
In the calculation of the majority function four quality aspects are included: size, complexity, coupling and cohesion. Based on the majority function presented by Equation (3), the complexity quality aspect is determined to be poor, and is marked as 1. As seen with Equation (4), the quality aspects evaluating coupling and cohesion are also evaluated as poor, therefore the input is 1, and the quality aspect evaluating the size of a entity is determined as good, which provides 0 as an input. The calculated majority function is 0.75. Converted into quality rating, the program entity quality is considered to be poor, meaning the overall quality of the evaluated source code is deficient and subsequently it is very likely that a program entity contains deficient source code. Within Equation (4), the naming of the evaluated program entity is composed of a software project identifier represented by the programming language and number of the evaluated software project, in our case Java0, followed by the number of the evaluated class, 0.
Table 6, Table 7 and Table 8 present the number of identified classes using different combinations of quality aspects and corresponding software metrics. Each of the participating criteria is evaluated by applying the majority function as proposed within the approach, determining the overall quality of identified classes as good or poor. The left part of the table presents the number of identified classes using the combination of quality aspects and software metrics that are determined as good, whereas the right, bold, part of the table presents the number of program entities identified using the combination of quality aspects and software metrics whose overall quality is determined as poor according to the majority function.
An evaluation of Java software using a combination of software metrics, is presented within Table 6. The number of results varies according to different combinations of quality aspects and software metrics. As shown, combining metrics and quality aspects results in a decreased number of identified classes. When quality aspects evaluating size, complexity, cohesion and coupling are considered, along with all corresponding software metrics, 15 classes are identified as potentially problematic within the JasperReports Library. The Liferay Portal results in a large number of potentially deficient classes using the same criterion, with 55 classes identified, but with respect to its size the percentage of identified entities coincides with other evaluated software. Within Apache Tomcat, 13 classes were identified when using the criterion composed of four quality aspects and all software metrics evaluating those quality aspects. In the case of Gradle, Jenkins and JHotDraw, no class is identified as deficient when we use the same criterion.
The results of the evaluation of C++ software projects, based on different combinations of criteria, are presented in Table 7. Within Notepad++, which contains 449 classes, two of them exceed threshold values for the combination of metrics measuring size, complexity, coupling and cohesion, taking into account all of the metrics that evaluate these quality aspects. For the same criterion, 7-Zip with 521 classes identified 1 class, Money Manager with 206 classes found 0 classes, TortoiseSVN with 1162 classes uncovered 8 classes, FileZilla with 372 classes located 0 classes and MySQL Server with 4643 classes identified 25 classes.
The results within C# software are presented in Table 8. Within Git Extensions, no class exceeded the threshold values of all the metrics evaluating quality aspects of size, complexity, coupling and cohesion taking into account all the metrics evaluating those quality aspects. Within OpenCBS only 1 class exceeded the thresholds of all metrics evaluating size, complexity, coupling and cohesion. Considering the same criterion, within KeePass, two classes were identified as potentially deficient and within iTextSharp and OnlyOffice 4 software classes.

5. The Validation of the Proposed Approach With Expert Judgment

In Section 3 the approach for identifying deficient classes is presented and in Section 4 the implementation within object-oriented programming languages was illustrated. To evaluate the proposed approach, we validated it by comparing the obtained results with the expert judgment upon the same set of software classes. Within the approach, potentially deficient classes were first identified using the proposed combination of eight software metrics, organized within four quality aspects, and corresponding threshold values and quality ratings were provided in accordance with the majority function. In real-world software development, each of the potentially problematic classes is usually assessed manually. Therefore, it is important that the results do not include too many false positive results. In this manner, the main goal of our approach was not necessarily to detect all deficient classes, but to significantly reduce the number of false positive cases within the identified classes, whose quality is determined as poor based on the majority function. To objectively evaluate the proposed approach, an expert judgment was conducted.
The main goal of the expert judgment in the scope of our study was to validate the reliability of identification using the proposed approach, based on a combination of software metrics and by applying the majority function, and correctness of the identified potentially deficient program entities. The reliability and correctness are reflected in occurrences of true positive and false positive examples. The experts evaluated if the identified software classes really contain deficient source code that reflects in deficient code quality. The conception of deficient code was left to the participating experts, since they have multiple years of experience as software developers and software architects. The classes used within the study were selected based on the research question: Do classes that exceed the threshold values for the majority of used quality aspects really contain deficient code or does the proposed approach for identification result in false positive examples?
The validation was carried out for projects developed in three programming languages: Java, C++ and C#. Using the developed tool, experts assessed the selected software classes. Our tool enables source code evaluation based on collaboration between participating experts. First, each entity is assessed independently by each assessor and next, the assessment has to be coordinated between the pair of assessors. If the pairs are not formed, the coordination step is not performed. Because of the cooperation between assessors the results are more reliable and the bias is reduced. Each assessor evaluates four quality aspects for each entity. The main aspect is the assessment of overall quality, whereas the other three quality aspects represent three out of four selected quality aspects. The assessment was done on a four level scale: very poor - poor - good - very good. The scale was set based on the quality rating steps defined within the proposed approach, where each class quality is determined as good or poor.
In the performed study, 18 experts participated, each with multiple years of experience. Participating experts assessed 93 software classes, evaluating overall quality and quality aspects of size, complexity, cohesion and coupling. The quality of assigned classes differed, and assessors were not aware of whether the selected program entity was evaluated as good or poor. A profile of participants is presented in Table 9.
As presented, participants evaluated their experiences in software development with an average of 8.4 on a scale from 1 to 10. The same scale was also used for evaluating their knowledge of the programming language they assessed. Knowledge of the programming language Java was rated with an average of 8.6, knowledge of C++ with 9 and knowledge of C# with 8.2. All the experts that evaluated C++ and C# have more than 10 years of experience with the mentioned programming languages. The same amount of experience was also recorded by 81% of the experts evaluating Java software classes.
To answer the research question, we selected different classes from the evaluated software products presented in Section 4.2. Classes were assessed by the participating experts and the assessment was compared to evaluations done using the proposed approach presented in Section 3. It was analyzed if expert assessment coincides with the quality rating determined using the majority function. With this, the correctness and reliability of the proposed novel approach can be researched.
The expert judgment in the programming language Java was done for 33 software classes from 3 different software projects. Classes were selected from the identified potentially deficient classes that are listed in Section 4.2. With the proposed identification using combination of software metrics and by applying the majority function, 28 out of 33 classes were determined as poor and 5 as good. Within classes with poor quality, all 9 classes from the Alfresco Repository exceed the threshold values of all eight software metrics. Also, 10 out of 15 classes corresponding to the same condition within the JasperReports Library were used within the evaluation. Five classes were skipped due to detected similarities. The numbers of identified classes can be seen in Table 6. The results of the expert judgment are presented in Table 10. The entity column presents an identifier of the evaluated class and the next two columns present the number of evaluations made and the number of pairs that were formed within those evaluations. As can be seen, each class was assessed multiple times, usually with two pairs of experts. The expert judgment confirmed the evaluation of overall quality determined by the proposed approach for all of the evaluated classes. The evaluation also confirmed the proposed quality rating for quality aspects measuring size, complexity and coupling. Only in 2 cases was the evaluation of cohesion not confirmed by experts. The results also confirmed the complete absence of false positive program entities within the identified software classes.
For the expert judgment of C++ software classes, 6 software projects were included that are presented in Section 4.2. 32 classes were evaluated as poor and 10 as good using the proposed quality rate based on the majority function. From Notepad++ and 7-Zip, all classes that were identified as exceeding the thresholds of all eight software metrics, participated. The numbers can be seen in Table 7. The results of the expert assessment are presented in Table 11. In all of the assessed classes, the evaluated overall quality was confirmed. Also, the quality aspects evaluating source code size and complexity were confirmed. For one class, the quality aspect of coupling was not confirmed and in the case of cohesion, for three classes the experts did not confirm the proposed evaluation. Again, the results also confirmed the non-existence of false positive results.
Within the programming language C#, 3 software products were analyzed and in total 18 classes were assessed, 13 of them were assessed as poor and 5 as good using the proposed identification approach. With the software KeePass and iTextSharp all classes corresponding to the criterion of exceeding the thresholds of all eight software metrics were included. The numbers are presented in Table 8. Classes were assessed by experts who were teamed into pairs, which is presented in the third column in Table 12. All of the entities were assessed by two pairs of experts and some of the classes were additionally assessed by an individual assessor to confirm the results. As shown in Table 12, the proposed overall quality was confirmed for all of the evaluated classes. Also, the evaluation was confirmed for quality aspects of size, complexity and coupling. The evaluation of cohesion was not confirmed for one software class. The results also confirmed the absence of false positive results.
The goal of the expert judgment was to answer the research questions presented at the beginning of the section. As the results show, the overall quality was confirmed for all classes in all three programming languages by all of the experts. With this, the correctness of the identification is confirmed. The important part of the validation is also how reliable the proposed identification is. This is especially vital in comparison with the evaluation based on an individual software metric. As the results of the experts’ judgment show, no example of false positive identification was found. The correctness and reliability of the proposed identification approach based on the combination of software metrics and the use of the majority function was evaluated by using the confusion matrix, presented in Table 13.
The confusion matrix is a two dimensional matrix that summarizes the performance of a classification [55]. It consists of a predicted and true condition and divides cases into four quality aspects: true positive (TP), false positive (FP), false negative (FN) and true negative (TN). Based on the provided data, it is also possible to calculate accuracy, precision, recall and F-Measure, presented with Equations (5)–(8). Accuracy measures how a prediction matches the reality [56], whereas precision and recall present values for how well relevant entities are retrieved [57]. Finally, the F-Measure presents information retrieval performance [58].
Accuracy = T P + T N T P + T N + F P + F N
Precision = T P T P + F P
Recall = T P T P + F N
F - Measure = 2 * Precision * Recall Precision + Recall
To calculate accuracy, precision, recall and F-Measure for the proposed identification based on a combination of software metrics and by applying the majority function, we used the results of the validation of the proposed identification, presented in Section 5. We considered only the part of the study where the evaluation of Java classes was performed.
Table 14 shows the confusion matrix and the calculated measures of predictive performance. 28 classes were identified as true positive and five classes as true negatives. No classes were detected as a false positive or false negative. Consequently, the accuracy, precision and recall for the presented identification is 100%. The same is also true for the value of the F-Measure.
The proposed approach addresses multiple quality aspects of the evaluated program entities. On the other hand, if the quality of a program entity is evaluated using an individual software metric, only one aspect of the program entity is assessed. If the entity exceeds the threshold according to an individual software metric and is in good shape according to other metrics, it is hard to generalize that the evaluated entity really contains deficient code. This can result in many false positive and false negative results.
If we assume that a class that exceeds the threshold value of at least one of the evaluated software metrics is rated as poor, the number of potentially deficient classes would be very large. This can be seen from Table 3, Table 4 and Table 5. For the purposes of studying the reliability and occurrence of false positive and false negative results, we selected 40 software classes in the programming language Java for another expert judgment with 6 other Java experts with multiple years of experiences. Detailed profiles of the participants are presented in Table 15 and are similar to the profiles of participants in the previously presented assessment. The process of assessment was the same as previously described in Section 5, but the quality evaluation of the chosen software classes that experts assessed was based on an individual software metric. They were asked to determine if a class contained a deficient source code. If yes, it should be evaluated as poor, otherwise as good.
The results of expert judgment that confirms or rejects the proposed evaluation of overall quality which is based on an individual software metric, are presented in Table 16. Among 40 classes the evaluation of overall quality was confirmed for 21 classes, where 14 classes were evaluated as poor and 7 as good. The results were transferred to the confusion matrix presented in Table 17. Sixteen classes were identified as false positive and 3 classes as false negatives.
Table 17 also presents the calculated values of accuracy, which is 52.5%; precision, with 46.7%; and recall which is 82.4%. The F-Measure is calculated as 59.6%.
If we compare the results in Table 17, that represent measures based on an evaluation with an individual software metric, with the results in Table 14 that presents measures based on an evaluation with the proposed approach, we can see that software metrics combined into quality aspects and rated according to the majority function provide a more reliable identification of deficient source code than an evaluation based on individual software metrics. This can also be seen from the numbers in the confusion matrix, as well as by comparing the F-Measure that increased from 59.6% to 100%. In addition, most importantly, the number of identified false positive cases dropped significantly using the proposed approach, as the precision of identification deficient classes increased from 46.7% to 100%.

6. Limitations

Despite careful planning of the presented study and its previous research, the results can be affected by different factors. Hereinafter, the limitations and potential threats to validity are presented.
The study was limited to object-oriented programming languages and evaluating quality at the class level. We did not identify specific types of code smells defined by Fowler et al. [3] and classified by Mantyla et al. [59], but deficient source code in general. We are aware of the definitions of different code smells and their detection, but since they are not unified they were not used in the presented study. We identified classes as poor or good, where poor classes are classes that are exposed to a high risk for containing deficient source code.
The results can be affected by the derived threshold values of the software metrics. We calculated thresholds by ourselves, using a carefully selected method, systematically collected benchmark data and a single tool used for collecting metric values. The results can also depend on the chosen software metrics that evaluate each quality aspect.
Calculated F-Measure , accuracy, precision and recall may be affected by the selection of software classes. Two different expert judgments were performed in order to evaluate the proposed novel identification approach. Number of identified potentially deficient classes differ if a majority rule is applied on a combination of software metrics or identification is based on an individual software metric. For example, within Alfresco Repository, 441 out of 3314 classes were identified as potentially deficient, when considering the combination of all software metrics, which were evaluated as poor when applying the majority function. On the other hand, 2293 out of 3314 classes were identified as potentially problematic when evaluation was done using an individual software metric. Since each expert judgment assessed only a subset of identified classes using a certain approach, the used program entities vary.
The execution and results of the expert judgment can also be influenced by the expertise of the participating experts. Since we chose experts with many years of experience, we do not doubt their knowledge. However, the bias was also limited by forming a different pair within the participating assessors.

7. Conclusions

This paper presents a novel approach to the identification of deficient source code using a combination of software metrics and applying the majority function. The approach was implemented and evaluated in the context of object-oriented programming languages. The selected software metrics were synthesized into four quality aspects, wherein each aspect was evaluated with one or more software metrics. The evaluation was based on the threshold values of the selected software metrics derived for three programming languages using 300 software projects presenting benchmark data.
We investigated whether the application of the majority function on the combination of software metrics can detect deficient source code in a more reliable way than an identification based on an individual software metric or criterion. Based on the reliability analysis presented in Section 5, we can conclude that the proposed identification approach outperformed the detection performed using an individual software metric. The accuracy, precision, recall and F-Measure of the proposed identification approach was significantly improved. The suitability of the presented identification was validated with expert judgment, where 18 participants assessed 93 classes in Java, C++ and C#. They confirmed that classes exceeding the threshold values of the majority of proposed quality aspects and also for the majority of software metrics within those aspects, indeed contain deficient source code. Even more, for the vast majority of cases, they also confirmed the quality rate of an individual quality aspect. Some deviation was detected only within the quality aspect evaluating class cohesion, which can be associated with various definitions of the corresponding software metric. Additionally, the expert judgment confirms that the proposed identification does not result in a false positive identification, which is especially important when performing a manual review.
Since our study was not focused on one specific code smell, we plan to research more precisely the area of code smell detection rules and the connection of rules with software metrics. We will therefore be able to associate the specific types of code smell to a software metric, whereas exceeding the threshold value of this metric could indicate the existence of a specific code smell. The presented study was limited to software classes and class level metrics. In future work we intend to extend our research to method level software metrics that would allow for the identification of deficient methods. We also plan to expand our research to other object-oriented programming languages and to use the proposed identification in an industrial environment and with proprietary software.

Author Contributions

Conceptualization, T.B., V.P. and M.H.; Formal analysis, T.B.; Investigation, T.B. and M.H.; Methodology, T.B. and M.H.; Supervision, M.H.; Validation, T.B. and M.H.; Visualization, T.B.; Writing—review & editing, T.B., V.P. and M.H.

Funding

This work was supported by the Slovenian Research Agency (SRA) under The Young Researchers Programme (SICRIS/SRA code 35512, RO 0796, Programme P2-0057).

Conflicts of Interest

The authors declare no conflict of interest.

References

  1. Akbar, M.A.; Sang, J.; Khan, A.A.; Fazal-E-Amin, N.; Shafiq, M.; Hussain, S.; Hu, H.; Elahi, M.; Xiang, H. Improving the Quality of Software Development Process by Introducing a New Methodology-AZ-Model. IEEE Access 2018, 6, 4811–4823. [Google Scholar] [CrossRef]
  2. Kan, S.H. Metrics and Models in Software Quality Engineering, 2nd ed.; Addison-Wesley Longman Publishing Co., Inc.: Boston, MA, USA, 2002. [Google Scholar]
  3. Fowler, M.; Beck, K.; Brant, J.; Opdyke, W.; Roberts, D. Refactoring: Improving the Design of Existing Code; Addison-Wesley Object Technology Series; Addison-Wesley: Boston, MA, USA, 1999. [Google Scholar]
  4. Taibi, D.; Janes, A.; Lenarduzzi, V. How developers perceive smells in source code: A replicated study. Inf. Softw. Technol. 2017, 92, 223–235. [Google Scholar] [CrossRef]
  5. Singh, S.; Kaur, S. A systematic literature review: Refactoring for disclosing code smells in object oriented software. Ain Shams Eng. J. 2017, in press. [Google Scholar] [CrossRef]
  6. Mathur, N.; Reddy, Y.R. Correctness of Semantic Code Smell Detection Tools. In Proceedings of the 3rd International Workshop on Quantitative Approaches to Software Quality (QuASoQ 2015), New Delhi, India, 30 November–1 December 2015. [Google Scholar]
  7. Sharma, T.; Spinellis, D. A survey on software smells. J. Syst. Softw. 2018, 138, 158–173. [Google Scholar] [CrossRef]
  8. Fontana, F.A.; Ferme, V.; Zanoni, M.; Yamashita, A. Automatic Metric Thresholds Derivation for Code Smell Detection. In Proceedings of the IEEE/ACM 6th International Workshop on Emerging Trends in Software Metrics, Florence/Firenze, Italy, 16–24 May 2015. [Google Scholar]
  9. Fontana, F.A.; Ferme, V.; Zanoni, M.; Roveda, R. Towards a prioritization of code debt: A code smell Intensity Index. In Proceedings of the 2015 IEEE 7th International Workshop on Managing Technical Debt (MTD), Bremen, Germany, 2 October 2015. [Google Scholar]
  10. Vale, G.A.D.; Figueiredo, E.M.L. A Method to Derive Metric Thresholds for Software Product Lines. In Proceedings of the 2015 29th Brazilian Symposium on Software Engineering, Belo Horizonte, Brazil, 21–26 September 2015. [Google Scholar]
  11. Hozano, M.; Garcia, A.; Fonseca, B.; Costa, E. Are you smelling it? Investigating how similar developers detect code smells. Inf. Softw. Technol. 2018, 93, 130–146. [Google Scholar] [CrossRef]
  12. Beranič, T.; Rednjak, Z.; Heričko, M. Code smell detection: A tool comparison. In Proceedings of the Collaboration, Software and Services in Information Society: 20th International Multiconference Information Society—IS 2017, Ljubljana, Slovenia, 9–13 October 2017. [Google Scholar]
  13. IEEE Std 1061. IEEE Standard for a Software Quality Metrics Methodology, 1998. Available online: https://standards.ieee.org/standard/1061-1998.html (accessed on 11 October 2012).
  14. Huda, S.; Alyahya, S.; Ali, M.M.; Ahmad, S.; Abawajy, J.; Al-Dossari, H.; Yearwood, J. A Framework for Software Defect Prediction and Metric Selection. IEEE Access 2018, 6, 2844–2858. [Google Scholar] [CrossRef]
  15. Fenton, N.E.; Neil, M. Software Metrics: Roadmap. In Proceedings of the Conference on The Future of Software Engineering, Limerick, Ireland, 4–11 June 2000. [Google Scholar]
  16. Lanza, M.; Marinescu, R. Object-Oriented Metrics in Practice: Using Software Metrics To Characterize, Evaluate, and Improve the Design of Object-Oriented Systems; Springer-Verlag: Berlin/Heidelberg, Germany, 2006. [Google Scholar]
  17. Misra, S.; Adewumi, A.; Fernandez-Sanz, L.; Damasevicius, R. A Suite of Object Oriented Cognitive Complexity Metrics. IEEE Access 2018, 6, 8782–8796. [Google Scholar] [CrossRef]
  18. Ferreira, K.A.; Bigonha, M.A.; Bigonha, R.S.; Mendes, L.F.; Almeida, H.C. Identifying thresholds for object-oriented software metrics. J. Syst. Softw. 2012, 85, 244–257. [Google Scholar] [CrossRef]
  19. Nuñez-Varela, A.S.; Pérez-Gonzalez, H.G.; Martínez-Perez, F.E.; Soubervielle-Montalvo, C. Source code metrics: A systematic mapping study. J. Syst. Softw. 2017, 128, 164–197. [Google Scholar] [CrossRef]
  20. Foucault, M.; Palyart, M.; Falleri, J.R.; Blanc, X. Computing Contextual Metric Thresholds. In Proceedings of the 29th Annual ACM Symposium on Applied Computing, Gyeongju, Korea, 24–28 March 2014. [Google Scholar]
  21. Erni, K.; Lewerentz, C. Applying design-metrics to object-oriented frameworks. In Proceedings of the 3rd International Software Metrics Symposium, Berlin, Germany, 25–26 March 1996. [Google Scholar]
  22. Benlarbi, S.; Emam, K.E.; Goel, N.; Rai, S. Thresholds for object-oriented measures. In Proceedings of the 11th International Symposium on Software Reliability Engineering (ISSRE 2000), San Jose, CA, USA, 8–11 October 2000. [Google Scholar]
  23. Shatnawi, R. A Quantitative Investigation of the Acceptable Risk Levels of Object-Oriented Metrics in Open-Source Systems. IEEE Trans. Softw. Eng. 2010, 36, 216–225. [Google Scholar] [CrossRef]
  24. Arar, Ö.F.; Ayan, K. Deriving thresholds of software metrics to predict faults on open source software: Replicated case studies. Expert Syst. Appl. 2016, 61, 106–121. [Google Scholar] [CrossRef]
  25. Kumar, L.; Misra, S.; Rath, S.K. An empirical analysis of the effectiveness of software metrics and fault prediction model for identifying faulty classes. Comput. Stand. Interfaces 2017, 53, 1–32. [Google Scholar] [CrossRef]
  26. Hussain, S.; Keung, J.; Khan, A.A.; Bennin, K.E. Detection of Fault-Prone Classes Using Logistic Regression Based Object-Oriented Metrics Thresholds. In Proceedings of the 2016 IEEE International Conference on Software Quality, Reliability and Security Companion (QRS-C), Vienna, Austria, 1–3 August 2016. [Google Scholar]
  27. Boucher, A.; Badri, M. Using Software Metrics Thresholds to Predict Fault-Prone Classes in Object-Oriented Software. In Proceedings of the 2016 4th International Conference on Applied Computing and Information Technology/3rd International Conference on Computational Science/Intelligence and Applied Informatics/1st International Conference on Big Data, Cloud Computing, Data Science Engineering (ACIT-CSII-BCD), Las Vegas, NV, USA, 12–14 December 2016. [Google Scholar]
  28. Oliveira, P.; Valente, M.T.; Lima, F.P. Extracting relative thresholds for source code metrics. In Proceedings of the 2014 Software Evolution Week—IEEE Conference on Software Maintenance, Reengineering, and Reverse Engineering (CSMR-WCRE), Antwerp, Belgium, 3–6 February 2014. [Google Scholar]
  29. Lavazza, L.; Morasca, S. Identifying Thresholds for Software Faultiness via Optimistic and Pessimistic Estimations. In Proceedings of the 10th ACM/IEEE International Symposium on Empirical Software Engineering and Measurement, Ciudad Real, Spain, 8–9 September 2016. [Google Scholar]
  30. Alves, T.L.; Ypma, C.; Visser, J. Deriving metric thresholds from benchmark data. In Proceedings of the 2010 IEEE International Conference on Software Maintenance, Timișoara, Romania, 12–18 September 2010. [Google Scholar]
  31. Yamashita, K.; Huang, C.; Nagappan, M.; Kamei, Y.; Mockus, A.; Hassan, A.E.; Ubayashi, N. Thresholds for Size and Complexity Metrics: A Case Study from the Perspective of Defect Density. In Proceedings of the 2016 IEEE International Conference on Software Quality, Reliability and Security (QRS), Vienna, Austria, 1–3 August 2016. [Google Scholar]
  32. Dexun, J.; Peijun, M.; Xiaohong, S.; Tiantian, W. Detection and Refactoring of Bad Smell Caused by Large Scale. Int. J. Softw. Eng. Appl. 2013, 4, 1. [Google Scholar] [CrossRef]
  33. Abílio, R.; Padilha, J.; Figueiredo, E.; Costa, H. Detecting Code Smells in Software Product Lines—An Exploratory Study. In Proceedings of the 2015 12th International Conference on Information Technology—New Generations, Las Vegas, NV, USA, 10–12 April 2015. [Google Scholar]
  34. Vidal, S.; Vazquez, H.; Diaz-Pace, J.A.; Marcos, C.; Garcia, A.; Oizumi, W. JSpIRIT: A flexible tool for the analysis of code smells. In Proceedings of the 34th International Conference of the Chilean Computer Science Society (SCCC), Santiago, Chile, 11–13 November 2015. [Google Scholar]
  35. Salehie, M.; Li, S.; Tahvildari, L. A Metric-Based Heuristic Framework to Detect Object-Oriented Design Flaws. In Proceedings of the 14th IEEE International Conference on Program Comprehension (ICPC’06), Washington, DC, USA, 14–16 June 2006. [Google Scholar]
  36. Fokaefs, M.; Tsantalis, N.; Stroulia, E.; Chatzigeorgiou, A. JDeodorant: identification and application of extract class refactorings. In Proceedings of the 2011 33rd International Conference on Software Engineering (ICSE), Washington, DC, USA, 14–16 June 2011; pp. 1037–1039. [Google Scholar]
  37. Paiva, T.; Damasceno, A.; Figueiredo, E.; Sant’Anna, C. On the evaluation of code smells and detection tools. J. Softw. Eng. Res. Dev. 2017, 5. [Google Scholar] [CrossRef] [Green Version]
  38. Palomba, F.; Bavota, G.; Penta, M.D.; Oliveto, R.; Lucia, A.D. Do They Really Smell Bad? A Study on Developers’ Perception of Bad Code Smells. In Proceedings of the IEEE International Conference on Software Maintenance and Evolution, Madrid, Spain, 29 September–3 October 2014. [Google Scholar]
  39. Bouwers, E.; Visser, J.; van Deursen, A. Getting What You Measure. Commun. ACM 2012, 55, 54–59. [Google Scholar] [CrossRef]
  40. Scientific Toolworks Inc. Understand™. Available online: https://scitools.com (accessed on 8 August 2012).
  41. Lincke, R.; Lundberg, J.; Löwe, W. Comparing Software Metrics Tools. In Proceedings of the 2008 International Symposium on Software Testing and Analysis, Seattle, WA, USA, 20–24 July 2008. [Google Scholar]
  42. Aivosto Help. Available online: http://www.aivosto.com/project/help/index.html (accessed on 17 November 2017).
  43. Lorenz, M.; Kidd, J. Object-Oriented Software Metrics: A Practical Guide; Prentice-Hall, Inc.: Upper Saddle River, NJ, USA, 1994. [Google Scholar]
  44. Zou, Y.; Kontogiannis, K. Migration to object oriented platforms: A state transformation approach. In Proceedings of the International Conference on Software Maintenance, Montréal, QC, Canada, 3–6 October 2002. [Google Scholar]
  45. Chidamber, S.R.; Kemerer, C.F. A metrics suite for object oriented design. IEEE Trans. Softw. Eng. 1994, 20, 476–493. [Google Scholar] [CrossRef] [Green Version]
  46. Martin, R.C. Clean Code: A Handbook of Agile Software Craftsmanship, 1st ed.; Prentice Hall PTR: Upper Saddle River, NJ, USA, 2009. [Google Scholar]
  47. Scientific Toolworks, Inc. Understand, User Guide and Refrence Manual, 2017. Available online: https://scitools.com/documents/manuals/pdf/understand.pdf (accessed on 11 October 2012).
  48. Filó, T.G.S.; da Silva Bigonha, M.A.; Ferreira, K.A.M. A catalogue of thresholds for object-oriented software metrics. In Proceedings of the First International Conference on Advances and Trends in Software Engineering, Barcelona, Spain, 19–24 April 2015. [Google Scholar]
  49. SourceForge. Available online: https://sourceforge.net (accessed on 16 August 2017).
  50. Shatnawi, R.; Althebyan, Q. An Empirical Study of the Effect of Power Law Distribution on the Interpretation of OO Metrics. ISRN Softw. Eng. 2013, 2013. [Google Scholar] [CrossRef]
  51. Dallal, J.A. Improving the applicability of object-oriented class cohesion metrics. Inf. Softw. Technol. 2011, 53, 914–928. [Google Scholar] [CrossRef]
  52. JHotDraw. Available online: http://www.jhotdraw.org/ (accessed on 2 March 2007).
  53. Kessentini, M.; Vaucher, S.; Sahraoui, H. Deviance from Perfection is a Better Criterion Than Closeness to Evil when Identifying Risky Code. In Proceedings of the IEEE/ACM International Conference on Automated Software Engineering, Antwerp, Belgium, 20–24 September 2010. [Google Scholar]
  54. Seng, O.; Stammel, J.; Burkhart, D. Search-based Determination of Refactorings for Improving the Class Structure of Object-oriented Systems. In Proceedings of the 8th Annual Conference on Genetic and Evolutionary Computation, Seattle, WA, USA, 8–12 July 2006. [Google Scholar]
  55. Ting, K.M. Confusion Matrix. In Encyclopedia of Machine Learning; Sammut, C., Webb, G.I., Eds.; Springer: Boston, MA, USA, 2010; pp. 209–209. [Google Scholar]
  56. Sammut, C.; Webb, G.I. Accuracy. In Encyclopedia of Machine Learning; Sammut, C., Webb, G.I., Eds.; Springer: Boston, MA, USA, 2010; pp. 9–10. [Google Scholar]
  57. Ting, K.M. Precision and Recall. In Encyclopedia of Machine Learning; Sammut, C., Webb, G.I., Eds.; Springer: Boston, MA, USA, 2010; pp. 209–209. [Google Scholar]
  58. Sammut, C.; Webb, G.I. F-Measure. In Encyclopedia of Machine Learning; Sammut, C., Webb, G.I., Eds.; Springer: Boston, MA, USA, 2010; pp. 416–416. [Google Scholar]
  59. Mantyla, M.; Vanhanen, J.; Lassenius, C. A taxonomy and an initial empirical study of bad smells in code. In Proceedings of the International Conference on Software Maintenance (ICSM 2003), Amsterdam, The Netherlands, 22–26 September 2003. [Google Scholar]
Figure 1. Identification of deficient program entities including steps of the proposed identification approach.
Applsci 08 01902 g001
Table 1. Derived threshold values of selected software metrics grouped into quality aspects.
Software MetricThreshold Value
JavaC++C#
CountLineCodeSLOC197235278
AvgLineCodeAMS191820
CountDeclMethodAllNOM519060
SumCyclomaticWMC334536
AvgCyclomaticACC343
MaxNestingNS334
CountClassCoupledCBO111423
PercentLackOfCohesionLCOM719074
Table 2. Evaluated software within the implemented study.
IDTitle# Classes
Java201Alfresco Repository6879
Java202JasperReports Library2720
Java203JHotDraw627
Java204Apache Tomcat3314
Java205Jenkins3160
Java206Gradle8647
Java207Liferay Portal19297
C++201Notepad++449
C++202MoneyManager206
C++2037-Zip521
C++204TortoiseSVN1162
C++205FileZilla372
C++206MySQL Server4643
C#201KeePass523
C#202OpenCBS920
C#203iTextSharp2815
C#204OnlyOffice5410
C#205Git Extensions76
Table 3. Number of potentially deficient classes within Alfresco Repository (1); JasperReports Library (2); JHotDraw (3); ApacheTomcat (4); Jenkins (5); Gradle (6) and Liferay Portal (7) identified by using each software metric separately.
1234567
#%#%#%#%#%#%#%
SLOC6158.92719.9477.541012.41324.22052.4281914.6
AMS92213.429610.9315.13319.91183.72362.718159.4
NOM2083.01846.8203.23009.132910.43103.6290415.1
WMC4366.32418.9558.840212.11003.22172.5264013.7
ACC3965.82338.6528.334110.31233.92272.69795.1
NS4336.32288.46310.13309.91524.81411.67744.0
CBO3665.341815.4375.92818.51605.17418.6322016.7
LCOM136419.892634.021934.990627.352616.697611.3475224.6
Table 4. Number of potentially deficient classes within Notepad++ (1); Money Manager (2); 7-Zip (3); TortoiseSVN (4); FileZilla (5) and MySQL Server (6) identified by using each software metric separately.
123456
#%#%#%#%#%#%
SLOC9020.04622.310820.719917.1164.050810.9
AMS9120.35526.711321.718215.71521.749110.6
NOM357.810.5346.5494.2164.067414.5
WMC9220.53818.514127.116915.5246.547410.2
ACC6514.5167.812223.412110.4133.53407.3
NS11525.63115.113826.521018.1246.549310.6
CBO214.72612.68015.4544.792.43226.9
LCOM368.02210.7193.612710.915641.955011.4
Table 5. Number of potentially deficient classes within KeePass (1); OpenCBS (2) iTextSharp (3); OnlyOffice (4) and Git Extensions (5) identified by using each software metric separately.
12345
#%#%#%#%#%
SLOC7514.313614.81786.33416.310013.0
AMS5911.312113.21856.63726.99412.3
NOM193.6859.21585.64117.6668.6
WMC10520.112613.72408.53486.47910.3
ACC9017.2556.02368.43556.6364.7
NS356.7566.11244.42354.3293.8
CBO11421.812613.72127.53987.412215.9
LCOM17132.727329.747917.01,14021.130239.4
Table 6. Number of identified classes within Alfresco Repository (1); JasperReports Library (2); JHotDraw (3); ApacheTomcat (4); Jenkins (5); Gradle (6) and Liferay Portal (7) using a combination of software metrics.
SLOC
AMS
NOM
WMC
ACC
NS
CBO
LCOM
# classes (1)2543078636711295205326199109
# classes (2)84216055561724347451937161615
# classes (3)1411814110321603000
# classes (4)991611791651419841451347141313
# classes (5)1308620812101000
# classes (6)81159313272203010
# classes (7)66922823014020862212815417020596556255
Table 7. Number of identified classes within Notepad++ (1); Money Manager (2); 7-Zip (3); TortoiseSVN (4); FileZilla (5) and MySQL Server (6) using a combination of software metrics.
SLOC
AMS
NOM
WMC
ACC
NS
CBO
LCOM
# classes (1)50133635336109232422
# classes (2)261656034111000
# classes (3)7658784723852223111
# classes (4)88196759571021241213111088
# classes (5)71766140100010
# classes (6)242581891601594482110373239402625
Table 8. Number of identified classes within KeePass (1); OpenCBS (2); iTextSharp (3); OnlyOffice (4) and Git Extensions (5) using a combination of software metrics.
SLOC
AMS
NOM
WMC
ACC
NS
CBO
LCOM
# classes (1)3235018182881616312222
# classes (2)611324614111498122111
# classes (3)647107655051222433529454
# classes (4)102161086467625241431226554
# classes (5)4622944011722200000
Table 9. Profiles of participating experts.
Number of experts18
Experiences with software
development (1–10)8.4
Knowledge of Java (1–10)8.6
Years of experiencemore than 10 years (81%)
from 6 to 10 years (19%)
Knowledge C++ (1–10)9
Years of experiencemore than 10 years (100%)
Knowledge C# (1–10)8.2
Years of experiencemore than 10 years (100%)
Table 10. Results of expert judgment for classes in Java programming language, with assessed quality aspects, overall quality (1); source code size (2); class complexity (3); class cohesion (4) and class coupling (5); based on an evaluation using a combination of software metrics.
Entity# ev.Pairs(1)(2)(3)(4)(5)
Java201-141
Java201-252
Java201-352
Java201-441
Java201-541
Java201-663
Java201-752
Java201-841
Java201-942
Java201-1052
Java201-1163
Java201-1242
Java201-1352
Java201-1441
Java201-1552
Java201-1631
Java201-1751
Java201-1831
Java202-1973
Java202-2042
Java202-2142
Java202-2242
Java202-2352
Java202-2442
Java202-2542
Java202-2642
Java202-2763
Java202-2842
Java202-2942
Java203-3042
Java203-3142
Java203-3221
Java203-3342
Table 11. Results of expert judgment for classes in C++ programming language, with assessed quality aspects, overall quality (1); source code size (2); class complexity (3); class cohesion (4) and class coupling (5); based on an evaluation using a combination of software metrics.
Entity# ev.Pairs(1)(2)(3)(4)(5)
C++201-121
C++201-221
C++201-321
C++201-421
C++201-521
C++201-621
C++201-721
C++201-821
C++202-921
C++202-1021
C++202-1121
C++202-1221
C++202-1321
C++203-1421
C++203-1521
C++203-1621
C++203-1721
C++203-1821
C++203-1921
C++203-2021
C++203-2121
C++203-2221
C++203-2321
C++203-2421
C++204-2521
C++204-2621
C++204-2721
C++204-2821
C++204-2921
C++204-3021
C++204-3121
C++205-3221
C++205-3321
C++205-3421
C++205-3521
C++206-3621
C++206-3721
C++206-3821
C++206-3921
C++206-4021
C++206-4121
C++206-4221
Table 12. Results of expert judgment for classes in C# programming language, with assessed quality aspects, overall quality (1); source code size (2); class complexity (3); class cohesion (4) and class coupling (5); based on an evaluation using a combination of software metrics.
Entity# ev.Pairs(1)(2)(3)(4)(5)
C#201-152
C#201-252
C#201-352
C#201-452
C#202-552
C#202-642
C#202-752
C#202-852
C#202-942
C#202-1052
C#202-1152
C#203-1252
C#203-1352
C#203-1442
C#203-1542
C#203-1642
C#203-1752
C#203-1852
Table 13. Confusion matrix.
Population: XTrue Condition
PositiveNegative
Predicted statePositivetrue positivefalse positive
Negativefalse negativetrue negative
Table 14. Reliability analysis of identification based on combination of software metrics.
Population: 33Actual State
Poor ClassGood Class
Predicted statePoor class280
Good class05
Accuracy1
Precision1
Recall1
F-Measure1
Table 15. Profiles of participating experts.
Number of experts6
Experiences with software
development (1–10)8.3
Knowledge of Java (1–10)8.5
Years of experiencemore than 10 years (83%)
from 6 to 10 years (17%)
Table 16. Results of expert judgment of assessed Java classes evaluated based on an individual software metric.
Entity# ev.PairsOverall QualityEntity# ev.PairsOverall Quality
Java201-3442Java201-5442
Java201-3542Java201-5542
Java201-3642Java201-5642
Java201-3742Java201-5742
Java201-3842Java202-5842
Java201-3942Java202-5942
Java201-4042Java202-6042
Java201-4142Java202-6142
Java201-4242Java202-6242
Java201-4342Java202-6342
Java201-4442Java202-6442
Java201-4542Java203-6542
Java201-4642Java203-6642
Java201-4742Java203-6742
Java201-4842Java204-6842
Java201-4942Java204-6942
Java201-5042Java204-7042
Java201-5142Java204-7142
Java201-5242Java204-7242
Java201-5342Java204-7342
Table 17. Reliability analysis of identification based on an individual software metric.
Population: 40Actual State
Poor ClassGood Class
Predicted statePoor class1416
Good class37
Accuracy0.525
Precision0.467
Recall0.824
F-Measure0.596

