Article

Fracture Toughness of Hybrid Components with Selective Laser Melting 18Ni300 Steel Parts

1
CEMMPRE, Department of Mechanical Engineering, Rua Luís Reis Santos, Pinhal de Marrocos, 3030788 Coimbra, Portugal
2
Instituto Politécnico de Leiria, ESTG, Department of Mechanical Engineering, Morro do Lena–Alto Vieiro, 2400-901 Leiria, Portugal
*
Author to whom correspondence should be addressed.
Appl. Sci. 2018, 8(10), 1879; https://doi.org/10.3390/app8101879
Submission received: 27 July 2018 / Revised: 1 October 2018 / Accepted: 2 October 2018 / Published: 11 October 2018
(This article belongs to the Special Issue Recent Trends in Advanced High-Strength Steels)

Abstract

:
Selective Laser Melting (SLM) is currently one of the more advanced manufacturing and prototyping processes, allowing the 3D-printing of complex parts through the layer-by-layer deposition of powder materials melted by laser. This work concerns the study of the fracture toughness of maraging AISI 18Ni300 steel implants by SLM built over two different conventional steels, AISI H13 and AISI 420, ranging the scan rate between 200 mm/s and 400 mm/s. The SLM process creates an interface zone between the conventional steel and the laser melted implant in the final form of compact tension (CT) samples, where the hardness is higher than the 3D-printed material but lower than the conventional steel. Both fully 3D-printed series and 3D-printed implants series produced at 200 mm/s of scan rate showed higher fracture toughness than the other series built at 400 mm/s of scan rate due to a lower level of internal defects. An inexpressive variation of fracture toughness was observed between the implanted series with the same parameters. The crack growth path for all samples occurred in the limit of interface/3D-printed material zone and occurred between laser melted layers.

1. Introduction

Selective Laser Melting (SLM) refers to layer material addition techniques that allow the generation of complex 3D-printed parts by selectively joining successive layers of powder material on top of each other, using thermal energy supplied by a focused, computer-controlled laser beam. This technology is a very high-energy process, as each layer of metal powder must be heated above the melting point of the metal [1,2]. Moreover, this additive manufacturing process can provide for complex geometry components, repair defects (as an alternative to laser welding [3]) and reconstruction in the moulds industry. The SLM process is largely affected by parameters such as laser power, scan speed rate, protective atmosphere, material used in the process and materials to joint, among others. The wrong choice of these parameters can lead to a high porosity, bad adhesion between layers and a materials interface which can decrease its mechanical behavior.
The literature reports an abundance of recent research about the morphologic and mechanical properties of SLM steels. Kempen et al. [4] studied the microstructure and mechanical properties of SLM 18Ni-300 steel and observed that a higher layer thickness and/or scan speed causes a decrease in density. A cellular-dendritic growth mechanism in the solidification was observed where intercellular spacing is less than 1 μm which leads to an excellent strength and hardness in both as-produced and age hardened conditions.
Casalino et al. [5] realized an experimental investigation and statistical optimization of the SLM process in 18Ni300 maraging steel, where the correlation between the mechanical and density was positive, and the surface roughness decreases with the energy density. Bai et al. [6] studied the influence of parameters on SLM process and mechanical properties evolution of maraging steel 300. Like previous authors, they prove the considerable influence of the scan rate, laser power and scan spacing as regards the density of a part. Low power laser and high scan rate lead to a low density produced part and high power laser and slow scan rate can achieve 99% of density in a produced part. Casati et al. [7] also obtained 99.9% of relative density in cubic samples produced by SLM using gas atomized H11 grade steel powder.
The presence of defects and microstructural heterogeneities creates uncertainty in mechanical properties of SLM produced parts, which complexify their generalized use [8]. Moreover, high SLM mechanical properties are required for structural materials applications. As is often reported in the literature, SLM process affects the material properties due to residual stresses, defects or inherent roughness of the surface [5,9,10,11].
The authors of Reference [12] studied the mechanical behavior of selective laser melting 18Ni300 steel specimens, concluding that a very high scan rate (400 or 600 mm/s) causes a high percentage of porosity and a consequent drastic reduction of the tensile strength, stiffness and elongation at failure, compared with the results obtained for a 200 mm/s scan rate. The fatigue crack propagation path occurred predominantly in a transgranular direction, crossing the laser layer.
The growing direction and grain aspect ratio can lead to anisotropic behavior of SLM parts. The loading direction, in respect to layer deposition plane and grain aspect ratio, plays an important role in its mechanical properties. The effect of building orientation on tensile properties and fatigue crack growth was studied by Suryawanshi et al. [13] and observed a lack of anisotropy for selective laser melting 18Ni300 steel. Strong intra-layer bonding and the absence of dominant texture were the reasons ascribed to this behavior. The same authors concluded that mechanical characteristics of aged SLM are broadly similar to those reported for the aged maraging steel of the same grade.
On the other hand, Mazur et al. [14] verified that the tensile and fatigue behavior in mechanical tests of SLM manufactured H13 specimens compared with the results to those conventionally produced showed tensile strength of as-built specimens to be up to 30% lower than conventional material. Fatigue strength was also significantly lower than reference data. These results were related to the high roughness of the 3D-printed surface and the presence of high tensile residual stresses. Ackermann et al. [15] realized impact tests in a three different conditions: 3D-printed, 3D-printed heat-treated and conventional heat-treated specimens in H13 tool steel. These authors observed that the H13 steel is so brittle and that it substantially limits direct use of the printed part. Proper heat treatment must be carried out after SLM process in order to obtain desired properties.
Studies regarding hybrid parts are not common. Cyr et al. [16] studied the fracture behavior of additively manufactured 18Ni300/H13 hybrid hard steels. These authors observed a presence of an interface between the different steels. On the other hand, tensile tests of hybrid as-printed sample show that the fracture occurs in the H13 steel, away from the interface. The authors of this research [17] also studied the morphologic and fatigue strength of additively manufactured 18Ni300/H13 and 18Ni300/AISI420 hybrid samples. The presence of an interface between the different steels was also observed. The fatigue strength has a lower influence due to the substrate (H13 or AISI420) and the hybrid samples show a lower fatigue life when compared with the as-printed samples. Moreover, the fatigue crack initiation, propagation and final fracture were localized in the as-printed material, being different of the Cyr et al. [16] results because these authors used an untreated H13 steel in the as-printed samples.
Campanelli et al. [18] studied 18Ni300 marage steel clads deposited onto an AISI 304 substrate. These authors observed that the dilution with the substrate is as low as 10 to 28%, which warrants the adhesion of marage to AISI 304 steel, and they developed a statistical analysis and mathematical model that can be used to select the process parameters to produce high-density parts, reaching a average density value of 98.2%.
No publications about the fracture toughness of conventional steels with 18Ni300 steel implants built by SLM were found in the literature, justifying the importance of the current investigation in order to understand the influence on material fracture of the geometric shape, the presence of defects and load mode. The results of this study can lead to a better understanding of mechanical design and reliability of mechanical projects of conventional steels with 18Ni300 steel implants built by SLM. Therefore, the main objective of this work is to study the fracture toughness of both fully 3D-printed specimens and hybrid specimens composed of a conventional steel substrate and a steel implant, both 3D-printed by SLM.

2. Material and Methods

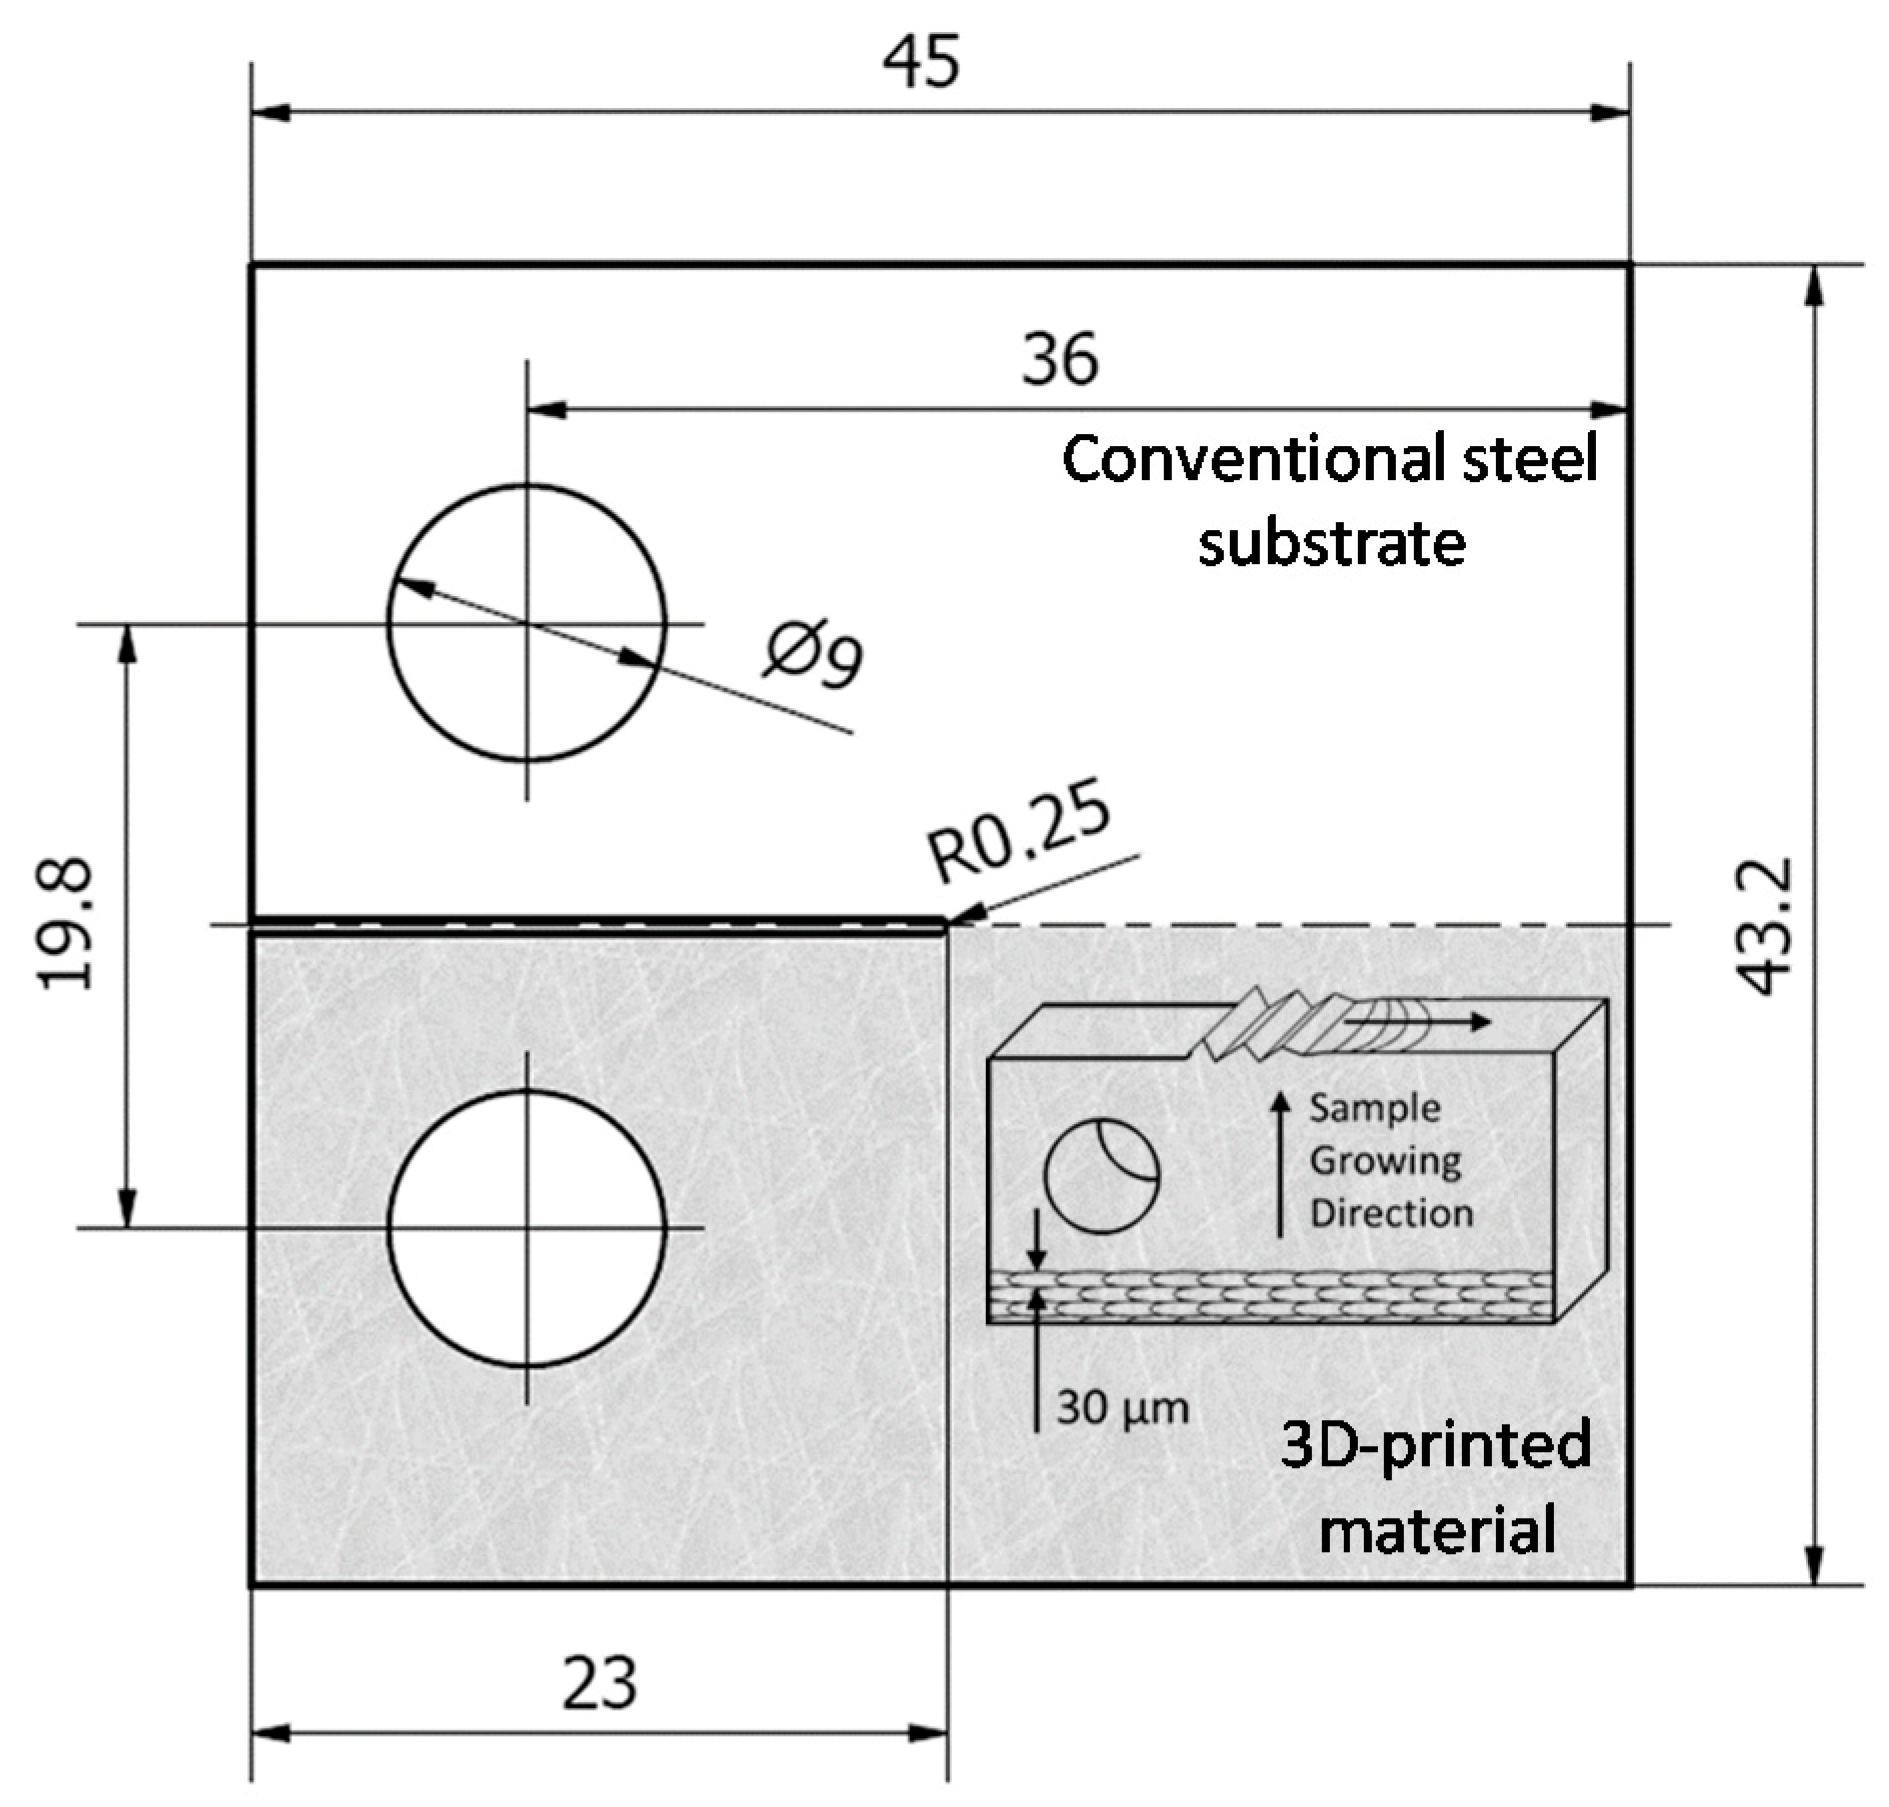
2.1. Materials and Specimens Manufacturing

The specimens used in this research were the Compact Tension type (CT), manufactured with SLM parts growing in load direction. Figure 1 shows the geometry and main dimensions of the specimens and a schematic view of the hybrid samples.
Three different kind of specimens were manufactured for this study: fully 3D-printed sample using recycled powder of AISI 18Ni300 steel (SM) of which the average particle diameter ranges between 0.01–0.056 mm and two hybrid samples, for which half specimen was a conventional machined steel and the remaining was a steel implant built by SLM using the maraging AISI 18Ni300 previously referred. The two steel substrates were the tempered AISI H13 steel (HS/SM) and the stainless steel AISI 420, both machined by conventional processes (SS/SM). Specimens with 6 and 3 mm thickness were produced with notches open by wire EDM (Electrical discharge machining) centered in the interface zone. Table 1 presents the main chemical composition according to the manufacturer, for the three steels. Table 2 presents tensile test results for SS/SM, HS/SM and SM samples, obtained by the authors [17] using round specimens with 4 mm of diameter according to ASTM E8/E8M-16a [19].
The 3D-printing was done by Lasercusing® process, in a “Concept Laser” equipment model “M3 linear” using as an energy source a laser type Nd:YAG with a maximum power of 100 W in continuous wave mode, a wavelength of 1064 nm and 0.2 mm of spot laser diameter. The samples were manufactured using two scan rates, 200 and 400 mm/s, adding layers of 30 µm thickness with hatch spacing of 100 µm and 25% overlapping, growing towards the direction corresponding to the application of load in the mechanical tests. After manufacturing the specimens were mechanically polished.

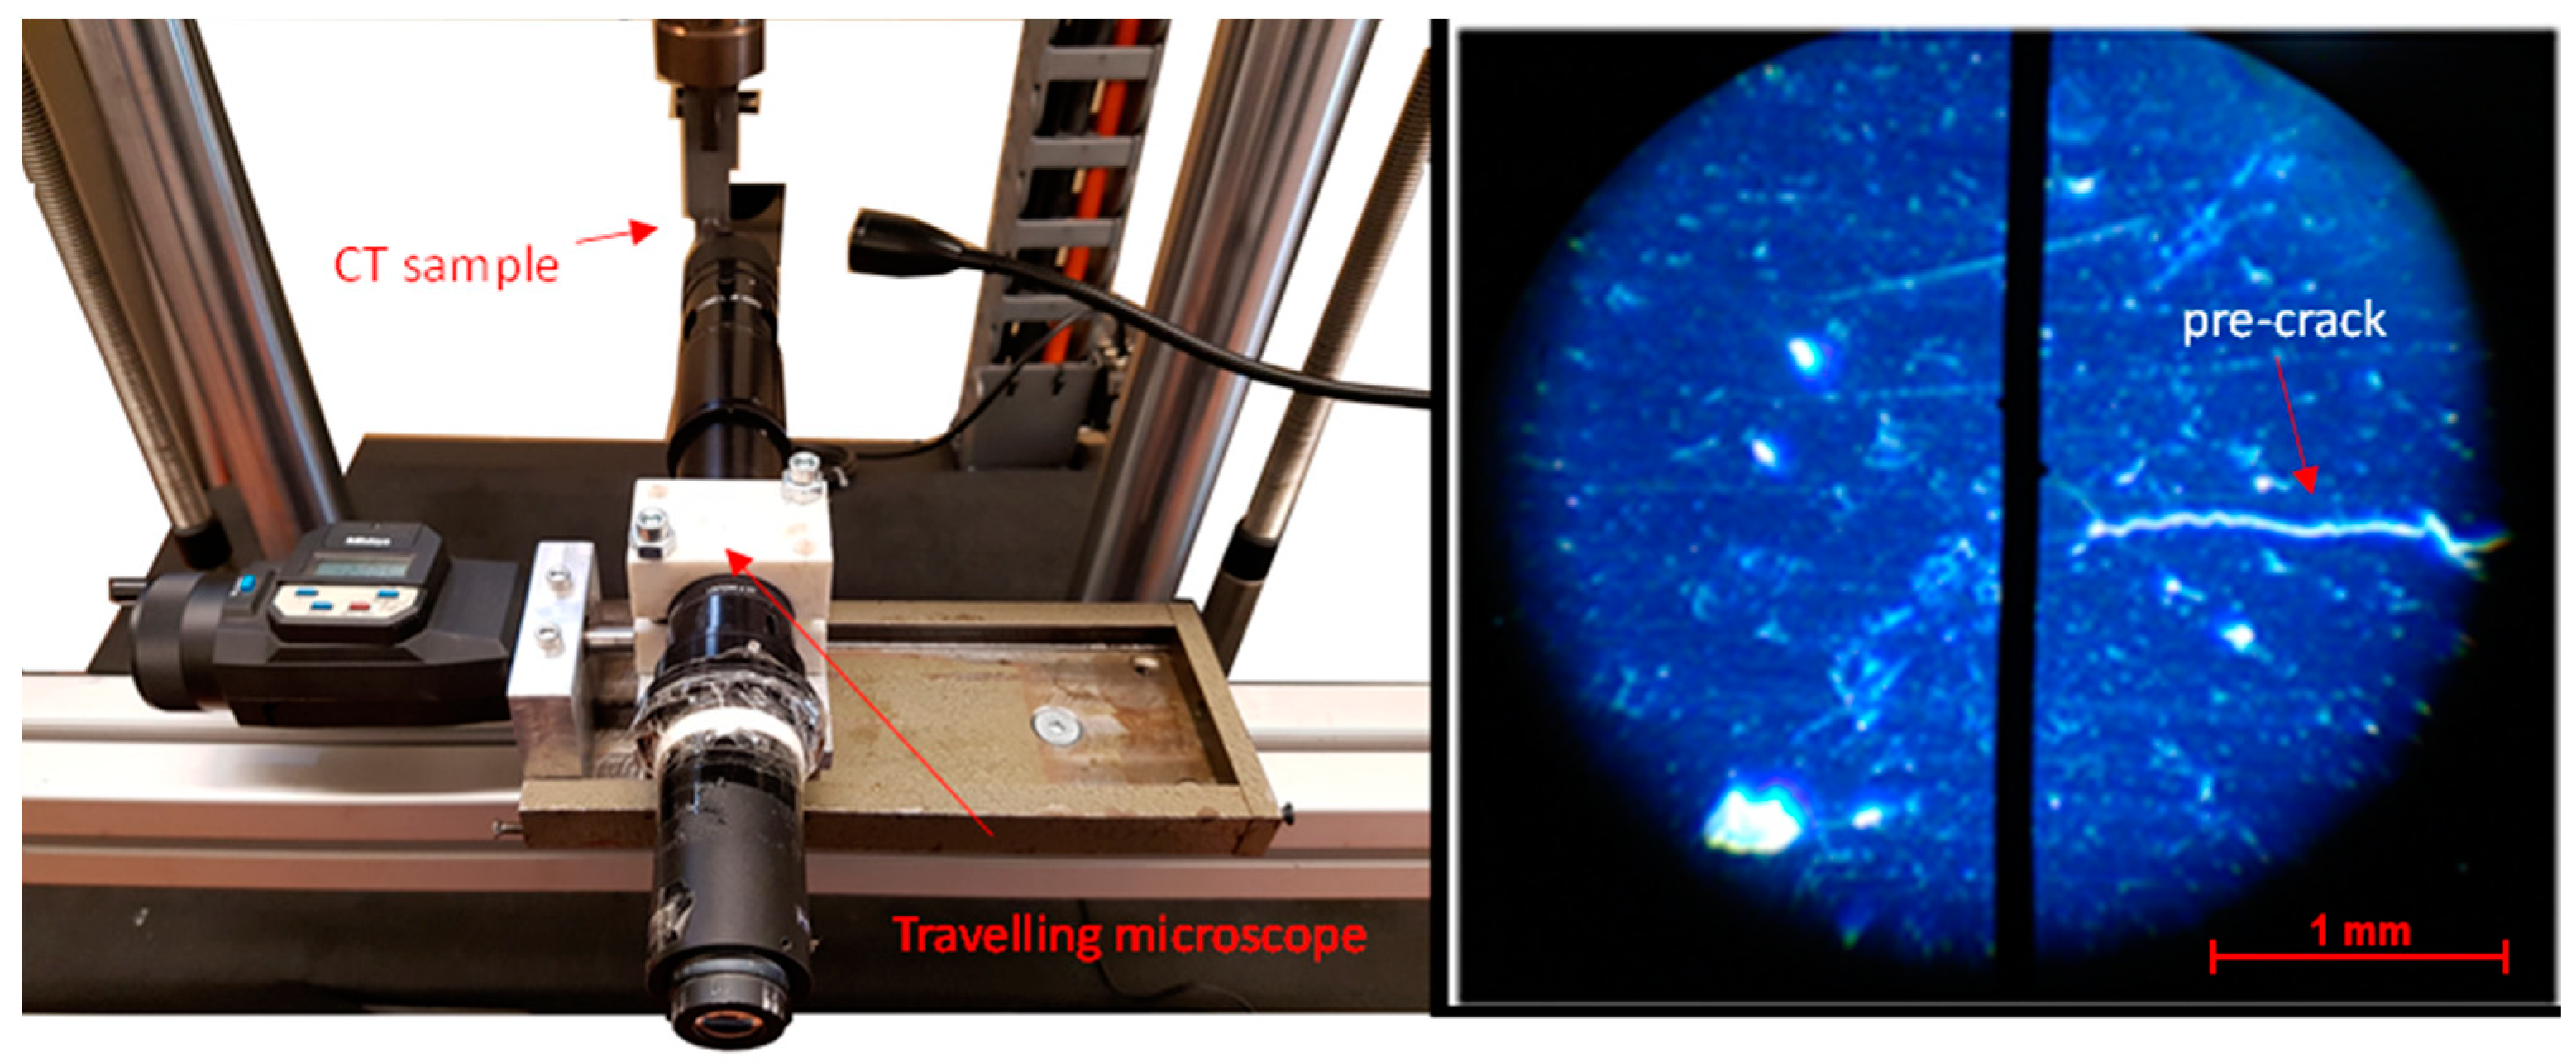
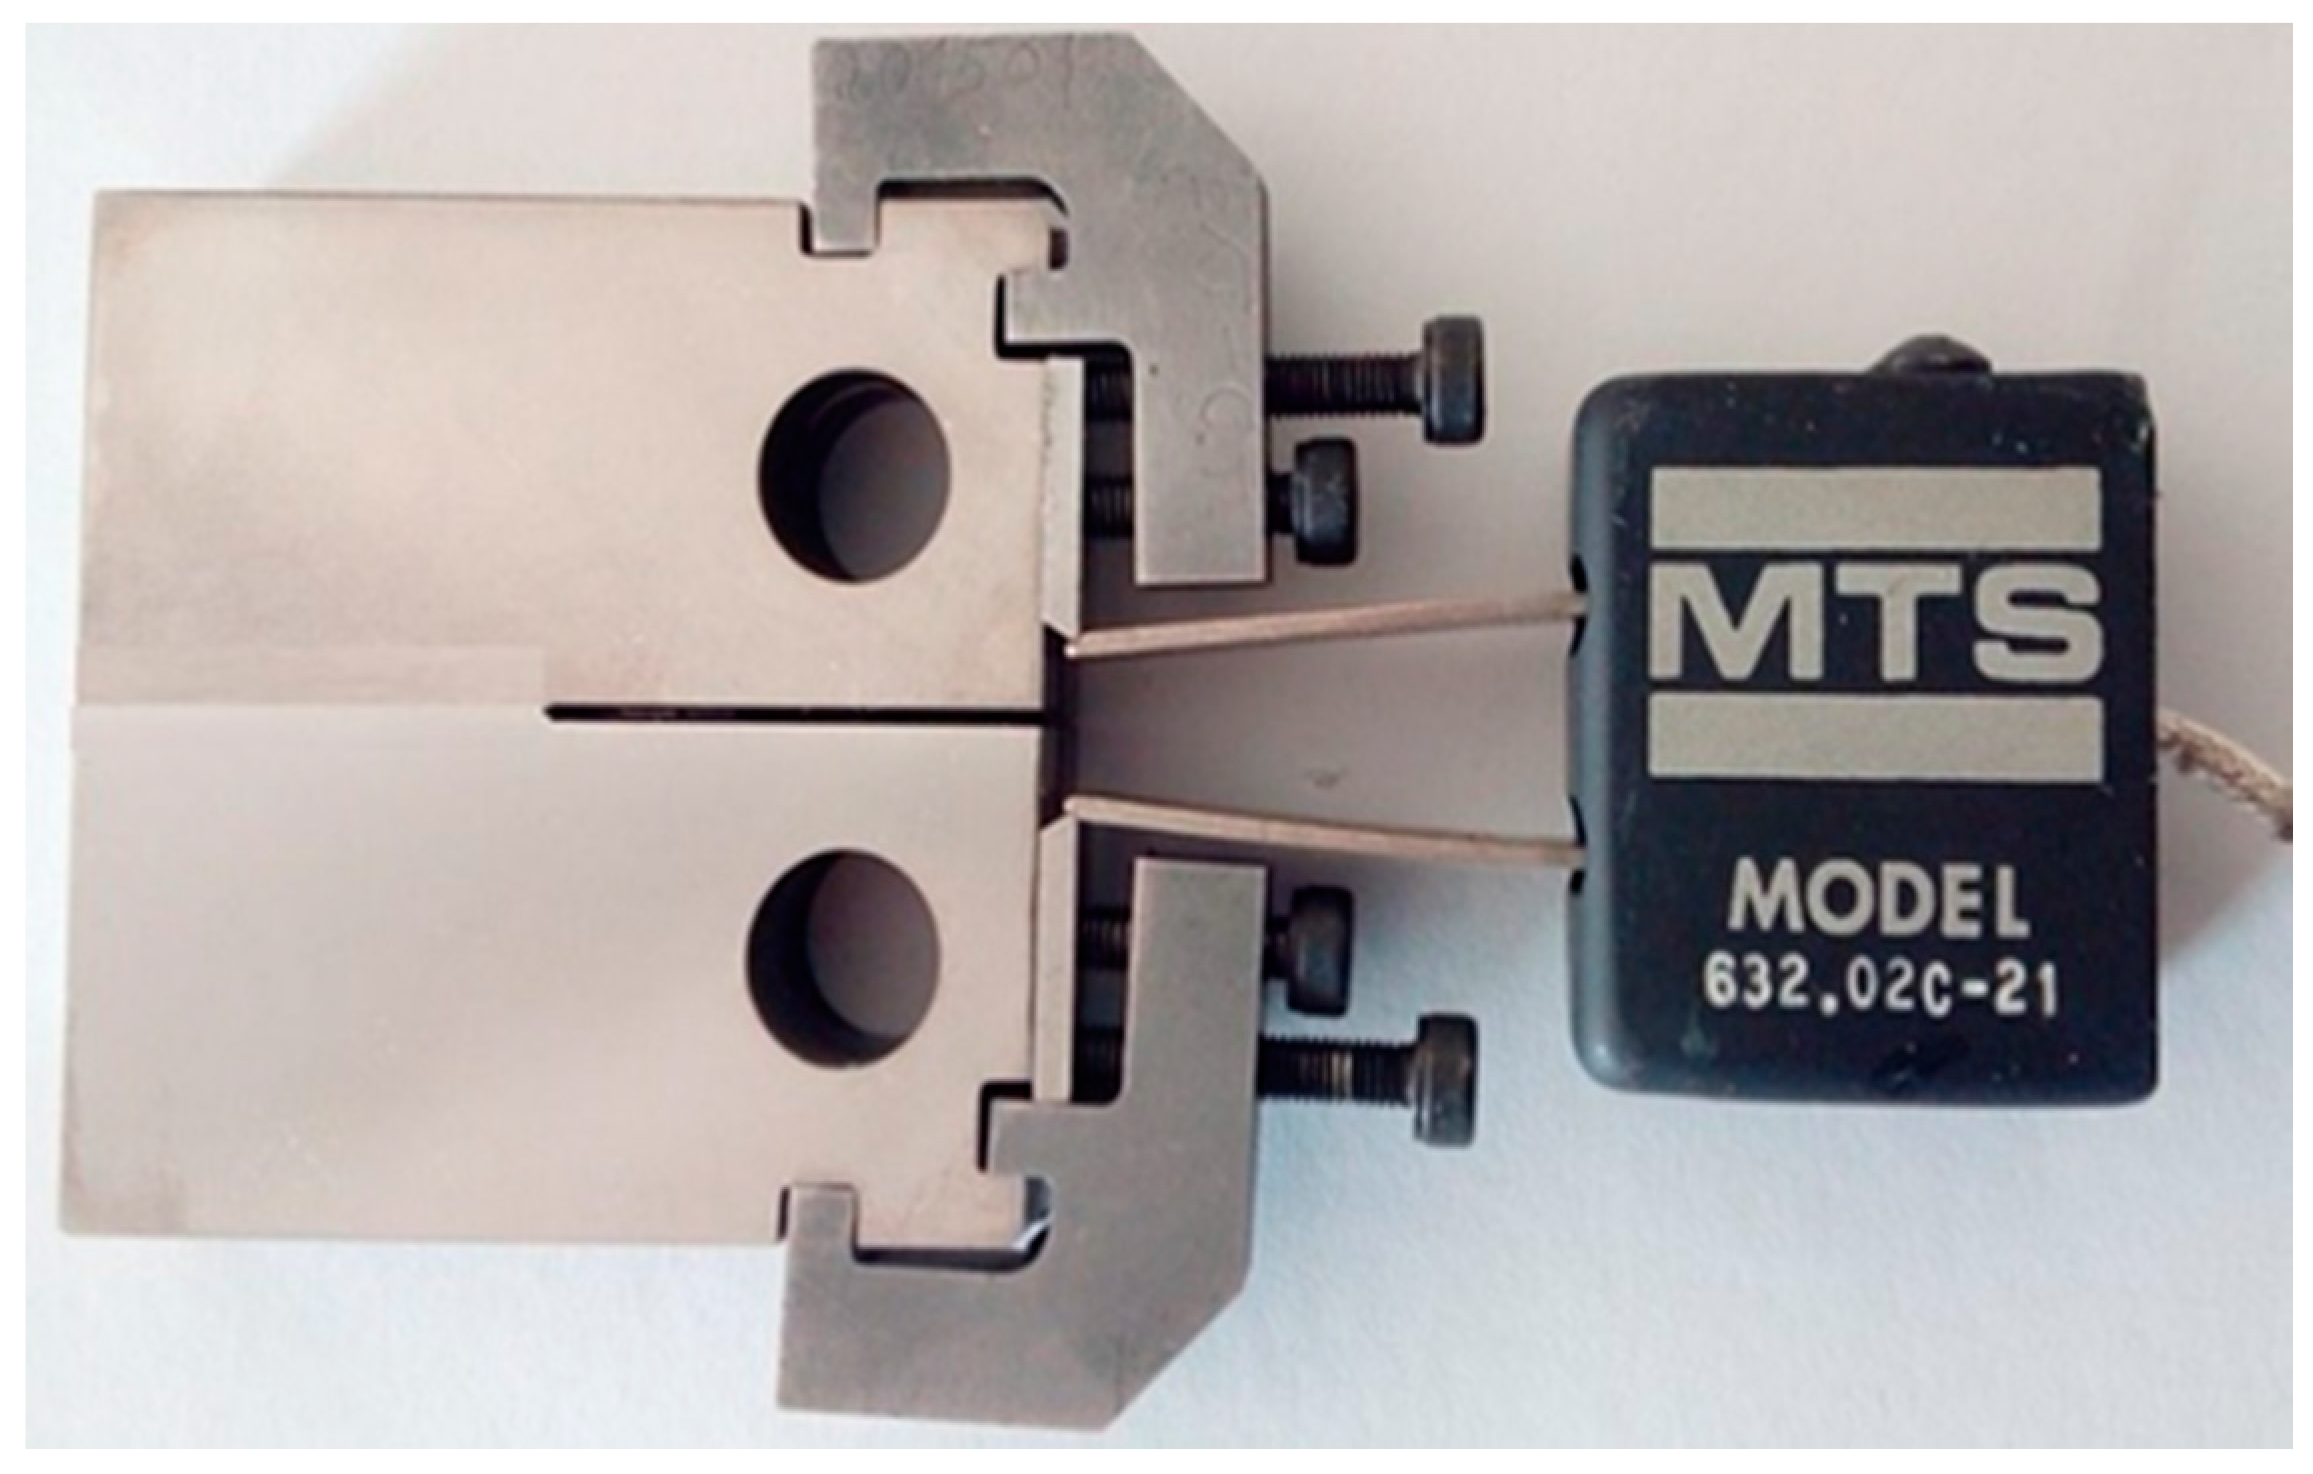
2.2. Fracture Toughness Tests

The fracture toughness tests were performed according to the BS 7448-3 standard [20] using CT specimens in loading Mode I. Before the fracture toughness tests a fatigue pre-crack was created at room temperature in an Instron Electroplus machine under constant amplitude tensile loading with sinusoidal load wave and stress ratio R = 0.05. In accordance with this standard, a pre-crack of 4 mm length was created from the notch, in order to comply with the two standard requirements: the pre-crack has to be higher than 2.5% of the W parameter and greater than 1.3 mm from the notch. The crack length was measured using a travelling microscope (45× of magnification) with an accuracy of 10 µm, as shown in Figure 2.
The fracture toughness tests were carried out in an Instron machine, model 4206, using a displacement rate of 2 mm/min. The crack opening displacement was measured using an MTS clip gauge model 632.02C-221 (MTS Systems, MN, USA) (range: −2.5 mm to 2.5 mm) fixed with an apparatus especially created for this purpose. Figure 3 shows the CT sample and extensometer assembly.
The fracture toughness KIc, and the critical integral, Jc, were calculated according the BS 7448-3 [20] standard through the Equations (1)–(4), respectively. Equation (5) was used for the validation of the critical stress intensity factor values in Mode I loading (KIc) by the criteria of excessive plastic deformation at the crack tip.
K Q = F Q B W 0.5 × f ( a 0 W )
f ( a 0 W ) = ( 2 + a 0 W ) [ 0.886 + 4.64 a 0 W 13.32 a 0 2 W 2 + 14.72 a 0 3 W 3 5.6 a 0 4 W 4 ] ( 1 a 0 W ) 1.5
J = [ F B W 0.5 × f ( a 0 W ) ] 2 ( 1 ϑ 2 ) E + η p U p B ( W a 0 )
η p = 2 + 0.522 ( 1 a 0 W )
2.5 ( K Q σ YS ) 2 ( W a 0 )
where a0 = 14 mm is the crack length, W the distance indicated in Figure 1, B is the sample thick, FQ is a particular load value determined from the fracture test chart, Up correspond to the plastic component of the area under load vs. elongation curve, E is the Young modulus, ν the Poisson coefficient and F is the maximum load.
Complementary analyses were performed to characterize the microstructure and the fracture mechanisms. The metallographic and crack morphologic analysis before and after the fracture tests were performed according to the ASTM E3 standard metallographic practice [21], being used for etching a solution composed of 4 g of picric acid, 1 mL of hydrochloric acid (HCL) and 95 mL ethyl alcohol. Afterwards, the samples were observed through an optical microscope Leica DM4000 M LED. The hardness tests were performed using a Struers Type Duramin-1 microhardness tester, with a load of 10 N during 15 s, according to the ASTM E 384 standard [22]. The local chemical compositions were obtained through the energy dispersive X-ray spectroscopy analysis. Finally, fractured surfaces of the broken surfaces and the interfaces of the specimens were analyzed in a scanning electron microscope (SEM) Philips® XL30 TMP.

3. Results and Discussion

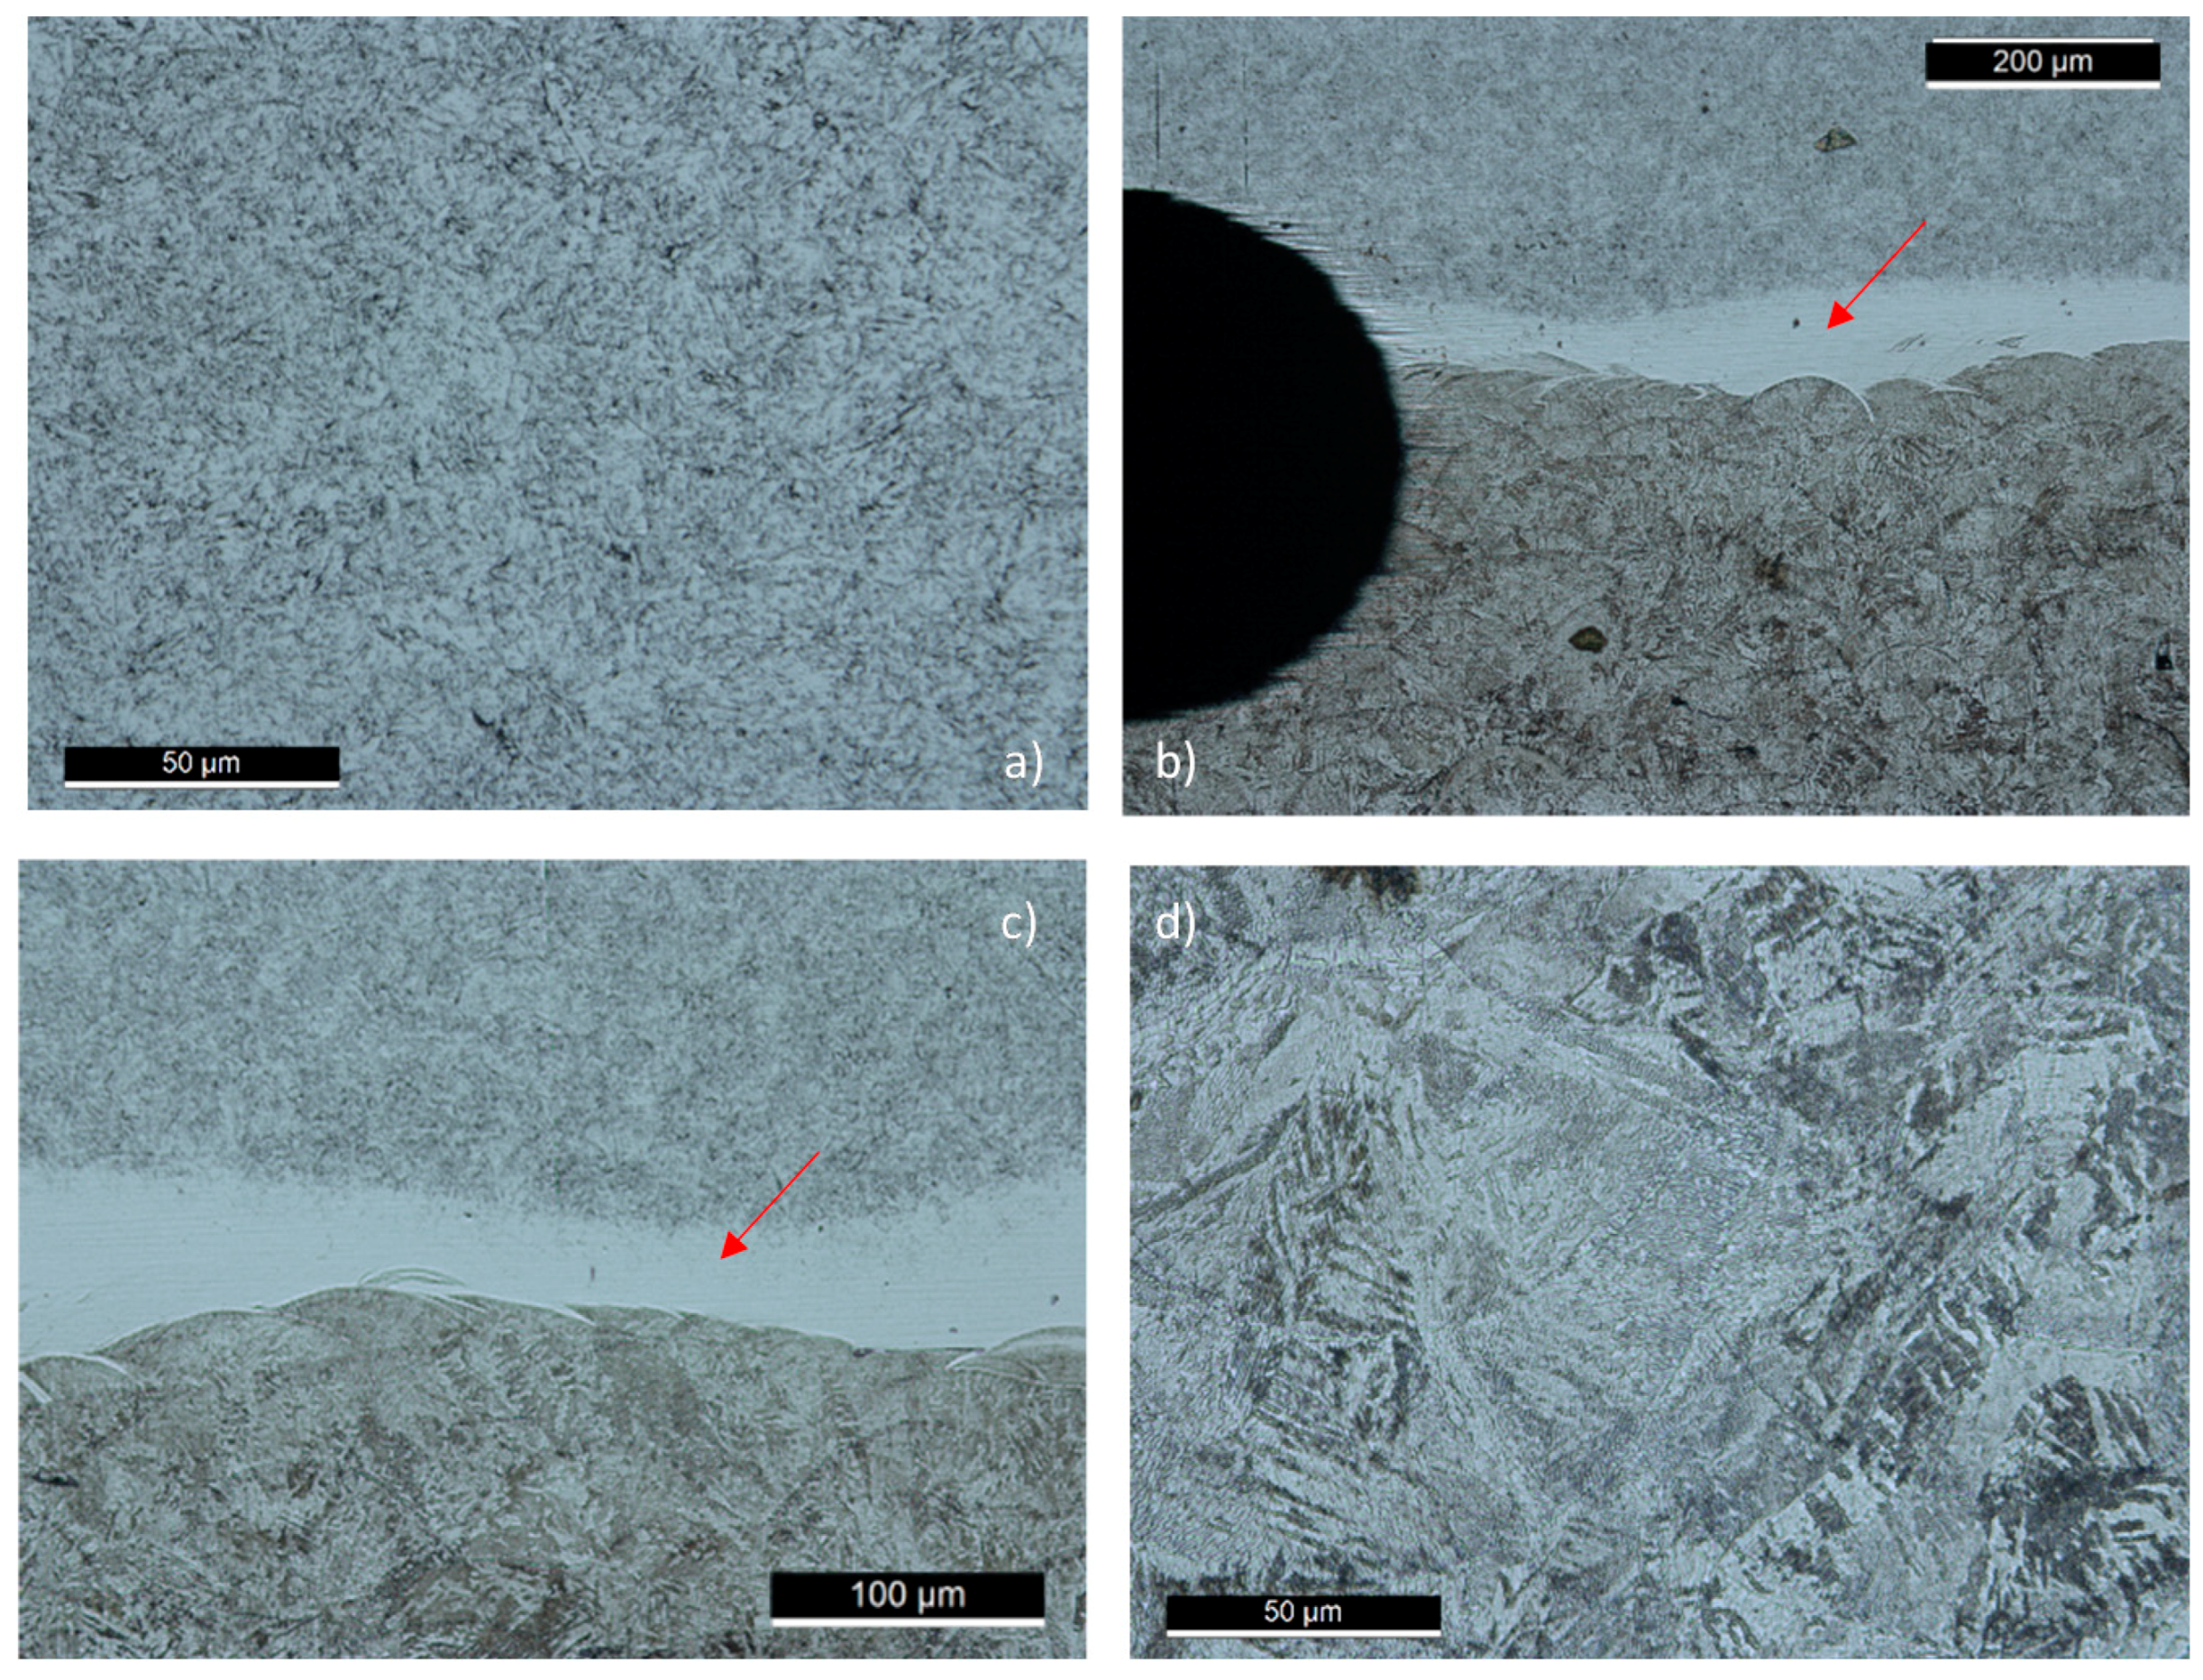
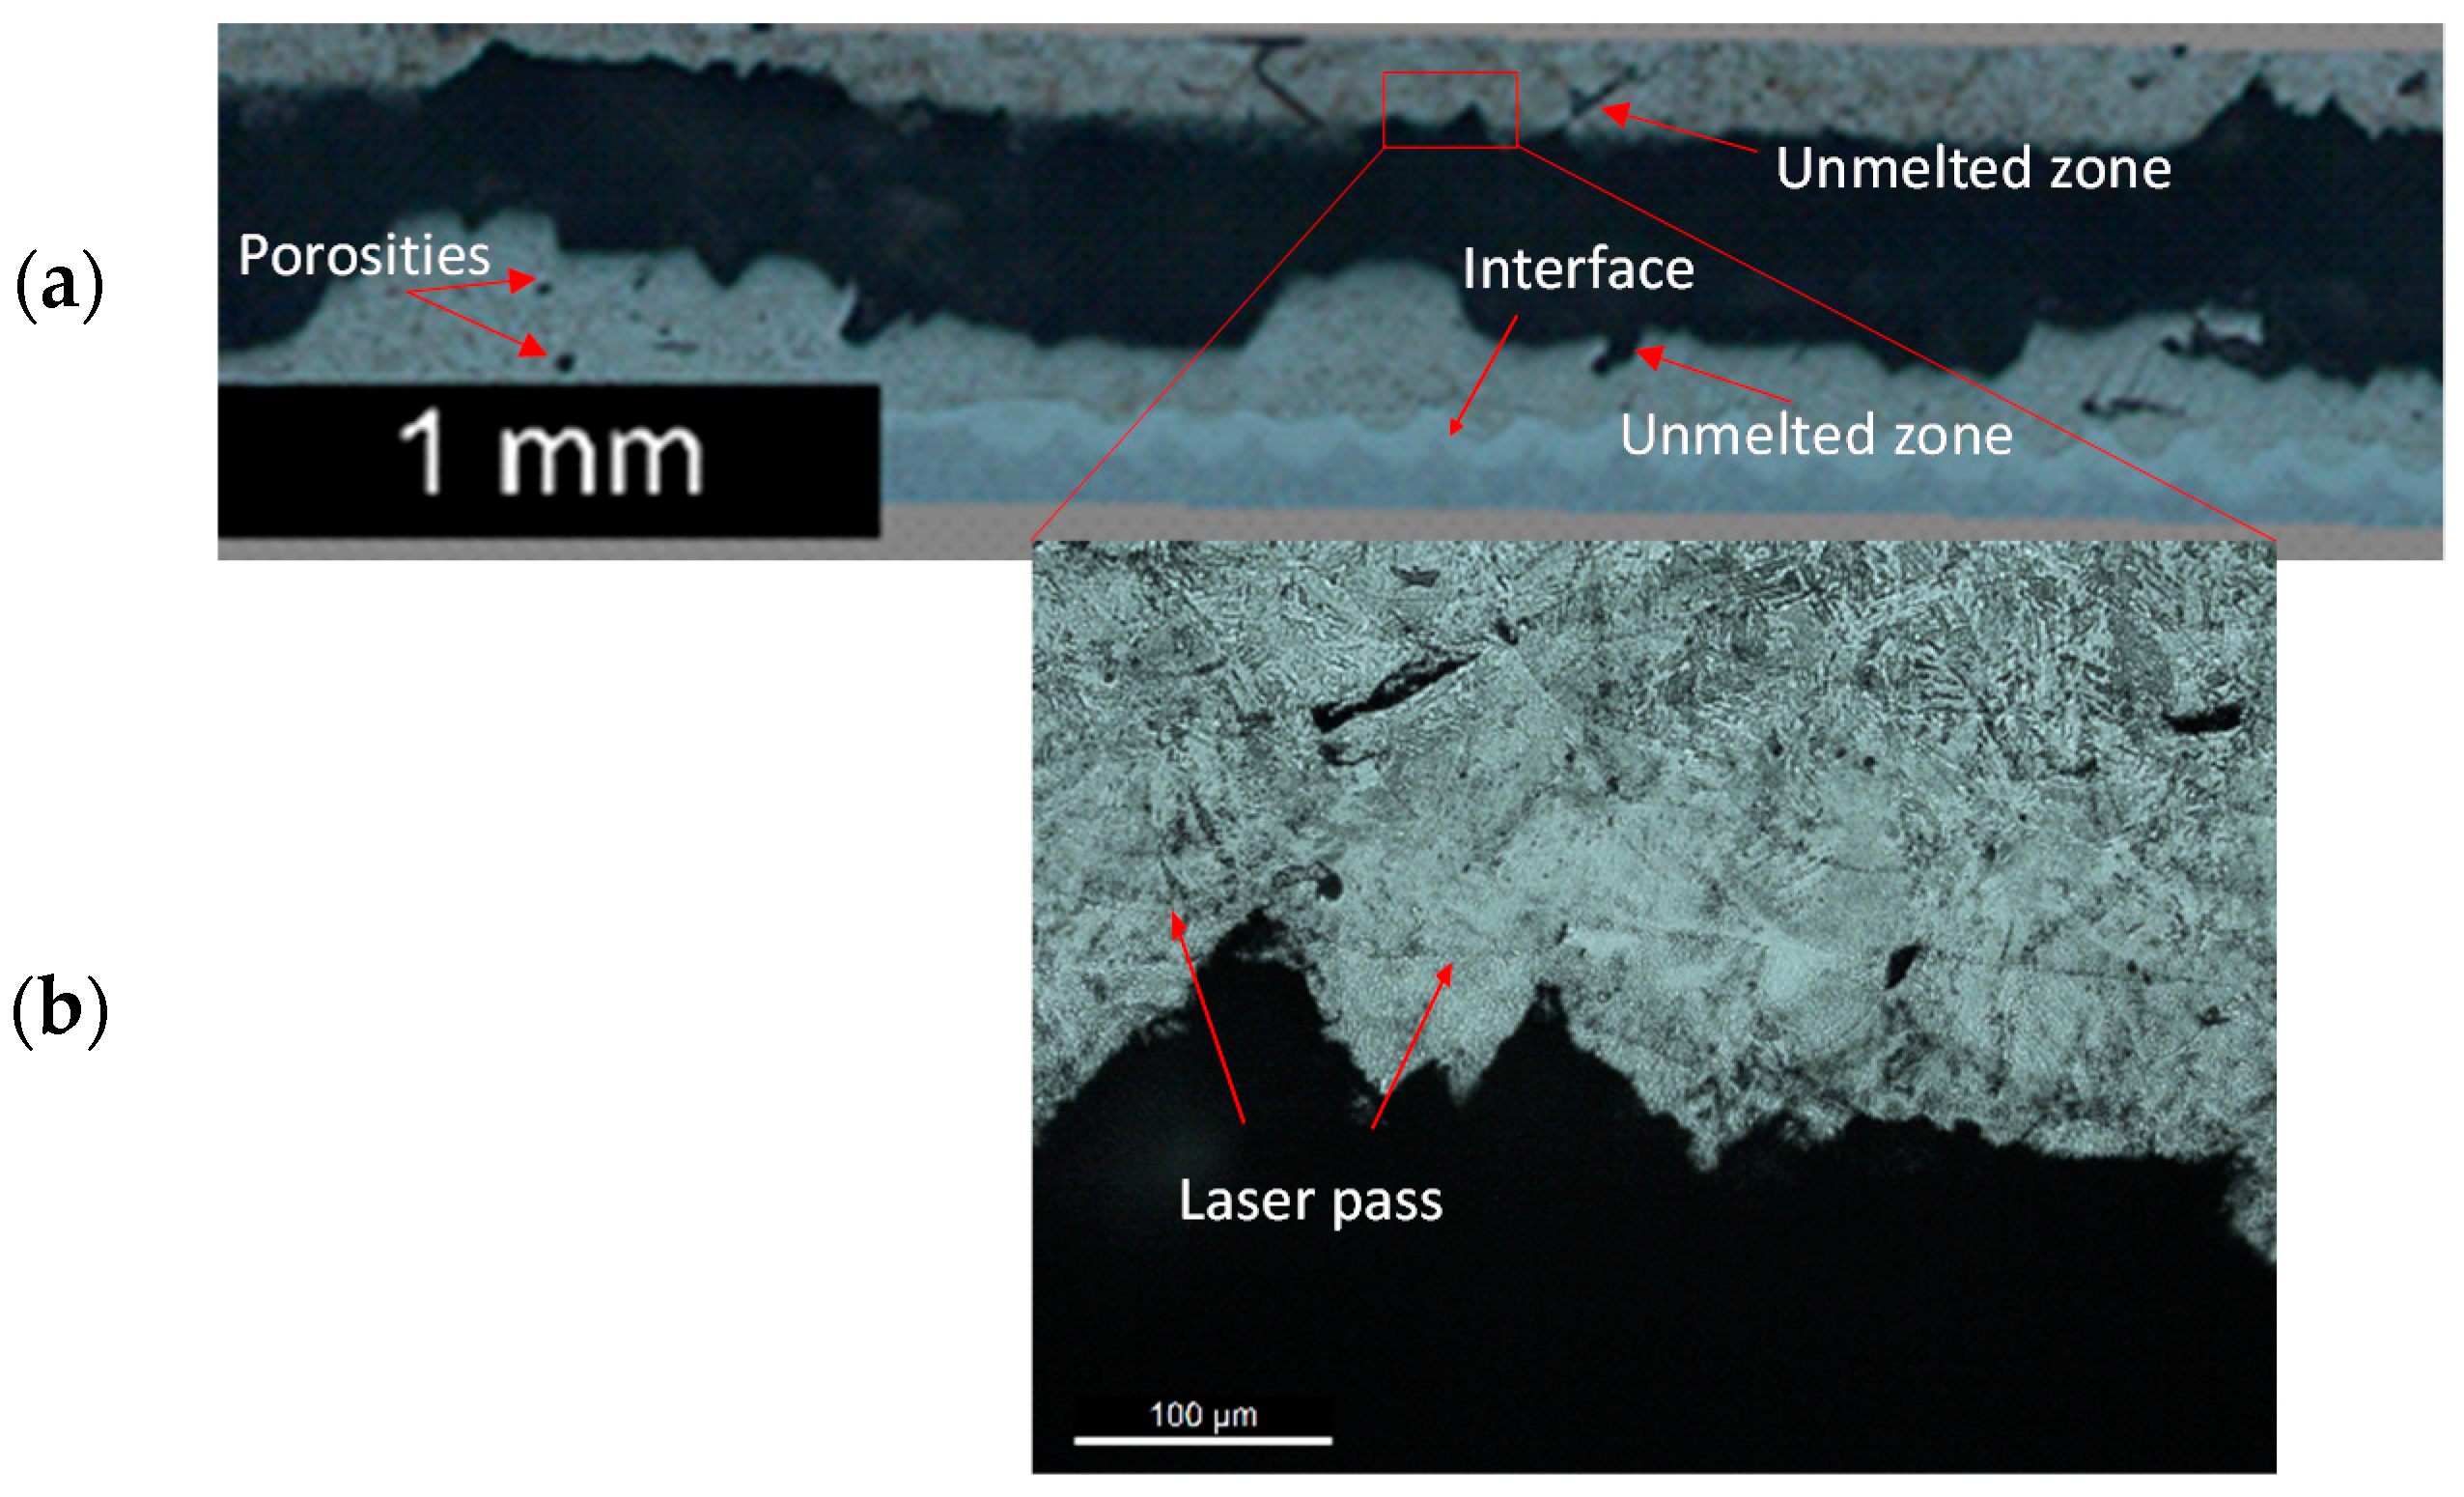
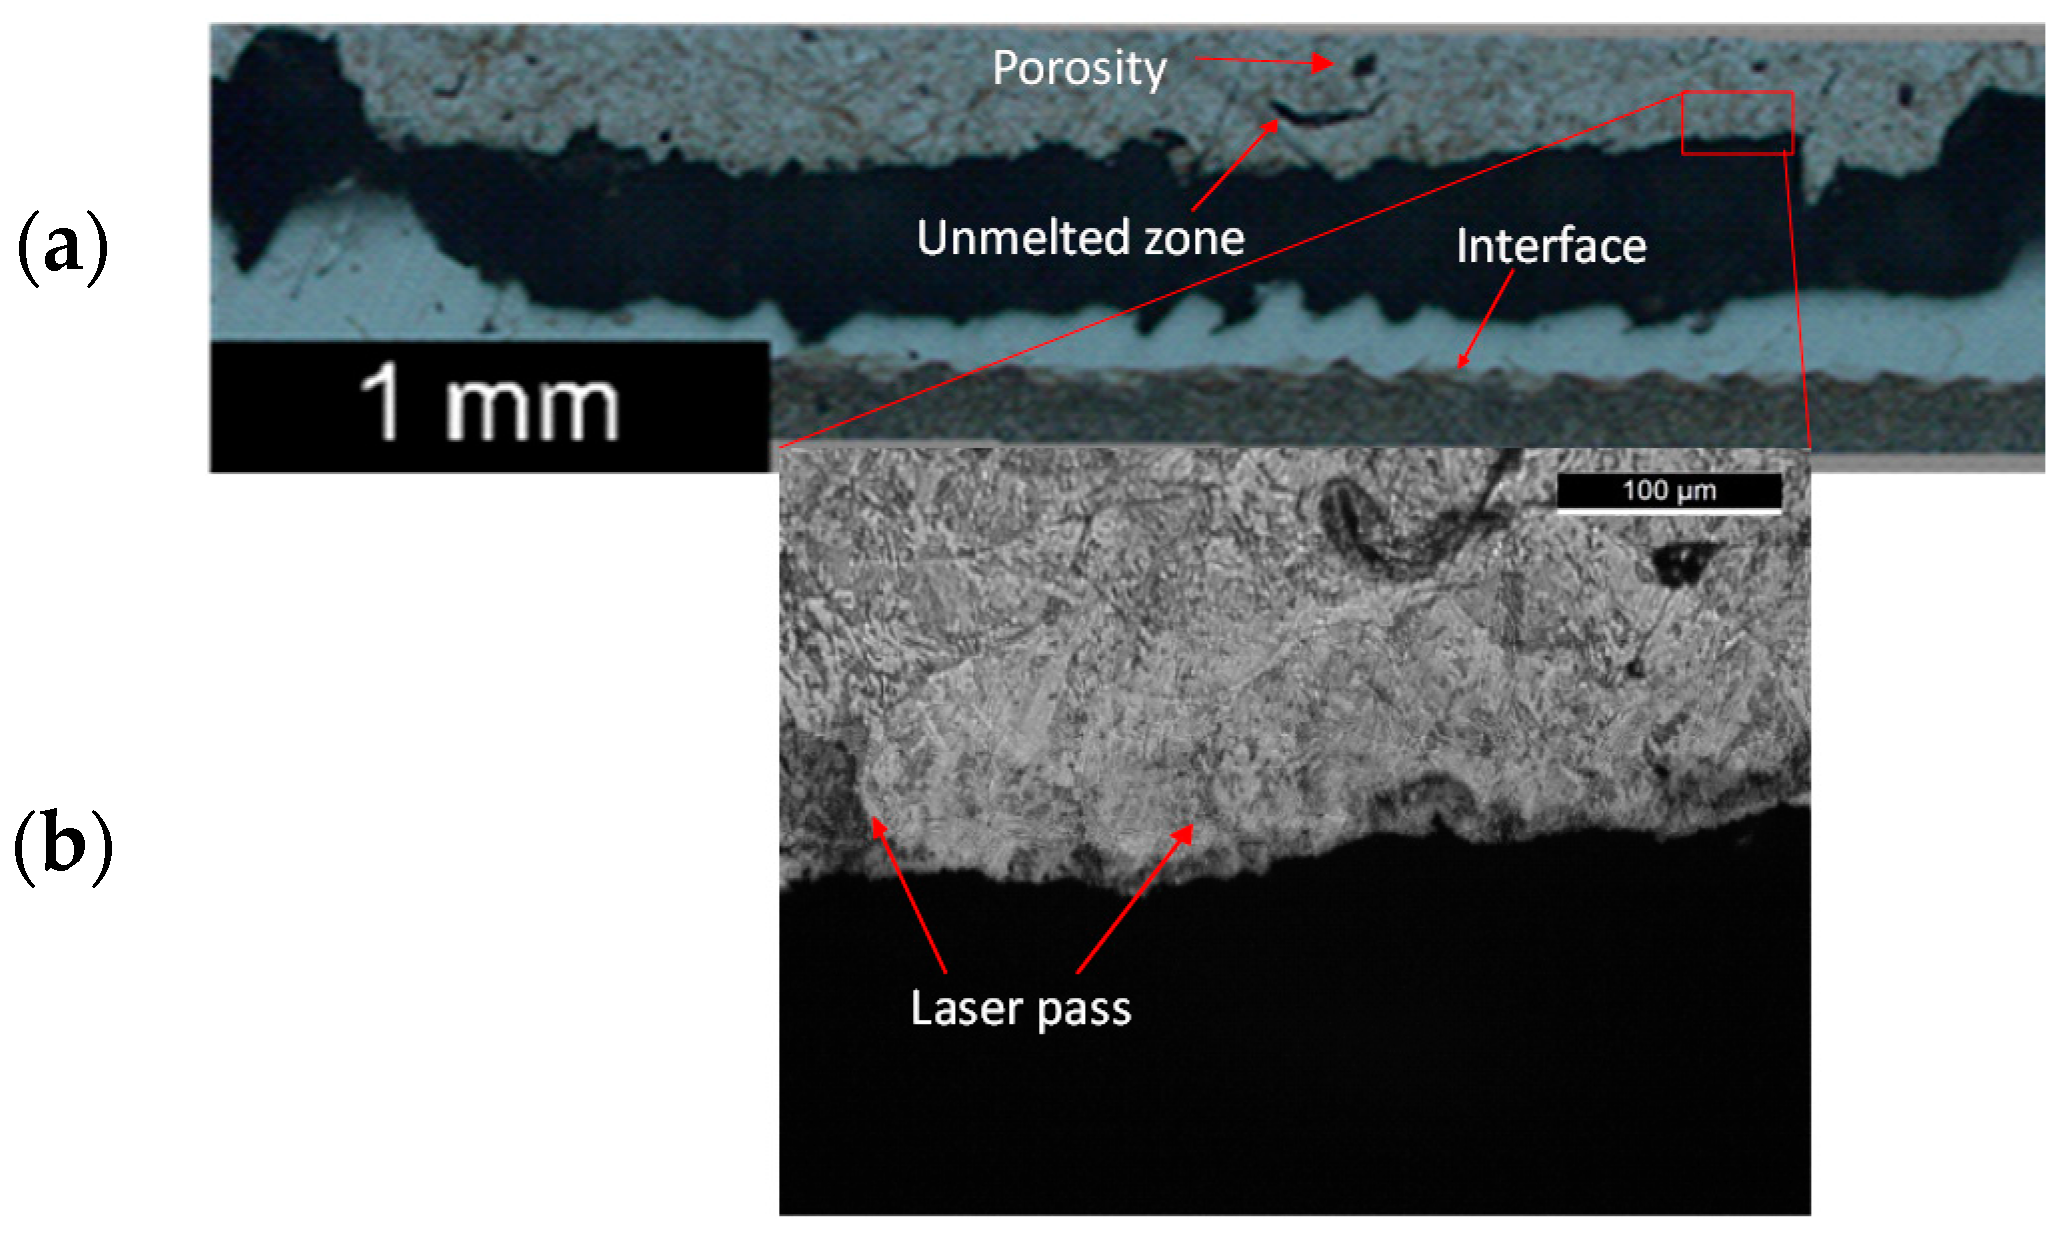
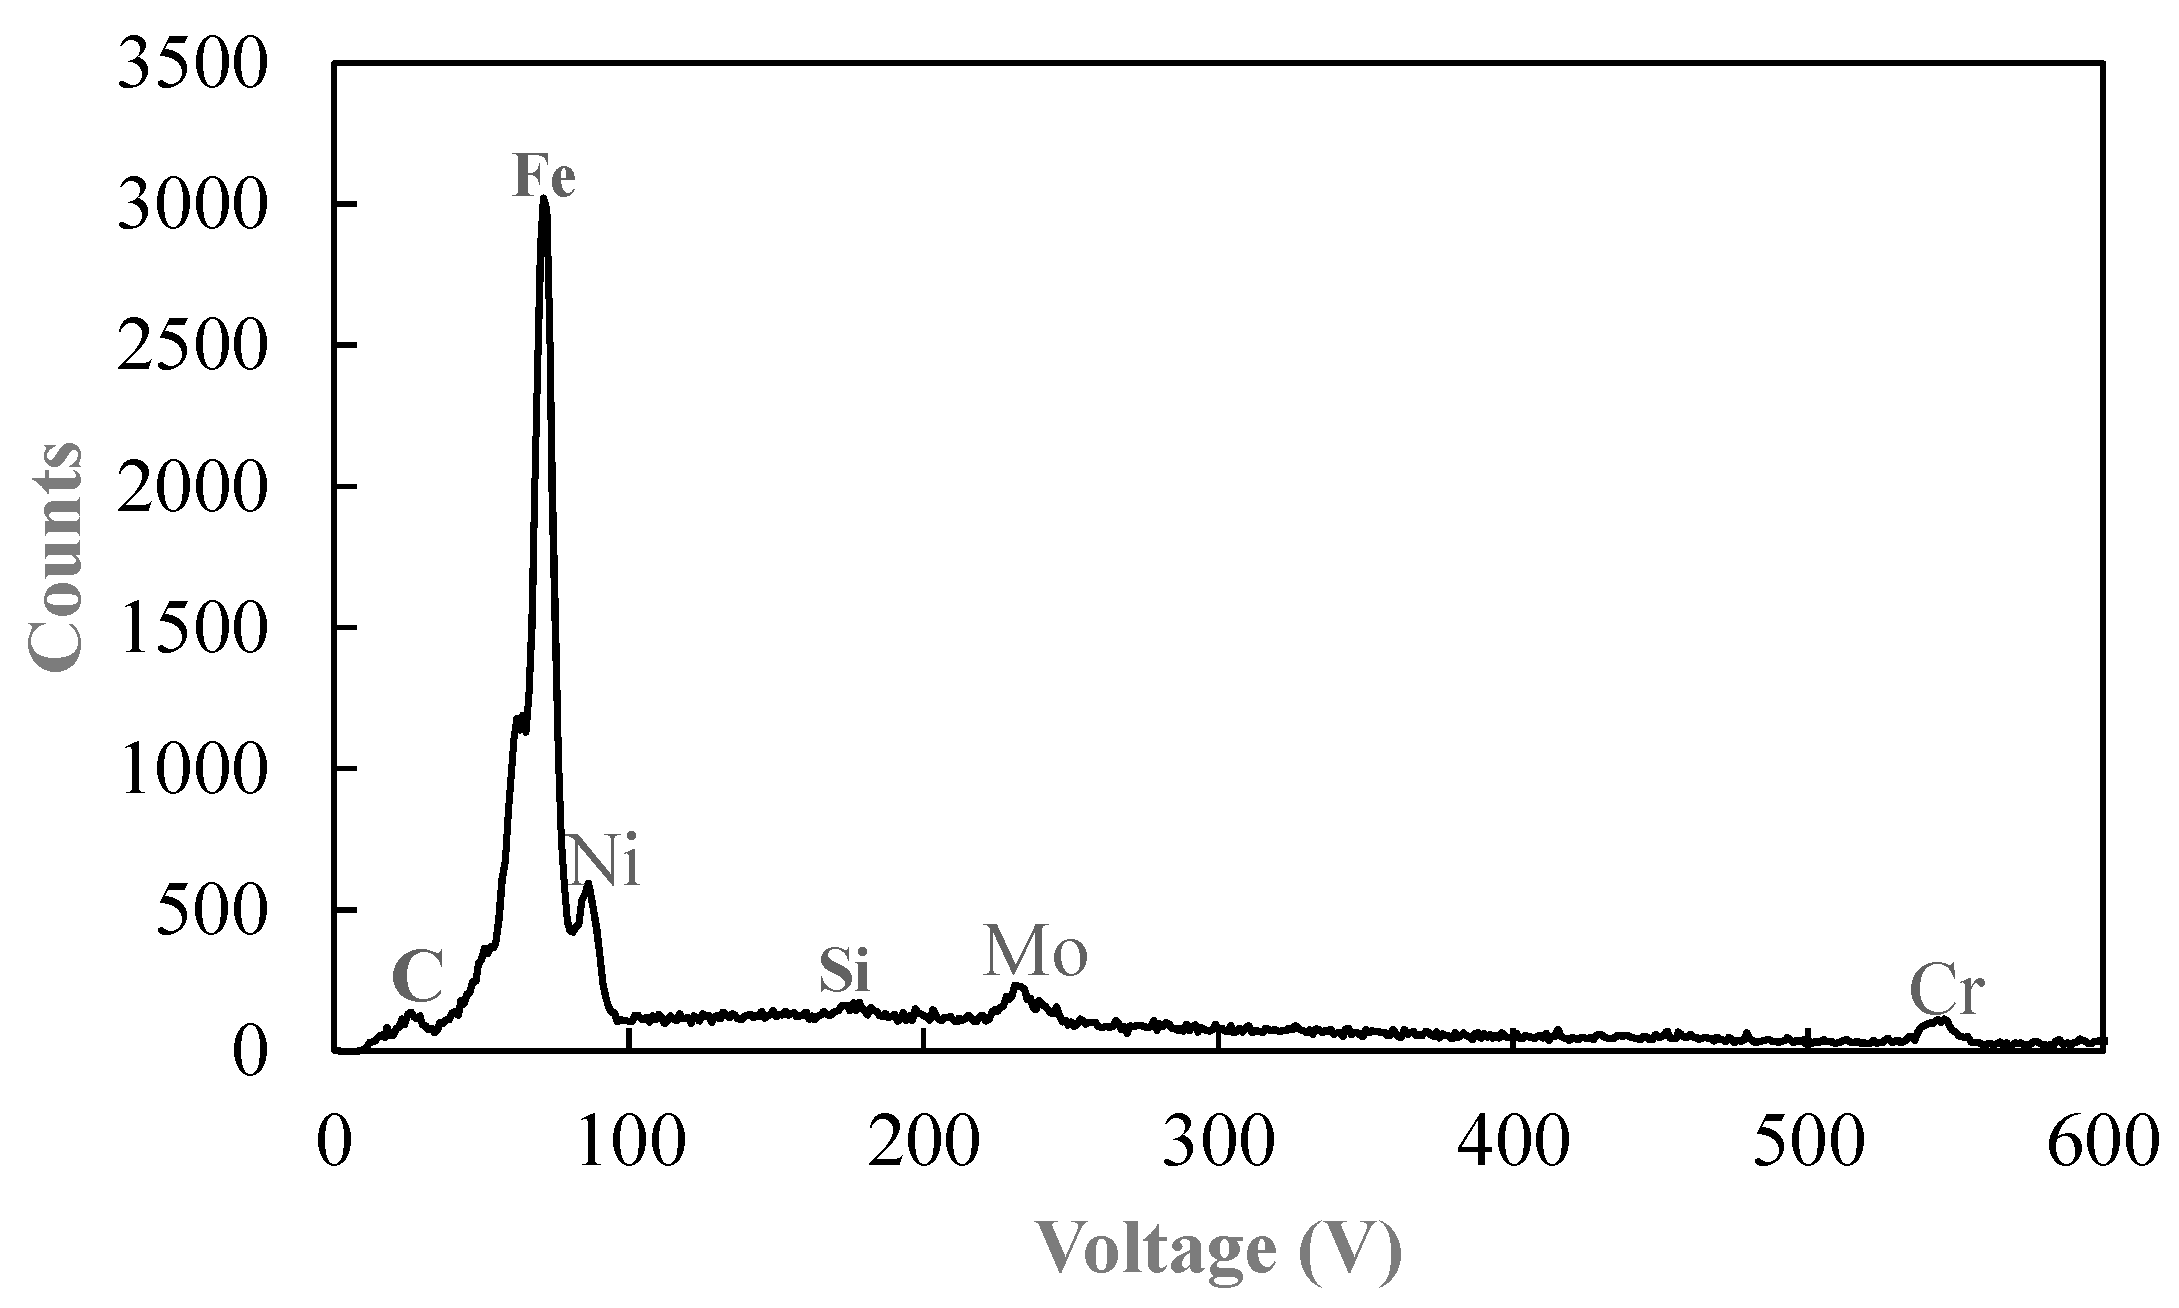
3.1. Metallographic Analysis
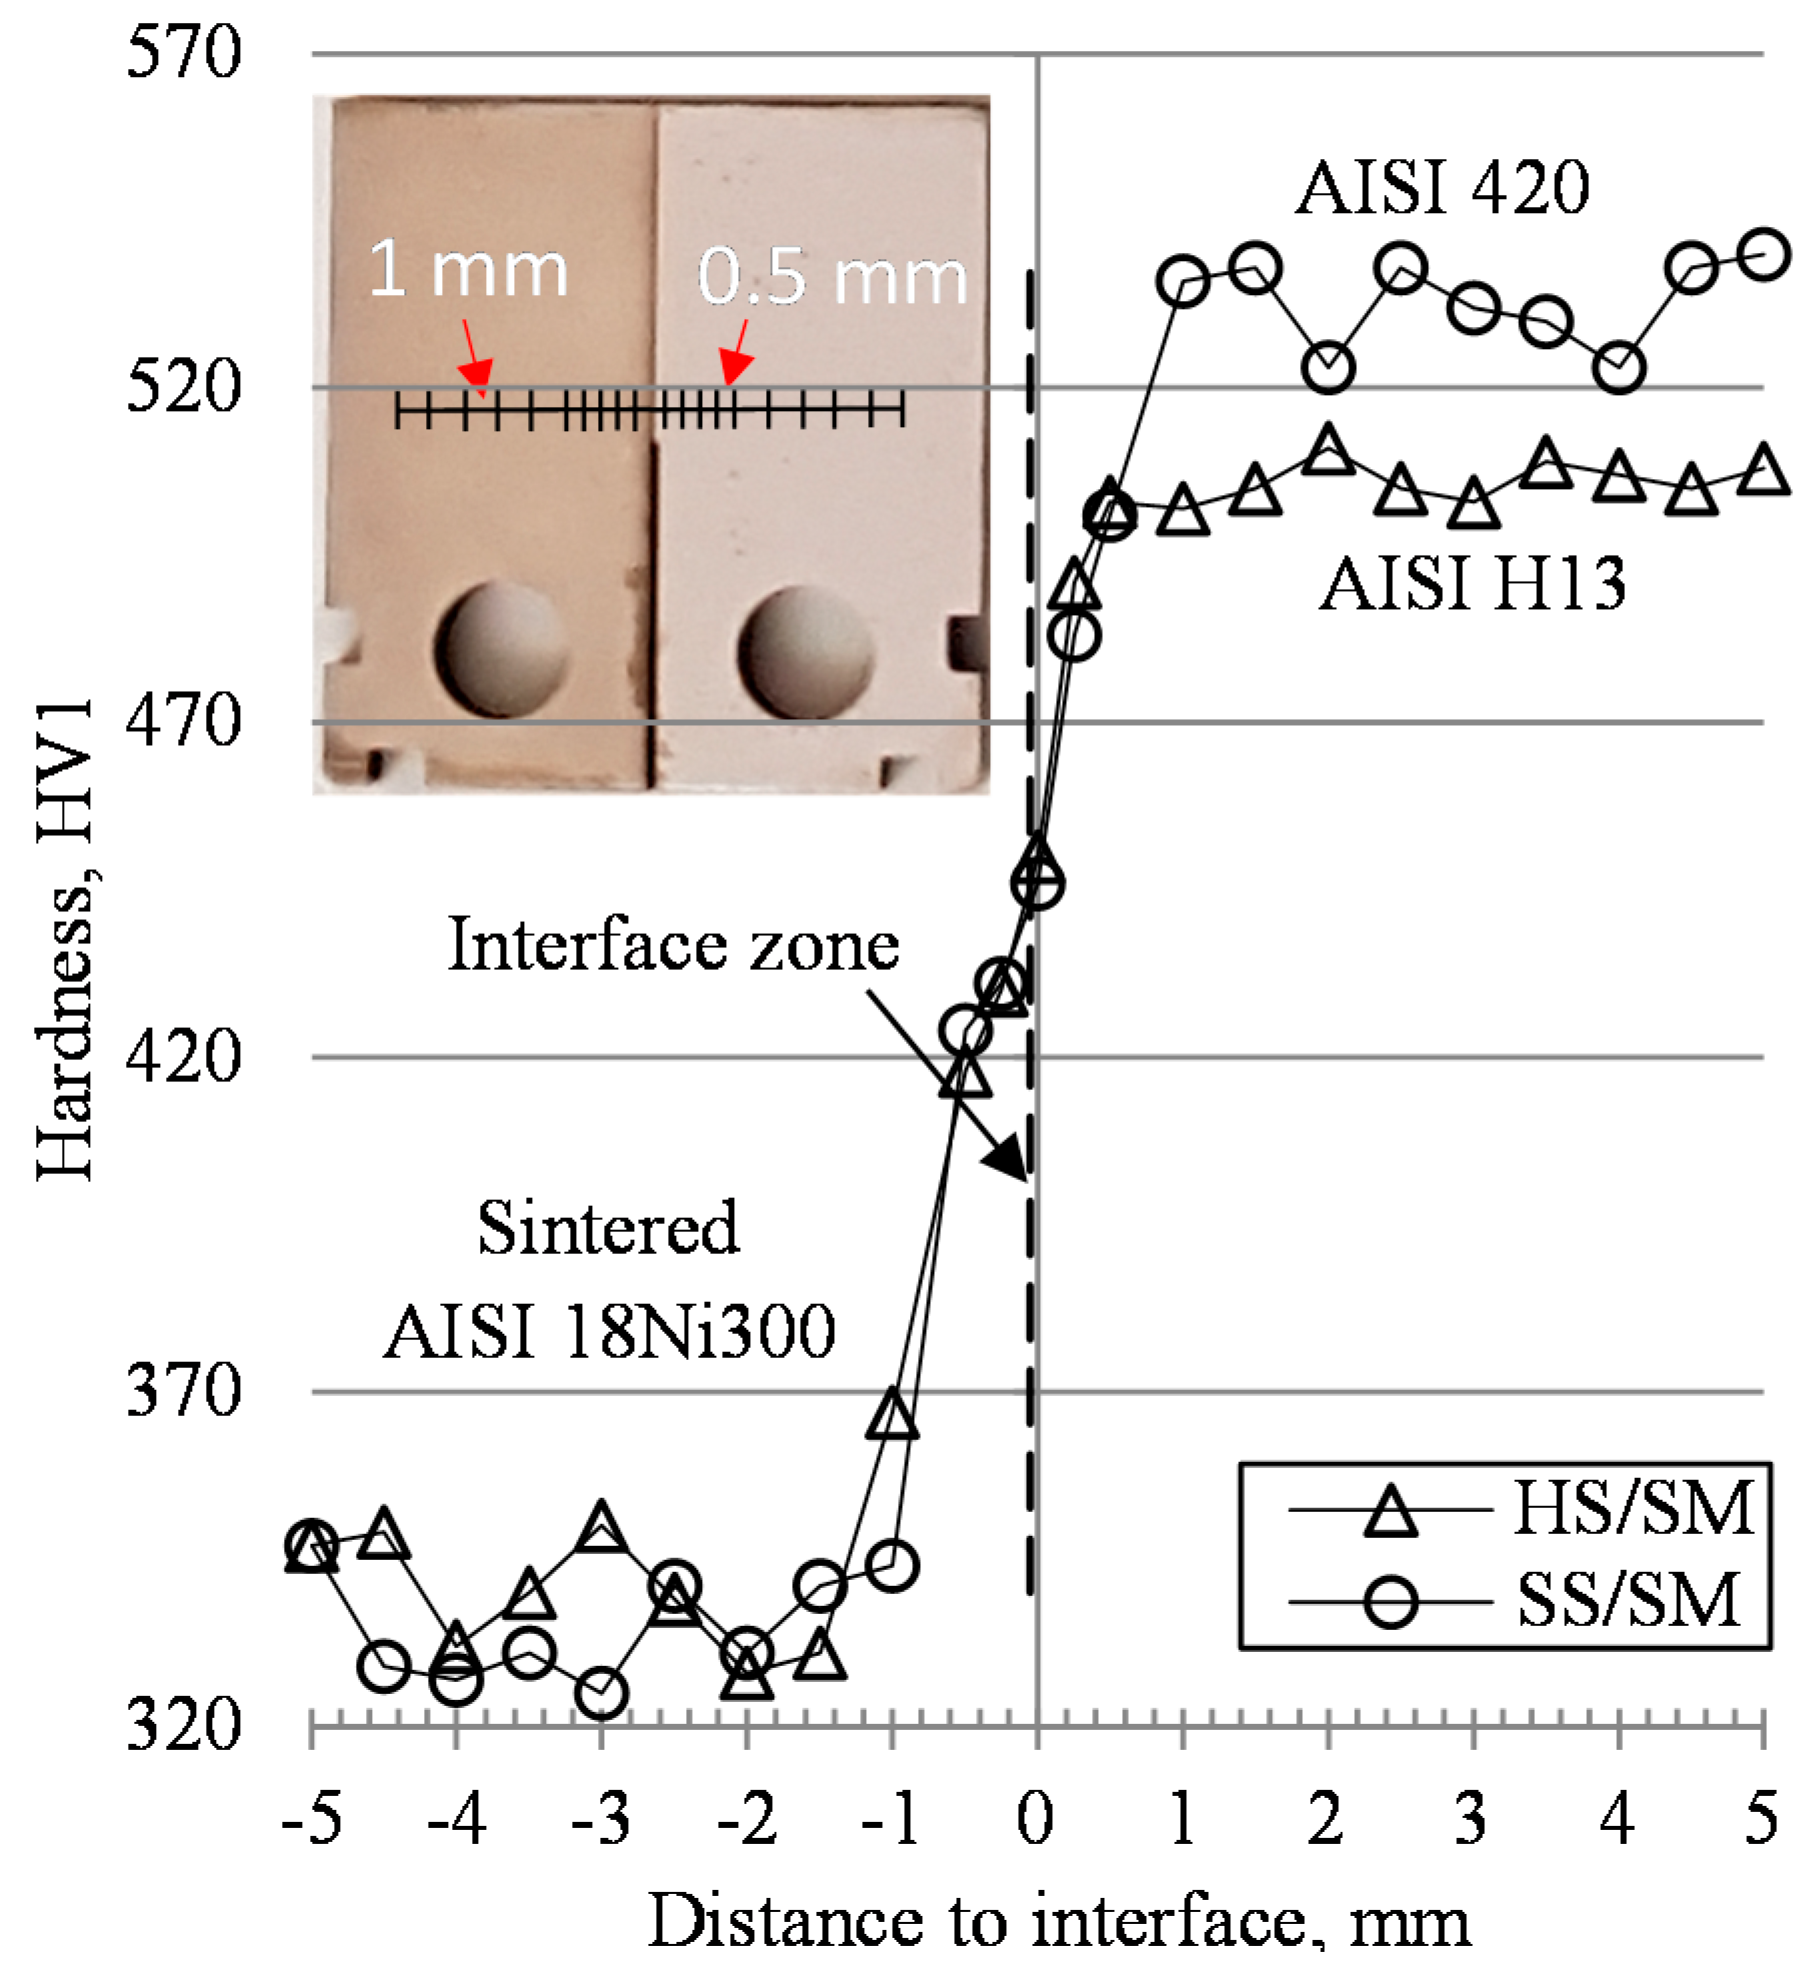
Figure 4 shows the main microstructures in different regions for an SS/SM sample. Figure 4a shows the microstructure for the AISI 420 steel being a ferritic structure with M23 C6 spherical carbides [23]. The interface between 3D-printed and conventional steel parts can be observed in Figure 4b,c (marked by an arrow) showing decarbonisation, and a thickness between 40–50 µm. Figure 4d reveals a martensitic microstructure for the 3D-printed half [24].
Similar analysis was carried out for HS/SM samples, as shown in Figure 5. The AISI H13 shows a tempered martensitic structure [25], as can be seen in Figure 5a. In this sample, the interface is not clearly identified, but is possible to note a different appearance between the 3D-printed material near the AISI H13 steel and the 3D-printed material distant from the interface (both zones are marked by arrows in Figure 5b). This variation in appearance is due to some decarbonisation, as observed in the previous sample.
The analysis by EDS (Energy-dispersive X-ray spectroscopy) of the chemical composition in the interface reveals that this is identical for both kinds of samples. Figure 6 presents an exemplary plot of the chemical composition for the interface of hybrid sample HS/SM 3D-printed with 200 mm/s of scan rate, where the Ni choice can be identified, which is characteristic for the 18Ni300 3D-printed steel, and other common choices for steels, namely C and Fe, with low carbon contents.

3.2. Microhardness

Figure 7 shows the hardness profiles for the three series analyzed. Similar hardness values were obtained for the 3D-printed half of about 330 HV1. The average hardness value of ten measurements in the interface of about 450 HV1 is quite similar for both samples, being 452 HV1 for SS/SM and 446 HV1 for HS/SM series. This is an expected result since the chemical composition and cooling rate during solidification in the interface of both series is similar. Finally, the AISI 420 steel presents a higher hardness than AISI H13, 532 HV1 and 506 HV1, respectively.

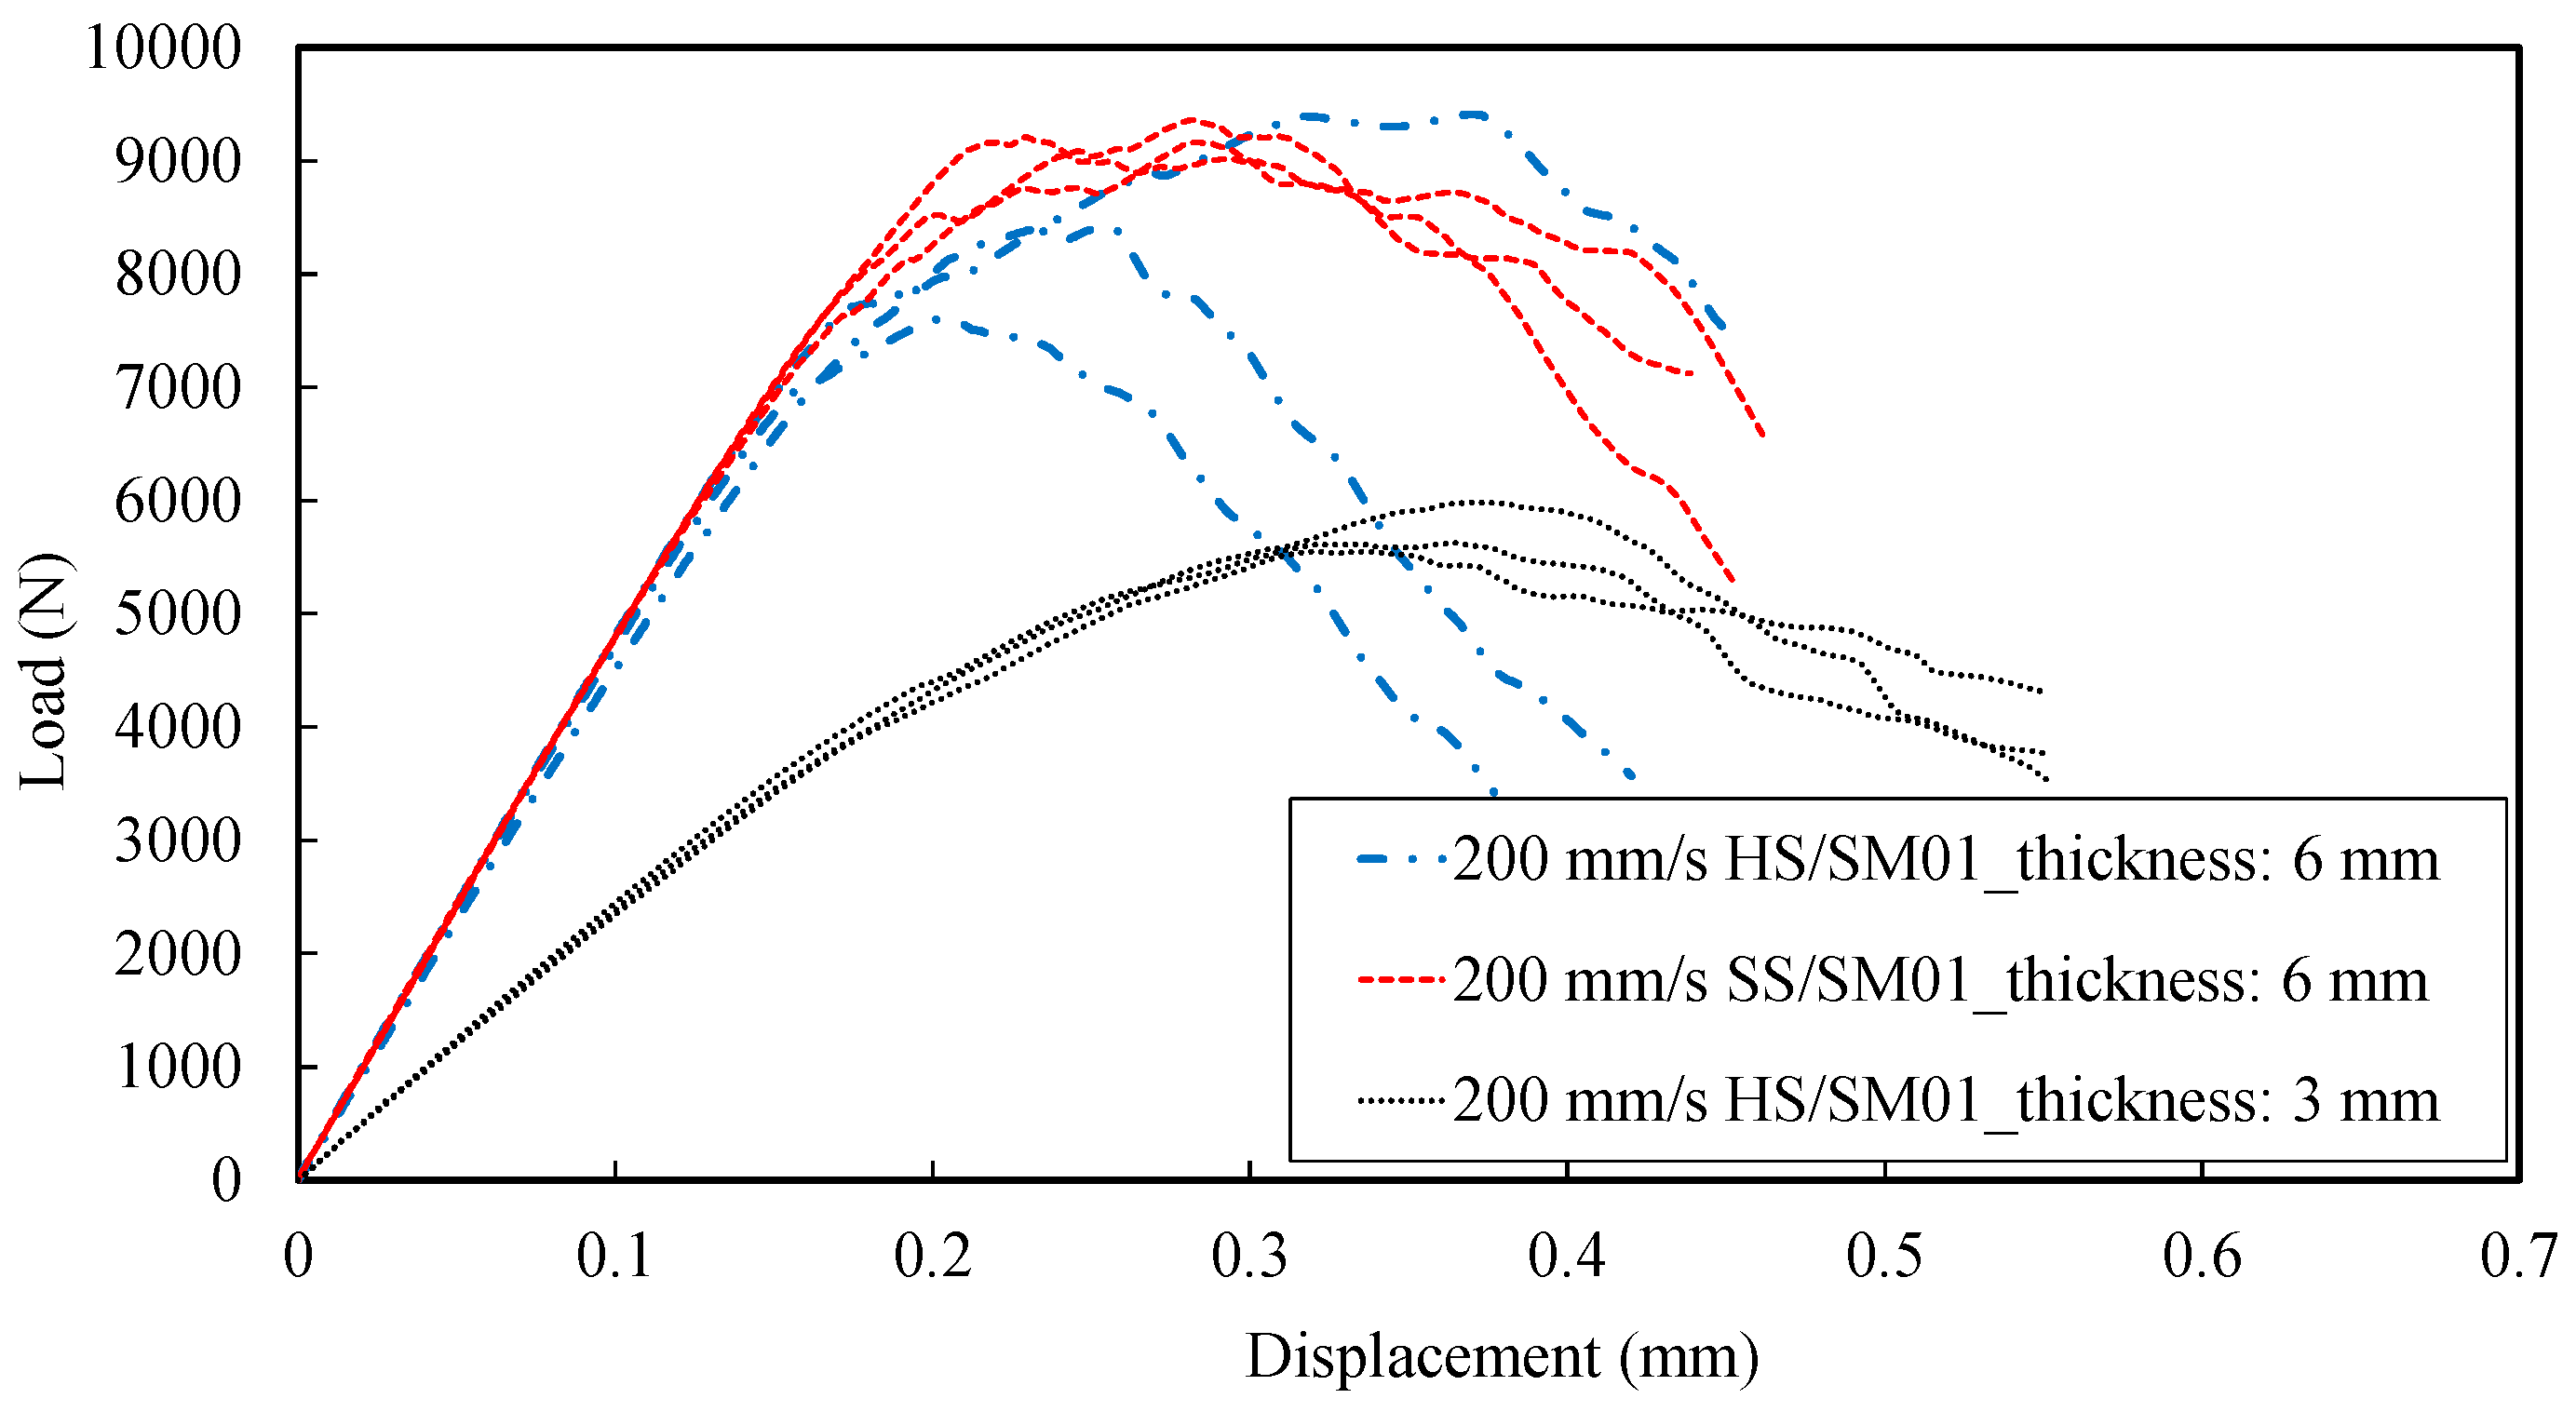
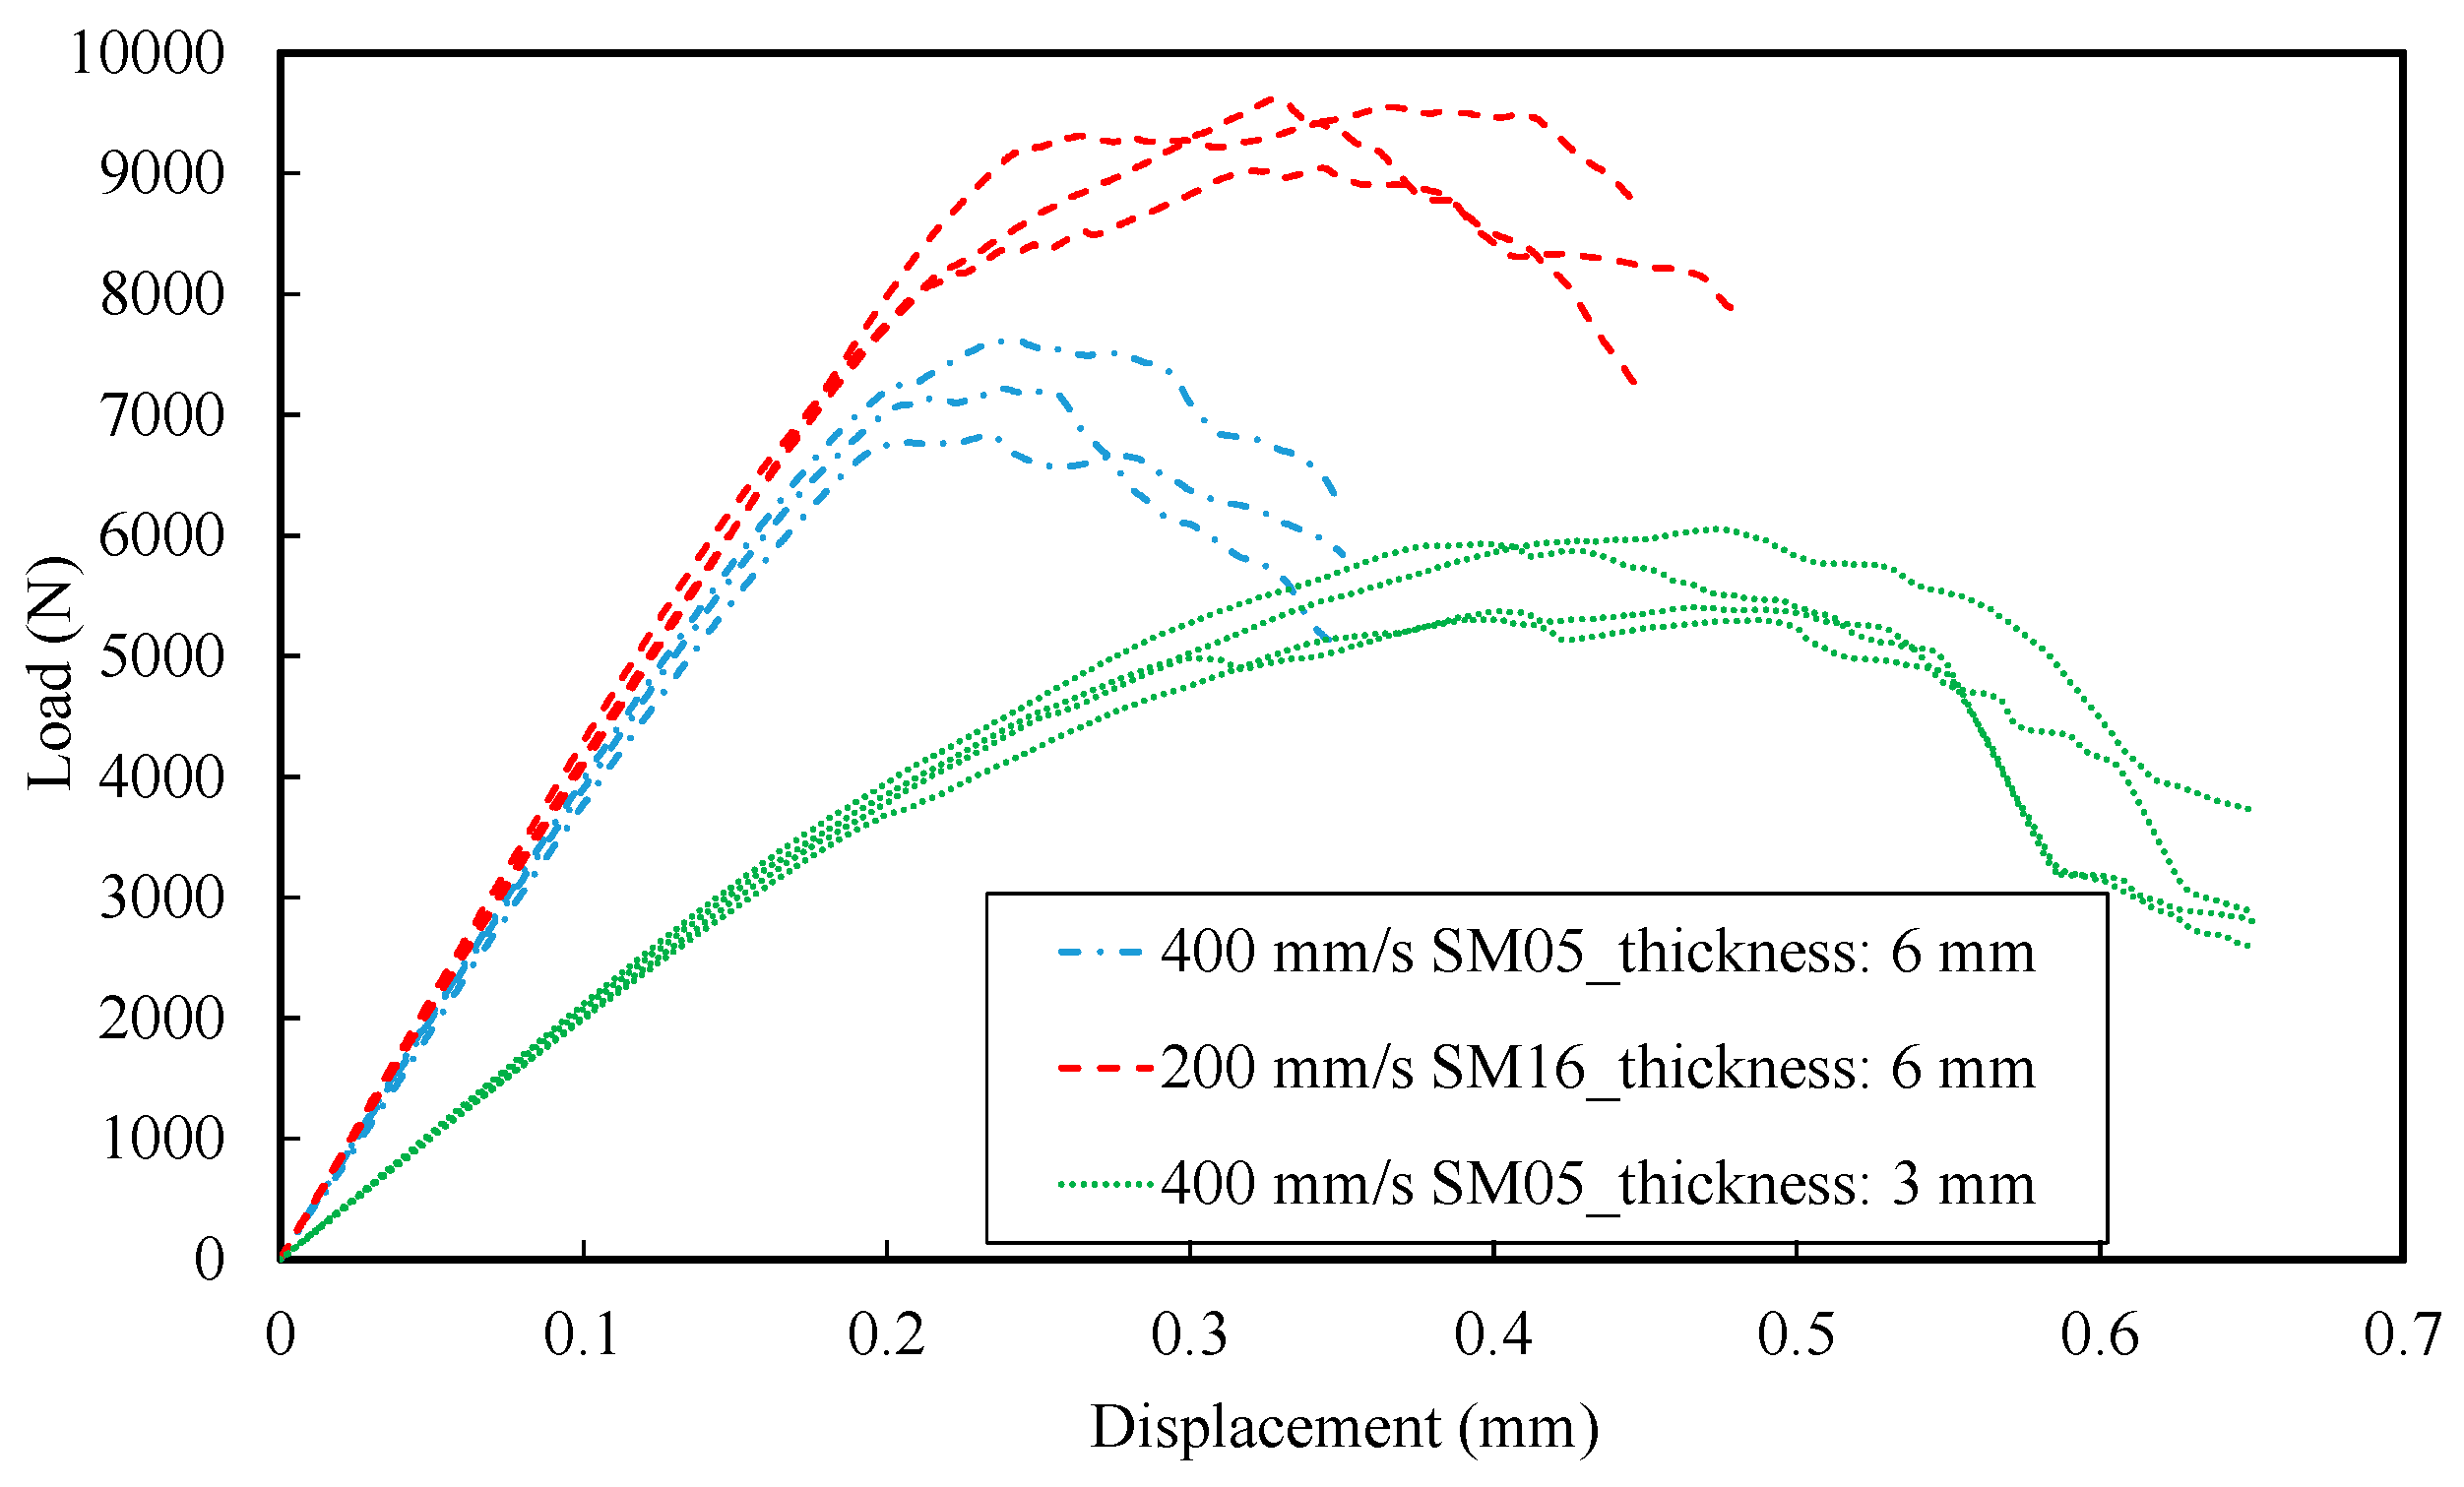
3.3. Fracture Tests: Load vs. Displacement Curves

Figure 8 shows exemplary load-displacement curves of fracture tests on fully 3D-printed specimens. The identification of the curves is made according to the following code: the first number correspond to scan rate (2 = 200 mm/s; 4 = 400 mm/s), the letters identify the material composition of the sample, the subsequent two digits identifies the number of the specimen and the last digit is the thickness in mm.
The analysis of Figure 8 shows, as expected, that the maximum loads are reached for the samples with the greatest thickness (6 mm). On the other hand, 3D-printed specimens with a scan speed of 400 mm/s have both lower maximum load and lower maximum displacement than the 3D-printed specimens produced with a scan speed of 200 mm/s, which can be explained by the increase in internal defects (porosities, unmelted powder, unmelted zones, among others) and a consequent decrease of strength and ductility as was referred by References [11,12]. In addition, as is known, the thickness has an important role in the material behavior. The lower stiffness associated with the reduction of the thickness of the sample approximates the tests to a plane stress condition leading to a greater plastic deformation, which may invalidate the determination of the fracture toughness in Mode I (KIc). Therefore, for the 3 mm thick specimens it is necessary to use the critical value of the J Integral parameter (JIc).
Figure 9 shows some of the curves obtained for HS/SM and SS/SM hybrids specimens, all processed with a scan rate of 200 mm/s. From the analysis of the figure stands out a behavior similar to the one observed in the previous figure, since the fracture occurs predominantly on the 3D-printed side of the samples. However, in this case, the stiffness of HS/SM and SS/SM hybrids specimens with 6 mm thickness are very similar, leading to the conclusion that the fracture is mainly controlled by the 3D-printed part of the specimen. On the other hand, there is a greater dispersion of the maximum loads for the HS/SM hybrids specimens. The interface of this specimens presents greater microstructural heterogeneities between the 3D-printed material next to the interface with the AISI H13 steel and the 3D-printed material distant from the interface (both zones are marked by arrows in Figure 5b). As referred in the metallographic analysis (Section 3.1), this variation of microstructure is due to some decarbonisation.

3.4. Fracture Toughness

Table 3, Table 4 and Table 5 present the fracture toughness KQ, the validity condition for KQ = KIc and Jc, for entirely 3D-printed (SM) samples, and hybrid SS/SM and HS/SM samples, for the two different scan rates (200 and 400 mm/s) and the two thickness values (3 and 6 mm). The results show that the majority of tests lead to invalid fracture toughness tests, because the geometry of samples do not guarantee a plain strain state, leading to an excessive plastic deformation at the crack tip. However, KQ increases at least 10% when thickness decreases from 6 to 3 mm and the increase of the scan speed from 200 to 400 mm/s reduces KQ above 20%. Hybrid samples show a slightly lower toughness than fully 3D-printed specimens, reaching almost 10% for HS/SM specimens, which is caused by microstructural variations at interface. The values of fracture toughness obtained in this work for the samples SM, SS/SM and HS/SM 3D-printed at 200 mm/s scan speed rate and 3 mm of thickness, are similar to those KQ values obtained for the steel H13 by J.M. Costa et al. [3] in laser deposit welding Nd-YAG with 4 mm thick specimens (KQ = 79.08 ± 31.76 MPa.m1/2).
The effects of thickness, substrate material and scan speed on the Jc parameter is similar to that observed for KQ, but with more pronounced trends. For the scan speed of 200 mm/s, Jc on 3 mm thickness samples decreases about 15% and 30% for SS/SM and HS/SM samples, respectively, when compared with entirely 3D-printed specimens. The same comparison on Jc for 6 mm thickness leads to toughness reductions of about 7% and 45% for SS/SM and HS/SM samples, respectively. The increasing of the scan speed from 200 to 400 mm/s reduces about 50% the Jc values for both 3D-printed and hybrid samples.
The estimated KQ for the specimens built with 200 mm/s of scan rate and 6 mm thick showed a decrease about 10% from the KIc value of the commercial steel grade 300 [18]. On the other hand, the 3 mm thick samples presented similar values between the estimated KQ and the KIc value of the commercial steel grade 300 [26] around 80 MPa.m1/2.
Santos et al. [12] show the level of defects observed in two samples produced with 200 mm/s and 400 mm/s of speed rate scan, respectively. It can be observed that the level of defects (area) increases from 0.74% to 7.37% when the speed increases from 200 to 400 mm/s. Besides, the fracture toughness decreases with the increase of scan speed rate, as previously mentioned (Table 5). Therefore, it can lead to a conclusion that the fracture toughness of SLM maraging steel grade 300 is lower that the commercial steel grade 300 produced by conventional processes, due to the internal defects (porosities, unmelted powder, unmelted zones, among others) and their effects.

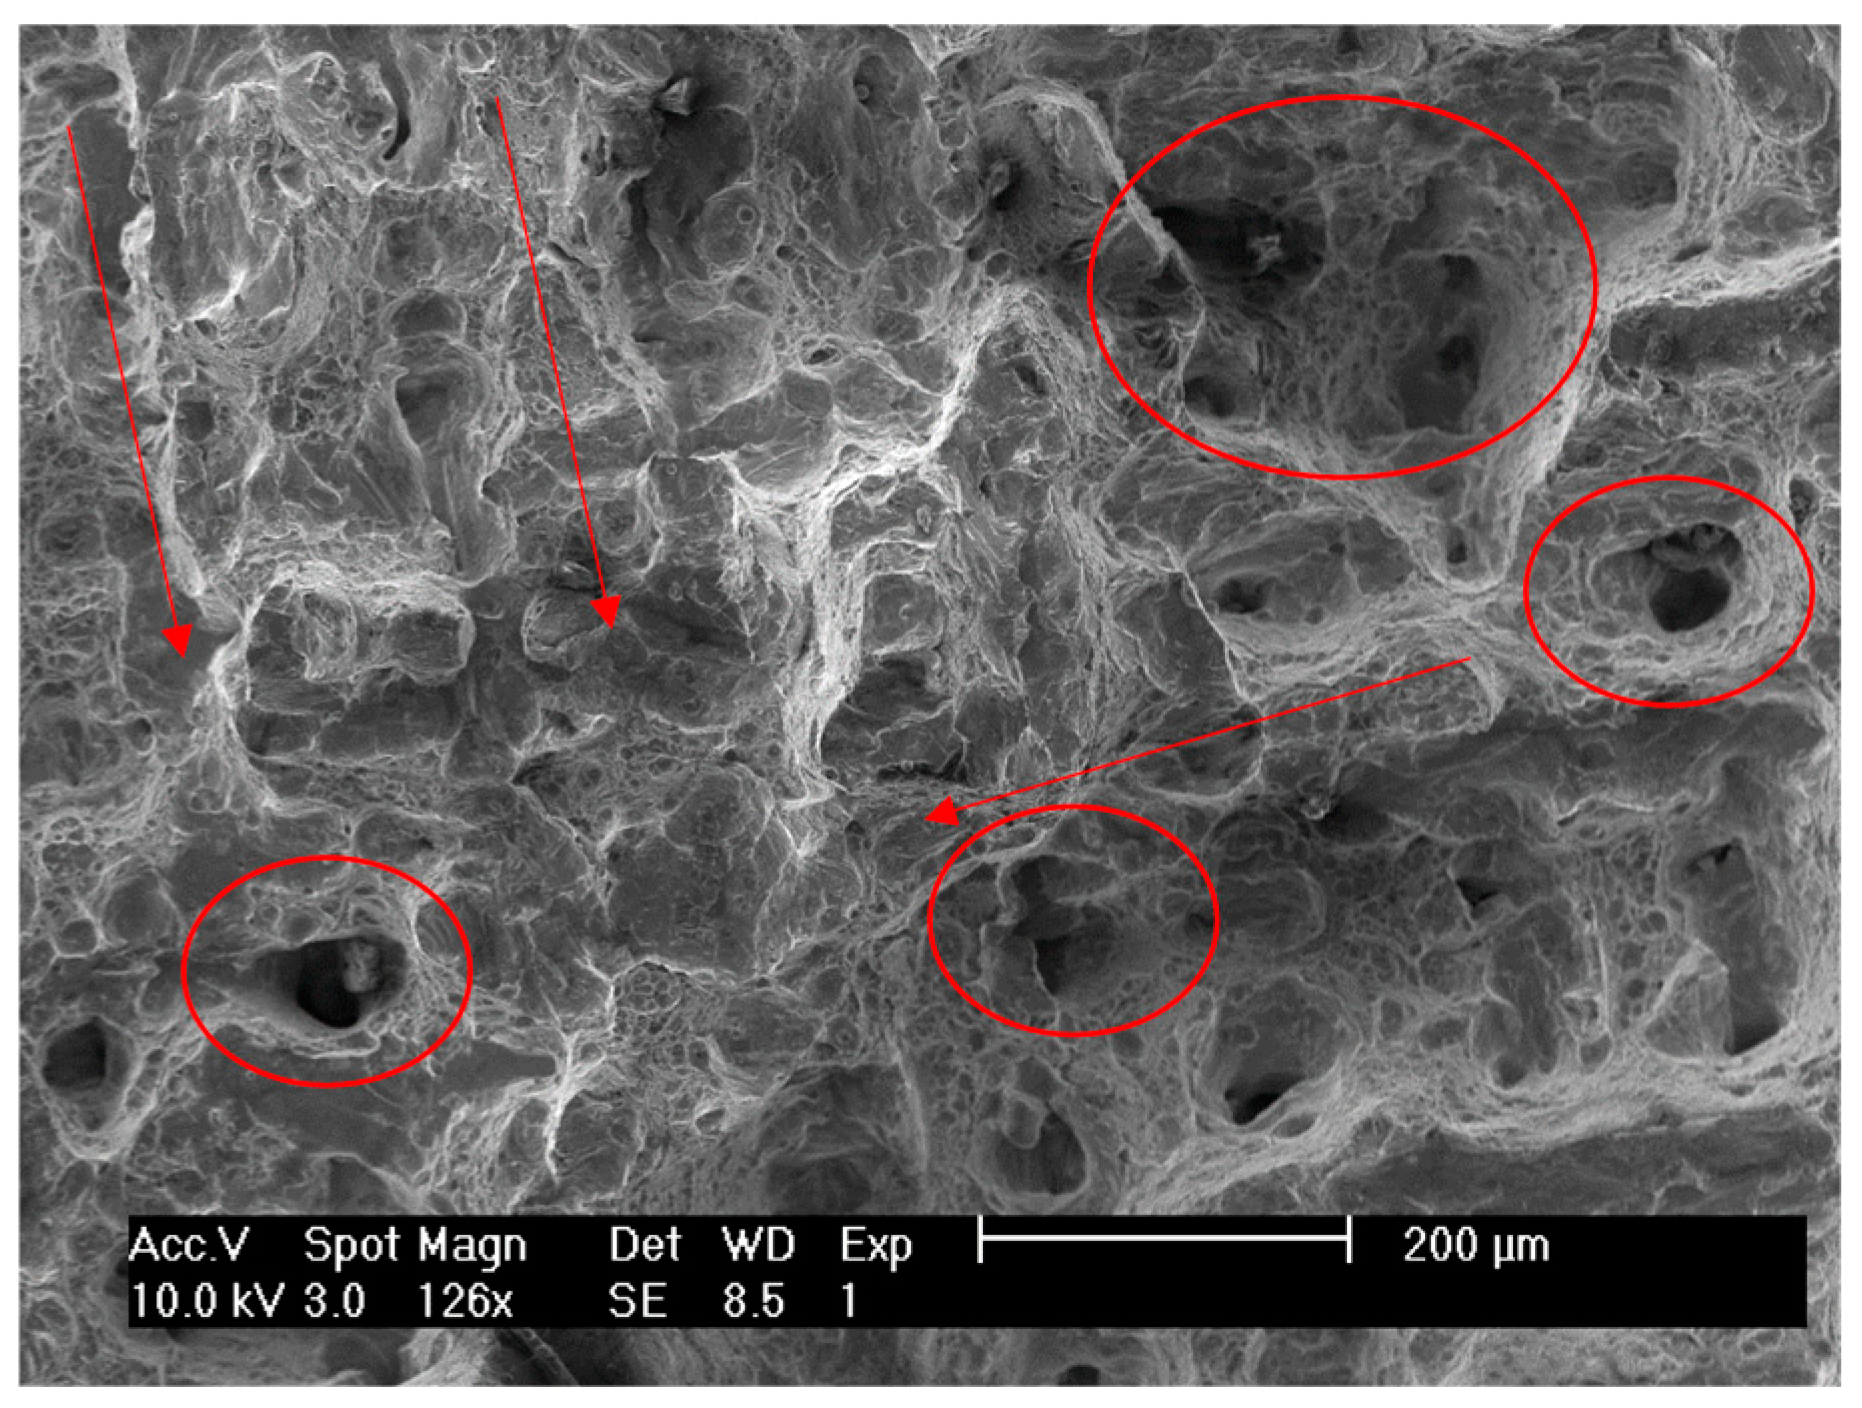
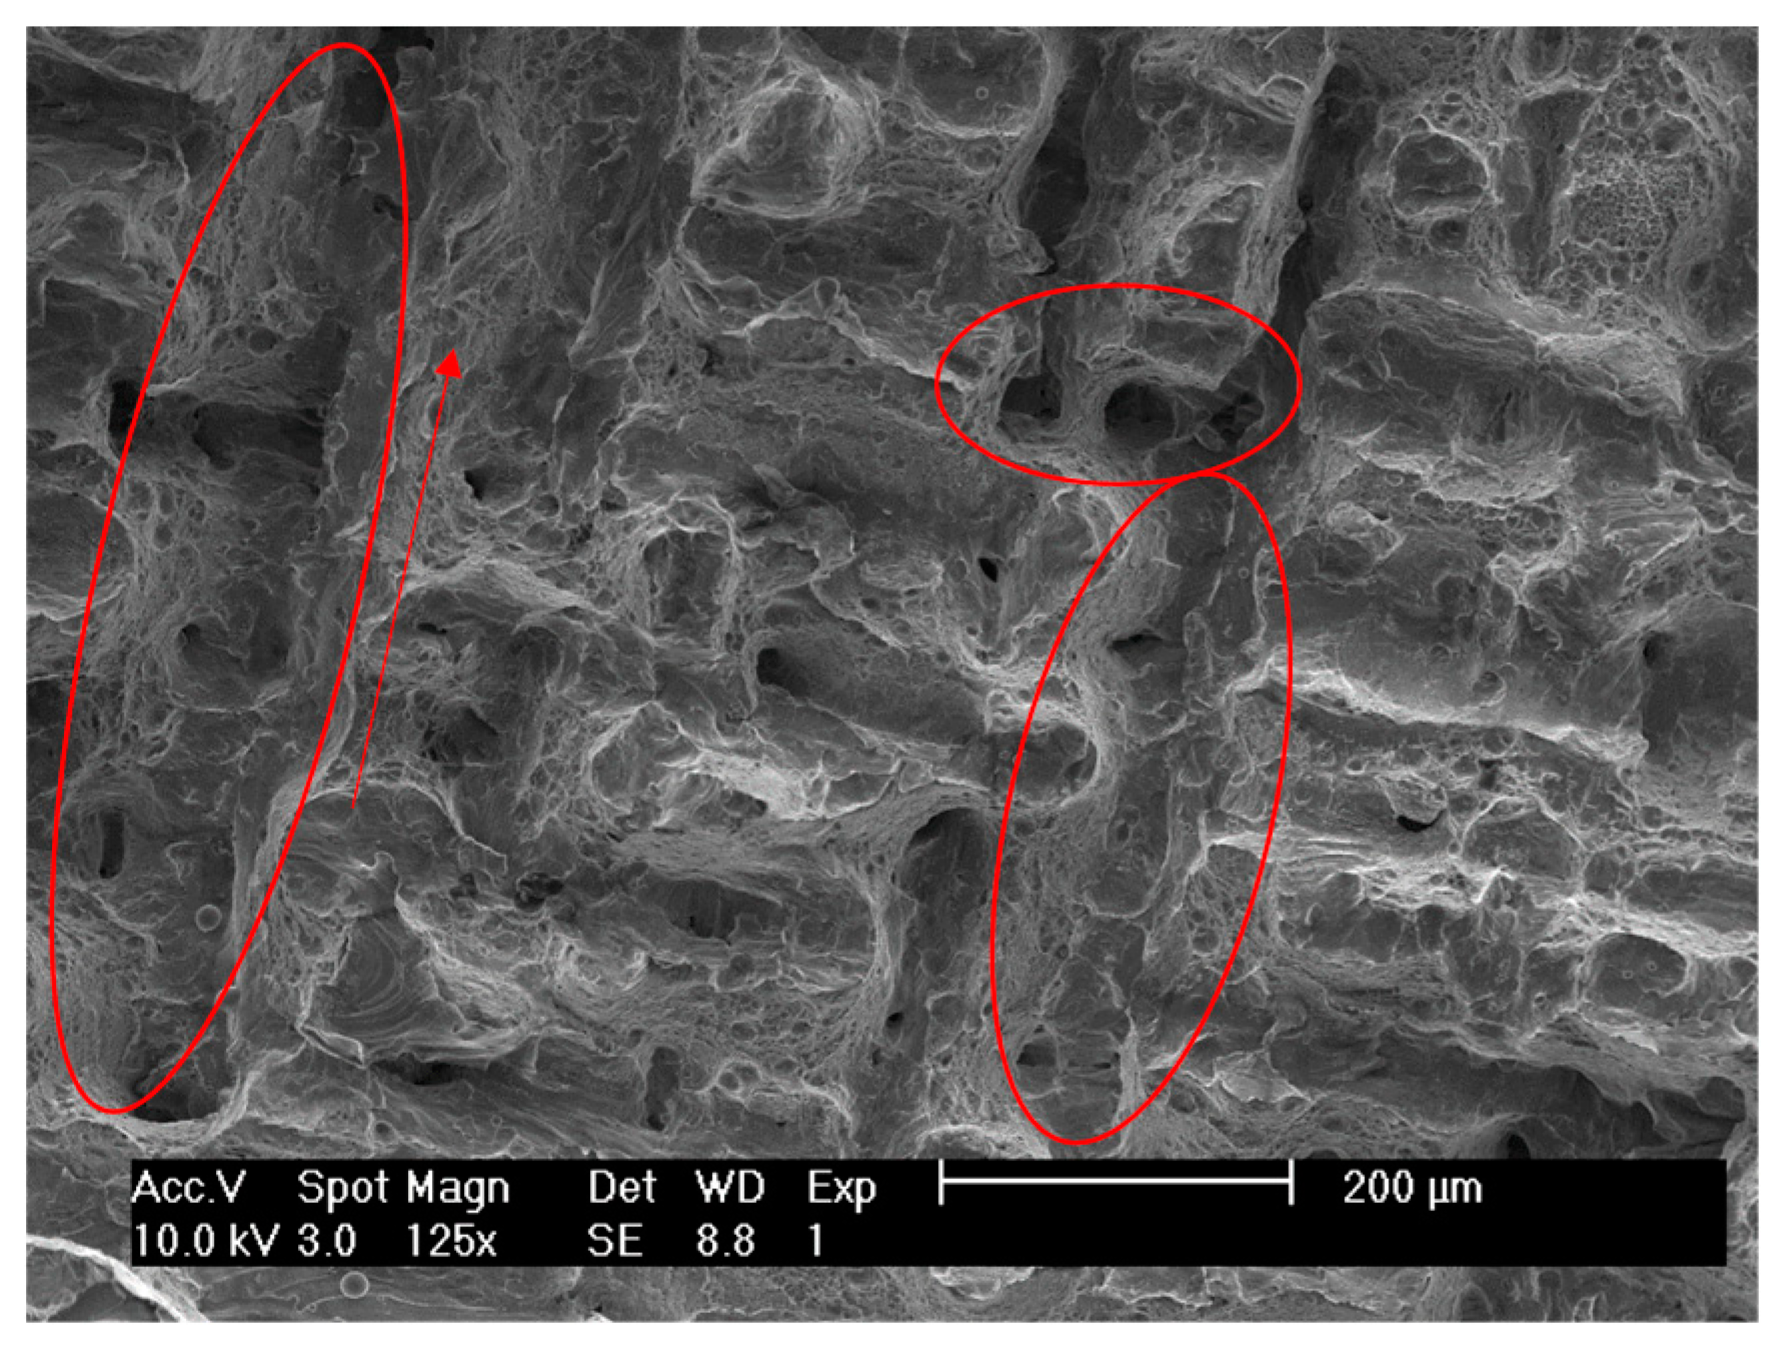
3.5. Fracture Surface Analysis

For a better understanding of the previous results, a microscopic analysis was carried out to observe the fracture surfaces and crack growth path of the SM, SS/SM and HS/SM samples with 6 mm of thickness 3D-printed at 200 mm/s. Figure 10 illustrates the crack growth path for SS/SM sample. Figure 10a shows that the fracture crack initiated and grew in the 3D-printed material near the interface zone. Therefore, the samples tend to fail near the midplane of the notch plane at greater microstructural heterogeneities and where the stresses are higher. The crack propagated in different laser layers’ interfaces through internal defects as shown in Figure 10b. Figure 11 is a SEM image of a SS/SM specimen showing the different laser directions between layers (marked by red arrows) and the porosities defects (circumscribed by red circles); this figure confirms the failure at the laser layers interfaces.
Figure 12 shows the crack growth path for a HS/ST sample 6 mm thick 3D-printed at 200 mm/s. Failure mechanisms are quite similar to those observed for SS/SM samples, but in this case the crack grew along the limit between the interface material and the 3D-printed material (Figure 12a). The crack path is determined by the variation of direction between laser layers, as illustrated in Figure 12b.
Figure 13 illustrates a SEM image of the fracture surface of HS/SM sample 6 mm tick 3D-printed at 200 mm/s. This image shows: the directions of laser passes marked by arrows for different layers, the porosity and the interstice between two different passes in the same directions (unmelted zone), both marked by red ellipses forms. Comparing Figure 11 and Figure 13, it can be concluded that the main failure mechanisms are quite similar in both hybrid series, characterized by an interface failure between adjacent laser layers, since the same 3D-printed material was deposed and the same parameters were used in the SLM process.

4. Conclusions

This work analyzed the fracture toughness performance for three different SLM 3D-printed compositions using CT specimens with 3 and 6 mm of thickness: samples of fully 3D-printed steel (maraging AISI 18Ni300), samples of AISI H13 with implant of 3D-printed maraging steel AISI 18Ni300 and samples of AISI 420 steel implant of 3D-printed maraging AISI 18Ni300. Two different scan rates (200 mm/s and 400 mm/s) were used to build the different samples through the SLM process. It was observed that a clear interface zone was created between 3D-printed and conventional steels by the SLM process. This interface presented the same chemical composition and hardness values for both ASI H13 and AISI 420 conventional steels. However, the interface showed a higher hardness than the 3D-printed material but lower than ASI H13 or AISI 420 steels. Additionally, the fracture toughness values did not exhibit significant variations, when comparing the different series for the same scan rate and thickness. Fracture toughness decreases when the sample thickness increases and fracture toughness values presented a great agreement with other methods, namely laser welding with modern Nd-YAG process. The SLM 18Ni300 maraging steel fracture toughness value is slightly lower when compared to the commercial steel grade 300 because the internal defects produced by SLM have an important role in decreasing the mechanical performance. Finally, the crack growth path for all hybrid specimens was along the boundary between the interface zone and the 3D-printed steel, showing a brittle mechanics fracture due to the defects produced by the SLM process.

Author Contributions

Investigation, Data Curation, L.M.S.S.; Investigation, Data Curation, Writing-Original Draft Preparation, Writing-Review & Editing, J.D.J.; Supervision, Writing-Review & Editing, J.M.F.; Investigation, Writing-Review & Editing, J.D.C.; Investigation, Resources, C.C.

Funding

Project number 016713 (PTDC/EMS-PRO/1356/2014) financed by Project 3599 “Promover a Produção Científica e Desenvolvimento Tecnológico e a Constituição de Redes Temáticas” (3599-PPCDT) and FEDER funds.

Acknowledgements

EROFIO S.A. industry for the supply of the testing samples.

Conflicts of Interest

The authors declare no conflicts of interest.

References

  1. Fayazfar, H.; Salarian, M.; Rogalsky, A.; Sarker, D.; Russo, P.; Paserin, V.; Toyserkan, E. A critical review of powder-based additive manufacturing of ferrous alloys: Process parameters, microstructure and mechanical properties. Mater. Des. 2018, 144, 98–128. [Google Scholar] [CrossRef]
  2. Balc, N.C.; Berce, P.; Pacurar, R. Comparison between SLM and SLS in producing complex metal parts. In Annals of DAAAM for 2010 & Proceeding of the 21st International DAAAM Symposium, Volume 21, No. 1, ISSN 1726-9679; DAAAM International: Vienna, Austria, 2010. [Google Scholar]
  3. Costa, J.M.; Ferreira, J.M.; Capela, C. Fracture toughness of the heat affected zone on Nd-YAG laser welded joints. Eng. Fail. Anal. 2009, 16, 1245–1251. [Google Scholar] [CrossRef]
  4. Kempena, K.; Yasaa, E.; Thijsb, L.; Krutha, J.-P.; Van Humbeeckb, J. Microstructure and mechanical properties of Selective Laser Melted 18Ni-300 steel. J. Alloys Compd. 2017, 725, 355–364. [Google Scholar] [CrossRef]
  5. Casalino, G.; Campanelli, S.L.; Contuzzi, N.; Ludovico, A.D. Experimental investigation and statistical optimization of the selective laser melting process of a maraging steel. Opt. Laser Technol. 2015, 65, 151–158. [Google Scholar] [CrossRef]
  6. Bai, Y.; Yang, Y.; Wang, D.; Zhang, M. Influence mechanism of parameters process and mechanical properties evolution mechanism of maraging steel 300 by selective laser melting. Mater. Sci. Eng. A 2017, 703, 116–123. [Google Scholar] [CrossRef]
  7. Casatia, R.; Codurib, M.; Lecisa, N.; Andrianopolic, C.; Vedania, M. Microstructure and mechanical behavior of hot-work tool steels processed by Selective Laser Melting. Mater. Charact. 2018, 137, 50–57. [Google Scholar] [CrossRef]
  8. Shamsaei, N.; Yadollahi, A.; Bian, L.; Thompson, S.M. An overview of direct laser deposition for additive manufacturing; Part II: Mechanical behavior, process parameter optimization and control. Addit. Manuf. 2015, 8, 12–35. [Google Scholar] [CrossRef]
  9. Chan, K.S.; Koike, M.; Mason, R.L.; Okabe, T. Fatigue life of titanium alloys fabricated by additive layer manufacturing techniques for dental implants. Metall. Mater. Trans. A 2013, 44, 1010–1022. [Google Scholar] [CrossRef]
  10. Wycisk, E.; Emmelmann, C.; Siddique, S.; Walther, F. High cycle fatigue (HCF) performance of Ti-6Al-4V alloy processed by selective laser melting. Adv. Mater. Res. 2016, 816, 134–139. [Google Scholar] [CrossRef]
  11. Yan, J.J.; Zheng, D.L.; Li, H.X.; Jia, X.; Sun, J.F.; Li, Y.L.; Qian, M.; Yan, M. Selective laser melting of H13: Microstructure and residual stress. J. Mater. Sci. 2017, 52, 12476–12485. [Google Scholar] [CrossRef]
  12. Santos, L.M.S.; Ferreira, J.A.M.; Jesus, J.S.; Costa, J.M.; Capela, C. Fatigue behaviour of selective laser melting steel components. Theor. Appl. Fract. Mech. 2016, 85, 9–15. [Google Scholar] [CrossRef]
  13. Suryawanshi, J.; Prashanth, K.G.; Ramamurty, U. Tensile, fracture, and fatigue crack growth properties of a 3D printed maraging steel through selective laser melting. J. Alloys Compd. 2017, 725, 355–364. [Google Scholar] [CrossRef]
  14. Mazur, M.; Brincat, P.; Leary, M.; Brandt, M. Numerical and experimental evaluation of a conformally cooled H13 steel injection mould manufactured with selective laser melting. Int. J. Adv. Manuf. Technol. 2017, 93, 881–900. [Google Scholar] [CrossRef]
  15. Ackermann, M.; Šafka, J.; Voleský, L.; Bobek, J. Impact Testing of H13 Tool Steel Processed with Use of Selective Laser Melting Technology. Mater. Sci. Forum 2018, 919, 43–51. [Google Scholar] [CrossRef]
  16. Cyr, E.; Asgari, H.; Shamsdini, S.; Purdy, M.; Hosseinkhani, K.; Mohammadi, M. Fracture behaviour of additively manufactured MS1-H13 hybrid hard steels. Mater. Lett. 2018, 212, 174–177. [Google Scholar] [CrossRef]
  17. Ferreira, J.A.M.; Santos, L.M.S.; Jesus, J.S.; Costa, J.M.; Capela, C. Assessment of the fatigue life on functional hybrid laser sintering steel components. Proc. Struct. Integr. 2016, 1, 126–133. [Google Scholar] [CrossRef]
  18. Campanelli, S.L.; Angelastro, A.; Signorile, C.G.; Casalino, G. Investigation on direct laser powder deposition of 18 Ni (300) marage steel using mathematical model and experimental characterization. Int. J. Adv. Manuf. Technol. 2017, 89, 885–895. [Google Scholar] [CrossRef]
  19. ASTM E8/E8M-16a. Standard Test Methods for Tension Testing of Metallic Materials; ASTM International: West Conshohocken, PA, USA, 2016. [Google Scholar]
  20. BS 7448-3:1991. Fracture Mechanics Toughness tests, Part 1. Method for Determination of K1c, Critical CTOD and Critical J Values of Metallic Materials; British Standards Institution: London, UK, 1991. [Google Scholar]
  21. ASTM Standard E3, 2011. Standard Guide for Preparation of Metallographic Specimens; ASTM International: West Conshohocken, PA, USA, 2011. [Google Scholar] [CrossRef]
  22. ASTM Standard E384, 2011e1. Standard Test Method for Knoop and Vickers Hardness of Materials; ASTM International: West Conshohocken, PA, USA, 2011. [Google Scholar] [CrossRef]
  23. Isfahany, A.N.; Saghafian, H.; Borhani, G. The effect of heat treatment on mechanical properties and corrosion behavior of AISI420 martensitic stainless steel. J. Alloys Compd. 2011, 509, 3931–3936. [Google Scholar] [CrossRef]
  24. Branco, R.; Costa, J.D.M.; Berto, F.; Mohammad, S.; Ferreira, J.A.M.; Capela, C.; Santos, L.; Antunes, F. Low-Cycle Fatigue Behaviour of AISI 18Ni300 Maraging Steel Produced by Selective Laser Melting. Metals 2018, 8, 32. [Google Scholar] [CrossRef]
  25. Marashi, J.; Yakushina, E.; Xirouchakis, P.; Zante, R.; Foster, J. An evaluation of H13 tool steel deformation in hot forging conditions. J. Mater. Process. Technol. 2017, 246, 276–284. [Google Scholar] [CrossRef]
  26. Antolovich, S.D.; Risbeck, T.R.; Saxena, A.; Kawabe, Y. The effect of microstructure on the fracture toughness of 300 and 350 grade maraging steels. Eng. Fract. Mech. 1980, 13, 717–739. [Google Scholar] [CrossRef]
Figure 1. Specimen geometry, dimensions and schematic view of the hybrid parts (dimensions in mm).
Applsci 08 01879 g001
Figure 2. Pre-crack length measurement apparatus.
Applsci 08 01879 g002
Figure 3. Sample-extensometer assembly.
Applsci 08 01879 g003
Figure 4. Metallographic analysis for SS/SM sample.
Applsci 08 01879 g004
Figure 5. Metallographic analysis for HS/SM sample.
Applsci 08 01879 g005
Figure 6. Chemical composition of the interface for hybrid sample HS/SM 3D-printed with 200 mm/s scan rate.
Applsci 08 01879 g006
Figure 7. Hardness profile for both hybrid sample series.
Applsci 08 01879 g007
Figure 8. Fracture tests: Load vs. displacement curves for fully 3D-printed specimens.
Applsci 08 01879 g008
Figure 9. Fracture tests: Load vs. displacement curves for hybrid specimens.
Applsci 08 01879 g009
Figure 10. Crack growth path for SS/SM sample 3D-printed at 200 mm/s.
Applsci 08 01879 g010
Figure 11. Fracture surface of SS/SM sample 3D-printed at 200 mm/s.
Applsci 08 01879 g011
Figure 12. Crack growth path for HS/SM sample 3D-printed at 200 mm/s.
Applsci 08 01879 g012
Figure 13. Fracture surface of HS/SM sample 3D-printed at 200 mm/s.
Applsci 08 01879 g013
Table 1. Chemical composition of steels (CM-Conventional Manufacturing). Reproduced with the permission from [17], copyright Elsevier, 2016.
SteelCNiCoVMoTiAlCrPSiMnFe
18Ni300 (powder)0.0118.29.0-5.00.60.050.30.010.10.04Balance
AISI H13 (CM)0.4--0.941.30--5.290.0171.050.036Balance
AISI 420 (CM)0.37--0.17---14.220.0210.640.037Balance
Table 2. Tensile properties for SS/SM, HS/SM and SM specimens. Reproduced with the permission from [17], copyright Elsevier, 2016.
Specimen SM SS/SM HS/SM
Scan rate (mm/s)200400200400200400
Ultimate Tensile Stress [MPa]114710321135100011461000
Yield stress [MPa]100091011159001125900
Extension at break [%]62.23.61.54.21.7
Young‘s modulus [GPa]180180190180190180
Table 3. Fracture toughness tests results for SM specimens.
Sample Reference Valid KQ = KIcKQ (MPa.m1/2)Average KQ (MPa.m1/2)Jc (N/mm)Average Jc (N/mm)Critical Crack, ac (mm)
2SM01_3No72.9980.17 ± 6.7159.2365.68 ± 5.3531.26
2SM02_3No80.4467.8631.31
2SM03_3Yes90.8573.2631.11
2SM04_3No76.4062.431.96
2SM13_6 No76.3872.85 ± 4.2642.942.4 ± 2.529.39
2SM14_6No68.9340.130.62
2SM15_6No77.7746.331.03
2SM16_6No68.3240.329.11
4SM05_6No49.2255.42 ± 4.7119.7118.65 ± 4.1029.65
4SM06_6No52.5612.2728.89
4SM07_6No60.7123.7130.23
4SM08_6No59.1818.9330.06
Table 4. Fracture toughness tests results for SS/SM specimens.
Sample ReferenceValid KQ = KIcKQ (MPa.m1/2)Average KQ (MPa.m1/2)Jc (N/mm)Average Jc (N/mm)Crack to Fracture, ac (mm)
2SS/SM01_3No83.2283.9 ± 1.148.955.82 ± 7.1332.03
2SS/SM02_3No82.4648.531.98
2SS/SM03_3No85.1562.731.45
2SS/SM04_3No84.7563.2131.67
2SS/SM01_6No67.7170.97 ± 2.5541.1439.02 ± 1.5230.58
2SS/SM03_6No71.2437.5929.91
2SS/SM04_6No73.9538.3331.06
4SS/SM01_6 No54.7656.47 ± 2.3617.0819.56 ± 2.528.98
4SS/SM02_6 No57.8419.5329.05
4SS/SM03_6No59.5923.6429.86
4SS/SM04_6 No53.6918.0230.14
Table 5. Fracture toughness tests results for HS/SM specimens.
Sample ReferenceValid KQ = KIcKQ (MPa.m1/2)Average KQ (MPa.m1/2)Jc (N/mm)Average Jc (N/mm) Crack to Fracture, ac (mm)
2HS/SM01_3No73.9373.66 ± 5.7740.744.78 ± 16.1732.13
2HS/SM02_3No81.771.5532.98
2HS/SM03_3No73.0338.7130.47
2HS/SM04_3No65.9928.1730.51
2HS/SM01_6No61.5465.41 ± 3.4521.0522.84 ± 4.128.58
2HS/SM03_6No64.7724.929.71
2HS/SM04_6No69.9117.2430.03

