Abstract
Additive manufacturing of digital spare parts offers promising new possibilities for companies to drastically shorten lead times and to omit storage costs. However, the concept of digital spare parts has not yet gained much footing in the manufacturing industry. This study aims to identify grounds for its selective rejection. Conducted from a corporate perspective, outlining a holistic supply chain network structure to visualize different digital spare part distribution scenarios, this survey study evaluates technical and economic additive manufacturing capabilities. Results are analyzed and discussed further by applying the Mann-Whitney test to examine the influence of the company size and the presence of 3D-printed end-use components within supply networks on gathered data. Machines’ limited build chamber volumes and the necessity of post-processing are considered as the main technical challenges of current additive manufacturing processes. Furthermore, it can be concluded that company sizes have a significant effect on perceived technological limitations. Overall, the results lead to the conclusion that the readiness level of the digital spare parts concept demands for further development.
1. Introduction
Additive Manufacturing (AM) is a group of layer-by-layer manufacturing processes that makes it possible to simplify the production process and take advantage of an increased level of freedom in the design. The workflow for an additively manufactured component starts from the conception of a 3D representation of a component that subsequently enters the production process. The production process of AM components consists of repeating production steps, including a file conversion from Computer Aided Design (CAD) to Stereolithography (STL) files, machine setup, printing, removal, and usually post-processing. AM is often classified into seven process categories and numerous sub-processes, encompassing different approaches to generate 3D objects [1]. The first AM process which is called Stereolithography, applying a laser to cure light-sensitive resins, was developed in the 1980s. Since then, many other processes have been developed, ranging from melting of titanium alloys using Selective Laser Melting to jetting of binder droplets on gypsum particles applying binder jetting [2]. AM is shifting continuously from prototyping for visualization purposes to a production of end-use components, leading to a growing number of industrial applications (e.g., dental and automobile sectors) and may have the potential to disruptively change established markets [3,4]. It is particularly useful for the low-volume production of highly complex components, which require many production steps in traditional manufacturing. Thus, it makes tooling costs redundant and uses materials in a more efficient manner, resulting in less waste material. Therefore, AM can be of major advantage in supply chain networks. Part-on-demand production and customization of additively manufactured components and a high degree of digitalization lead to severe impacts on supply chains and potential future distribution scenarios [5]. Future forecasts regarding AM processes indicate that they will be widely applied, that the quality of components is expected to improve, and that enhanced mechanical properties could result in the adoption of AM components even in safety-critical sectors such as airplane production [6].
However, several challenges including the control of complex material-dependent process parameter interactions to ensure repeatable high part quality, fluctuations in mechanical properties (e.g., ultimate tensile strength) and surface roughnesses caused by varying placements and orientations of printed components during fabrication, and insufficient process standardizations need to be overcome to classify AM as a mature production technology [7,8,9,10,11]. Due to the continuous evolution of AM processes, there is an incentive to reconsider the existing supply chain models, which leads to modified manufacturing and distribution scenarios [12,13,14,15]. Two major manufacturing models have been proposed, centralized and decentralized manufacturing. Centralized manufacturing distributes products from a single central manufacturing site to customers. Decentralized and in particular distributed manufacturing are realized by setting up a network of smaller manufacturing sites (possibly even at home) distributed over a geographical entity. The models differ in customer responsiveness, supply chain network reliability, transportation and model implementation costs. Main spare part importance criteria are the stock-out-cost, lead time, and usage value [16]. Companies adopt AM processes in their supply chains because it has the ability to result in decreased total variable costs. AM-based supply chains present a substantial change in the cost structure of a manufactured component. While in conventional manufacturing-based supply chains the majority of the cost of a component is traced back to logistical costs; the bulk of the cost of an additively manufactured component is direct manufacturing costs [17]. Additionally, there have been approaches to investigate the technical aspects of distributed AM, describing potential positive effects between AM and cyber-physical production systems [18].
2. Additively Manufactured Digital Spare Parts as a Concept
Spare parts are replacements for failed or lifetime-expired components through repair (repairable) or reproduction (consumable). Currently, spare part businesses are affected by three main issues: Availability, cost, and time [19]. Ideally, companies store a sufficient amount of spare parts in an inventory to avoid downtime, while keeping the number of spare parts as low as possible to avoid high storage costs. Due to significant improvements in AM technologies during recent years and the expected further enhancements [20], a new concept called digital spare parts (DSP), is gaining importance within the manufacturing sector. Companies theoretically have the opportunity to make the storing facilities and traditional manufacturing processes related to spare parts redundant by sending digital models directly to AM service providers or by producing components additively in-house [21,22,23]. Potential benefits of DSP could arise from drastically simplified corporate supply chains and decreased inherent complexity, resulting in novel distribution networking models with enhanced operative flexibility [5]. The DSP concept shows major advantages in reduced lead times, part obsolescence in storages, as well as diminished administration and transportation costs. AM is economically feasible in numerous cases, especially when the components are of highly complex and are needed in low quantities [24]. Several AM decision support systems have been developed to support the part selection process [25,26]. Thus, it is applied to a growing number of industrial companies, not only for prototyping purposes but also for the serial production of end-use components [27]. The DSP concept could be applied to industrial sectors such as aerospace, automotive, and consumer electronics. AM processes/process groups such as plastic and metal-based powder bed fusion (PBF), plastic and metal-based binder jetting, material jetting, vat photopolymerization, and filament-based extrusion have been verified successfully for end-use components, representing the manufacturing processes to be assessed in this study [28,29,30,31].
However, there are few examples [32,33], in which companies implement this concept in their spare part supply chains. To visualize the changes when applying AM in supply chains, the well-known networking model from Lambert et al. is taken as a basis [34]. In Figure 1, this example supply chain network structure is divided into seven hierarchy levels, interacting through convergent or divergent connections. Black lines between hierarchy levels show unidirectional material flow between them, the orange arrows show spare part demands. According to this example model, the demand for spare parts can originate from an employee in e.g., maintenance in the original equipment manufacturer (OEM) company (internal) and from end-use customers (external). External demand can be addressed either to the distributors, which order the part from the OEM, or directly to component suppliers if AM is offered as the manufacturing process. The model comprises the centralized distribution model (component passes all fields) and the decentralized distribution model (component passes through dark grey fields only).
Figure 1.
Supply chain network structure showing demands and potential distribution scenarios. Adapted and modified from Lambert et al. Adapted from [34]. CM: conventional manufacturing; AM: additive manufacturing; ERP: enterprise resource planning.
Inside the OEM, a digital warehouse management system is needed to store, transfer, and use digital parts for the spare part production and to make decisions regarding whether it is favorable (e.g., in cost and/or lead times) to produce spare parts in-house or forward the order to suppliers. To be able to store and transfer large numbers of digital object files and the necessary additional part related information, a strong enterprise resource planning (ERP)-system must be implemented to face the challenge of the increasing amount of data. From an OEM’s perspective, there are several spare part distribution scenarios possible: Either relevant components are manufactured in-house, using conventional (CM) or AM machines, or parts are ordered from external suppliers (i.e., assembly or component supplier). If end-customers order parts directly from a service provider, the OEM is potentially bypassed (dotted black lines) in the value chain. In this example supply chain network structure, the end customers in tier 3 can demand spare parts (dotted black arrow) directly from an AM component supplier of tier 2, where the component is manufactured using the AM processes and consequently shipped to end customers in tier 3. This modification can have positive effects for customers (e.g., shorter delivery times) and negative effects (e.g., product piracy) for OEMs.
Overall, several crucial aspects need to be considered in this approach:
- All spare parts have to exist in a digital file format, extended by additional part relevant information including raw material specifications (e.g., type, shape) and production parameter settings (e.g., irradiation schemata in PBF, layer thickness) to ensure repeatable high-quality AM part production.
- AM and related post processing should be located at the same production site (consider design modifications for clamps and fixtures); otherwise, an additional tier for post-processing must be implemented.
- Increased liability risks associated with distributed manufacturing may occur.
- Costs to maintain additional AM-related supply chains.
- Potential to strengthen the supply chain by increasing the number of additional suppliers.
To expand the existing body of knowledge regarding additively manufactured spare parts and to further analyze the current demand of spare parts and to outline the existing potential of additively manufactured DSPs, a survey was conducted with respondents from the industry. Numerous surveys, as a state-of-the-art exploratory research methodology in the field of AM, have been conducted previously to evaluate challenges and opportunities [35,36]. Surveys are the most commonly used research approach in operations management to test specific theories [37].
However, no survey studies related to the DSP concept were found in the literature. This survey evaluates the current technical and economic feasibility of the DSP concept as well as related opportunities and challenges. In Section 3, the methodology applied in this study is outlined, followed by results of the survey in Section 4. Finally, in Section 5, conclusions are drawn, including an assessment of the companies’ perception of the DSP concept and an evaluation of the readiness level of the DSP concept.
3. Materials and Methods
3.1. Survey Design
This study is based on a directed online survey, for which participant answers were collected between May and July 2017. This industry-related survey consisted of 16 questions (Appendix A, Table A1). A total of 50 interviewees related to spare parts shared their opinion on the opportunities and challenges of additively manufactured digital spare parts, part characteristics of industrial components within their specific company, and their cost- and time-sensitivity towards additively manufactured plastic and metal components. The influence of the company sizes and the 3D printing usage in supply chains on results is described more precisely in the quantitative analysis section. The sample size of 50 participants implies a margin of error of 14%, considering a confidence level of 95%, a response distribution of 50%, and a population size of several million. All interviewees were contacted directly by email. The list of participants consists of professionals in the context of an innovation project about 3D printed digital spare parts or are related to the Finnish Rapid Prototyping Association (Firpa). All contacted participants have knowledge and expertise in 3D printing. The project includes large and medium-sized international companies and academic institutions. Firpa comprises 3D printing specialized companies based in Finland.
3.2. Respondent Demographics
As shown in Table 1, respondent answers were gathered from varying company sizes, regions and industrial fields, along with participant responses to questions related to 3D printing usage and 3D model outsourcing affinities.
Table 1.
Demographics of survey participants.
The majority of participants are employed in micro-companies with fewer than ten employees, followed by very large corporations with more than 1000 employees, large companies with 251 to 1000 employees, medium-sized companies (51 to 250 employees), and small-sized companies (10 to 50 employees). The distribution of primary industrial activities of organizations was wide, ranging from industrial manufacture to consultancies, aerospace and medical products. A total of 60% of participants’ companies do not apply 3D printing within their supply chains, while 40% of 3D printed components are distributed internally and externally (international and national AM service providers). Although 60% of participants do not use 3D printing within their supply chains, they do use 3D printing in one form or another. Companies that apply 3D printing in their supply chains use this set of technologies to manufacture and/or procure industrial end-use parts (Rapid Manufacturing and Rapid Tooling), which are determined as integral elements of an assembly or single components. Rapid prototyping is excluded from this definition since parts for demonstration or design iterations do not belong to operative supply chains. The acceptance of companies to send their models to an external AM service provider is at the level of 60%.
3.3. Quantitative Analysis
To further evaluate the influence of two crucial demographic groups (i.e., number of employees and 3D printing usage within supply chains) on the results, this survey includes 5-point Likert scale [38] questions, an approach to scale the participants’ attitude towards a specific item. Consequently, results are analyzed by calculating standard statistical parameters including Shapiro Wilk [39] and Chi-square [40] testing to validate the null hypothesis. Applying the nonparametric Mann-Whitney U-test finally examines the influence of the company size and the effect of 3D printing usage within supply chains on test results (alpha level α = 0.05). The Shapiro Wilk parameter is defined as:
where ai are the coefficients and yi are the observations. The null hypothesis is denied if W ≤ Wα (n = 50, α = 0.05) = 0.947. The Chi-square parameter is formulated as:
where ai defines the number of observations, N the sample sizes and pi the probabilities. The null hypothesis is denied if χ2 > χ2Employees (dfemployees = 4, α = 0.05) = 9.4877 and χ2 > χ23D (df3D = 1, α = 0.05) = 3.8415, for which df is described as the degrees of freedom. The Mann-Whitney parameter is given by:
where n1 describes the first sample size, n2 the second sample size, and Ri the rank of the sample size.
4. Results
Results of the Likert scale questions (Questions 4–6) are listed in tables, ranked and analyzed in detail, outlining technical and economic barriers as well as opportunities of the DSP concept. Each chapter gives results from additional questions to analyze specific aspects (e.g., materials, surface roughness, and build sizes) further.
4.1. Technical Feasibility
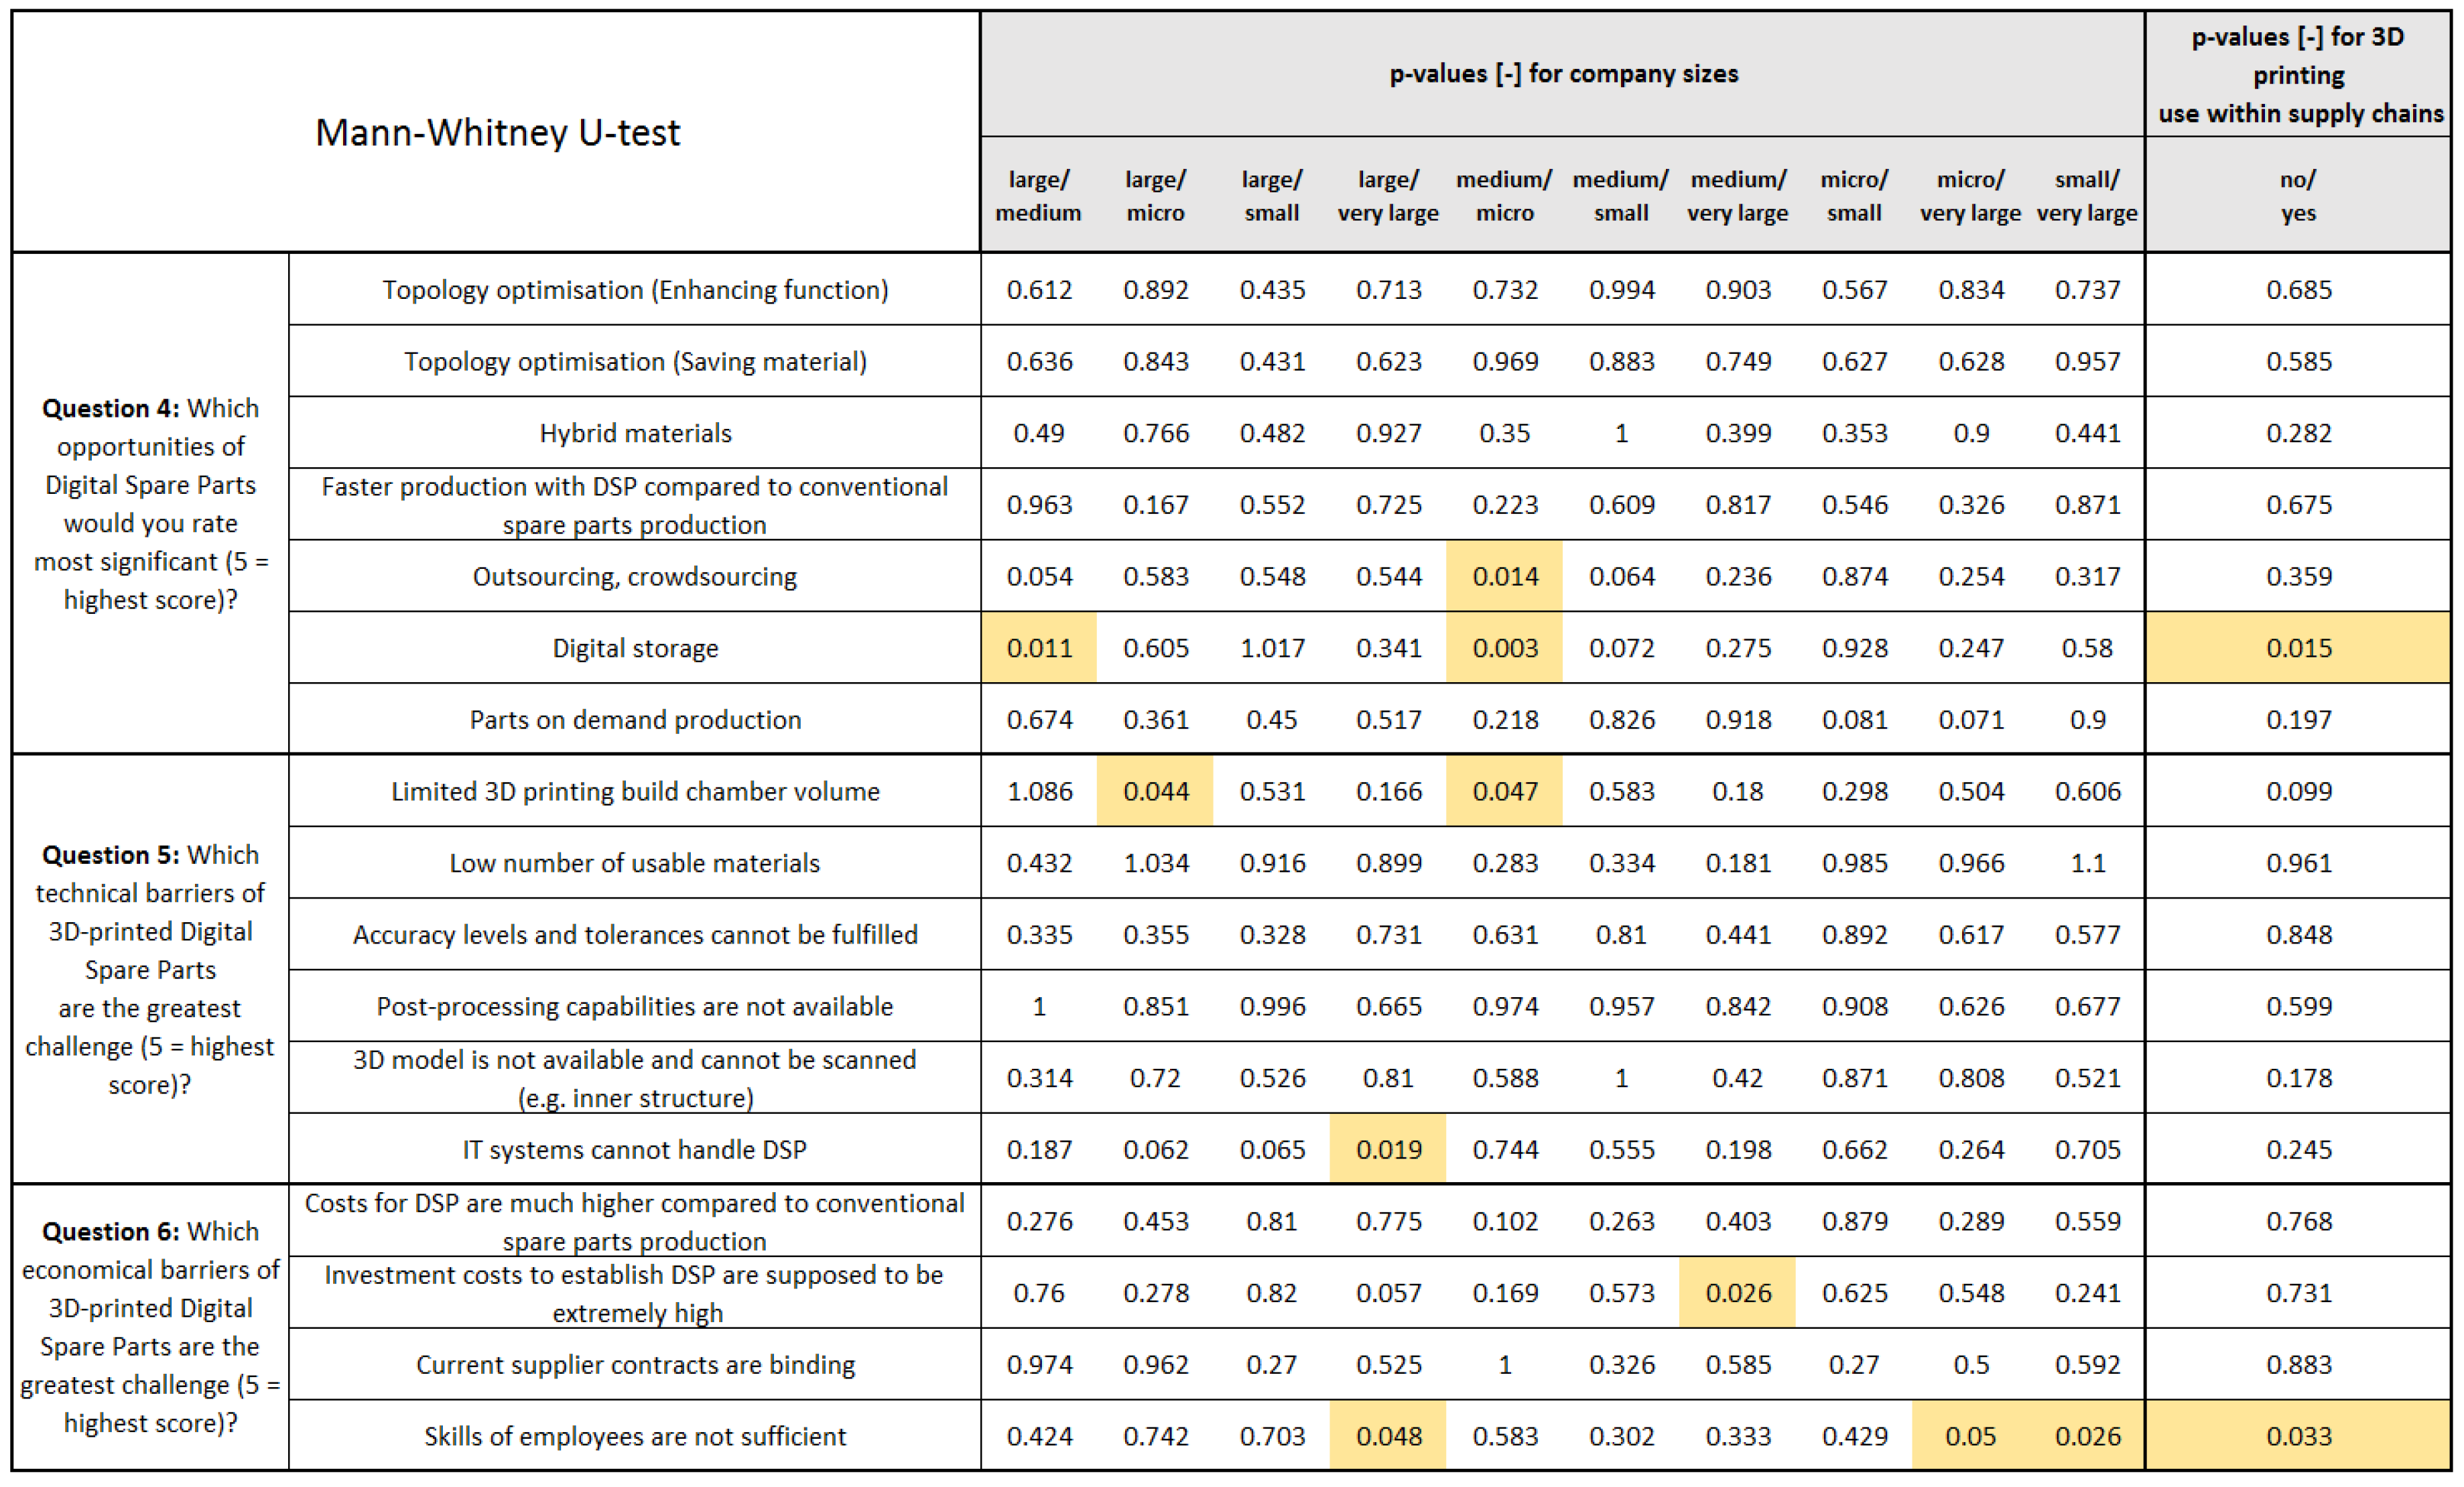
The greatest technical concerns according to Table 2 were that the number of commercially and readily available materials for AM was low (3.31 out of 5), the accuracy levels and tolerances could not be fulfilled (3.2 out of 5), and the AM build chamber volume (3 out of 5) was too small.
Table 2.
Ranked technical barriers of digital spare parts (DSP), N = 50; CI = confidence interval, SD = standard deviation, SW = Shapiro Wilk, χ2 = Chi-squared test.
Shapiro Wilk and Chi-square indicate that the null hypothesis is not fulfilled (results are not normally distributed). The Mann-Whitney testing (Appendix A, Figure A1) points out that the limited 3D-printing build chamber volume is a significantly larger challenge for large (p = 0.044, mean 3.67) and medium-sized (p = 0.047, mean 3.71) companies than for micro companies (mean 2.53). Another observation is related to the IT system needed to realize the DSP concept: Large companies (p = 0.019, mean 3.38) consider this aspect to be a greater challenge than very large companies (mean 1.5).
An explanation for these results could arise from the demand from large- and medium-sized companies for larger components and higher batch sizes in general. Costs per part are decreasing by fitting as many parts as possible into a single print. Thus, enlarged build chambers are advantageous, if a company produces large numbers of components. Moreover, very large companies do not seem to be troubled by the IT-system related obstacles of the realization of the DSP concept, because larger and better equipped IT resources could be available.
To analyze if the concern regarding the low number of commercially usable materials in AM can be confirmed, results of Question 12 (Appendix A, Table A1) are shown in 
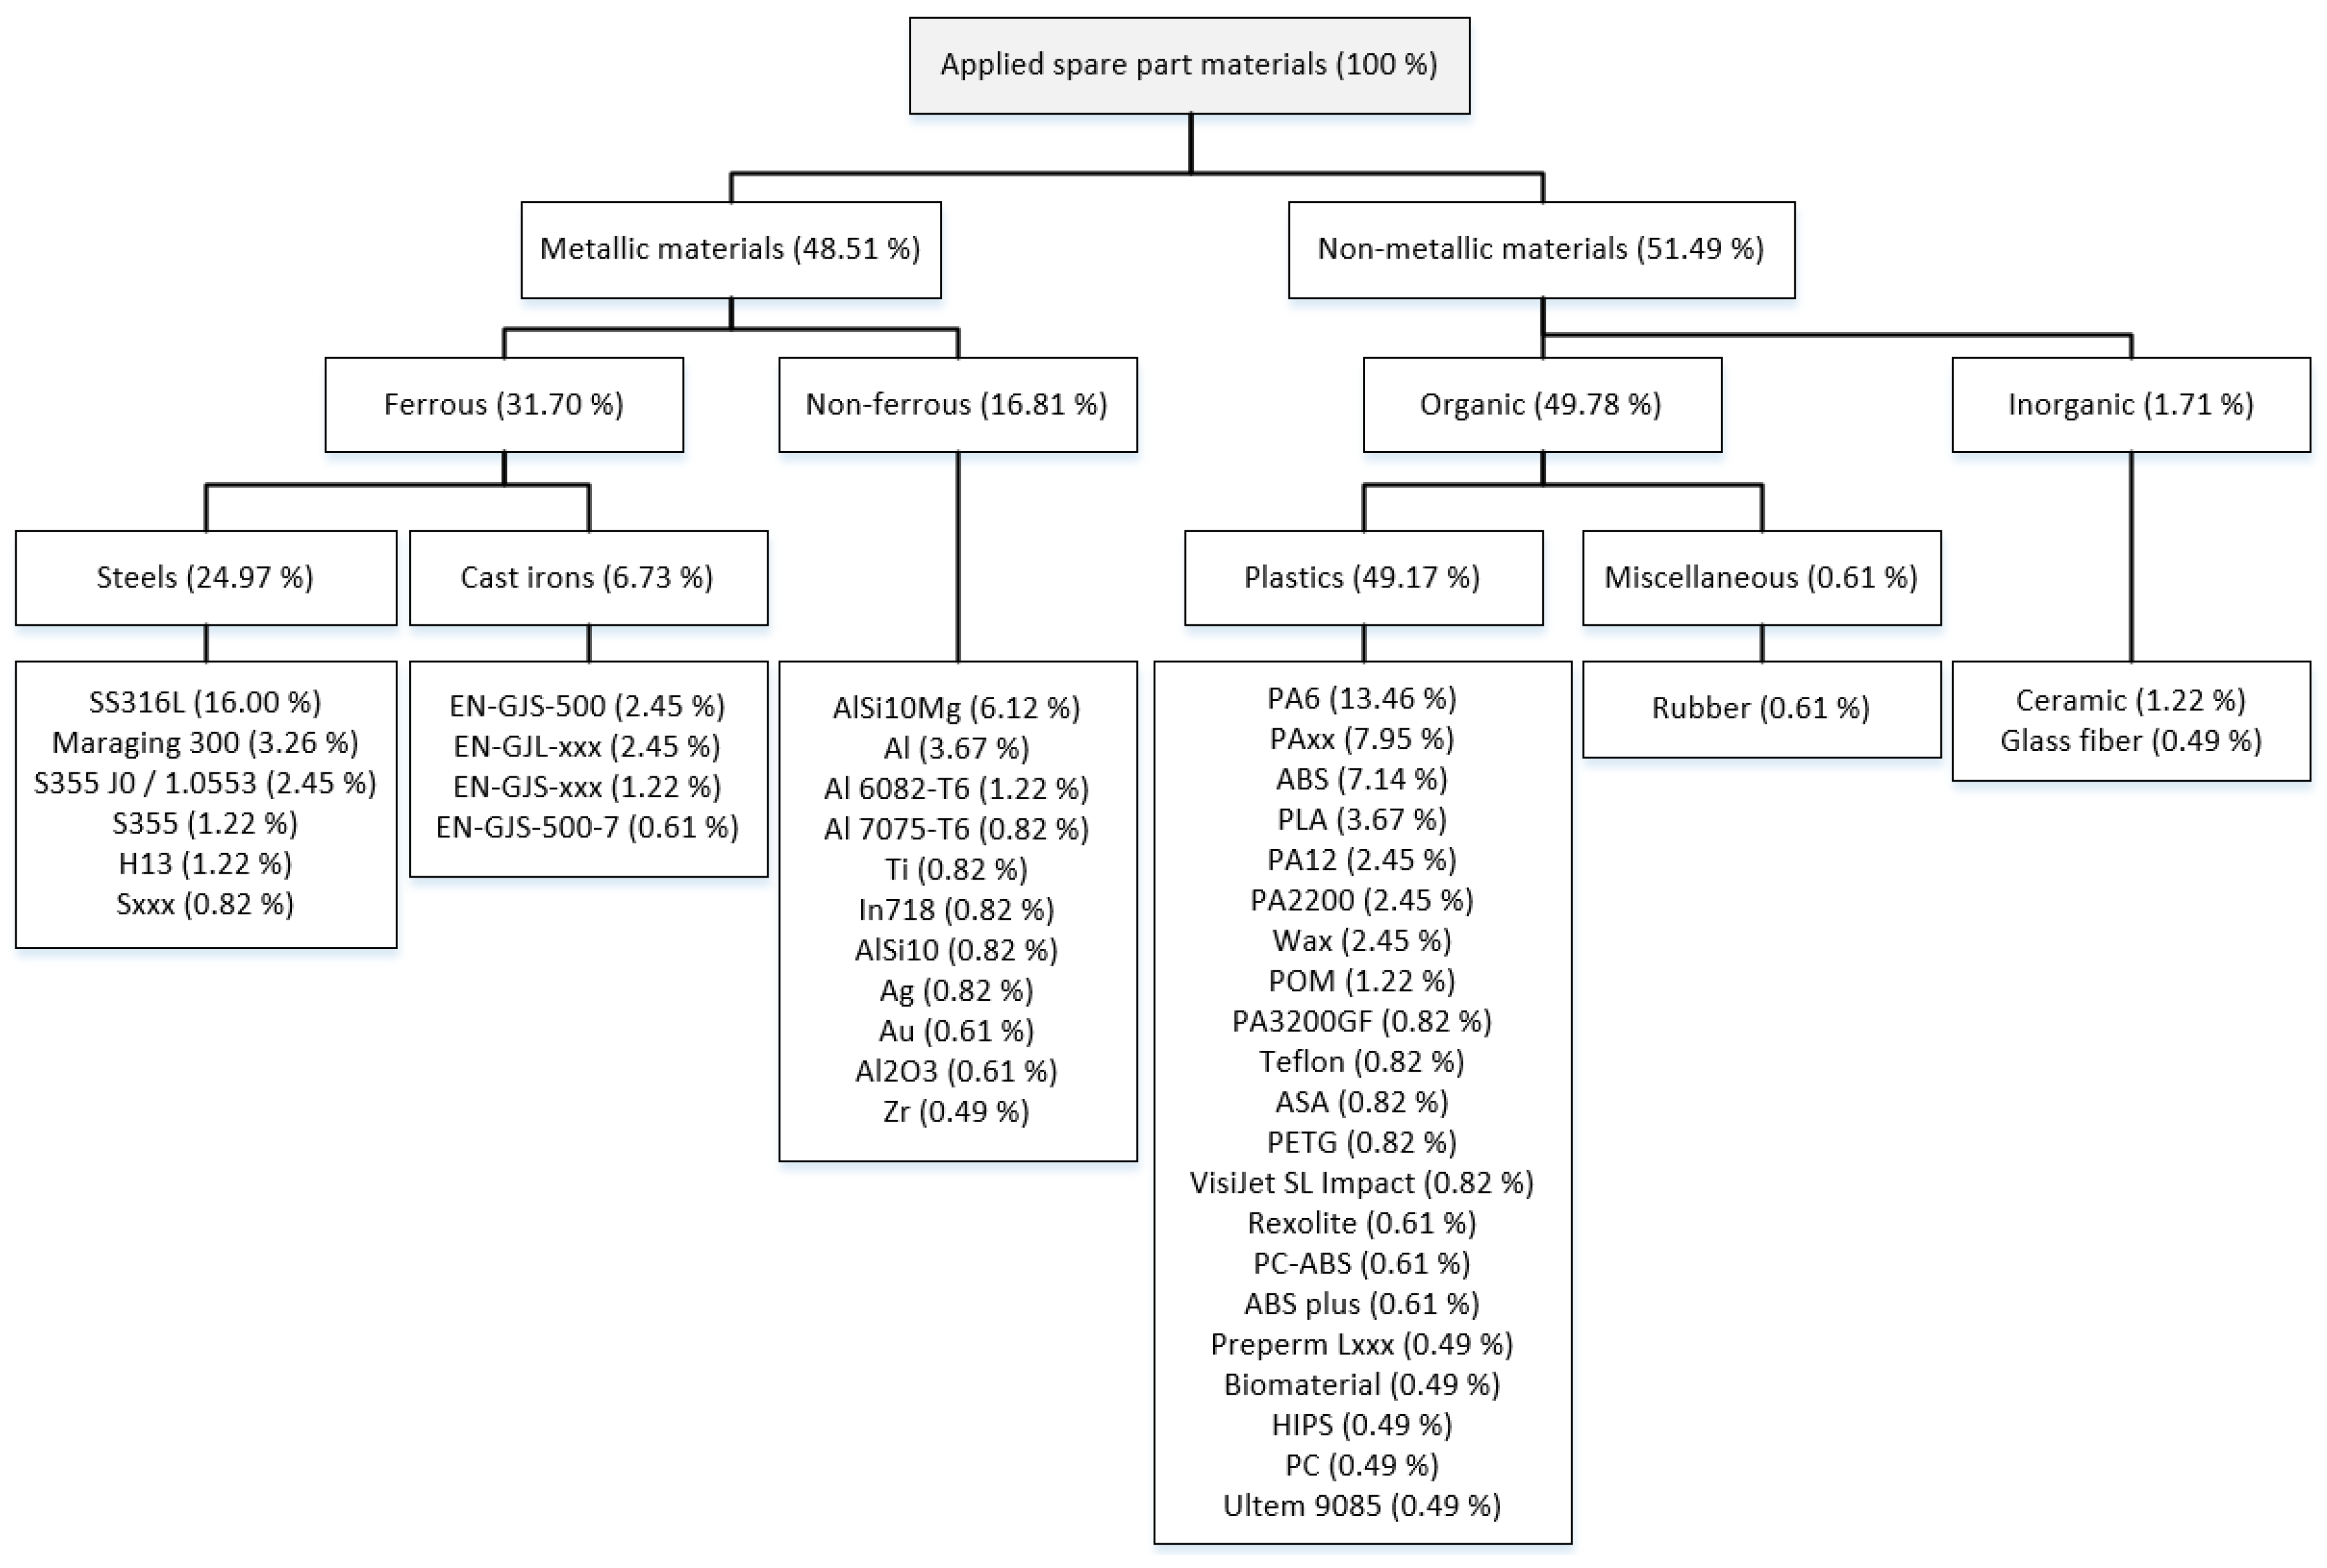
Figure 2. Participants were asked to rank (1 to 5) applied spare part materials in descending order. The material rank is inverted and normalized, determining weighting factors for all ranks (rank 1: 0.438; rank 2: 0.219; rank 3: 0.146; rank 4: 0.110; rank 5: 0.088). Consequently, materials are grouped in categories and their absolute shares (%) are calculated.
Figure 2.
Applied spare part materials.
According to Figure 2, 49% of applied spare part materials are classified as metallic materials and 51% as non-metallic materials. Most metal materials belong to the group of ferrous materials (32%), a smaller share (17%), is listed as non-ferrous metallic materials. Ferrous materials were further divided into steels (25%) and cast irons (7%). Non-metallic materials are mainly represented by organic plastics (49%), especially by polyamides. SS316L (16%), AlSi10Mg (6%), PA6 (13%), PAxx (8%), and ABS (7%) describe single materials with the largest share used as spare part materials. The “xx” or “xxx” in addition to the material name indicates that the specific material type is not mentioned (e.g., PAxx or Sxxx) and hence not considered to be commercially 3D printable. The share of applied metals and plastics is distributed almost evenly (49% versus 51%) and steels and plastics represent the main subgroups. Regarding the printability of materials mentioned in Figure 2, the following aspects need to be considered:
- The majority of listed materials are available as 3D printing materials (i.e., for SS316L, AlSi10Mg, Ti, PLA, etc.), but not necessarily offered by 3D printing service providers.
- Some materials can directly be traced back to materials of 3D printing service suppliers (PA2200, PA3200GF, VisiJet SL Impact, and Ultem 9085), representing a share of 5%.
- The euqivalent in 3D printing can differ slightly from the original material (e.g., ABS-like resins in Stereolithography), which often results in modified and/or inferior material properties.
- Cast irons (e.g., EN-GJS-500), special alloys (e.g., Al 7075-T6), specific plastics (e.g., Teflon), and inorganic materials such as glass-fibers are not available as materials for 3D printing.
An overall share of 3D printable materials of 70% regarding commonly applied spare part materials (TOP 5 materials of companies’ spare part production) is obtained through exclusion of unspecified materials such as PAxx and by neglecting the possibility to substitute some of the mentioned materials with others (e.g., for cast irons). This value is based on a comparison of materials from Figure 2 with a material data base from 3D hubs [41] and additional sources. The following materials are considered 3D printable: SS316L (16%), Maraging 300 (3%), H13 (1%) [42], AlSi10Mg (6%), Ti (less than 1%), In718 (less than 1%), Ag (less than 1%) [43], Au (less than 1%), PA6 (13%) [44], ABS (7%), PLA (4%), PA12 (2%), PA2200 (2%), Wax (2%), POM (1%), PA3200GF (less than 1%), ASA (less than 1%), PETG (less than 1%), VisiJet SL Impact (less than 1%), PC-ABS (less than 1%), ABS plus (less than 1%), HIPS (less than 1%), PC (less than 1%), Ultem 9085 (less than 1%), and ceramics (1%).
The overall share of printable materials could be increased if a substitution of original materials was taken into account, potentially leading to inclines in costs and varying mechanical properties. Additionally, the printability of some special materials is demonstrated in research environments but is not (yet) available for industrial usage. In this regard, it can be expected that a larger share of materials is 3D printable in the future.
The perceived second most crucial technical barrier arises from the non-fulfillment of accuracy levels and tolerances. To address this topic, Question 13 (Appendix A, Table A1) asks for minimum roughness values Ra (µm) for selected materials from Question 12 (Appendix A, Table A1). In Table 3, all gathered surface roughnesses for printable materials are listed, classified into material categories and analyzed by comparing surface roughness values of applicable AM machines/processes to figure out if post-processing is required. For some materials, e.g., SS316L, several surface roughness values are mentioned, showing that multiple participants require deviating values for the same material.
Table 3.
Comparison of required and actual minimum surface roughnesses of applicable AM machines and processes to decide on the necessity of post-processing. If a literature source for the actual surface roughness of a specific material is not identified, the necessity of post-processing is estimated according to the underlying AM process capabilities.
The vast majority of materials (e.g., SS316 L, H13, AlSi10Mg) demand for post-processing after being printed and does not fulfill the required minimum surface roughnesses directly. According to identified literature sources, only PLA (1 out of 14 cases, 7%) would fulfill the requirements without post-processing.
However, it must be mentioned that surface qualities and achievable accuracy levels are significantly dependent on applied print settings, the AM machine/process, the placement (e.g., in PBF processes), and the orientation of the part in the build chamber, as well as the curvature of the part being manufactured [8,10]. The necessity of post-processing was to be expected since functional interfaces require low surface roughnesses to meet high tolerances. To address this issue, common post-processing process-specific practices include shoot peening, machining (milling and turning), polishing, and vapor smoothing, for which additional resources such as labor cost and machine capabilities must be expended. Moreover, these additional production steps lead to extended lead times and can require design modifications for fixtures.
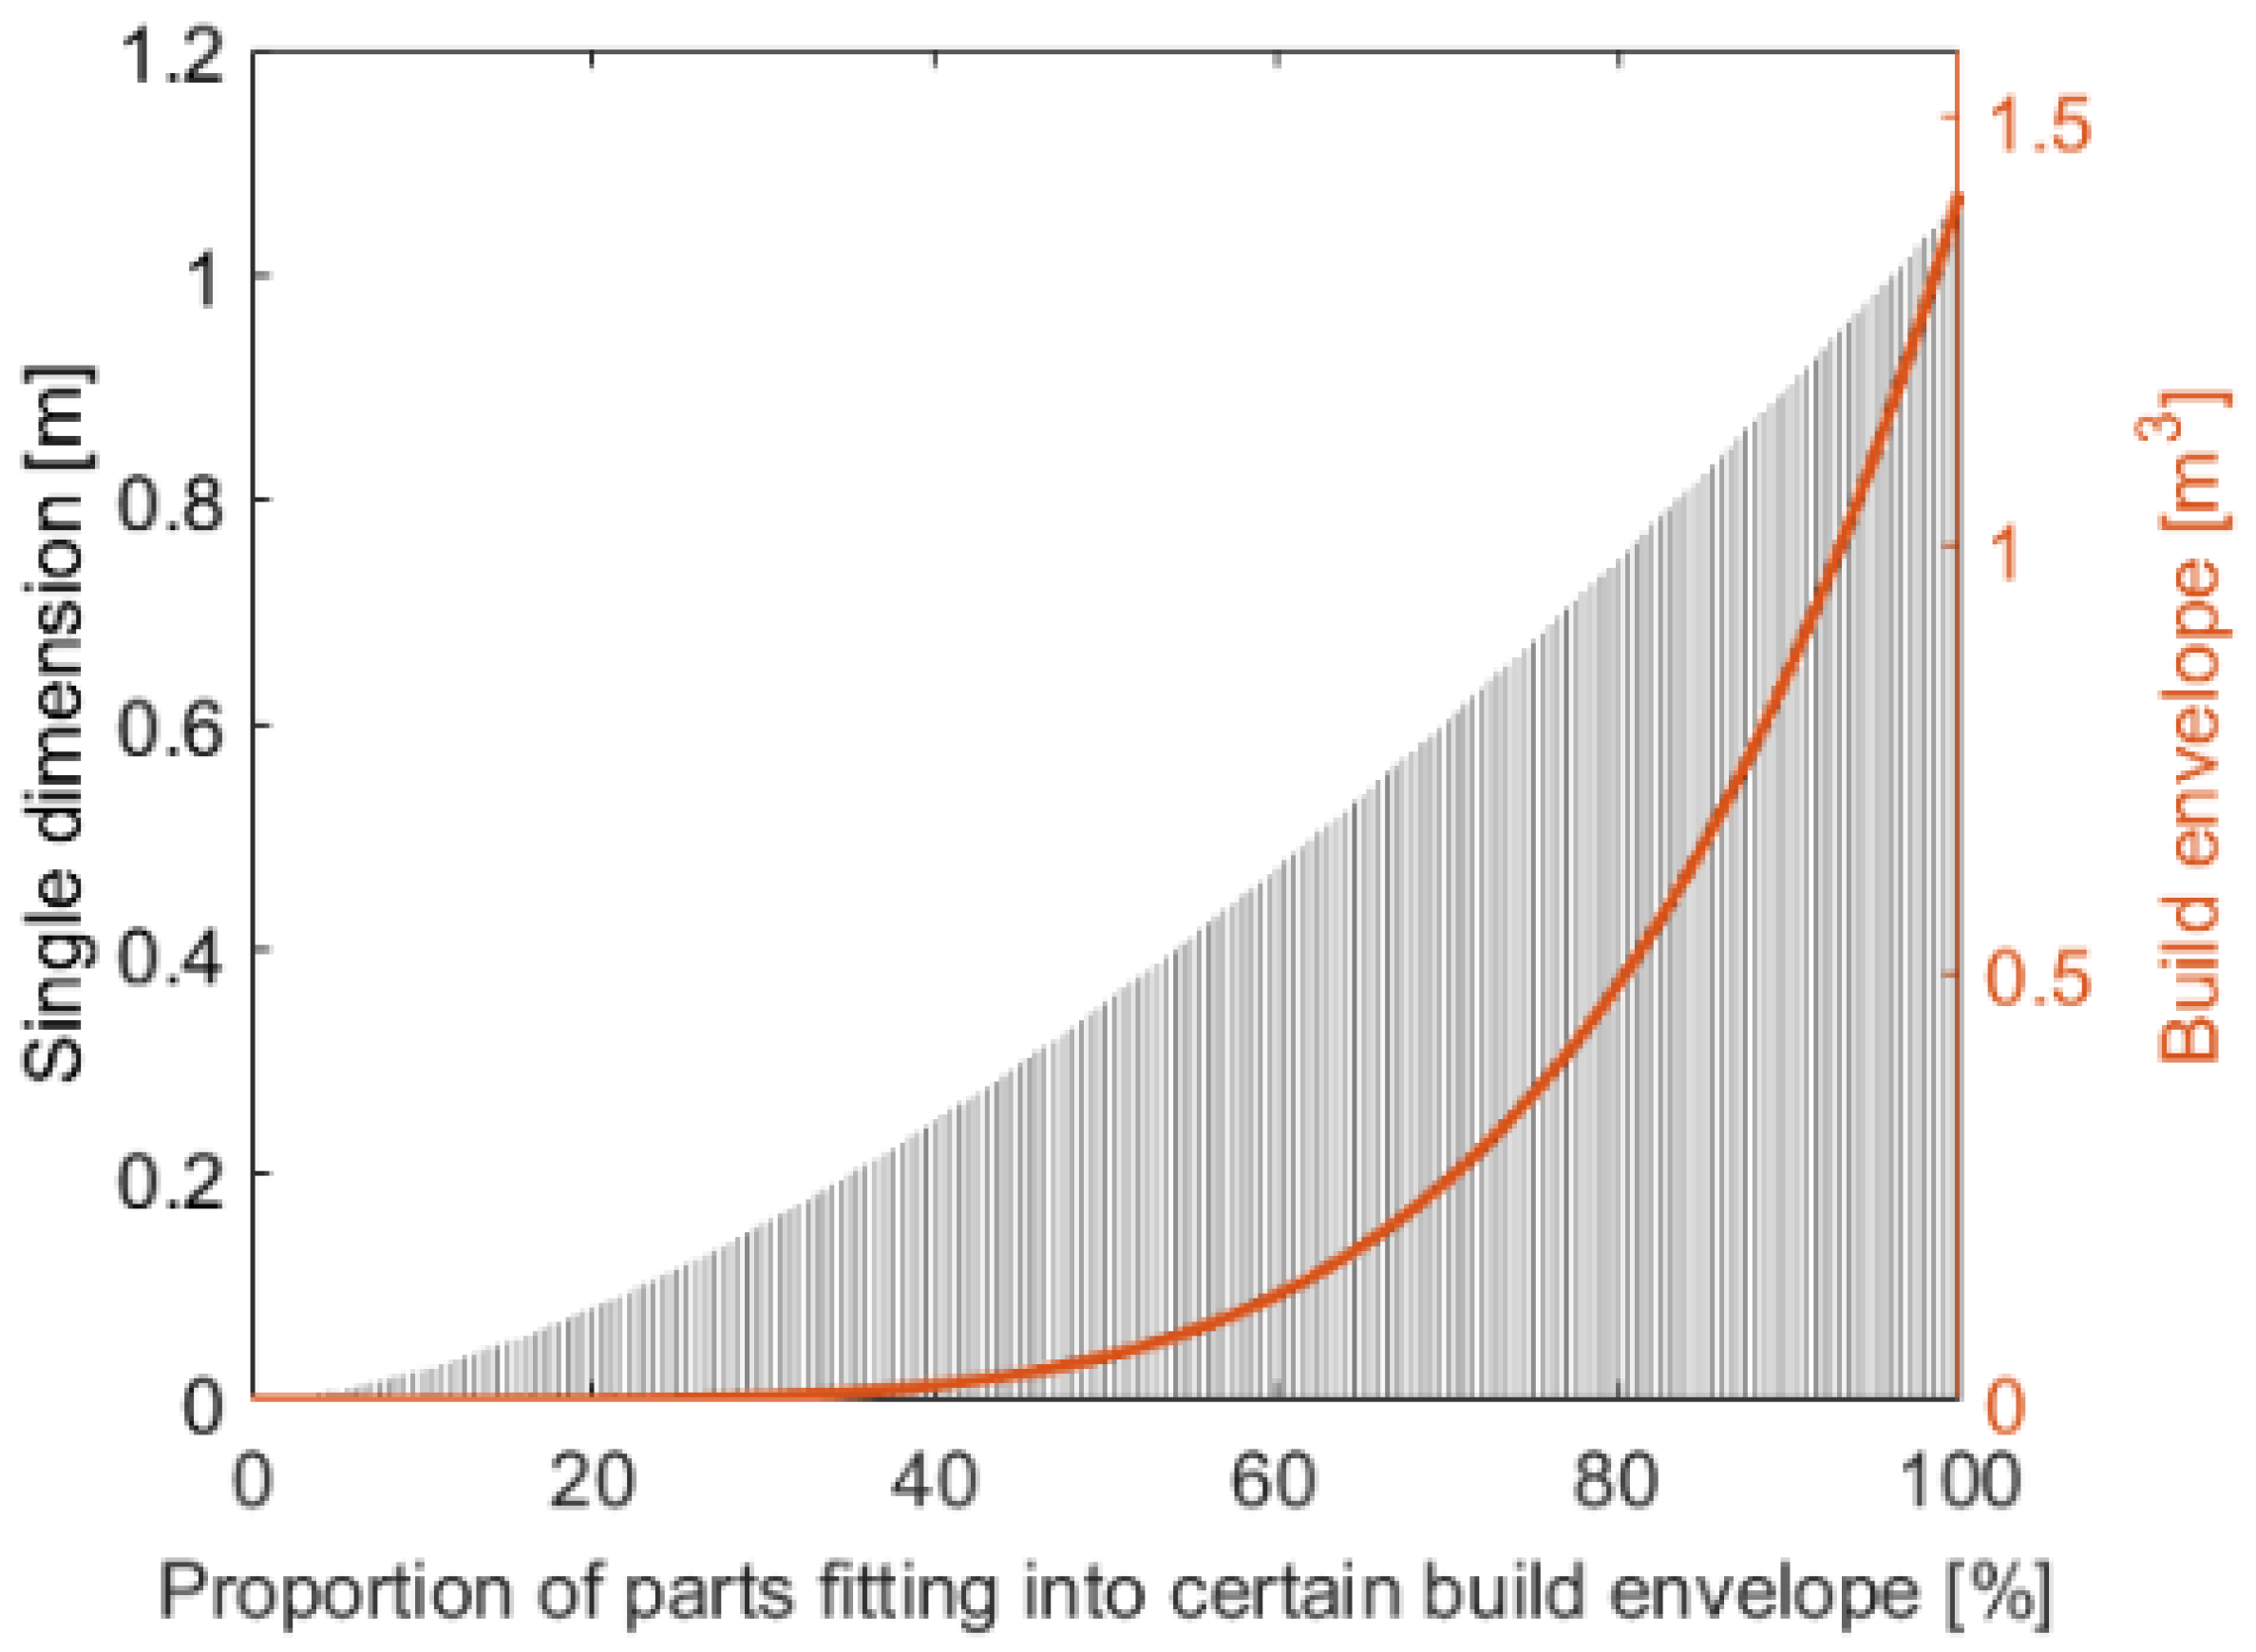
To gather more detailed insights into the third most crucial technical barrier, the restriction arising from limited build chamber volumes on the size of components, Question 14 (Appendix A, Table A1) asked for the percentage of parts which fit into certain build chamber volumes ranging from less than 0.001 m3 (less than 0.1 m for a single dimension of the build chamber) to more than 0.729 m3 (more than 0.9 m for a single dimension). The results are displayed in Figure 3, showing that more than 20% of the corporate components fit into a build chamber volume of less than 0.001 m3 and more than 80% of components into 0.729 m3.
Figure 3.
Technical barrier analysis of limited build chamber volumes for demanded spare part sizes.
Results are consequently compared to the best-in-class AM machines regarding their build envelopes and locally-based AM machines of service providers in Finland (year 2018) according to the Finnish Rapid Prototyping Association [52]. Local spare part production gains from short lead times in the sense of distributed manufacturing. Differences between best-in-class and local AM machines are outlined in Table 4, focusing on the most relevant direct AM processes in production.
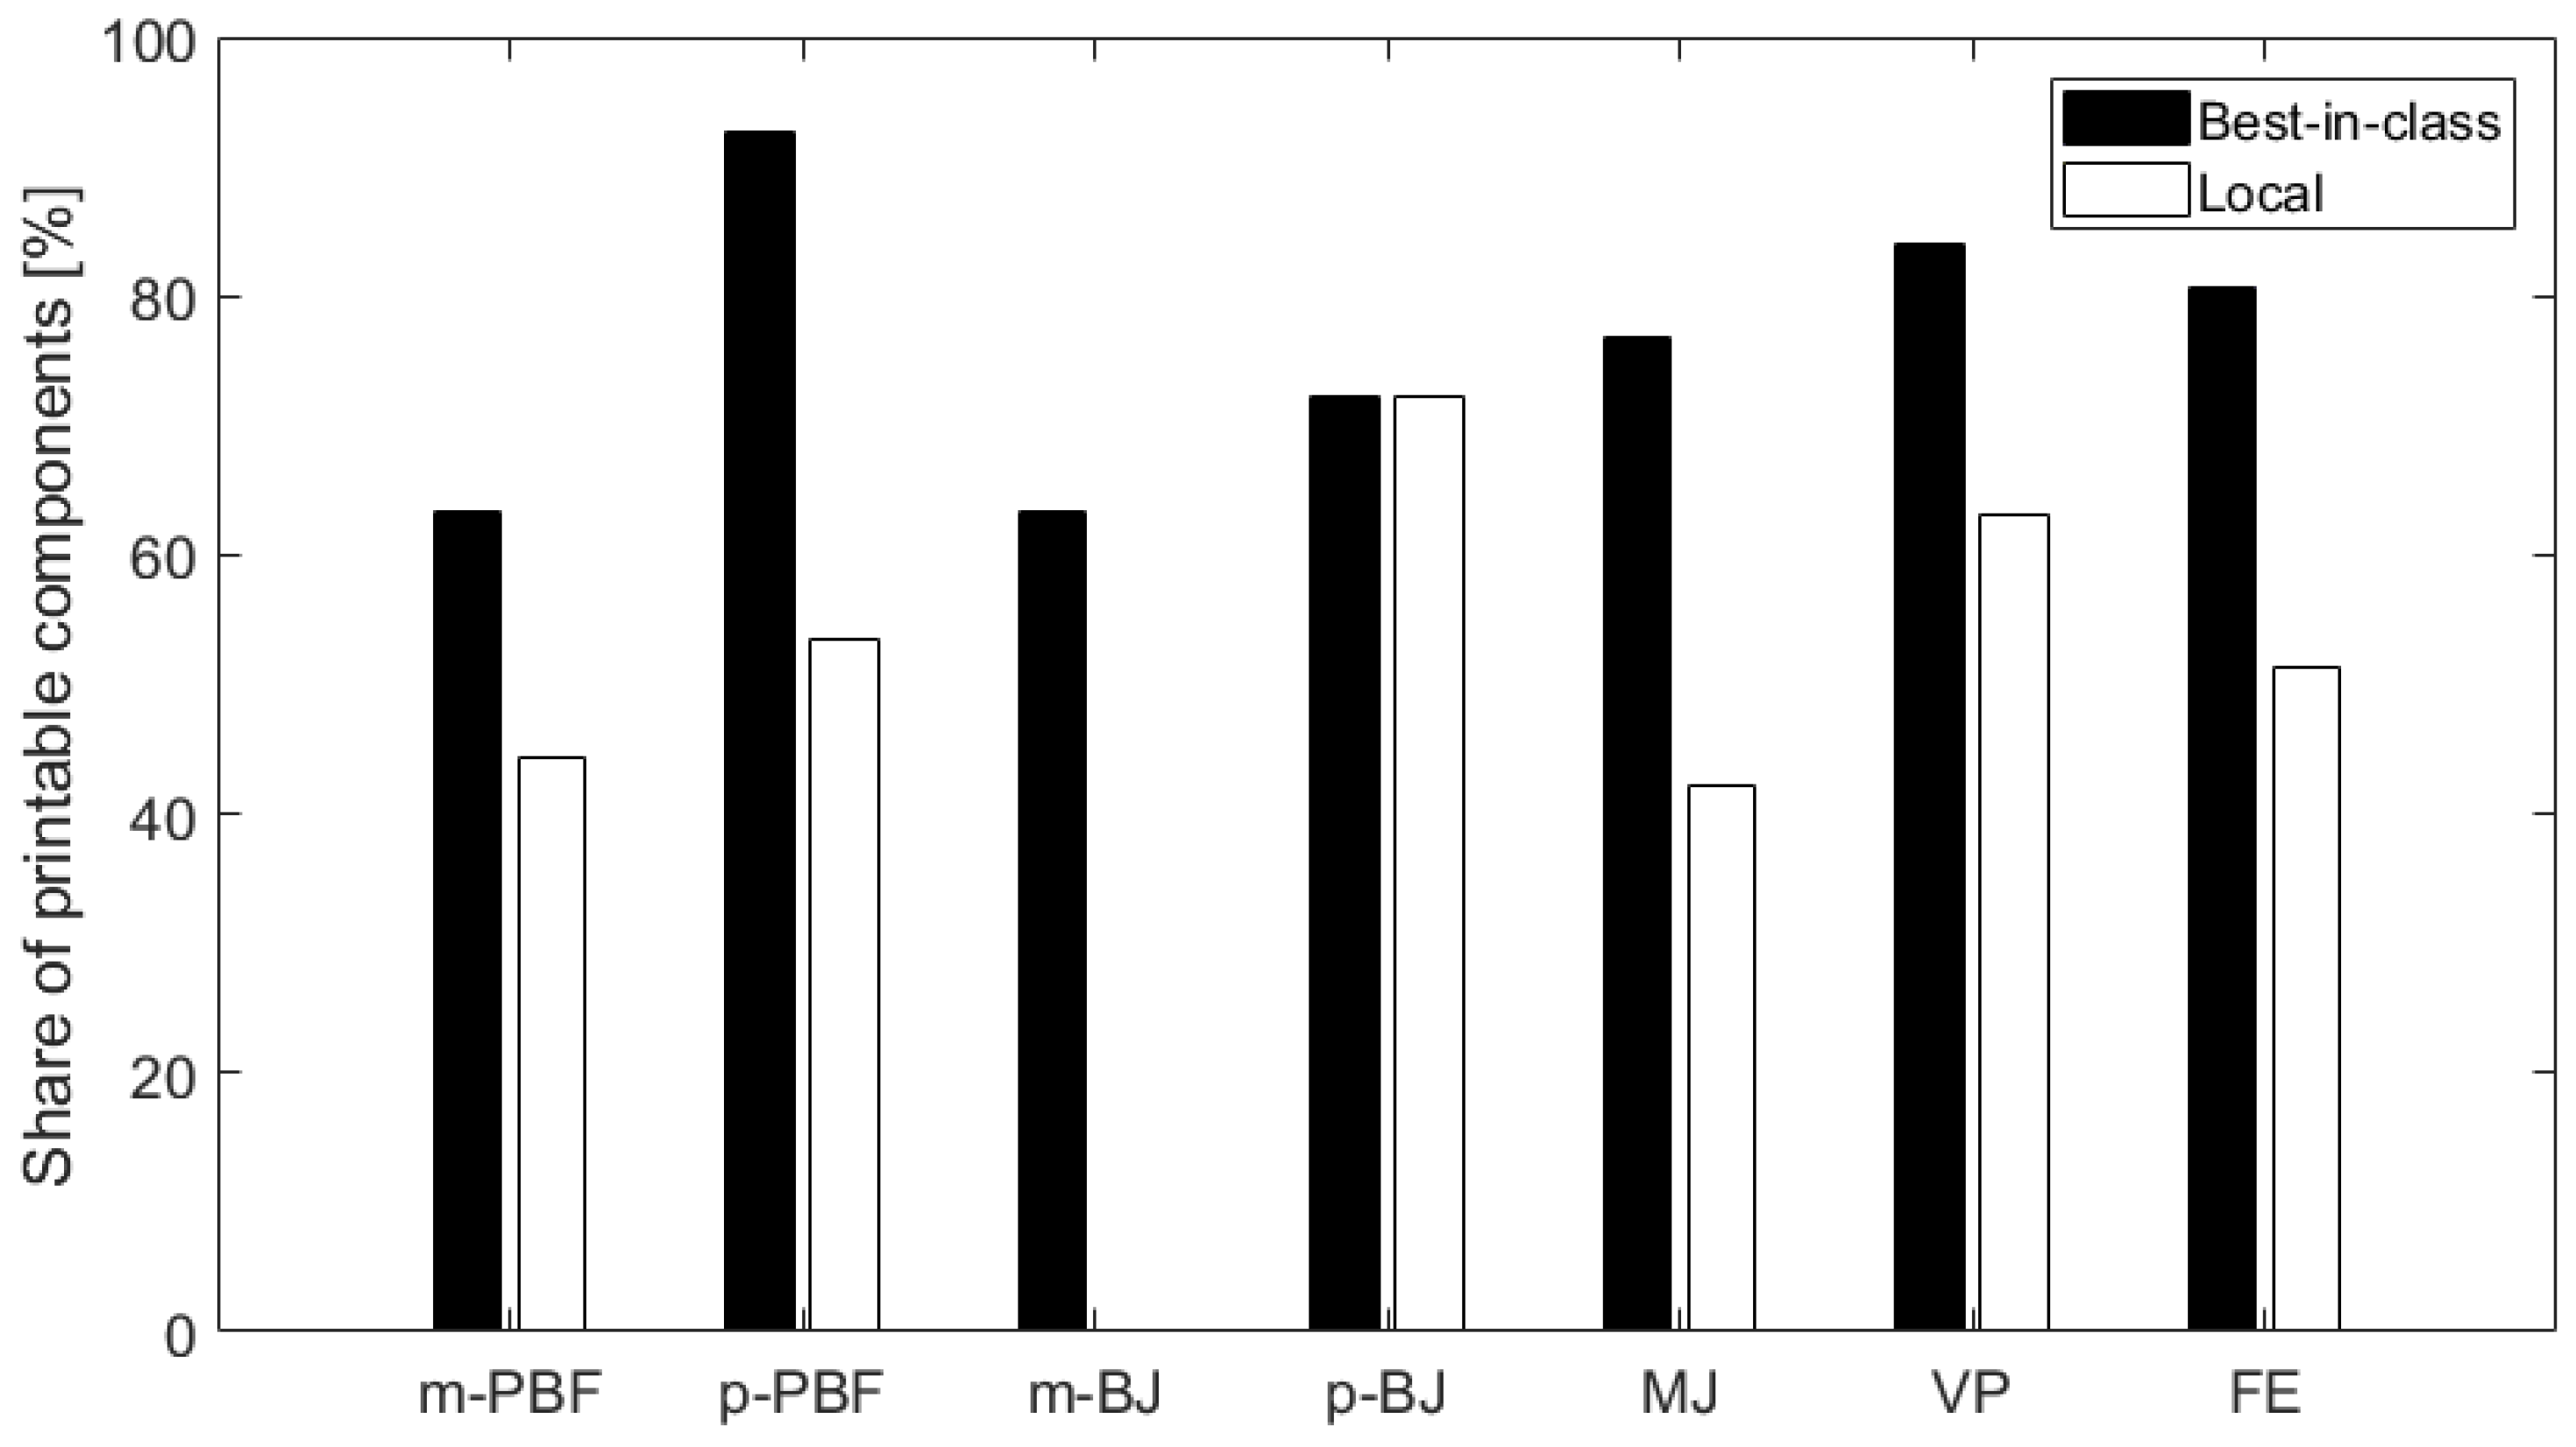
Table 4.
Current maximum build envelopes (best-in-class and local) for relevant AM processes.
In Figure 4, the percentages of components, which can currently be manufactured as one component in build envelopes of AM machines are shown. Thus, build envelope values for all listed AM processes are taken from Table 4 and transferred to the build envelope graph in Figure 3 (single dimensions are calculated by assuming cubic build envelopes). As a result, the proportions of parts fitting into the specific build chambers can be identified.
Figure 4.
Percentages of printable components according to their size (printed as one component). m-PBF (metal-based PBF), p-PBF (plastic-based PBF), p-BJ (plastic-based Binder Jetting), MJ (Material Jetting), m-BJ (metal-based Binder Jetting), VP (Vat Photopolymerization), FE (Filament-based Extrusion).
The share of 3D printable components of best-in-class machines for all investigated AM processes varies between 63% (i.e., metal-based PBF, metal-based Binder Jetting (BJ)) and 93% (i.e., plastic-based PBF). For locally produced components, a range of 0% (i.e., metal-based BJ) and 72% (i.e., plastic-based BJ) is calculated. Differences in the share of printable components are identified for all AM processes except for p-BJ, in this case, the locally installed AM system represents the best-in-class machine in terms of build envelopes. On average, a share of 47% for local printability and 76% for best-in-class machines is obtained.
Obviously, the average share of printable components is significantly lower in the case of local production compared to all best-in-class machines; these machines are only reasonable for high manufacturing throughput, for which the demand for additively manufactured components is currently not present. A limitation in the approach of calculating the share of printable components for specific AM processes from a general demand curve for part sizes must be seen in material dependencies. For some materials, a large share of small parts might be needed, while others demand larger dimensions. This limitation was taken into account because questions regarding size distributions of specific materials would have been too challenging to be answered by the participants in this survey.
Summarized, in this study, 70% of requested materials are considered as additively manufacturable. In 1 out of 14 investigated cases, the underlying process and machine-related surface roughness met the requested values, 47% and 76% of components fit into largest local and best-in-class build envelopes. This leads us to believe that all mentioned technical barriers imply real obstacles in specific cases since special materials and very large single parts cannot be manufactured today (especially not locally). Additionally, post-processing is considered mandatory for high-quality design features.
4.2. Economic Feasibility
In Table 5, the results of Question 6 (Appendix A, Table A1) are displayed, listing the economic barriers of the DSP concept. According to Shapiro-Wilk and Chi-Square testing, the null hypothesis is in most cases not fulfilled. Costs for DSP compared to traditional manufacturing were considered as the main barrier, followed by costs needed to be spent to establish an environment for additively manufactured DSP, and insufficient employees’ skills.
Table 5.
Ranked economic barriers of DSP, N = 50; CI = confidence interval, SD = standard deviation, SW = Shapiro Wilk, χ2 = Chi-squared test.
The Mann-Whitney test (Appendix A, Figure A1) leads to the claim that investment costs are seen as a more crucial aspect comparing medium (mean 4.14) to very large companies (mean 2.83; p = 0.026). Furthermore, insufficient skills of employees are perceived as a larger challenge for large (mean 3.44) than for very large (mean 2; p = 0.048) and for micro (mean 3.19) compared to very large companies (mean 2; p = 0.05). Also, the employees’ skills are considered as significantly not sufficient if 3D printing is part of the organization’s supply chain (means 2.7 and 3.56; p = 0.033).
It seems that very large companies can easily accumulate the required investment costs required by DSP implementations. Medium-sized companies see greater challenges to fund a DSP IT-system, which could arise from a more powerful monetary situation of large corporations. Additionally, large corporations have better access to hiring employees with advanced skills. The reason behind the observation that employees’ skills are described as insufficient, especially when the organization uses 3D printed components in their supply network, could lie in the fact that previously unknown employee skills are needed when applying 3D printing for end-use components. High AM production costs must be considered a main obstacle, especially for the mass production of standard components. In most cases, AM only provides advantages for small batch numbers of highly complex products. This is a limitation which is not likely to change drastically in the following years.
4.3. Opportunities and Challenges of DSP
In Question 4 (Appendix A, Table A1) that explores which opportunities of DSP are the most significant (5 = highest), according to Table 6, the highest score was reached by parts on demand production (4.2 out of 5.0), the second highest by faster production with DSP compared to conventional spare parts production (3.75 out of 5.0), followed by digital storage (3.6 out of 5.0).
Table 6.
Ranked opportunities of DSP, N = 50; CI = confidence interval, SD = standard deviation, SW = Shapiro Wilk, χ2 = Chi-squared test.
Taking the Shapiro Wilk and Chi-square tests into consideration, the aspect of 3D printing inside a company’s supply chains does not have an effect on the overall normal distribution of participants’ answers for part-on-demand production, outsourcing, and crowdsourcing and a faster production is achieved when applying DSP compared to conventional manufacturing. The Mann-Whitney test (Appendix A, Figure A1) indicates that outsourcing and crowdsourcing has a significantly higher relevance for micro- (mean 3.13) than for medium-sized companies (1.5; p = 0.014). Moreover, digital storage as an opportunity offered by DSP is considered as more important for large (mean 4) than for medium (mean 2.17; p = 0.011) as well as for micro (mean 4) than for medium-sized companies (mean 2.17; p = 0.003). This aspect is also relevant for the comparison of 3D printing usage within supply chains: Companies having 3D printed components in their supply networks (mean 4.11) evaluate the digital storage as more crucial than companies without additively manufactured components in their companies’ supply chain networks (mean 3.1; p = 0.015).
Outsourcing and crowdsourcing could play a more important role for micro companies, due to their low number of employees and focus on niche tasks, which doesn’t allow them to cover new tasks that easily. The digital storage is more important for large companies because they must store a larger number of products themselves. Companies that already use additively manufactured components within their supply chains appreciate digital storage as an opportunity. Part-on-demand production has a direct positive impact on decreased storage costs. If reliable part-on-demand production is guaranteed, this opportunity is significant for manufacturing companies, releasing large resources of tied capital.
5. Conclusions and Future Work
Companies consider the flexibility in terms of rapid part-on-demand production of additively manufactured DSP as a realistic driver for the future adoption of the DSP concept. In this regard, companies applying 3D-printed parts within their supply chain networks consider digital storage as the main opportunity and demand 3D printing specialists. For very large companies, it seems to be easier to acquire monetary and human resources to set up the infrastructure necessary to realize this concept.
To reap the benefits from the presented opportunities, several technical barriers need to be overcome. The low number of usable materials, insufficient accuracy levels, tolerances, and the limited build chamber volumes were perceived as the major technical barriers. We conclude that post-processing constitutes mandatory production steps to fulfill minimum surface roughness levels (required by 13 out of 14 cases) and larger build envelopes (locally 47% and best-in-class 76% of part sizes 3D printable) must be offered to lay the foundation of efficient DSP distribution scenarios. The low number of commercially available 3D printing materials cannot be confirmed as the main technical barrier directly since 70% of investigated materials are industrially 3D printable; however, repeatable mechanical and surface roughness properties of parts remain challenging issues for numerous materials. Larger companies are legitimately worried by inadequate build envelopes, especially in the case of distributed manufacturing. Summarized, mentioned aspects lead to the conclusion that the DSP concept for AM parts demands for further development to be considered a comprehensive alternative. For the future, a more detailed study regarding additional factors which prevent companies from implementing industrial 3D printing capabilities in their organization is desirable. In this regard, real case studies from different countries could support this approach.
Author Contributions
N.K. and S.C. wrote this manuscript and conceived the overall study design; M.S and J.T. were validating, reviewing, and editing this study.
Funding
This research was funded by Tekes (Finnish funding agency for technology and innovation) and a consortium of companies within the scope of DIVA (Digital Spare Parts).
Conflicts of Interest
The authors declare no conflict of interest.
Appendix A
Table A1.
List of survey questions.
Table A1.
List of survey questions.
| Question # | Question |
|---|---|
| Question 1 | What is the country where you work or where your business unit is located? |
| Question 2 | What is the size of your organization in terms of number of employees? |
| Question 3 | What is the primary industrial activity of your organization? |
| Question 4 | Which opportunities of Digital Spare Parts would you rate most significant (5 = highest score)? |
| Question 5 | Which technical barriers of 3D-printed Digital Spare Parts are the greatest challenge (5 = highest score)? |
| Question 6 | Which economical barriers of 3D-printed Digital Spare Parts are the greatest challenge (5 = highest score)? |
| Question 7 | How long would it take to realize these benefits with 3D-printed Digital Spare Parts (in months)? |
| Question 8 | Would your company in general send internal 3D models to external service centers? |
| Question 9 | What prevails at the moment in terms of 3D printing digital spare parts: opportunities or barriers? |
| Question 10 | Are 3D printed components part of your organization’s supply chain? |
| Question 11 | How will the spare parts revenue within your company develop for the next 5 years? |
| Question 12 | Name the TOP 5 materials you are currently using for spare part production in your company (e.g., “Aluminum Alloy AlSi10Mg”, “Polyamide PA6”, “Stainless Steel SS316L”) in descending order. |
| Question 13 | What are the minimum roughness values Ra [µm] for the selected materials? |
| Question 14 | Which percentage of spare parts would lie below certain build chamber volumes? |
| Question 15 | Which production cost and production time would be the economic viability threshold for your company regarding this part? |
| Question 16 | Which production cost and production time would be suitable for your company regarding this part? |
Figure A1.
Mann-Whitney U-test: The influence of the company size and the effect of 3D printing usage within supply chains. A p-value of less than 0.05 indicates significance (highlighted values).
References
- ISO/TC 261. ISO/ASTM 52900:2015(en) Additive Manufacturing–General Principles–Terminology; ISO/ASME International: Geneva, Switzerland, 2015. [Google Scholar]
- Gibson, I.; Rosen, D.; Stucker, B. Additive Manufacturing Technologies, 1st ed.; Springer Science + Business: New York, NY, USA, 2008; pp. 17–38. [Google Scholar]
- Atzeni, E.; Salmi, A. Economics of Additive Manufacturing for End-Usable Metal Parts. Int. J. Adv. Manuf. Technol. 2012, 62, 1147–1155. [Google Scholar] [CrossRef]
- Weller, C.; Kleer, R.; Piller, F.T. Economic Implications of 3D Printing: Market Structure Models in Light of Additive Manufacturing Revisited. Int. J. Prod. Econ. 2015, 164, 43–56. [Google Scholar] [CrossRef]
- Holmström, J.; Partanen, J. Digital Manufacturing-Driven Transformations of Service Supply Chains for Complex Products. Supply Chain Manag. Int. J. 2014, 19, 421–430. [Google Scholar] [CrossRef]
- Gausemeier, J.; Echterhoff, N.; Kokoschka, M.; Wall, M. Thinking Ahead the Future of Additive Manufacturing—Future Applications; Heinz Nixdorf Institute, University of Paderborn: Paderborn, Germany, 2012. [Google Scholar]
- Joshi, S.C.; Sheikh, A.A. 3D Printing in Aerospace and Its Long-Term Sustainability. Virtual Phys. Prototyp. 2015, 10, 175–185. [Google Scholar] [CrossRef]
- Hitzler, L.; Hirsch, J.; Merkel, M.; Hall, W.; Öchsner, A. Position Dependent Surface Quality in Selective Laser Melting: Positionsabhängige Oberflächenqualität Im Selektiven Laserstrahlschmelzen. Materwiss. Werksttech. 2017, 48, 327–334. [Google Scholar] [CrossRef]
- Lewandowski, J.J.; Seifi, M. Metal Additive Manufacturing: A Review of Mechanical Properties. Annu. Rev. Mater. Res. 2016, 46, 151–186. [Google Scholar] [CrossRef]
- Casoline Casalino, G.; Campanelli, S.L.; Contuzzi, N.; Ludovico, A.D. Experimental Investigation and Statistical Optimisation of the Selective Laser Melting Process of a Maraging Steel. Opt. Laser Technol. 2015, 65, 151–158. [Google Scholar] [CrossRef]
- Hitzler, L.; Hirsch, J.; Heine, B.; Merkel, M.; Hall, W.; Öchsner, A. On the Anisotropic Mechanical Properties of Selective Laser-Melted Stainless Steel. Materials 2017, 10, 1136. [Google Scholar] [CrossRef] [PubMed]
- Campbell, I.; Bourell, D.; Gibson, I. Additive Manufacturing: Rapid Prototyping Comes of Age. Rapid Prototyp. J. 2012, 18, 255–258. [Google Scholar] [CrossRef]
- Chekurov, S.; Salmi, M. Additive Manufacturing in Offsite Repair of Consumer Electronics. Phys. Procedia 2017, 89, 23–30. [Google Scholar] [CrossRef]
- Holmström, J.; Partanen, J.; Tuomi, J.; Walter, M. Rapid Manufacturing in the Spare Parts Supply Chain. J. Manuf. Technol. Manag. 2010, 21, 687–697. [Google Scholar] [CrossRef]
- Sasson, A.; Johnson, J.C. The 3D Printing Order: Variability, Supercenters and Supply Chain Reconfigurations. Int. J. Phys. Distrib. Logist. Manag. 2016, 46, 82–94. [Google Scholar] [CrossRef]
- Roda, I.; Macchi, M.; Fumagalli, L.; Viveros, P. A Review of Multi-Criteria Classification of Spare Parts. J. Manuf. Technol. Manag. 2014, 25, 528–549. [Google Scholar] [CrossRef]
- Li, Y.; Jia, G.; Cheng, Y.; Hu, Y. Additive Manufacturing Technology in Spare Parts Supply Chain: A Comparative Study. Int. J. Prod. Res. 2017, 55, 1498–1515. [Google Scholar] [CrossRef]
- Durão, L.F.C.S.; Christ, A.; Anderl, R.; Schützer, K.; Zancul, E. Distributed Manufacturing of Spare Parts Based on Additive Manufacturing: Use Cases and Technical Aspects. Procedia CIRP 2016, 57, 704–709. [Google Scholar] [CrossRef]
- Ballardini, R.M.; Flores Ituarte, I.; Pei, E. Printing Spare Parts through Additive Manufacturing: Legal and Digital Business Challenges. J. Manuf. Technol. Manag. 2018, 29. [Google Scholar]
- Berman, B. 3-D Printing: The New Industrial Revolution. Bus. Horiz. 2012, 55, 155–162. [Google Scholar] [CrossRef]
- Brecher, C. Advances in Production Technology, Vol. 30; Springer: Cham, Germany, 2015; ISBN 978-3-319-12303-5. [Google Scholar]
- Huang, S.H.; Liu, P.; Mokasdar, A.; Hou, L. Additive Manufacturing and Its Societal Impact: A Literature Review. Int. J. Adv. Manuf. Technol. 2013, 67, 1191–1203. [Google Scholar] [CrossRef]
- Khajavi, S.H.; Partanen, J.; Holmström, J. Additive Manufacturing in the Spare Parts Supply Chain. Comput. Ind. 2014, 65, 50–63. [Google Scholar] [CrossRef]
- Flores Ituarte, I.; Partanen, J.; Khajavi, S.H. Challenges to Implementing Additive Manufacturing in Globalised Production Environments. Int. J. Collab. Enterp. 2016, 5, 232–247. [Google Scholar] [CrossRef]
- Byun, H.S.; Lee, K.H. A Decision Support System for the Selection of a Rapid Prototyping Process Using the Modified TOPSIS Method. Int. J. Adv. Manuf. Technol. 2005, 26, 1338–1347. [Google Scholar] [CrossRef]
- Chiadamrong, N.; O’Brien, C. Decision Support Tool for Justifying Alternative Manufacturing and Production Control Systems. Int. J. Prod. Econ. 1999, 60, 177–186. [Google Scholar] [CrossRef]
- Frazier, W.E. Metal Additive Manufacturing: A Review. J. Mater. Eng. Perform. 2014, 23, 1917–1928. [Google Scholar] [CrossRef]
- Manfredi, D.; Calignano, F.; Krishnan, M.; Canali, R.; Ambrosio, E.P.; Atzeni, E. From Powders to Dense Metal Parts: Characterization of a Commercial Alsimg Alloy Processed through Direct Metal Laser Sintering. Materials 2013, 6, 856–869. [Google Scholar] [CrossRef] [PubMed]
- Schmidt, M.; Pohle, D.; Rechtenwald, T. Selective Laser Sintering of PEEK. CIRP Ann. Manuf. Technol. 2007, 56, 205–208. [Google Scholar] [CrossRef]
- Gaytan, S.M.; Cadena, M.A.; Karim, H.; Delfin, D.; Lin, Y.; Espalin, D.; MacDonald, E.; Wicker, R.B. Fabrication of Barium Titanate by Binder Jetting Additive Manufacturing Technology. Ceram. Int. 2015, 41, 6610–6619. [Google Scholar] [CrossRef]
- Zein, I.; Hutmacher, D.W.; Tan, K.C.; Teoh, S.H. Fused Deposition Modeling of Novel Scaffold Architectures for Tissue Engineering Applications. Biomaterials 2002, 23, 1169–1185. [Google Scholar] [CrossRef]
- Siemens Additive Manufacturing: Spare Parts for Gas Turbines. Available online: https://www.siemens.com/innovation/en/home/pictures-of-the-future/industry-and-automation/additive-manufacturing-3d-spare-parts-gas-turbines.html (accessed on 8 November 2017).
- Mercedes-Benz: Metal 3D Printed Spare Party Quality Assured. Available online: http://media.daimler.com/marsMediaSite/en/instance/ko/Premiere-at-Mercedes-Benz-Trucks-New-from-the-3D-printer-the-first-spare-part-for-trucks-made-of-metal.xhtml?oid=23666435 (accessed on 8 November 2017).
- Lambert, D.M.; Cooper, M.C.; Pagh, J.D. Supply Chain Management: Implementation Issues and Research Opportunities. Int. J. Logist. Manag. 1998, 9, 1–20. [Google Scholar] [CrossRef]
- Schniederjans, D.G. Adoption of 3D-Printing Technologies in Manufacturing: A Survey Analysis. Int. J. Prod. Econ. 2017, 183, 287–298. [Google Scholar] [CrossRef]
- Schelly, C.; Anzalone, G.; Wijnen, B.; Pearce, J.M. Open-Source 3-D Printing Technologies for Education: Bringing Additive Manufacturing to the Classroom. J. Vis. Lang. Comput. 2015, 28, 226–237. [Google Scholar] [CrossRef]
- Flynn, B. Empirical Research Methods in Operations Management. J. Oper. Manag. 1990, 9, 250–284. [Google Scholar] [CrossRef]
- Likert, R. A Technique for the Measurement of Attitudes. Arch. Psychol. 1932, 140, 54–55. [Google Scholar]
- Shapiro, S.S.; Wilk, M.B. An Analysis of Variance Test for Normality (Complete Samples). Biometrika Trust. 1965, 52, 591–611. [Google Scholar] [CrossRef]
- Mann, H.B.; Wald, A. On the Choice of the Number of Class Intervals in the Application of the Chi Square Test. Ann. Math. Statist. 1942, 13, 306–317. [Google Scholar] [CrossRef]
- 3D Hubs: 3D Printing Material Data Base. Available online: https://www.3dhubs.com/material-index (accessed on 5 September 2018).
- SLM Solutions: Metal Powders for 3D Printing. Available online: https://slm-solutions.com/sites/default/files/downloads/200en180509-01-powder_web2_0.pdf (accessed on 5 September 2018).
- Concept Laser: Additive Manufacturing Powder Materials. Available online: https://www.concept-laser.de/produkte/werkstoffe.html (accessed on 5 September 2018).
- BASF: 3D Printing of PA6. Available online: https://www.basf.com/tw/en/company/news-and-media/news-releases/asia-pacific/2018/02/BASF_Farsoon_3D_Printing.html (accessed on 5 September 2018).
- EOS: Material Data Sheet SS316L. Available online: https://cdn1.scrvt.com/eos/77d285f20ed6ae89/dd6850c010d3/EOSStainlessSteel316L.pdf (accessed on 6 September 2018).
- Šafka, J.; Ackermann, M.; Voleský, L. Structural Properties of H13 Tool Steel Parts Produced with Use of Selective Laser Melting Technology. J. Phys. Conf. Ser. 2016, 709. [Google Scholar]
- EOS: Material Data Sheet In718. Available online: http://ip-saas-eos-cms.s3.amazonaws.com/public/4528b4a1bf688496/ff974161c2057e6df56db5b67f0f5595/EOS_NickelAlloy_IN718_en.pdf (accessed on 6 September 2018).
- Neff, C.; Trapuzzano, M.; Crane, N.B. Impact of Vapor Polishing on Surface Roughness and Mechanical Properties for 3D Printed ABS. Solid Free. Fabr. 2016, 2295–2304. [Google Scholar]
- Alsoufi, M.S.; Elsayed, A.E. How Surface Roughness Performance of Printed Parts Manufactured by Desktop FDM 3D Printer with PLA+ Is Influenced by Measuring Direction. Am. J. Mech. Eng. 2017, 5, 211–222. [Google Scholar]
- Delfs, P.; Schmid, H. Areal Surface Characterization of Laser Sintered Parts for Various Process Parameters. Solid Free. Fabr. Symp. 2017, 2624–2631. [Google Scholar]
- Li, H.; Taylor, G.; Bheemreddy, V.; Iyibilgin, O.; Leu, M.; Chandrashekhara, K. Modeling and Characterization of Fused Deposition Modeling Tooling for Vacuum Assisted Resin Transfer Molding Process. Addit. Manuf. 2015, 7, 64–72. [Google Scholar] [CrossRef]
- Firpa (Finish Rapid Prototyping Association): AM Machines in Finland. Available online: http://firpa.fi/AM_lista_viimeisin.pdf (accessed on 2 March 2018).
© 2018 by the authors. Licensee MDPI, Basel, Switzerland. This article is an open access article distributed under the terms and conditions of the Creative Commons Attribution (CC BY) license (http://creativecommons.org/licenses/by/4.0/).